1. Introduction
Since the reform and opening up, China has achieved nearly forty years of rapid development with a crude economic growth model of high input, high consumption, and high pollution. Energy has played a crucial role in economic development and is seen as an important driver of economic growth. However, this high dependence on energy has also brought negative impacts on sustainable economic development and the ecological environment. As the world’s second largest economy and the world’s largest carbon emitter, China has been taking control of its total energy consumption and reducing its energy intensity as an important way to address climate change and ensure energy security. In particular, in 2020, China proposed a dual carbon target, i.e., to achieve the carbon peak by 2030 and carbon neutrality by 2060.
Energy consumption in the production process is the main source of carbon emissions. Energy intensity, i.e., total energy consumption divided by the real GDP of a certain region, is one of the indicators to measure the overall efficiency of energy use in a country or region. It reflects the cost of resources paid by the country or region in the process of economic development [
1]. Energy productivity, which is defined as the ratio of output (GDP) divided by energy consumption, is a useful indicator for understanding the energy efficiency of an industry or an economy. It also indicates the energy technology progress. China’s energy intensity has maintained a fluctuating downward trend. According to the data from the China Energy Statistics Yearbook, China’s energy intensity declined from 13.14 tons of standard coal per CNY 10,000 in 1980 to 3.18 tons of standard coal per CNY 10,000 in 2018. Energy intensity is heterogeneous across industries, with the energy intensity of China’s secondary industry being about twice that of the tertiary industry. In this context, it is crucial to study the factors that influence energy intensity, and to quantitatively analyze the relative importance of different factors and their differences among various provinces in China.
A number of papers have studied the demand-side factors of energy intensity decline and based on this, proposed policy recommendations to reduce energy consumption. Meramveliotakis, G. (2023) [
2] paid attention to outdoor lighting and suggested that street light conservation should be regarded as a way to cut energy consumption. Bertoldi, P. (2022) [
3] shed light on changes in energy user behavior and lifestyle to obtain additional energy savings. This paper mainly focuses on the supply side. On the supply side, the progress of energy technology and the change in industrial structure are two important factors that promote the decline in energy intensity. Most of the existing literature emphasizes the effect of technological progress. The service sector is more energy productive than agriculture and industry, which means that a structural transition to services can reduce the energy intensity of the overall economy.
In addition, one of the biggest challenges in achieving the goal of “energy saving and carbon reduction” is the regional heterogeneity of energy consumption patterns. There is no doubt that different regions of China have different energy endowments, consumption structures, and economic development needs, while targeted strategies for reducing energy consumption and energy intensity need to be developed for each region. A one-size-fits-all energy policy will not serve China’s “Carbon Peak and Carbon Neutrality” goal well. Therefore, it is a key issue to reveal the patterns of energy intensity reduction in different regions and then propose targeted energy intensity reduction strategies.
Based on the above phenomenon, the following research questions are raised: What is the impact of sector energy productivity growth on the total energy intensity of the economy in different provinces in China, and what is the contribution of the energy technology effect and structural effect? Is there any difference in the impact of technological progress in different industries on energy intensity?
In this paper, a multi-regional and multi-sector CGE (computable general equilibrium) model and numerical simulation are used to decompose the energy intensities of 30 provincial-level regions in China from 2000 to 2019. The model has the following characteristics: the labor and energy elements in the production function are completely complementary; it is able to sum up the consumption demand of different provinces; it can simultaneously depict the transformation of the industrial structure and energy intensity.
The results show that the contribution of technological progress to the decline in energy intensity presents regional heterogeneity: the contribution of technological progress is the highest in the central region, followed by the western region, and the lowest in the eastern region. Advances in industrial and agricultural energy technology promote the transition of energy consumption to the service sector, thereby reducing energy intensity. Energy technology advances in the service sector promote the transition of energy consumption to industry and agriculture, thereby improving energy intensity.
The main contributions of this paper are embodied in the following two aspects. In terms of theory, this study expands the models of energy macroeconomics and industrial structural transformation. Additionally, it incorporates energy elements into traditional structural transformation models, enriching the application of structural transformation in energy consumption and energy productivity. A relationship between the energy intensity effect and structure effect is found, and it is pointed out that sectoral energy technology progress will affect the intersectoral allocation of energy consumption and thus the total energy intensity by affecting the industrial structure. In the empirical aspect, this study discusses the contribution of energy technology progress and industrial structure transformation to provincial energy intensity from the heterogeneity of regional energy consumption and industrial structure. It makes up for the defect that the existing research takes the whole country as the basic unit for analysis.
This paper proceeds as follows.
Section 2 reviews the literature,
Section 3 presents the basic facts of structural change and energy consumption,
Section 4 describes the model,
Section 5 discusses the numerical results, and
Section 6 presents the conclusion and policy implications.
2. Literature Review
This study is relevant to the literature discussing changes in energy intensity in China. The existing literature has studied the above questions from the following aspects: (1) analysis of the leading reasons for the decline in China’s energy intensity [
4,
5,
6,
7,
8,
9,
10]; (2) forecasting of China’s energy intensity [
11,
12]; (3) the impact of environmental regulations on China’s energy intensity [
13,
14]. This paper supplements the existing research by quantitatively studying the differences in the leading factors of the energy intensity decline in different regions and the relationships among different influencing mechanisms.
In the existing literature, most of the papers concerning the “causes of energy intensity decline” adopt the method of “empirical modeling”. Index or production decomposition methods, such as LMDI, PDA, and IDA, and econometric regression methods are used to decompose energy intensity into the sectoral intensity effect and sectoral transfer effect [
5,
7,
9,
15]. The sectoral intensity effect, also known as the technology effect, measures the overall change in energy intensity due to changes in energy intensity across sectors. Technological progress can affect the sectoral energy intensity by improving factor utilization efficiency. Sectoral shift effects measure changes in energy intensity caused by changes in the composition of economic sectors, also known as structural effects. If there is a clear difference in energy intensity between the sectors that are expanding and those that are being replaced, then the overall energy intensity will change even if the energy intensity of each sector remains the same [
15].
Most studies believe that the decline in energy intensity in China is dominated by technological effects [
4,
6,
8,
10,
16,
17]. Existing studies have not reached a consensus on the contribution of structural effects. Some studies have pointed out that structural effects make a negative contribution to energy intensity but hinder the decline in energy intensity [
1,
16]. Some studies also believe that structural effects can promote the decline in energy intensity, but the effect is very weak [
8,
17,
18]. Few studies have looked at the links between different effects and the differences in the impact of technological advances on energy intensity across industries.
In this paper, we extend the model proposed in the existing literature to provide a theoretical explanation for the decline in energy intensity with a microcosmic basis. In this study, a multi-sectoral general equilibrium model is constructed to expand the existing model from the perspective of the differences in the impact of energy technology progress on energy intensity in different industries. This study is based on the literature on energy macroeconomics and structural transformation [
19,
20,
21,
22,
23,
24,
25,
26,
27,
28]. Most of the current energy macroeconomic theories are based on neoclassical single-sector modeling [
29,
30]. The production function with energy elements is inherited from Hassler (2016) [
29], and the demand function is inherited from Frisch (1959) [
31] and Guo (2020) [
32]. The demand function can sum regions. The partial structure of the model is similar to that found in the structural transformation literature [
20,
21,
22]. In this paper, numerical methods are used to analyze different counterfactuals. This method is related to Guo (2020) [
32] and Marcos (2018) [
30]. That is, by exploring how the path of energy consumption changes in the model under the counterfactual case of fixed technological progress factors, the contribution of technological progress to the change in energy intensity is separated. The previous literature failed to explain the factors affecting energy intensity by constructing a CGE model and using numerical simulation methods.
The innovation of this study is mainly reflected in the following three aspects. First, this paper finds a link between intensity and structural effects, pointing out that sectoral energy technology advances affect the allocation of energy consumption among sectors and can influence the additive total energy intensity by affecting the industrial structure. Second, the factors of production in the literature related to the dynamics of structural transformation mainly include capital and labor. This study finds that there is also a transition from industry and agriculture to services in terms of energy consumption. The inclusion of energy factors in the traditional structural transformation model enriches the application of structural transformation to energy consumption and energy productivity. Third, this study explores the magnitude of the contribution of energy technological progress and industrial structural transformation to energy intensity at the provincial level from the heterogeneity of regional energy consumption and industrial structure.
3. The Stylized Facts of Energy Intensity and Structural Transformation
3.1. Energy Intensity by Region in China
Eastern China includes 10 provinces, autonomous regions, and municipalities directly under the central government, namely Beijing, Tianjin, Hebei, Shanghai, Jiangsu, Zhejiang, Fujian, Shandong, Guangdong, and Hainan. Central China includes 10 provinces and autonomous regions, namely Shanxi, Inner Mongolia, Jilin, Heilongjiang, Liaoning, Anhui, Jiangxi, Henan, Hubei, and Hunan. The western region of China includes 10 provinces, autonomous regions, and municipalities, namely Sichuan, Chongqing, Guizhou, Yunnan, Guangxi, Shaanxi, Gansu, Ningxia, Qinghai, and Xinjiang. The study area can be seen in the map in the
Appendix A.
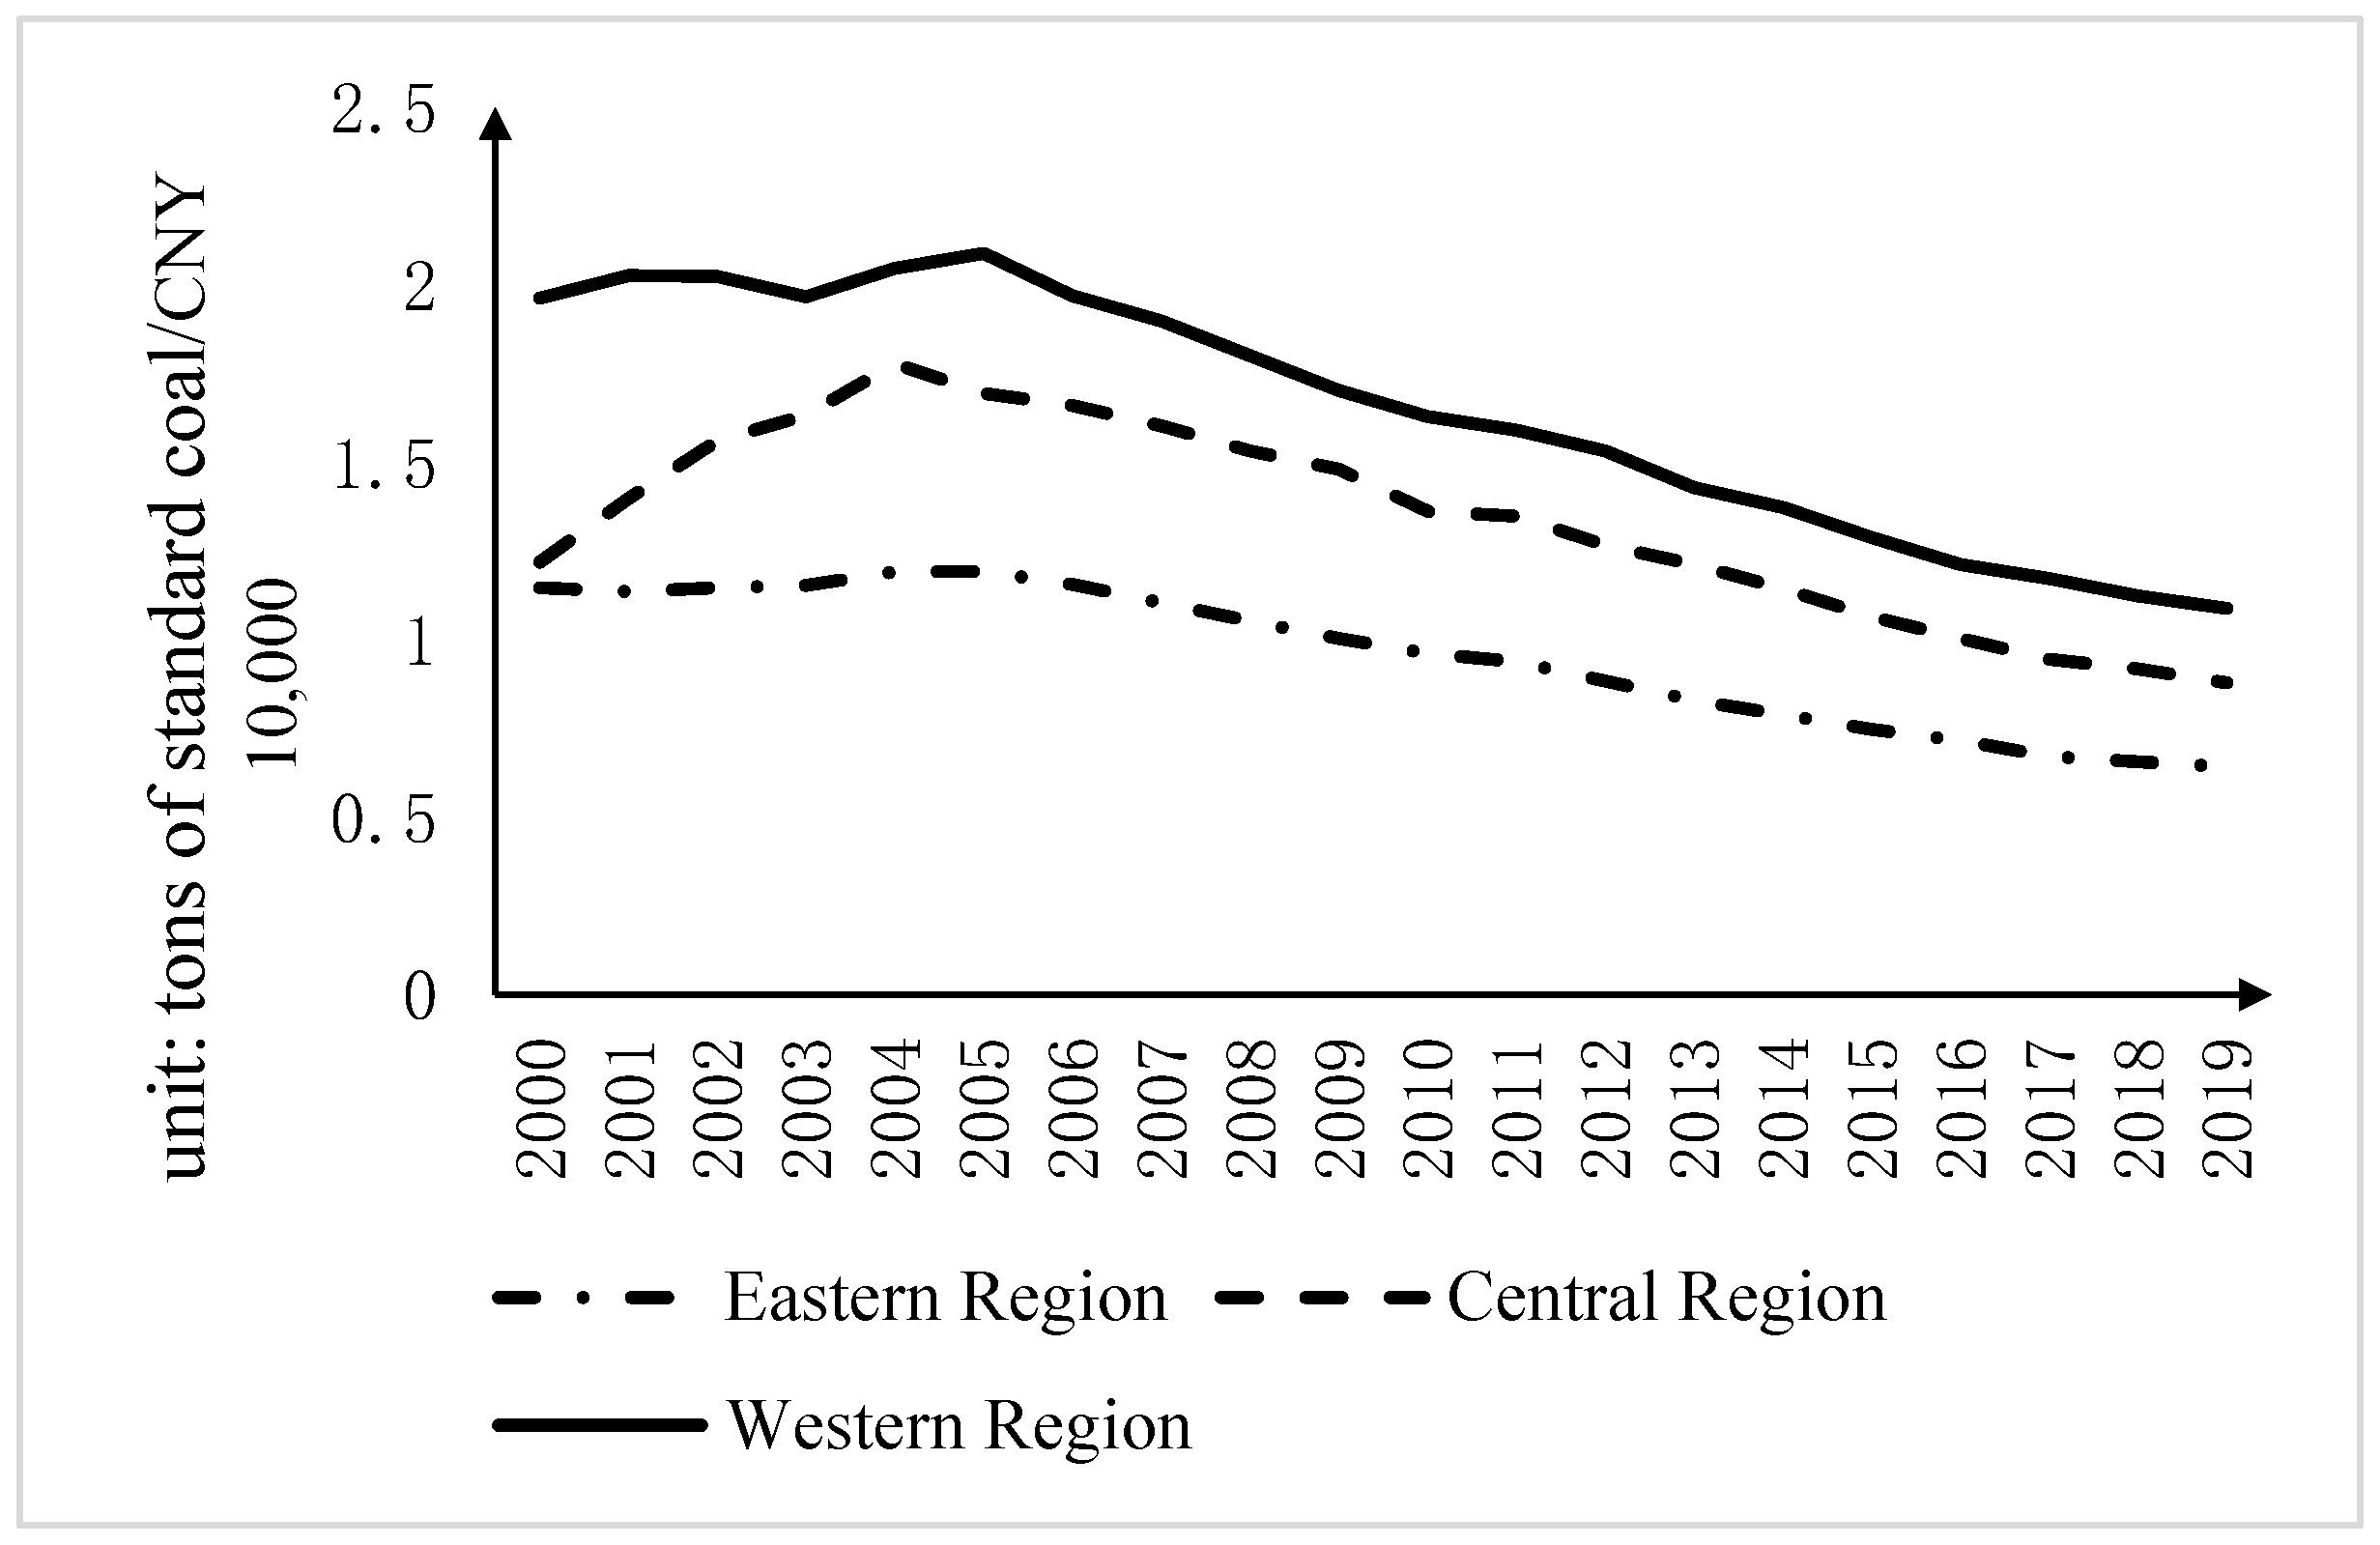
Figure 1 demonstrates that the energy intensity of all regions in China shows an overall decreasing trend, while the central region showed an increasing trend from 2000 to 2004. The energy intensity of the western region was higher than that of the central region and eastern region. In China, there were energy shortages in 2004, and many provinces experienced an energy crisis characterized by electricity, coal, and oil shortages. Afterwards, faced with the above energy dilemma, the regions concerned became more economical in industrial electricity consumption.
3.2. Energy Consumption Structure and Industrial Structure by Region in China
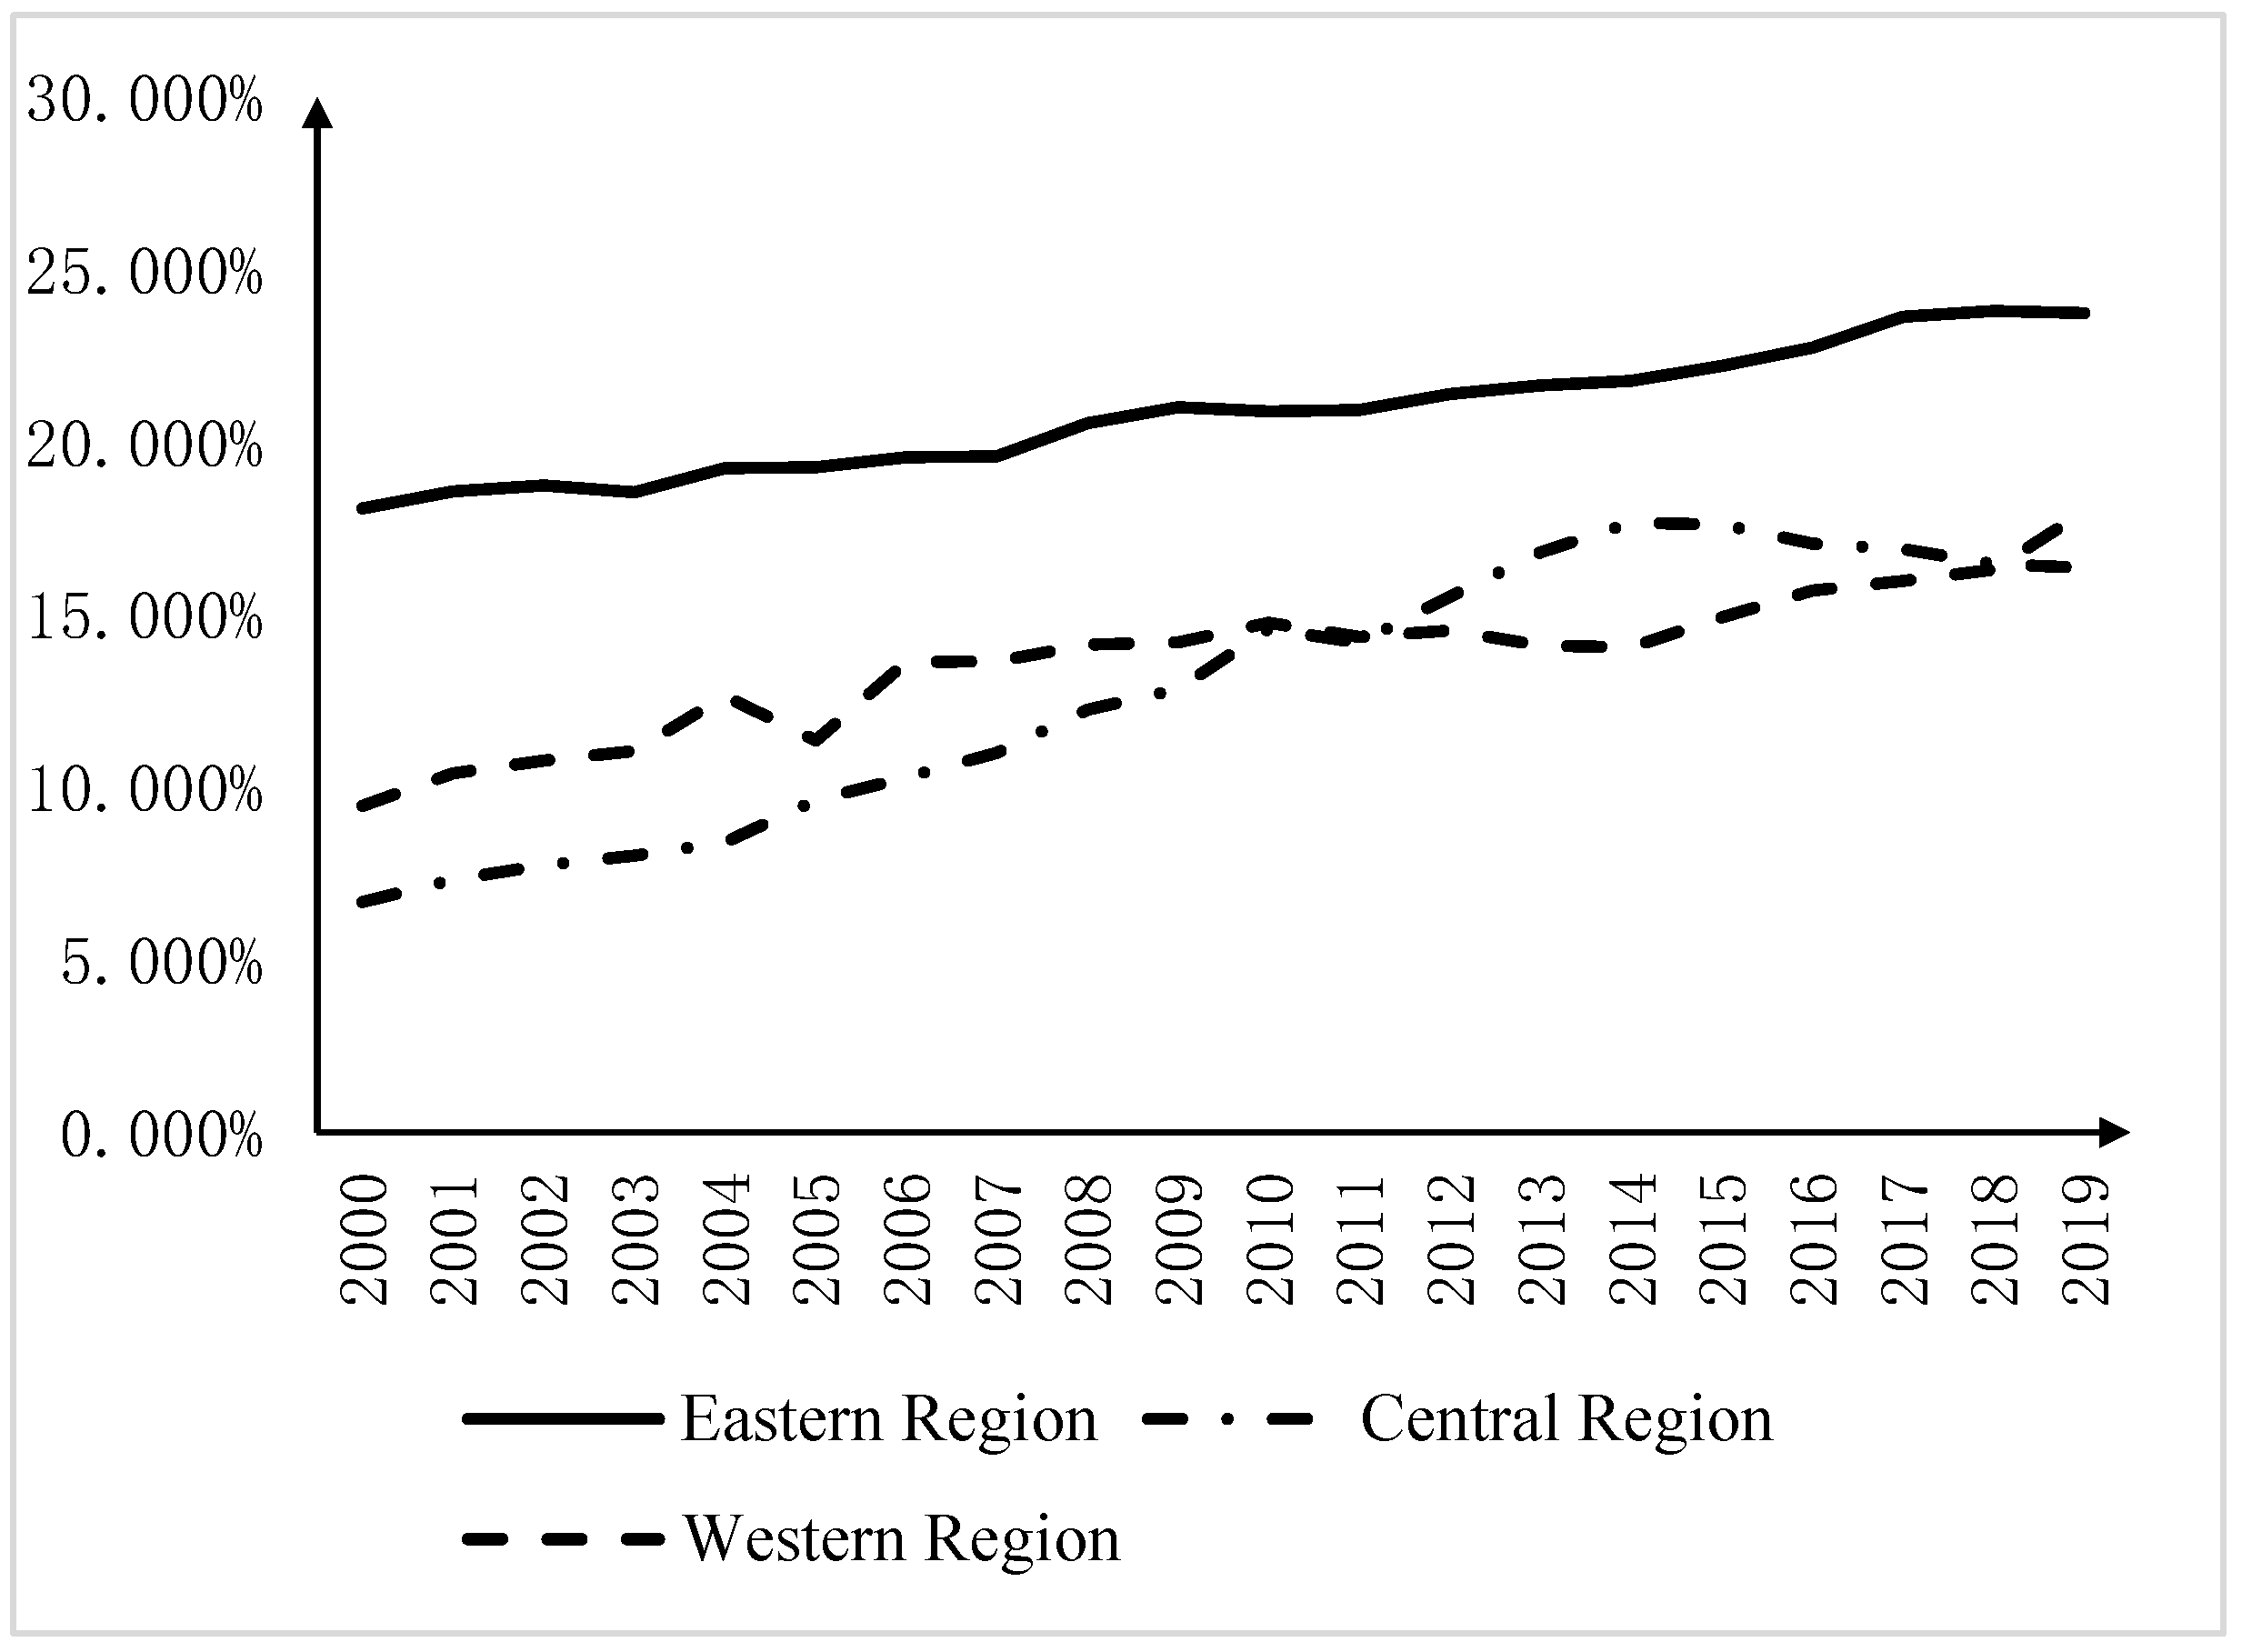
All three regions of China showed a trend of energy consumption transition to the service sector, and the eastern region had the highest share of energy consumption in the service sector (
Figure 2). The eastern and western regions showed an upward trend in real value added, and the central region showed a small downward trend until 2011, after which it rose rapidly (
Figure 3). By 2019, the share of real value added in services exceeded 50% in all three regions. The eastern region had the highest increase in the real value-added share.
3.3. Energy Productivity by Industry in China and Regions
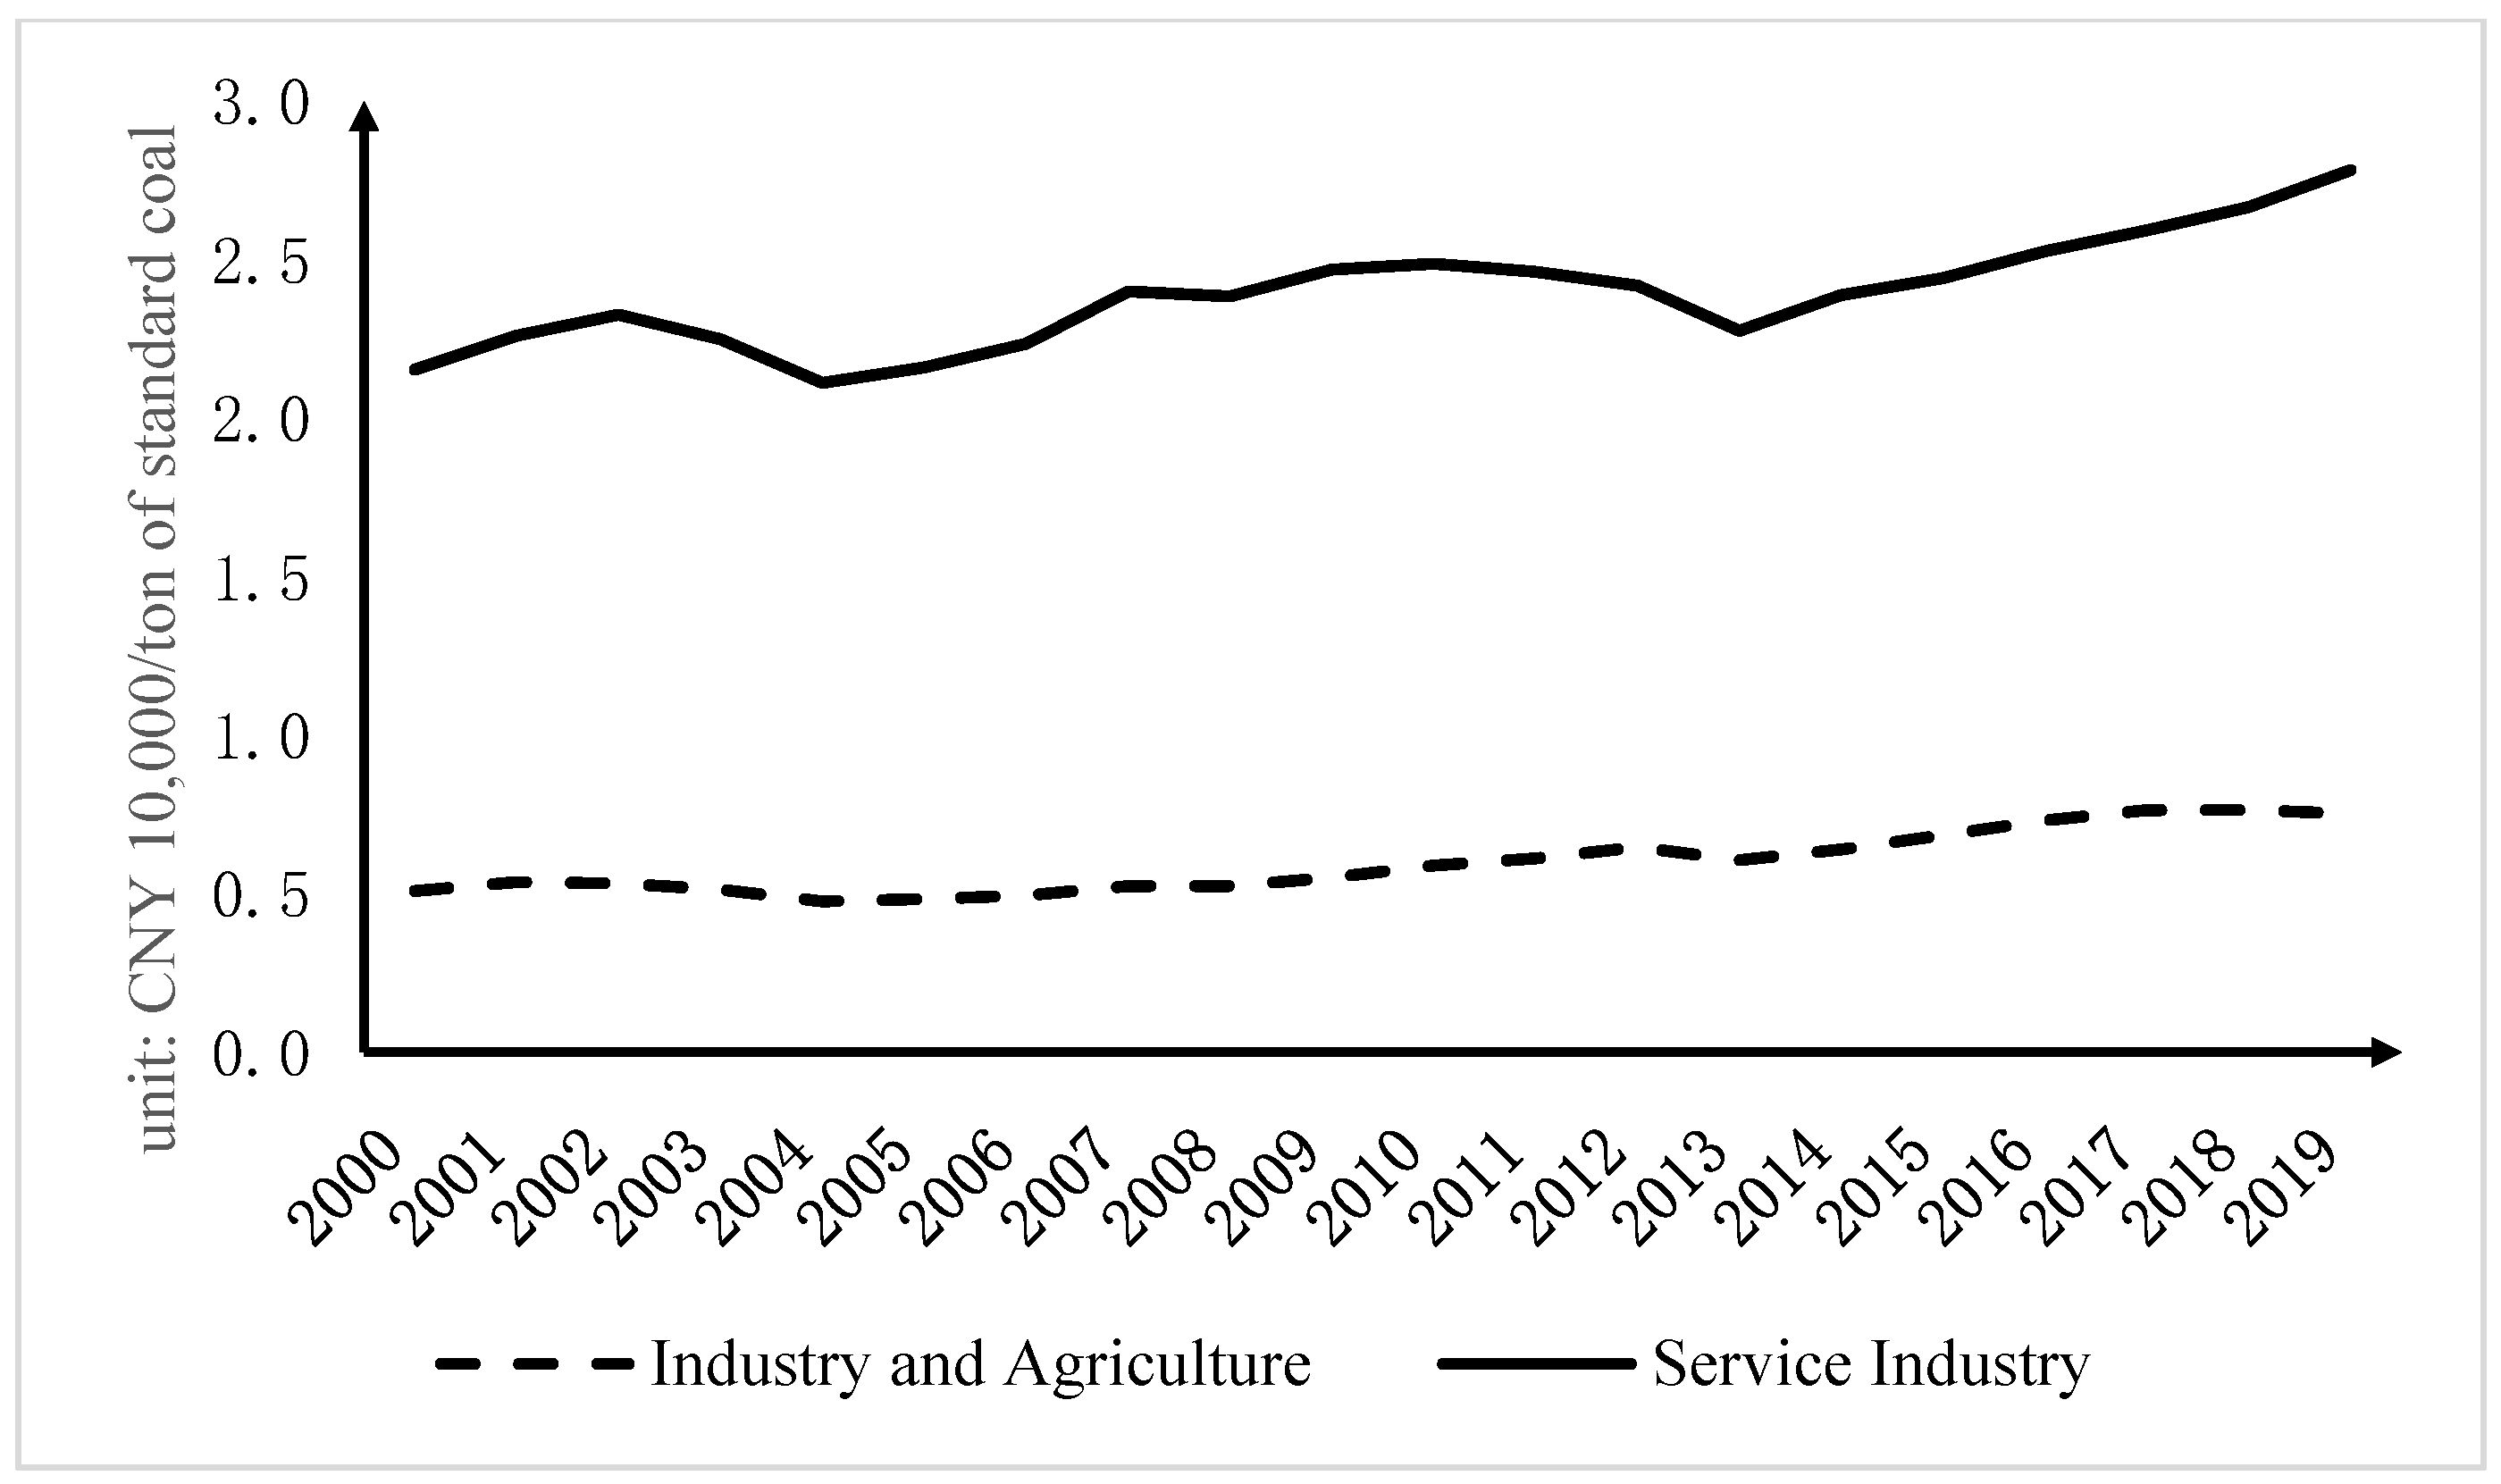
Energy productivity is defined as the ratio of real value added to energy consumption. As can be seen from the data, the energy productivity of the service sector was higher than that of industry and agriculture in all regions of the country (
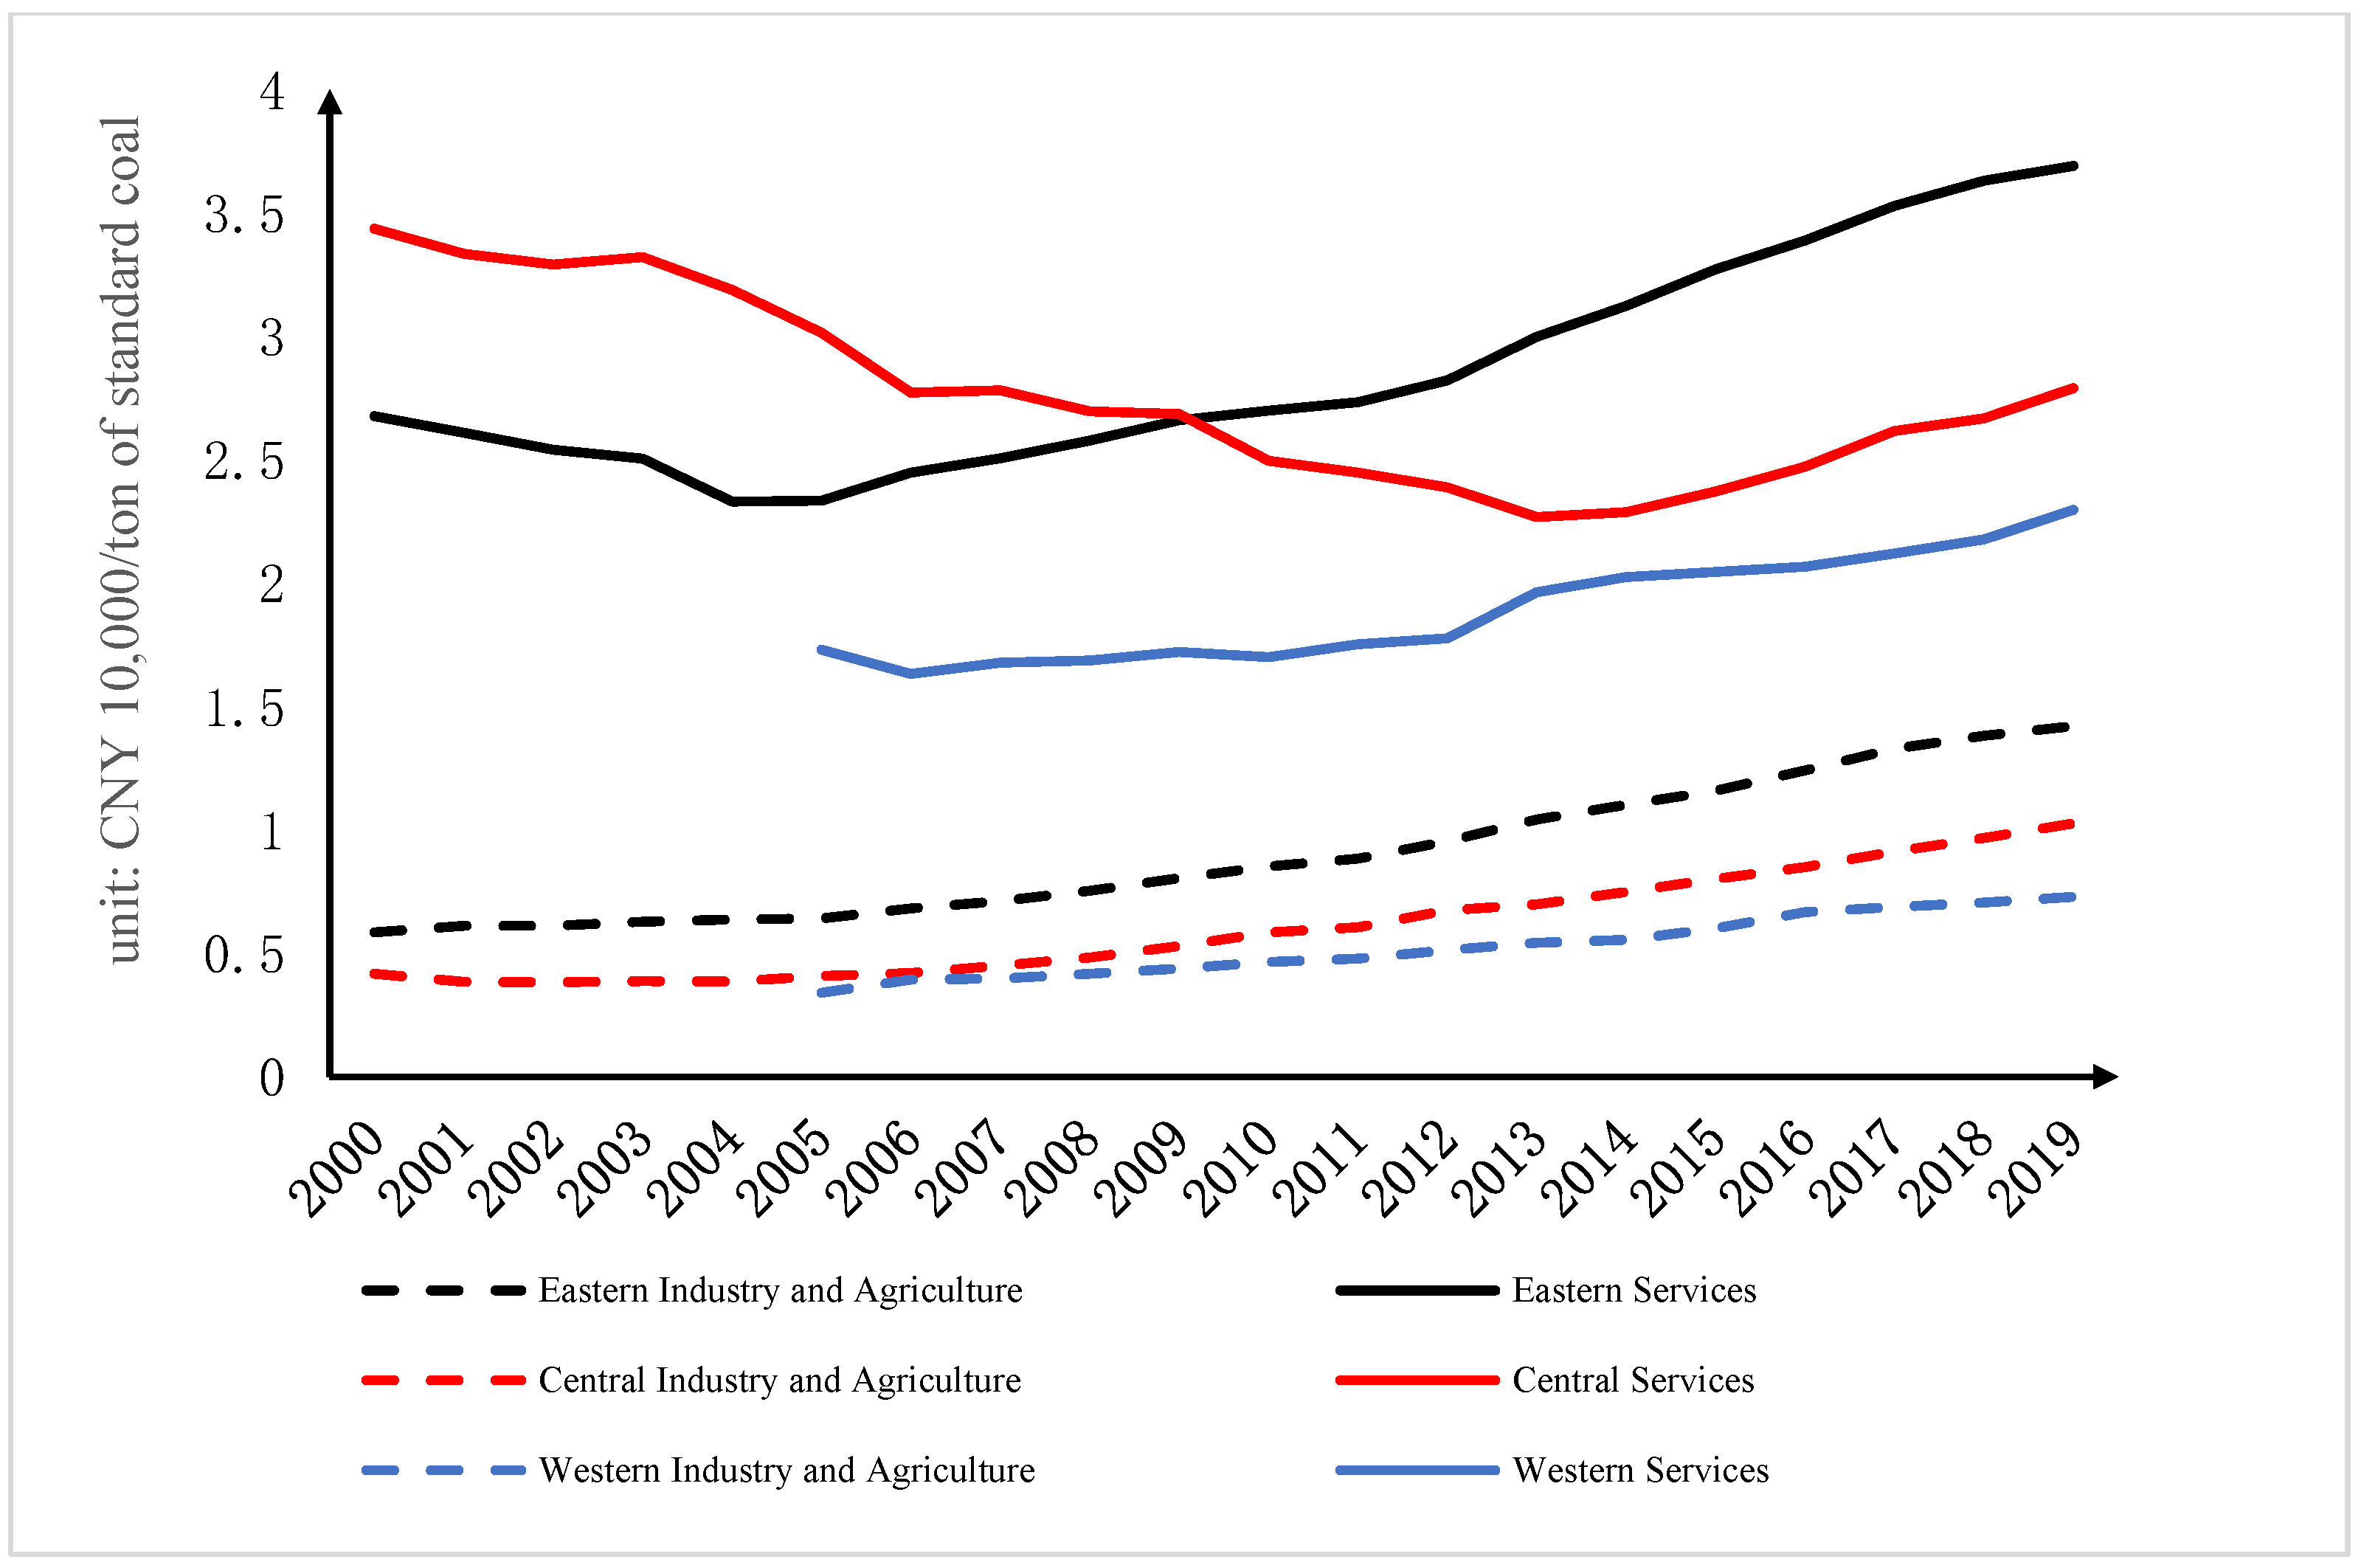
Figure 4). Except for the central region, where energy productivity in the service sector showed a decreasing trend until 2013, energy productivity in all other regions increased. Both industries in the east had higher energy productivity levels than the other regions (
Figure 5).
4. Model
4.1. Model Construction and Theoretical Analysis
Generalized additive preferences are introduced on the demand side to model the demand of different industries in different provincial regions.
denotes
J regions, and
denotes industry, agriculture, and services. This preference was first proposed by Frisch [
31] and applied by Guo [
32] to study problems related to regional structural transformation in China. The effectiveness function is given by the following:
where
, and
are constants, with
being independent of the region, and
being region-dependent;
and
denote the demand weights of different regions for two different products;
and
denote the consumption of two goods in different provinces for the goods sector (industry and agriculture) and service sector, respectively; and the sum of the two consumption types in each region constitutes the utility of the whole economy. The budget constraint satisfies the following conditions, where
denotes the prices of the products in different regions:
Solving the utility maximization problem, one is able to obtain the following first-order conditions:
The production side is divided into regions, each of which uses both labor and energy for production. Each provincial region on the production side is represented by a representative firm that uses energy and employs labor to produce both industrial, agricultural, and service goods. According to Hassler [
29], the elasticity of substitution of the two factors, i.e., energy and labor, tends to zero. This production function is applied by Marcos [
30] to study the structural transformation problem. The production function uses the Leontief form:
where
are labor productivity and energy productivity, and
are the number of laborers employed and the amount of energy used.
Below,
denotes the wage rate in both sectors, without considering labor market frictions between sectors.
is exogenous to the national energy price and is independent of both regional industries. The firm solves the profit maximization problem as follows
:
The labor market clearing condition is
; the energy market clearing condition is
; and the product market clearing condition is
. The firm’s profit maximization problem is solved to obtain the equilibrium price of the product:
. According to the product market clearing condition, we obtain
.
are defined. Let
denote the share of energy in the service sector and let
denote the share of labor in the service sector. How the energy intensity of the overall economy changes with the industrial structure is then calculated. By associating the production function, the utility maximization first-order condition, and the equation for the equilibrium price of the product, we obtain the following:
The economy plus the total energy productivity is defined as
:
The above equation shows that the energy productivity of the overall economy is determined by the energy productivity of the two industries
and the structure of energy consumption
simultaneously. The higher the energy productivity of the two industries and the higher the share of service energy consumption, the higher is the overall energy productivity. Because
, the first row of Equation (8) is positive, that is,
. The sign of the second row of Equation (8) cannot be decided.
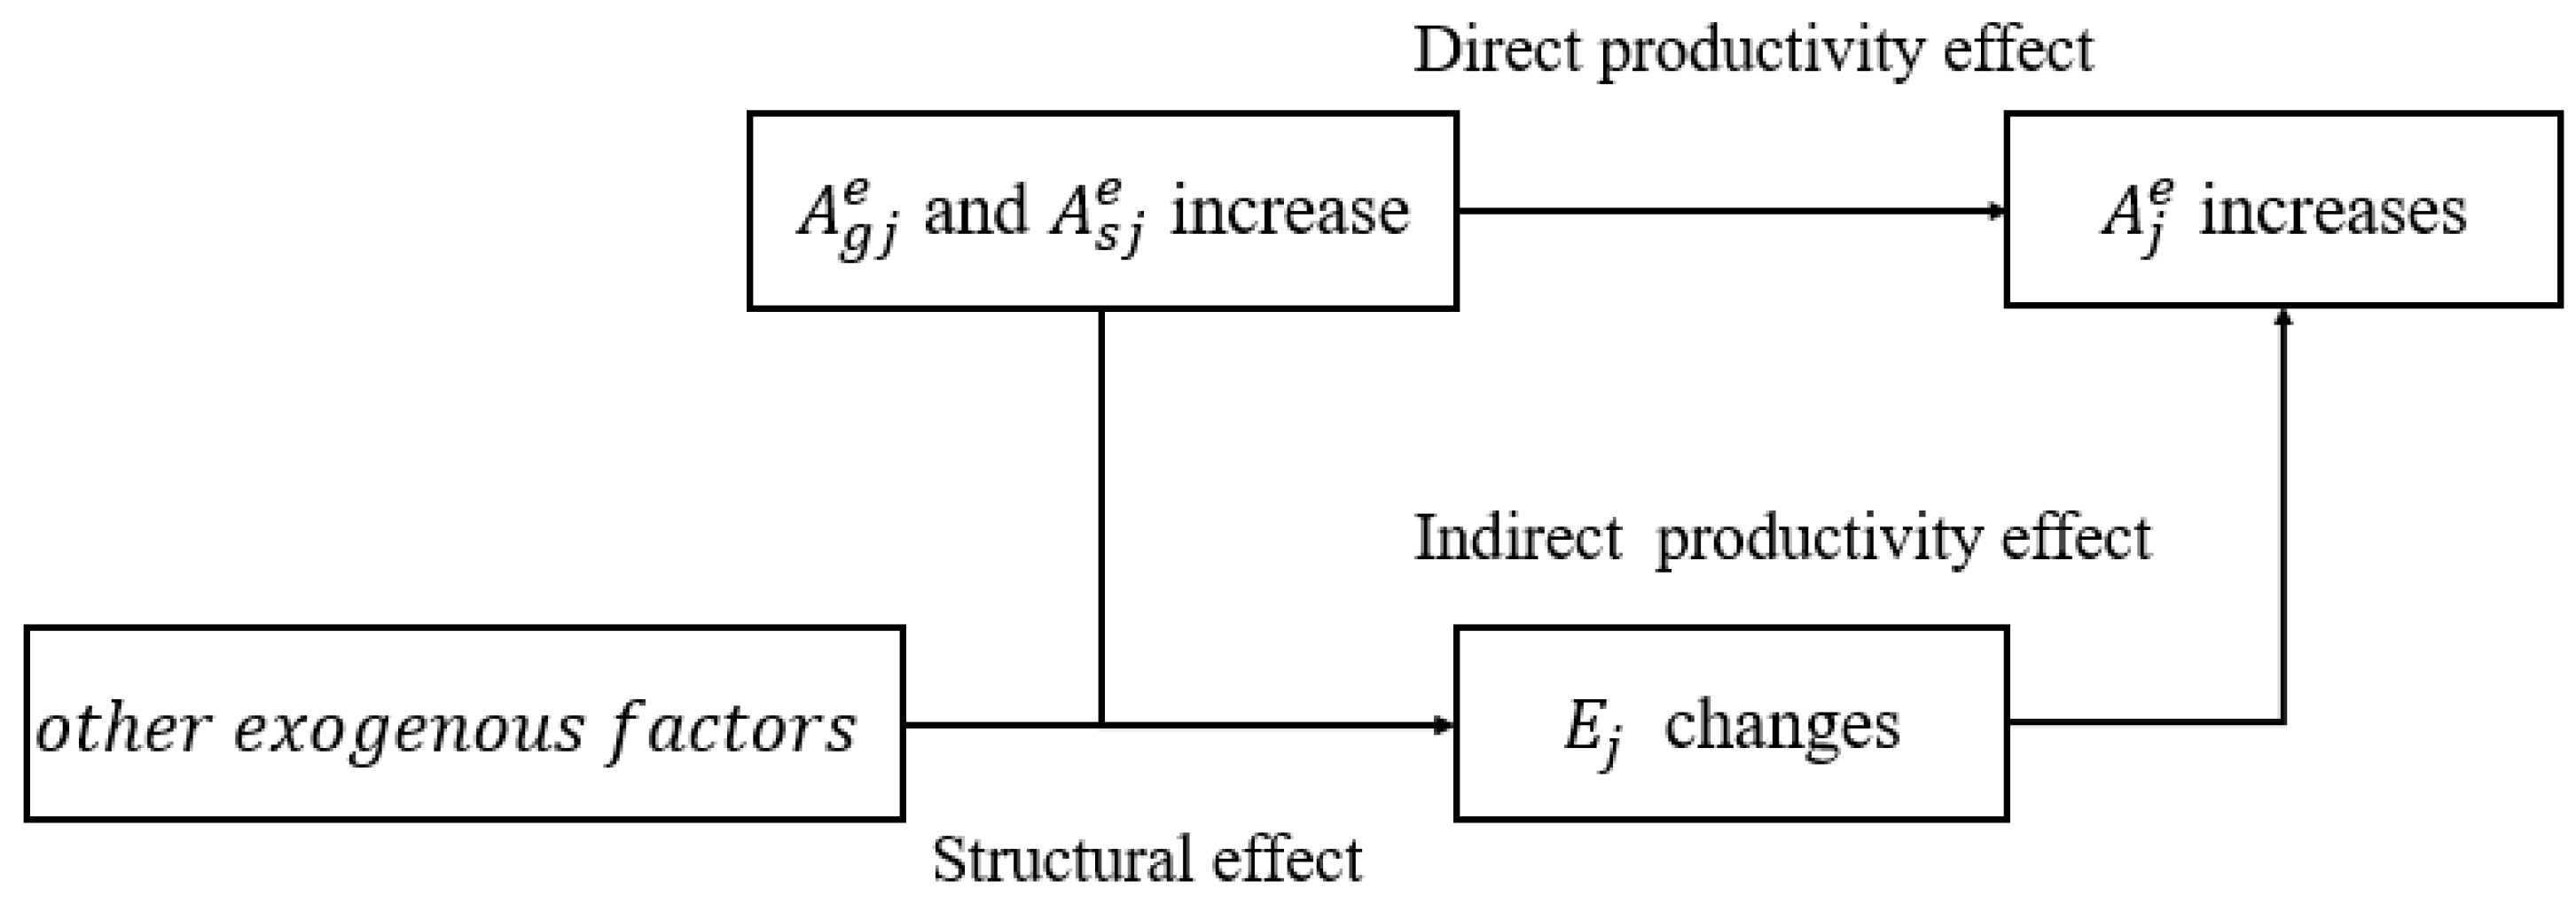
Figure 6 below shows the direct and indirect impact of sectoral energy productivity changes on total energy productivity.
According to Equation (8), a comparative static analysis can be performed:
- ①
Impact of sectoral energy productivity on the overall energy consumption structure.
On the supply side, when energy productivity in industry and agriculture rises, it reduces the energy use in industry and agriculture, and the share of energy consumption in industry and agriculture decreases. On the demand side, when the prices of products in industry and agriculture fall and demand rises, the share of energy consumption in industry and agriculture tends to rise. However, since the two sectors of goods are complementary (), the demand for energy consumption in the service sector also rises. At this point, the first effect dominates, and the total effect is a rise in the energy share of the service sector. This is consistent with . The analysis of energy productivity changes in the services sector is similar.
- ②
Impact of sectoral energy productivity on total energy productivity.
According to Equation (8) , it is shown that a rise in industrial and agricultural energy productivity leads to a rise in total energy productivity. This is because the rise in the energy productivity of industry and agriculture, on the one hand, increases the overall energy productivity through a direct effect. On the other hand, it increases the share of energy consumption in the service sector through an indirect effect. Because the energy productivity of the service sector is higher than that of industry and agriculture, it increases the overall energy productivity as a result. The sign of the equation cannot be determined. From the equation, the first term on the right side of the equation is positive, while the second term is negative. Theoretically, the increase in energy productivity in the service sector increases the overall energy productivity through a direct effect. On the other hand, it shifts the energy consumption structure to industry and agriculture, which causes the overall energy productivity to decrease through an indirect effect. The additive effect depends on which of the two effects dominates.
4.2. Parameter Calibration
The data used in this paper are obtained from the China Statistical Yearbook, the China Energy Statistical Yearbook, and provincial and municipal statistical yearbooks. The sample includes nominal value added, employment, energy consumption, and energy price data by industry for 30 provincial regions in China. The sample spans the period 2000–2020, but data for some years may be missing for some provinces. Due to the large amount of missing data for Tibet, it is excluded from the sample. Using the nominal value added and value-added index data, the real value added can be calculated. The real value added of the goods sector is the sum of primary and secondary industries. The real value added divided by employment can be used to calculate labor productivity in both sectors, and the real value added divided by energy consumption can be used to calculate energy productivity in both sectors. The parameters of the multi-region model are calibrated. Taking the logarithms on both sides of the first line of Equation (6), we obtain the following:
is set to
y,
is set to
,
is set to
, and the rightmost term is set to
, which is the regional characteristic variable. By definition, it is possible to ensure that
.
y can be regressed on
and
, and the fixed effects regression equation is as follows:
where
is the exogenous perturbation term,
is the estimated parameter,
, and
. Using provincial panel data on the share of energy consumption in services, relative labor productivity, total energy consumption, energy productivity, and relative prices,
, and
can be calculated—Data description: Since energy prices in different regions are seen as the same, national energy price data are used to represent all regional prices. Commodity price data for different regions do not vary much and have less impact on parameter estimation, and national data are also used as a proxy. The CEIC database provides energy and industry prices by province, using sub-regional energy prices (coal prices, gas prices, gasoline prices, and electricity prices). Using a panel regression model to estimate
and
, it is possible to calculate
and
.
is the fixed effect of each province. The models are estimated using fixed effects and random effects models, and the northeastern region is excluded for robustness testing. The estimated coefficients of
are significant at the 1% level and the parameters are relatively close under different estimation methods, so the regression results are robust. Based on the estimated results of the
x1 and
x2 coefficients in
Table 1, it is possible to calculate the parameters
The estimated results of both are greater than 1, indicating that the increase in energy productivity in the service industry will reduce the share of energy consumption in the service industry, and the increase in energy productivity in industry and agriculture will increase the share of energy consumption in the service industry. The parameters selected for the baseline model and simulations below use the values calculated for the fixed effects case for all provincial areas, i.e.,
= 1.738 and
= 1.378. Finally, the characteristic variables
for each province can be calculated. The multicollinearity check is conducted in
Table 1 to avoid possible imperfect multicollinearity. The test results showed that the VIF values of the regression equations did not exceed 10, indicating that there was no significant imperfect multicollinearity.
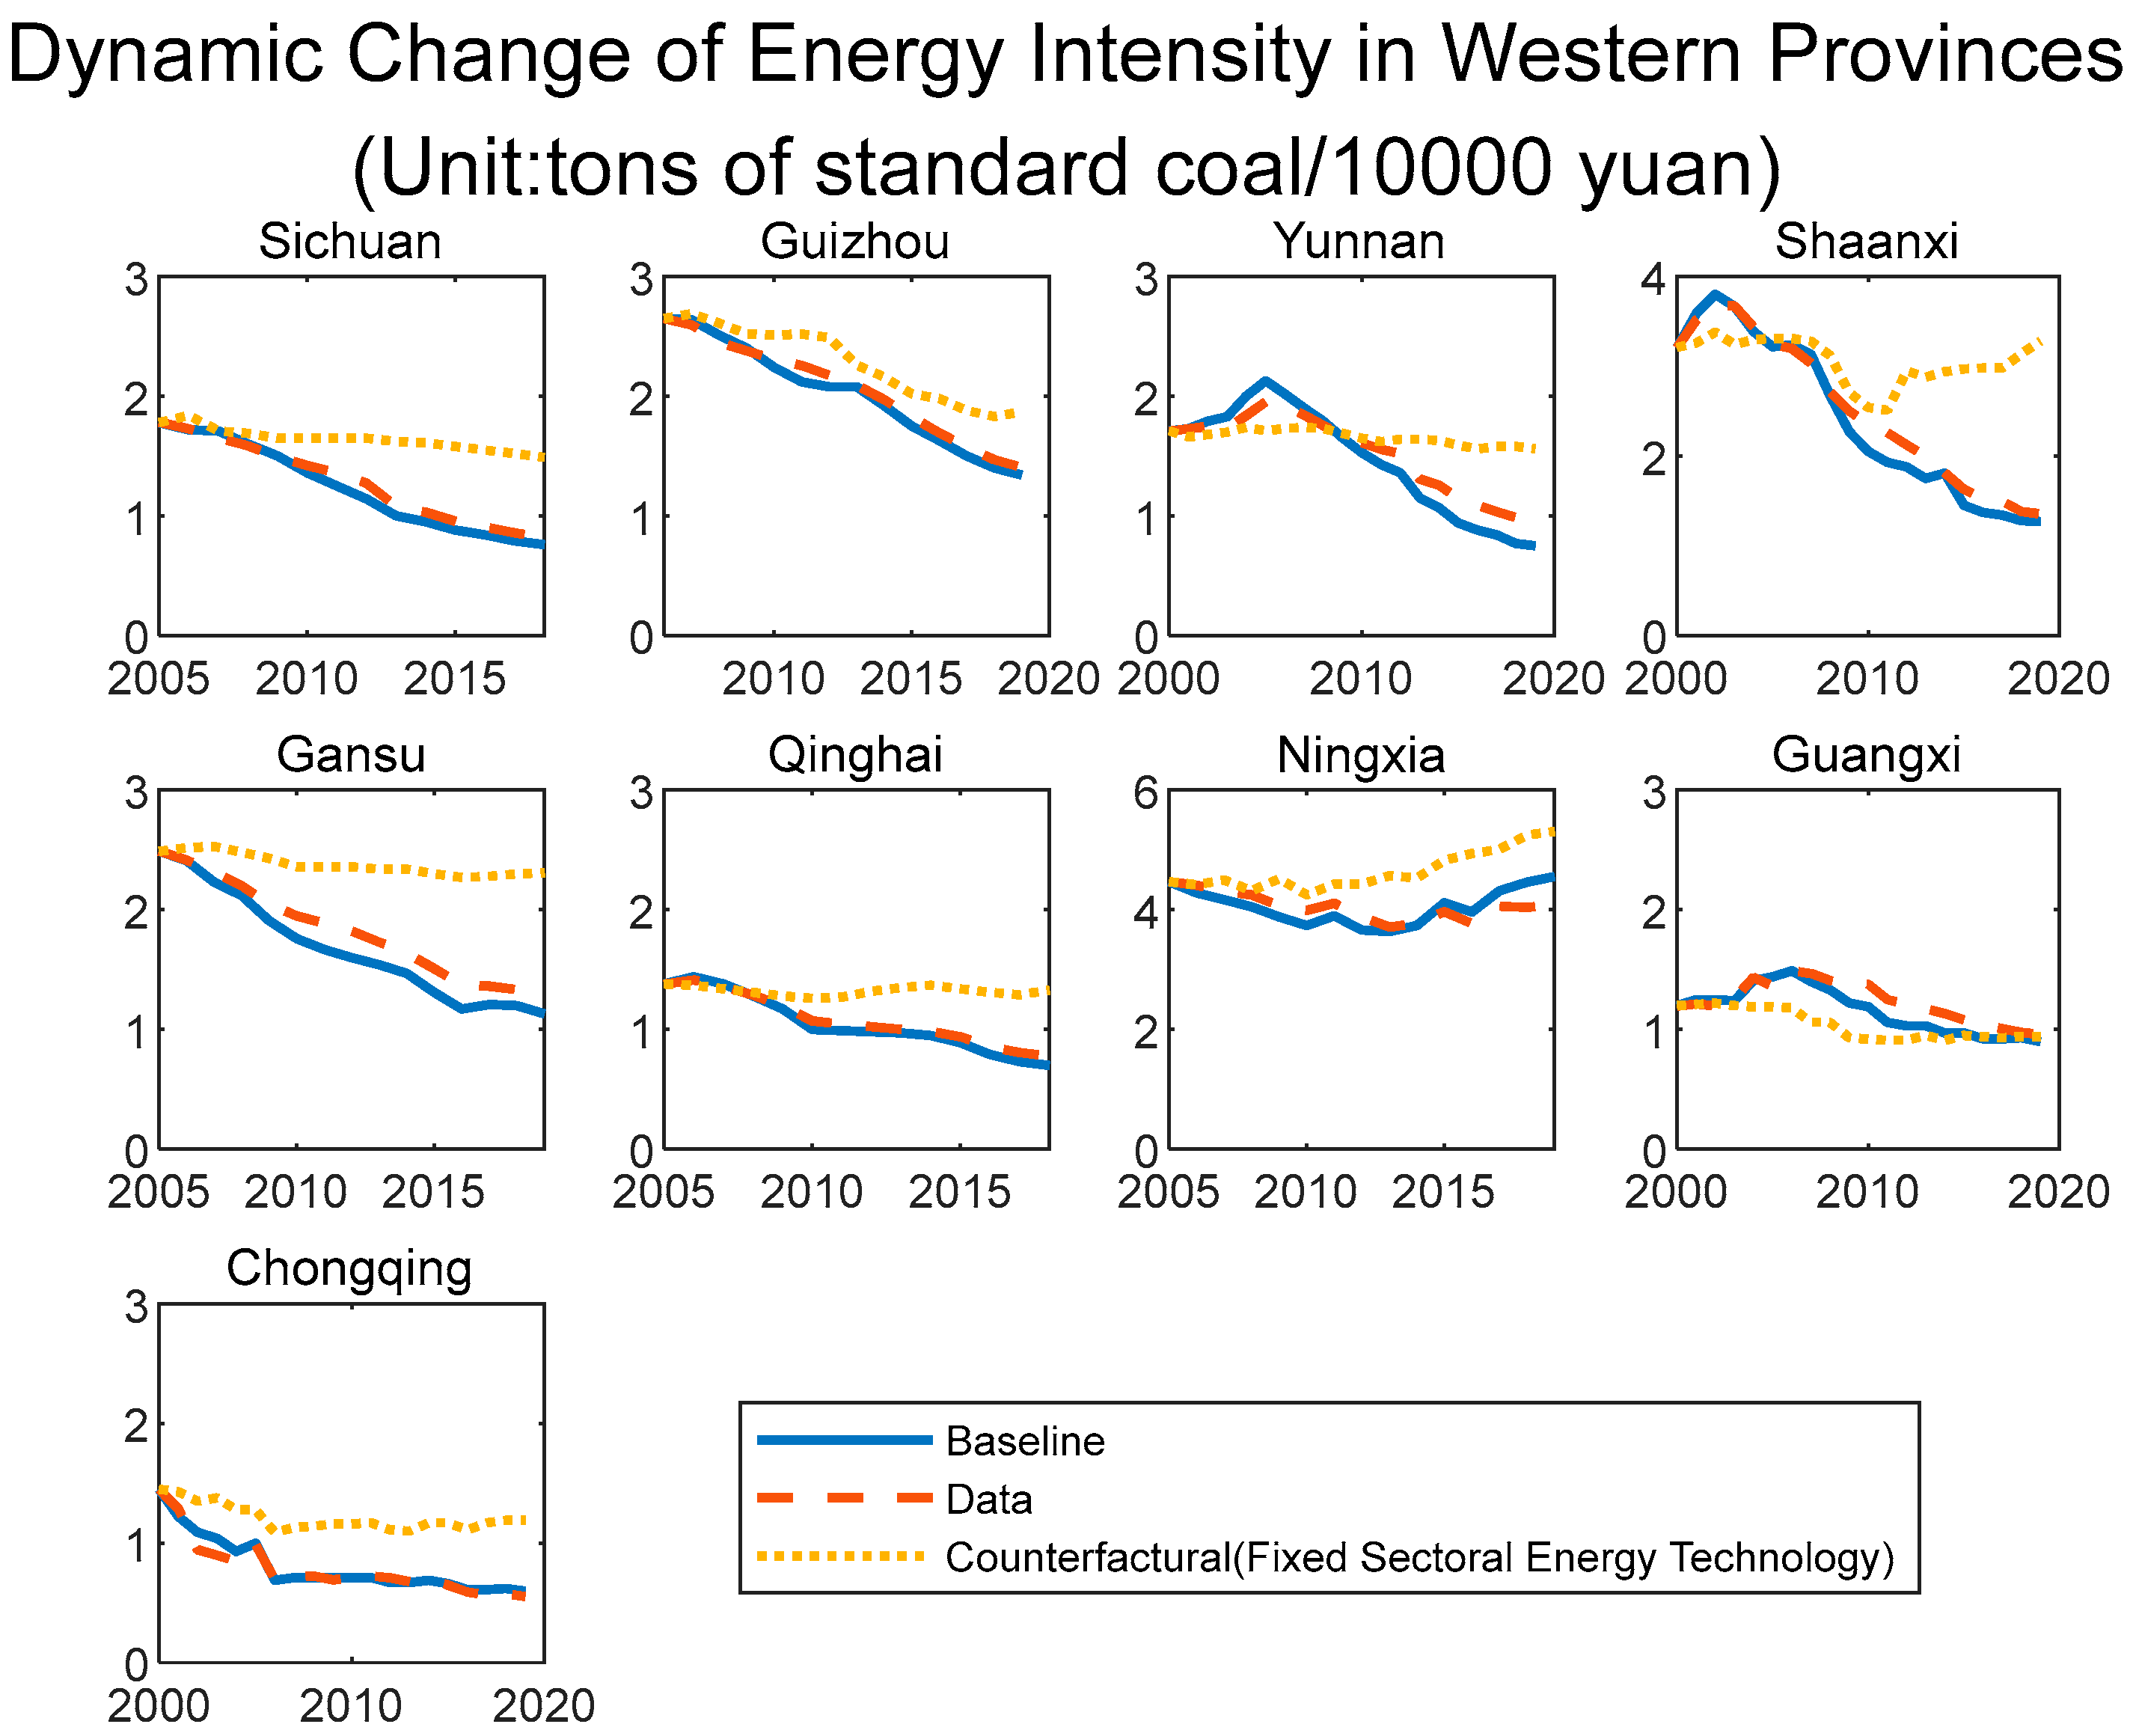
4.3. Benchmark Model
The benchmark model is introduced to assess whether the model can better simulate reality. The energy consumption shares and energy intensities of the provinces (target variables) are compared between the model and the actual data to assess how well the parameters are calibrated to fit reality. The data values are close to the model values as can be seen in
Figure 7,
Figure 8 and
Figure 9. The model values are shown by a solid blue line and the data values are shown by a red dashed line. The econometric method was also applied to check the fitting results of the model. The data values of the energy consumption share of the service sector and the total energy intensity are linearly regressed on their corresponding model simulation values. The regression coefficients are close to 1, indicating a good model fit (
Table 2).
5. Quantitative Analysis
5.1. Data Description
The data was collected from the China Statistical Yearbook, China Energy Statistical Yearbook and the China Regional Statistical Yearbook. The data description and statistics can be seen in the following
Table 3. This study uses panel data for 30 provinces (regions) in China from 2000 to 2019. The unit of energy consumption is 10,000 tons of standard coal; the unit of real GDP is CNY 100 million; and the unit of energy productivity is tons of standard coal/CNY 10,000.
5.2. Decomposition of Energy Intensity by Province
According to the theoretical model and mechanism analysis, the change in energy intensity in different provinces can be decomposed into the productivity effect and structural transformation effect.
In order to quantitatively study the contribution of the two effects and the relationship between them in different provinces, a counterfactual numerical simulation is used to estimate the energy intensity by fixing the energy technology levels of industry, agriculture, and services in the initial year and re-measuring the summed energy intensity. The principle of counterfactual numerical simulation is to observe the change of energy intensity in the counterfactual case by closing a channel that has an impact on energy intensity (in this study, the technological progress is assumed to remain unchanged).
In this case, the difference between the counterfactual energy intensity and the baseline model is the “productivity effect”, and the part of the energy decline that cannot be explained by the productivity change is the “structural transformation effect”. The sum of the two effects is 1. If the structural transformation effect is negative, it means that the change in industrial structure has caused an increase in energy intensity instead. The decomposition results show that the average value of the productivity effect in the eastern provinces is 60.48%, and the average value of the structural transformation effect is 39.52%. The average value of the productivity effect in the central provinces is 82.80%, and the average value of structural transformation effect is 17.20%. The average value of the productivity effect in the western provinces is 73.40%, and the average value of the structural transformation effect is 26.60%. This finding is different from the existing literature, which concluded that the technological effect contribution rate was over 80%, and thus dominates the decline in energy intensity in China [
6].
The overall structural transformation effect is lower than the productivity effect, and the structural transformation effect is the highest in the eastern region, followed by the western region, and the lowest in the central region. This is because the service sector in the eastern region has developed faster in the last two decades, and the real value-added share of the service sector has increased more. Energy technology has progressed faster in the central region than in the western region, so the productivity effect is higher than in the western region. From the provincial-level perspective, Hainan, Guangdong, Tianjin, Fujian, Hubei, Shaanxi, and Guangxi are among the provinces where the structural transformation has led to a decline in energy intensity, while the other provinces are where energy technology progress has led to a decline in energy intensity. The classification of different Chinese provinces into “structural transformation led” and “energy technology advancement led” can provide targeted policy recommendations for different Chinese provinces to choose whether to adopt industrial restructuring or technological advancement to achieve energy savings and emission reductions in the future.
Table 4,
Table 5 and
Table 6 summarized the change in total energy intensity in the province, as well as the contribution of the two effects.
5.3. Discussion on the Relationship between Technological and Structural Effect
In order to analyze the relationship between the technological effect and structural effect, and how technological changes in different sectors affect sector allocation in energy consumption, the following section is put forward. In this section, we explore the impact of energy technological improvements in the goods and service sectors on the service share of energy consumption. The share of energy consumption in the service sector is re-measured by fixing the energy productivity of each province in the industrial and agricultural sector and service sector to the value of the initial year. At this point, the difference between the value of the counterfactual and the baseline model can represent the influence of energy productivity on the energy consumption structure. When the energy productivity of industry and agriculture is fixed at the value of the initial year, the share of energy consumption of the service industry decreases significantly, and when the energy productivity of the service industry is fixed at the value of the initial year, the share of energy consumption of the service industry increases slightly. This indicates that the change in energy productivity in industry and agriculture promotes the shift of energy consumption to the service sector, while the increase in energy productivity in the service sector will result in a lower share of energy consumption, which is consistent with the model,
and
.
Table 7 shows the decomposition results of the change in the share of energy consumption in the service sector for each province in China. The positive(negative) numbers in the table indicate that the technological progress in the sector boosts(hinders) the share of energy consumption in the service sector.
The decomposition results show that the effect of sectoral energy productivity on the structure of energy consumption is quantitatively significant. The service sector energy technological progress effect is significant only in the east, not in the central and western parts of the country. This is because the average growth rate of energy productivity in the service sector is too slow in central and western China to significantly affect product prices. The average energy productivity effect is higher in agriculture and industry than in services because the energy productivity in agriculture and industry grows faster than in services, and thus the effect of energy productivity in agriculture and industry is higher. The energy structure effect of technological progress in industry and agriculture is higher than that of the service sector in all provinces except Hainan.
From the perspective of regional differences, the effect of industrial and agricultural energy technology progress is the lowest in the western region, and the effect of industrial and agricultural energy technology progress is significant in the eastern and central regions. The effect of energy technology progress in the service industry is the highest in the eastern region, followed by the western region, and there is almost no effect of energy technology progress in the service industry in the central region. The effect of the service industry technology progress on the share of energy consumption in the service industry is not significant. Compared with the existing literature, this study gave a more nuanced classification of the sources of technological progress. In other words, the difference in energy technological progress between the commodity sector and the service sector is identified.
6. Conclusions and Policy Recommendations
This study constructed a multi-region and multi-sector general equilibrium model to quantitatively study the impact of China’s energy technology progress and structural transformation on regional energy intensity from 2000 to 2019 and its mechanism. The study also explored the differences in the impact of energy technology progress on energy intensity in different industries. The results show the following conclusions. (1) There was regional heterogeneity in the contribution of the structural effect and technological effect to the decline in energy intensity, and the structural effect declined successively in eastern, western, and central China. Hainan, Guangdong, Tianjin, Fujian, Hubei, Shaanxi, and Guangxi belong to the provinces whose energy intensity decreases were led by structural transformation, while the other provinces are the provinces whose energy intensity decreases were led by energy technology progress. (2) The impact of energy technology progress in industry, agriculture, and the service industry on the distribution of energy consumption among the various sectors was different, which in turn had different impacts on the energy intensity. The increase in energy productivity in industry and agriculture promoted the shift of energy consumption to the service sector, which led to a decline in energy intensity, and this effect gradually weakened successively in the eastern, central, and western regions. The increase in energy productivity in the service sector drove the shift of energy consumption to industry and agriculture, thereby increasing the energy intensity, and this effect gradually increased successively in the central, western, and eastern regions.
Based on the above conclusions, the following policy implications are proposed. First, the various provinces have different economic development degrees and different industrial structures. As a result, the government’s path to achieving the “carbon peak carbon neutral goal” should reflect certain differences. Policy makers in the eastern provinces should focus on adjusting the industrial structure and further promote the transformation of the economy to the service sector. The government should accelerate the deeply integrated development of the service and industry sectors and achieve green and sustainable economic development. Policy makers in the central and western provinces should speed up the progress of energy technology in the industry sector and increase investment in energy technology research and development. Policy makers should guide investment toward industry, enhance the capacity for independent innovation, and strengthen the training of energy professionals.
Second, the government should provide financial support for the technological innovation and energy efficiency improvement of energy enterprises through ecological protection compensation and central financial input.
Third, the government should actively use policy tools such as the “fossil energy tax” system and the national energy trading market to encourage enterprises to reduce energy consumption while these energy policies should be sector-specific. For industries with heavy energy consumption, the government should appropriately raise the energy tax rate and impose stricter restrictions on the right to use energy to encourage energy-saving behavior.
Fourth, Chinese investors are generally keen to invest in clean energy innovation and believe that clean energy has a bright future. This study points out that improving the efficiency of fossil energy use is the leading force in reducing energy intensity. In the short term, China is still dominated by fossil energy consumption. In the context of policies supporting the efficiency of fossil energy use, investing in the research and development of traditional energy technologies can also bring benefits to investors.
This study has potential limitations. First, in the theoretical model, following Hassler (2012) [
33], it is assumed that the production function takes the Leontief form, instead of a more general CES form. The main difference between the two functions is the elasticity between energy and labor; this difference may cause bias in the empirical results. In this study, the actual elasticity between the two factors was calculated as being very close to zero. This assumption does not have a significant influence on the conclusions of this study, since if we use the CES form and set the parameter of elasticity to 0.05 for a robustness check, the results are similar. Second, due to the limitations of the general equilibrium model, only the transformation between the industry sector and service sector is analyzed. Yet, there is heterogeneity within secondary and tertiary industries. For example, in the secondary industry, power production, power and heat supply, non-ferrous minerals, and petrochemicals are the industries with the highest power consumption. The textile, paper, rubber, and plastic industries use relatively low energy. In the tertiary sector, the energy consumption of transportation, warehousing, and postal services is significantly higher than that of finance, accommodation, and catering. Overcoming this limitation could represent a future research direction.


