1. Introduction
The rapid development of the global economy is fueled by the substantial demand for energy. The intensity of exploitation of traditional non-renewable energy sources increases year after year, resulting in insufficient reserves of shallow energy and challenges and risks associated with extracting deeper resources [
1]. Geothermal energy from hot rock sources, which is renewable, abundant, and clean, has attracted attention worldwide. With advancements in research and technology used to harness geothermal energy from hot, dry rocks, the proportion of new energy in the overall energy structure continues to increase annually.
Enhanced geothermal systems (EGS) have been developed in many countries around the world to increase the utilization of geothermal energy [
2,
3,
4,
5,
6]. EGS are geothermal reservoirs that enable the economic utilization of low-permeability conductive rocks by creating fluid connectivity in the initially low-permeability rocks through hydraulic, thermal, or chemical stimulation [
7]. Unlike the hot, dry rock (HDR) systems, EGS not only have a high-temperature crust, but are also characterized by primary permeability, which needs to be enhanced before they can be developed [
8]. While EGS improve the efficiency of geothermal energy extraction, the temperature of the rocks in the deep reservoir drops sharply when they are cooled by water; then, the surrounding rock heats them, and internal fractures in the rocks gradually develop under repeated hot and cold effects, causing the mechanical properties of the rocks to gradually weaken, resulting in decreased rock strength and possible secondary disasters, such as well wall collapse and earthquakes, which affect production safety [
9,
10,
11].
Limited research has been conducted on sedimentary basin-type hot dry rock resources, which are primarily sandstone. Investigation of the physical and mechanical changes and damage evolution mechanisms of sandstone under high-temperature water-cooling cycles is important. Therefore, through the static mechanical testing of sandstone subjected to high-temperature water-cooling cycles, by comparing and analyzing the results, in this study, we aim to elucidate the physical and mechanical alterations and damage mechanisms in sandstone. The findings will provide theoretical guidance for the development of hot dry rock geothermal energy resources.
Previous studies have examined the changes in high-temperature rock characteristics. Xu Xichang et al. [
12] found that mechanical parameters of granite decreased to varying extents after high-temperature heating, with physical properties exhibiting greater changes than mechanical properties. Su Chengdong et al. [
13,
14,
15,
16] subjected three sandstones to high temperatures and observed minimal effects on physical properties below 400 °C but significant impacts on the burn-off rate, bulk expansion rate, and longitudinal wave velocity above 400 °C. Their uniaxial compression tests on high-temperature sandstones indicated 600 °C as the approximate threshold for transition from strong to weak behavior. Zhang Z X, Araújo R G S, and Heueckel T et al. [
17,
18,
19] obtained extensive results on the deformation and damage mechanisms of high-temperature rocks. Through Brazilian splitting tests of granite under different cooling conditions, Deng Longchuan et al. [
20] identified thermal-stress-induced microcracking as the primary mechanism for rapid cooling damage in granite. Hou Di et al. [
21] performed triaxial compression tests on thermally cycled marble to examine the effects of high-temperature cycling on rock strength and damage characteristics. X. G. Zhao et al. [
22,
23,
24] observed a transition from brittle to plastic damage modes in rocks with increasing temperature. Zhu X et al. [
25] identified 100 °C and 500 °C as threshold temperatures for changes in longitudinal wave velocity and mechanical properties, respectively, by testing sandstones containing pre-existing fractures at different temperatures.
Different cooling methods have varying effects on the properties of high-temperature rocks. For example, Kumari et al. [
26,
27] heated Australian Strathbogie granite to high temperatures and studied its mechanical and fracture behaviors under natural and water-cooling conditions using uniaxial compression and acoustic emission. They found that thermal damage occurred in granite cooled from above 400 °C, with water cooling exhibiting a greater impact than natural cooling. Other studies on sandstone showed that high temperatures increased porosity and weakened mechanical properties. Yu Li et al. [
28] performed uniaxial compression and ultrasonic tests on thermally cycled granite to examine the resulting damage mechanisms and evolution of physical and mechanical properties. Li Yabo et al. [
29] identified relationships between the physical and mechanical properties of granite with heating temperature and the number of thermal cycles. Through the mechanical testing of thermally cycled granite, Wang Chun et al. [
10] proposed the use of maximum tensile strain as an indicator of damage initiation. Han Guangsheng et al. [
30] observed a transition from brittle to plastic behavior when cooling sandstones with water. Analyses of microstructures and acoustic emissions during Brazilian splitting tests led Wu Shunchuan et al. [
31] to identify 400–600 °C as the damage threshold range for granite.
In summary, domestic and international scholars have achieved some initial research results in the field of high-temperature rock mechanics. However, previous studies have primarily focused on mechanical testing and thermal–hydraulic coupling behaviors of rocks subjected to high-temperature heating and multiple high-temperature water-cooling cycles. A limited amount of research has been conducted on laminated hydrothermal reservoirs in sedimentary basins, which are chiefly comprised of sandstone. The damage evolution mechanism of sandstone under high-temperature water-cooling cycles is not yet well understood. Fundamental theoretical research can provide useful insights into relevant engineering challenges in geothermal resource development. Therefore, considering these research gaps and needs, in the present work, we investigate the physical and mechanical characteristic changes of sandstone under multiple high-temperature water-cooling cycles, as well as the associated damage mechanisms.
3. Results
3.1. Physical Changes in Sandstone under High-Temperature Water-Cooling Cycles
During the high-temperature water-cooling cycles, some mineral components volatilize and decompose due to differing heat resistances, creating microporosity within the rock samples as the temperature increases. Repeated heating and cooling induces expansion and contraction of the various sandstone particles and pore minerals, which have different thermal expansion coefficients. This thermal cycling inevitably impacts the physical properties of the rock samples. High-temperature water-cooling cycle tests were conducted on the sandstone to obtain bulk expansion rate, mass change, and longitudinal wave velocity data. The results for bulk expansion rate, mass difference, and longitudinal wave velocity are shown in
Table 1.
As shown in
Figure 5, the bulk expansion rate of the rock samples exhibited distinct trends with increasing heating temperature. After repeated high-temperature water-cooling cycles, the 200 °C samples showed a volume reduction compared to their original states, with a minimum expansion rate of −0.72%. This volume decrease at 200 °C can be explained by mineral decomposition and volatilization under heating, creating pores within the samples. The sandstone particles and minerals also thermally expand from generated thermal stresses. Rapid contraction then occurs during water cooling, compressing the pores formed at high temperatures and causing an overall volume reduction.
At temperatures above 200 °C, the bulk expansion rate became greater than 0%, indicating that when the heating temperature exceeds a threshold, thermal stresses are generated within the rock samples. If the thermal stress exceeds the cohesive strength of the rock, microfractures and plastic deformation can occur. Moreover, the contraction effect during water cooling is reduced. As shown in
Figure 5, the bulk expansion rate of sandstone increased with increased temperatures. The 200 °C samples had a negative expansion rate, whereas at 300 °C, the rate was close to 0%. Above 300 °C, the expansion rate escalated significantly. Additionally, the overall expansion rate tended to rise with more cycles. This is attributed to cumulative damage and increasing fracture development in the samples from repeated thermal cycling, leading to a gradual increase in bulk expansion.
Notably, all temperature samples exhibited a significant decrease in bulk expansion after the third cycle. The 600 °C samples produced approximately 1 mm of macroscopic crack damage after five cycles and were excluded from this analysis. The observed trend suggests that as the fissures become fully developed, the high-temperature heated rocks begin to expand into the existing cracks. However, with no further temperature increase and a constant thermal expansion coefficient, the bulk expansion rate gradually decreases. Additionally, the increasing high-temperature water-cooling cycles promote gradual fissure propagation towards the center of the rock samples.
The mass difference after each cycle is the main indicator of sandstone damage. As shown in
Figure 6, the mass loss rates after the first cycle at increasing temperatures were 0.162%, 0.077%, 0.351%, 0.807%, and 1.527%, accounting for about 20.792% of the total mass loss. This significant initial mass loss is attributed to the decomposition of most mineral components and the vaporization of pore water at high temperatures during the first cycle. Additionally, the sharp contraction of sandstone particles during water cooling led to tensile failure and spalling of surface minerals with weaker cohesive strength.
After seven cycles, the mass loss rates at 200–600 °C were 0.238%, 0.535%, 0.582%, 1.083%, and 1.546%, respectively. The differences in mass loss between temperature levels were 0.238%, 0.297%, 0.047%, 0.501%, and 0.463% for the first and seventh cycles. However, the 500 °C samples showed increased mass loss in the fifth cycle due to macroscopic cracking and particle ejection. The results demonstrate that temperature has a close relationship with rock damage, with a threshold temperature that induces significant damage.
Based on the analysis of bulk expansion rate and mass loss, longitudinal wave velocities were measured before and after high-temperature water-cooling cycling. As shown in
Figure 7, the wave velocities decreased by 4.6%, 9.4%, 12.71%, 26.06%, and 56.75% after the first cycle at each temperature, exhibiting similar patterns with additional cycles. Notably, the 200 °C samples showed increased wave velocity after cycling, aligning with the reduced bulk expansion rate and indicating a decrease in internal defects. The extent of velocity reduction escalated with higher temperatures, demonstrating more severe damage. The results indicate that temperature has a greater influence than the number of cycles on sandstone damage, with higher temperatures causing more deterioration.
3.2. Analysis of the Compressive Strength of Sandstone under the Action of High-Temperature Water-Cooling Cycles
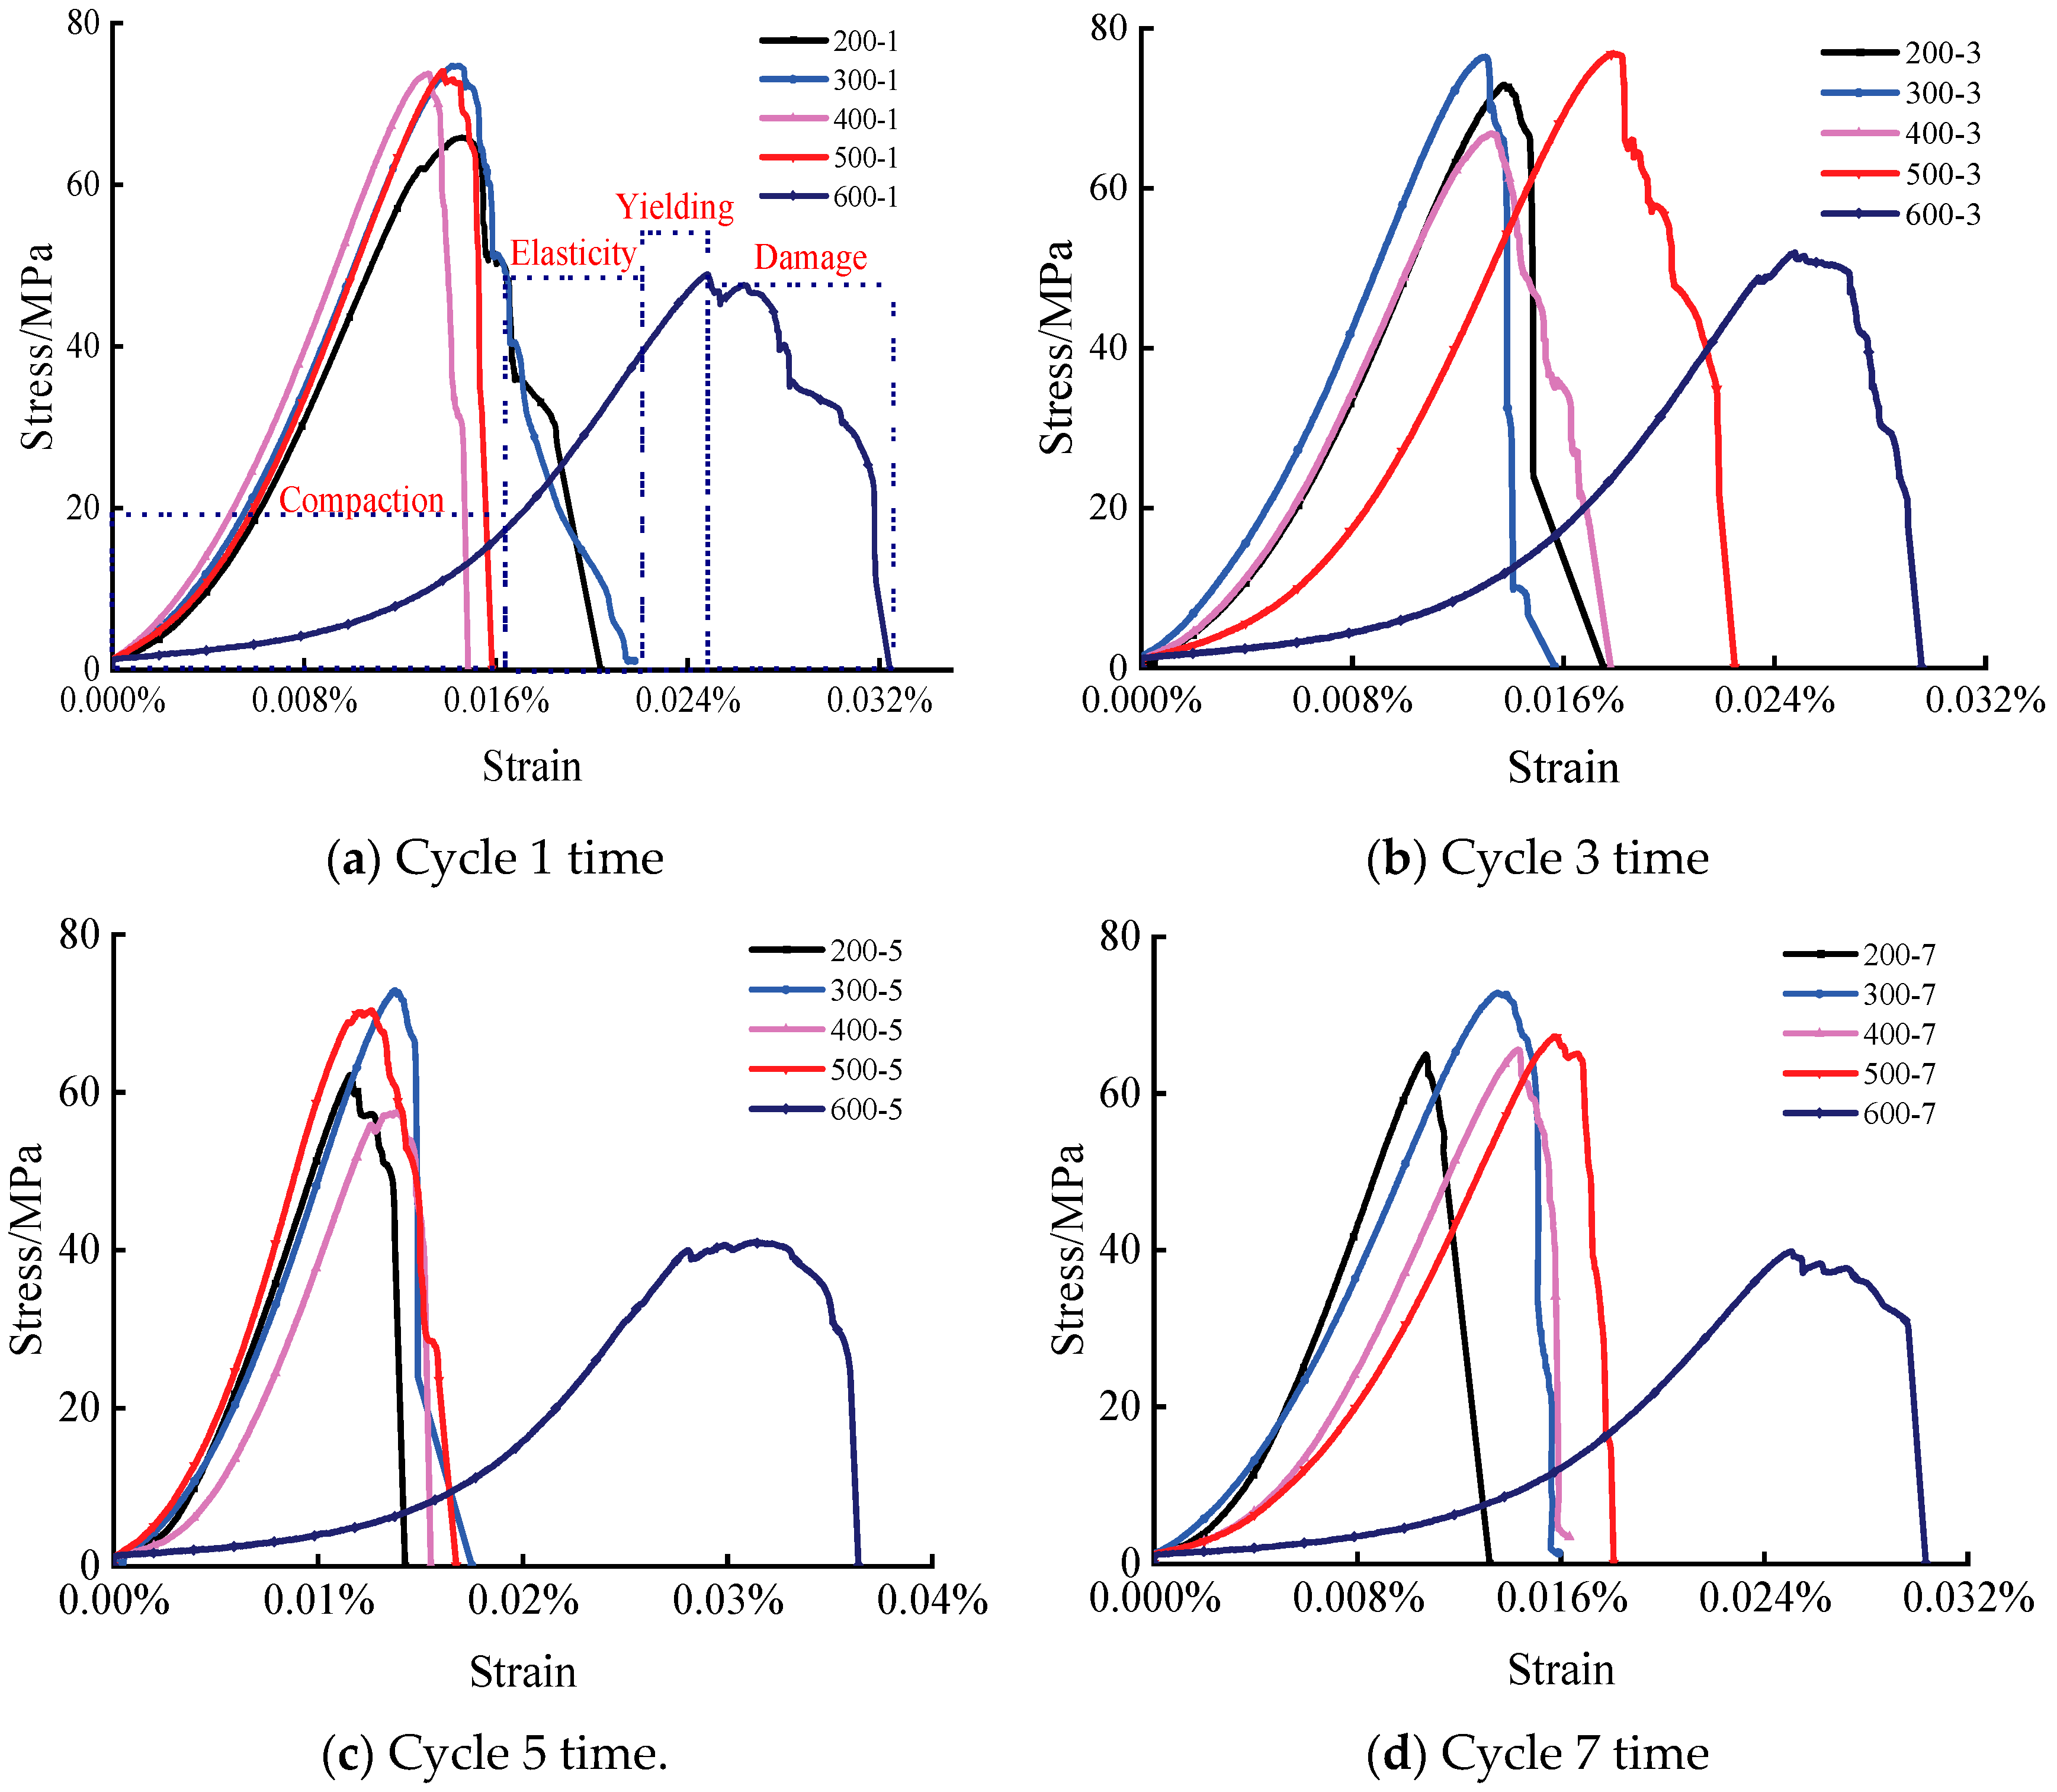
The physical and mechanical properties of the sandstone specimens likely changed after high-temperature water-cooling cycling. The stress–strain curves under uniaxial compression for specimens subjected to the same number of cycles at different temperatures are shown in
Figure 8. The curves exhibit four stages: compaction, elasticity, yielding, and damage.
The stress–strain curves after one cycle at each temperature are shown in
Figure 8a. The 200–500 °C specimens display substantial overlap in the compaction and elastic phases, with a shortened compaction stage. The 200 and 300 °C specimens show stepped post-peak stress reduction corresponding to progressive crack growth. Alternatively, the 400 and 500 °C specimens exhibit brittle behavior with an instantaneous stress drop. The 600 °C curve has an extended compaction phase but a shortened elastic region. The peak stress is significantly lower, with an obvious yield plateau after peak stress, and the post-peak curve demonstrates ductile characteristics.
Figure 8d shows the stress–strain curves after seven high-temperature water-cooling cycles. Compression can be divided into compaction, elastic, yield, and damage stages. Microfractures produced by thermal cycling are compressed initially, lengthening the compaction phase as the elastic modulus decreases, reflecting reduced deformation resistance. In the elastic phase, stress–strain follows a linear relationship. At ~90% of peak strength, the sample enters the yield phase.
Figure 8d shows that peak strengths after seven cycles do not gradually decline with temperature but exhibit fluctuations for the 300, 400, and 500 °C samples. The 300 and 500 °C samples have two strength peaks, whereas the 400 °C sample displays a strength trough between peaks.
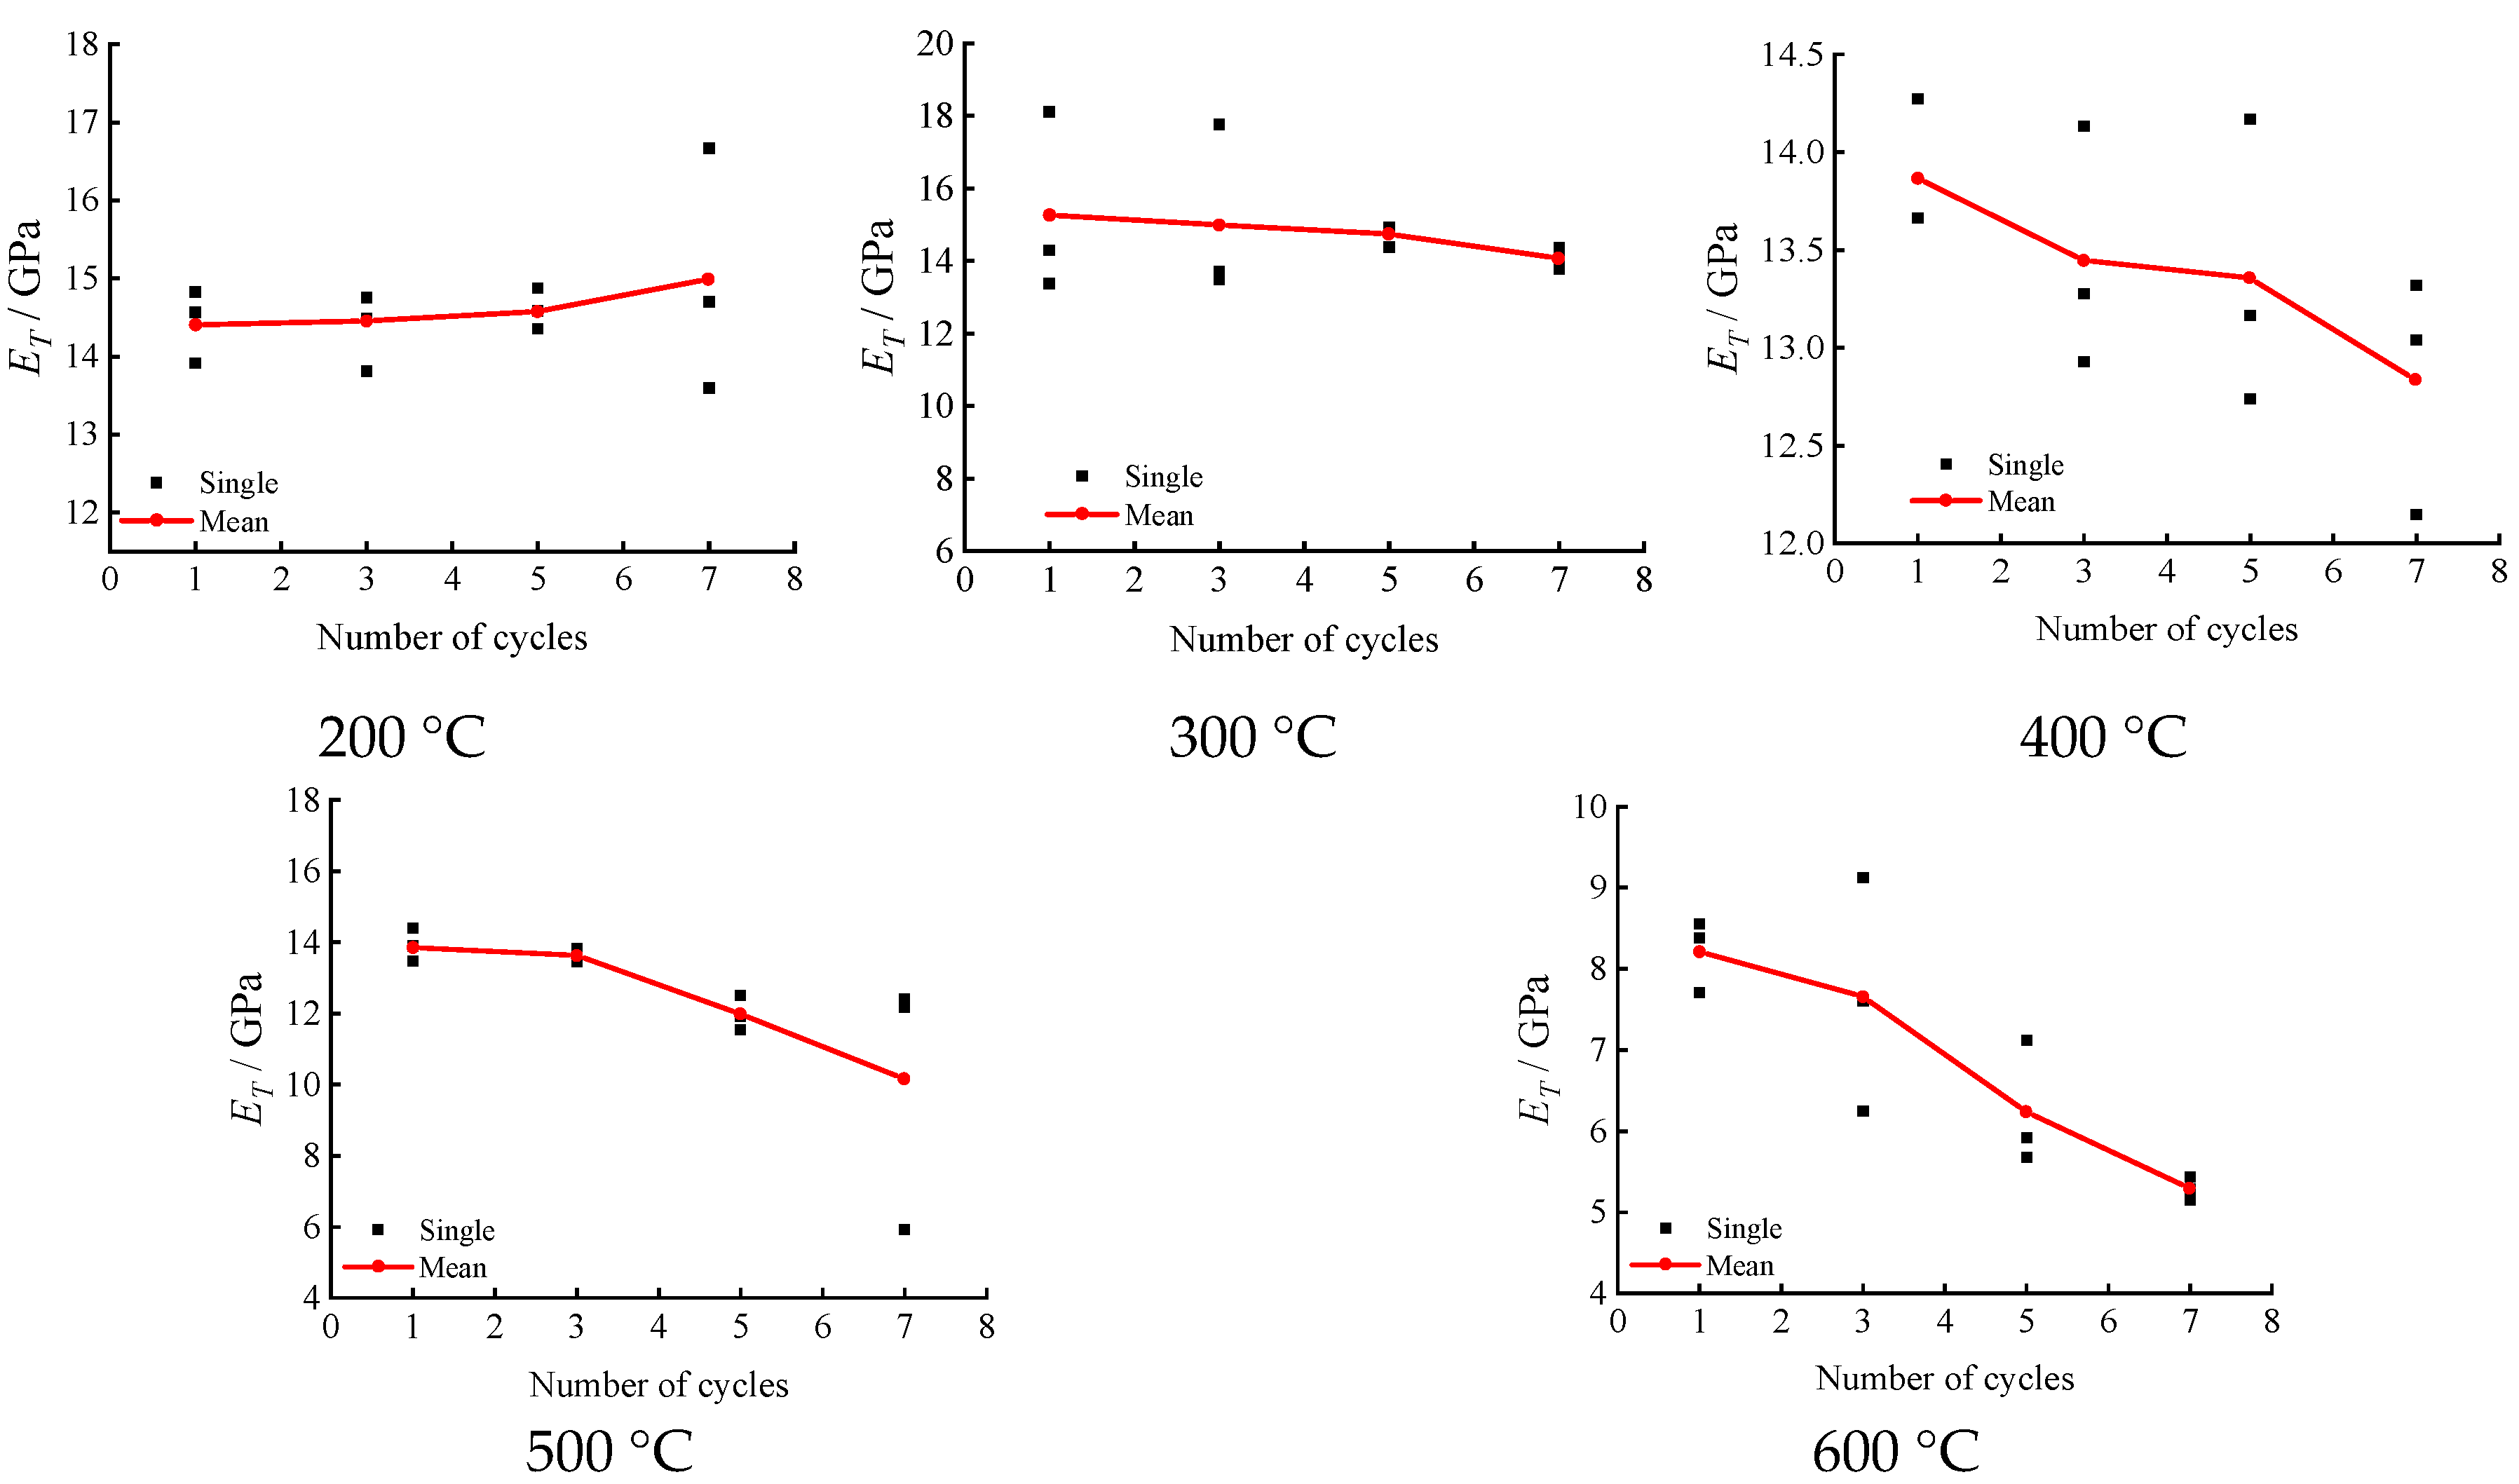
Figure 9 shows the elastic modulus for sandstone specimens at each temperature and cycle number. The modulus exhibited two distinct trends with cycling: at 200 °C, it increased by 4.06% from one to seven cycles; from 300 to 600 °C, it decreased with cycles, by 6.6% at 300 °C, 7.43% at 400 °C, 26.67% at 500 °C, and 35.56% at 600 °C.
The relationship between modulus and cycles aligns with the pattern of longitudinal wave velocity changes, indicating that at 200 °C, strength increased from thermal cycling, likely due to internal pore shrinkage. A threshold temperature appears to governs the cyclic effect on modulus. Below this temperature, the internal structure densifies with cycling, increasing or maintaining modulus. Above this threshold, the modulus rapidly decreases with more cycles as internal damage accumulates.
Figure 10 shows the compressive strength versus the number of cycles for each temperature. At 200 °C, the strength gradually increased from 63.9 MPa after one cycle to 71.46 MPa after seven cycles, corresponding to a 12.2% increase. From 300 to 600 °C, the strength decreased with more cycles. At 300 °C, the strength reduced from 77.27 MPa to 71.99 MPa, corresponding to a 17.6% decrease. At 400 °C, the strength decreased from 72.1 MPa to 66.63 MPa, corresponding to an 18.2% reduction. At 500 °C, the strength declined from 74.05 MPa to 67.92 MPa, corresponding to a 20.4% decrease. At 600 °C, the strength dropped from 56.76 MPa to 38.59 MPa, corresponding to a substantial 60.5% reduction. The data show that compressive strength reductions grew progressively more severe at higher temperatures as the number of cycles increased.
3.3. Acoustic Emission Characteristics of Sandstone under a High-Temperature Water-Cooling Cycle
Acoustic emission data reflect crack development and damage accumulation in rocks under load. In this study, the acoustic emission characteristics of sandstone during uniaxial compression after high-temperature water-cooling cycles were analyzed based on ring counts and energy. The ring count indicates the frequency of acoustic emissions per unit time, with amplitudes exceeding a threshold corresponding to deformation and damage events in the sample.
Figure 10 shows the load–time curves and acoustic emission profiles for sandstone uniaxial compression tests. Owing to space constraints, the acoustic emission features are analyzed for 400 °C samples with different cycle numbers and samples with seven cycles at various temperatures.
3.3.1. Different Cycles at the Same Temperature
- 1.
Characteristics of the change in ringdown count
The relationship between the ringdown count of rock samples with loading and cycling can be described in two parts: when the number of cycles is less than five and when the number of cycles is five or more.
When the number of cycles is less than five, the acoustic emission ringdown behavior during loading can be divided into four stages: calm period, growth period, steep increase period, and decay period.
Calm Period: As depicted in
Figure 11a,b, ringdown counts initially emerge later in the loading process, with the first occurrence at 75 s and 20 counts for one cycle and 120 s and 25 counts for three cycles. The low ringdown rate and long intervals between events signify an energy accumulation phase early on during which internal pores and cracks are closed under pressure without fracture growth, producing minimal acoustic emissions.
Growth Period: For one cycle, the loading time from 220 to 330 s and for three cycles from 250 to 300 s exhibit continuous ringdown occurrence without increased rates, indicating persistent but limited fracture development as stored energy begins overcoming local cohesive strength.
Steep Increase Period: At 330–370 s for one cycle and 300–350 s for three cycles, corresponding to the transition from yielding to failure, ringdown rates escalate rapidly to a peak far exceeding previous levels. As the load increases, abundant internal microcracks coalesce into dominant fractures, prompting the peak rate.
Decay Period: Post failure with further loading, ringdown counts rapidly decrease, likely indicating a shift from substantial fracture damage to distributed microcracking.
With five or more cycles, ringdown counts persist from 0 s until the yield point, but at lower magnitudes, signifying an extended calm period before ringdown growth begins, indicating that the rock samples undergo concurrent fracture compression and densification. Some fractures initiate small-scale development, suggesting easier crack growth with more cycles as internal damage accumulates, further implying that as loading continues, external forces progressively extend fractures, forming larger cracks and amplifying the scale of fracture propagation.
- 2.
Characteristics of cumulative energy change
At a given temperature, cumulative acoustic emission energy trends can be examined. With more cycles, the emergence of cumulative energy advances, and the duration of rapid energy growth decreases. For instance, at one cycle, cumulative energy emerges around 24 s and rises slowly until ~260 s, then escalates rapidly until failure at 430 s. The time from emergence to rapid growth is ~236 s, with 164 s of fast accumulation. At five cycles, cumulative energy appears earlier, around 0 s, slowly increasing until ~280 s before rising rapidly to failure at 375 s. The time to accelerated growth is ~280 s, with just 95 s of rapid escalation. Such a shrinking rapid growth window indicates that the time between yielding and failure decreases with more cycles because crack expansion occurs sooner in loadings with more cycles, hastening fracture development and reducing the sample destruction time.
3.3.2. Same Number of Cycles at Different Temperatures
- 3.
Characteristics of the change in ringdown count
Figure 12 depicts the time–load curves, acoustic emission ringdown trends, and cumulative acoustic emission energy for rock samples subjected to the same number of cycles at varying temperatures. The acoustic emission ringdown behavior during loading can be characterized in two temperature ranges: (1) below 400 °C and (2) at and above 400 °C.
As depicted in
Figure 12, the 200 °C and 300 °C samples exhibited low initial ringdown counts during early loading, with sparse occurrence. The peak ringdown reached 126, with intervals around 40 s between some events, signifying gradual compaction of internal fractures with limited propagation, as the rock accumulates energy and minimal release. The rise in ringdowns from 278 s to 327 s indicates new crack development in the samples. The sudden spike to 6542 at 328 s suggests abundant fracture creation and initial damage from dominant cracks, although load-bearing capacity remains. The sharp ringdown drop follows from the compaction of cracks. The continued counts may arise from frictional acoustic emissions between compacting fractures. The spike at 356 s signifies the penetration of the main fracture and loss of load capacity. The 300 °C sample exhibited similar behavior to that of the 200 °C sample.
In the 400 °C, 500 °C, and 600 °C samples, ringdown counts consistently remained below 250 during early loading. Such a prolonged low-level period signifies small-scale crack initiation and energy accumulation, lasting 364 s at 400 °C, 410 s at 500 °C, and 726 s at 600 °C. The extended duration indicates that microcracking emerges earlier with rising temperature at a fixed cycle number.
Figure 12 depicts the acoustic emission profile for the 400 °C sample, showing the peak ringdown changes for each temperature under seven cycles. The counts decreased from 6542 to 1384 from the lowest to highest temperature, corresponding to a 78.85% reduction, which is attributed to the escalating internal damage at higher temperatures, as evidenced by sustained ringdown generation during loading as microcracks exceeded the threshold. Sudden multiorder leaps in ringdowns signify the coalescence and propagation of dominant fractures, damaging the specimen. The decline in peak ringdowns with temperature points to a transition from brittle to ductile damage modes, demonstrating that temperature exerts a greater impact than cycling on rock damage.
- 4.
Cumulative energy change characteristics
At temperatures below 400 °C, the cumulative energy change is minimal, indicating slow crack growth with gradual energy accumulation during loading. However, owing to limited crack development, the acoustic emission cumulative energy remains low. The 200 °C sample shows a rapid escalation in cumulative energy at 287 s, signifying intensified cracking. The 300 °C sample exhibited similar behavior.
Above 400 °C, the cumulative acoustic emission energy trends differ from those at 200 °C and 300 °C. Gradual increases emerge early in loading, with greater rises at higher temperatures, suggesting that cracking is initiated at loading onset, consuming internally stored energy. With elevated heating temperatures, fracture development becomes more active early in the loading process, revealing increasing internal damage and more severe degradation at higher temperatures.
3.4. Characteristic Analysis of Crack Growth and Failure Modes
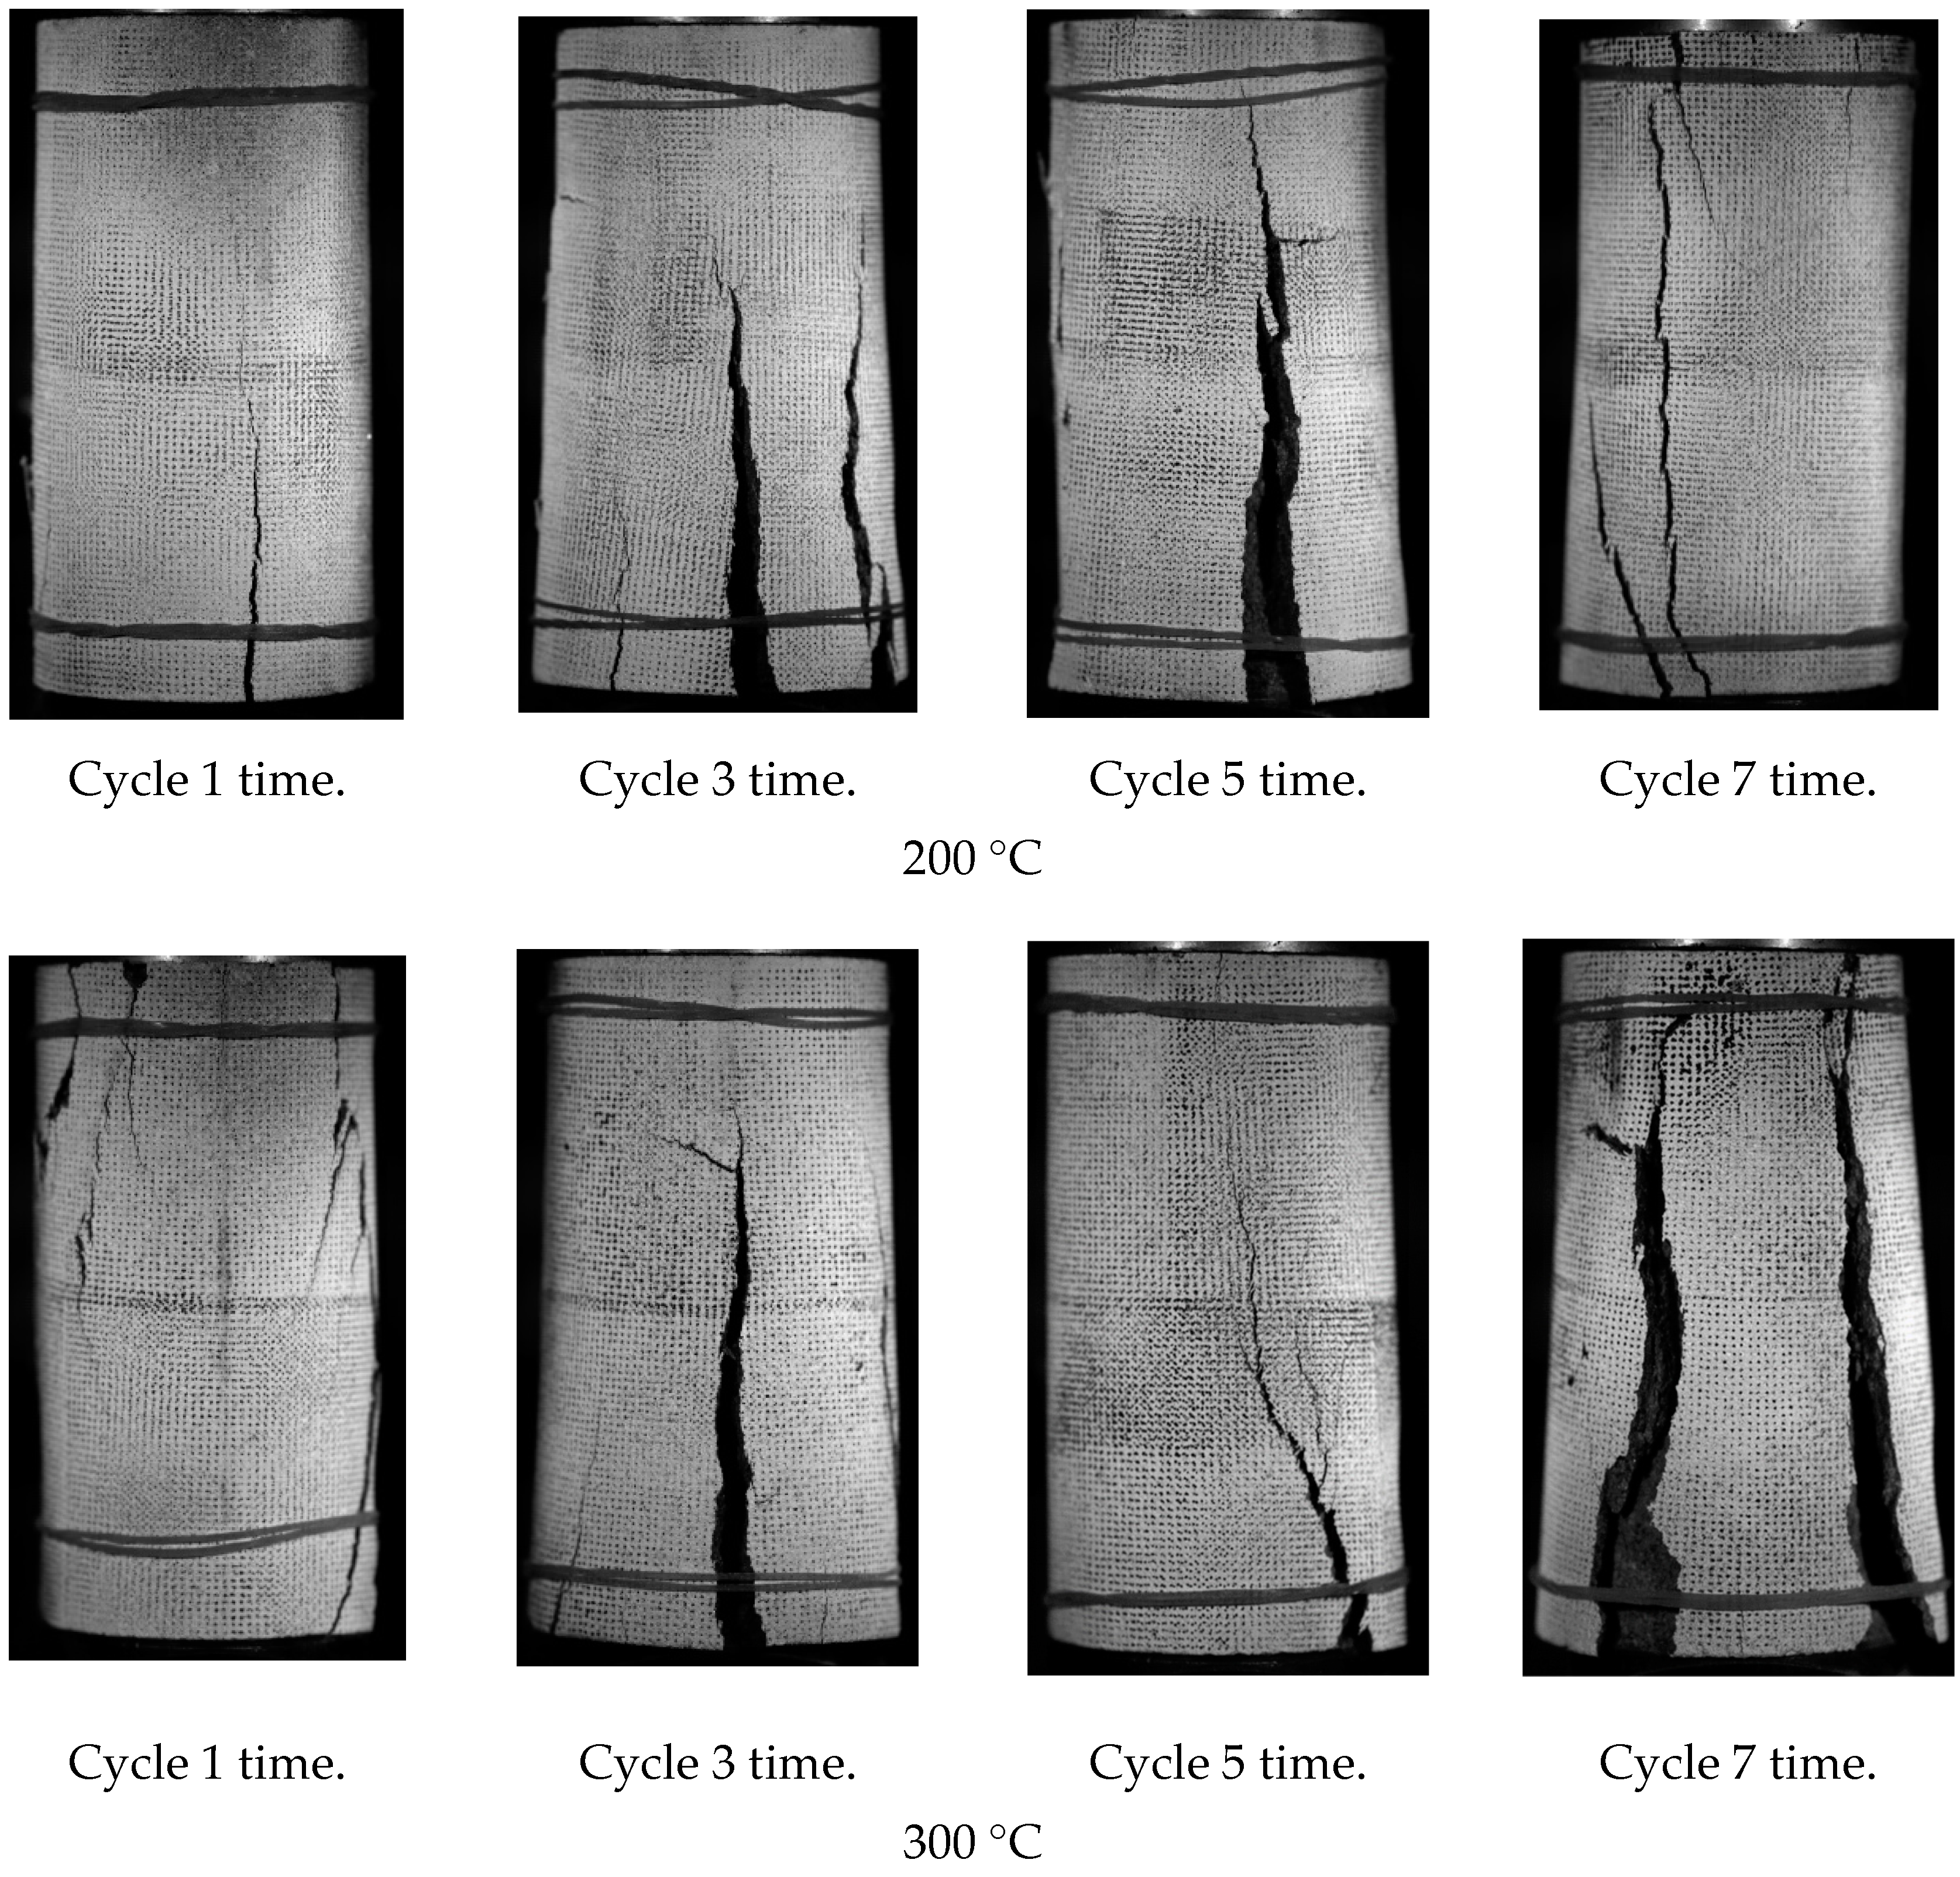
As depicted in
Figure 13, the 200 °C sandstone specimens displayed pronounced brittle behavior after one, three, and five high-temperature water-cooling cycles. The samples failed predominantly through splitting, producing numerous fragments. Upon failure, substantial elastic energy release occurred, ejecting large rock pieces. After seven cycles, damage initiation occurred, still exhibiting brittle cleavage, with major crack growth at an angle to the maximum principal stress direction.
At 300 °C, significant brittleness occurred after one and three cycles, with predominant cleavage failure producing many fragments. Large energy release and block ejection occurred upon failure, with cracks following the maximum principal stress direction and gradually increased elongation. After three, five, and seven cycles, brittle failure persisted but with smaller damaged blocks and larger fractures.
The 400 °C specimens still showed primarily brittle damage after one cycle but with reduced block sizes and surface spalling. After three, five, and seven cycles, the damage transformed from brittle to ductile, with initial mid-specimen flaking during uniaxial loading. More particles were generated during failure, with evident shear slip and fewer blocks.
At 500 °C and 600 °C after one, three, five, and seven cycles, the damage shifted from brittle to ductile. Flaking initiated mid-specimen during loading, and shear slip escalated during failure. At 600 °C, tensile splitting occurred initially after one cycle, with more particles and fewer blocks after failure. After three, five, and seven cycles, flaking became granular, with a strong hierarchical texture on the damaged surface and abrasive damage in the middle of the specimen.
4. Discussion
To clearly characterize the damage to sandstone after high-temperature water-cooling cycles, the damage variable (
D) was calculated for the sandstone specimens based on the modulus of elasticity determined in uniaxial compression tests under static loading after thermal cycling. The damage variable (
D) was computed as (1):
where
is the modulus of elasticity of the sandstone in its natural state averaged around 14 GPa under uniaxial compression, and
is the modulus of elasticity of the sandstone specimen after
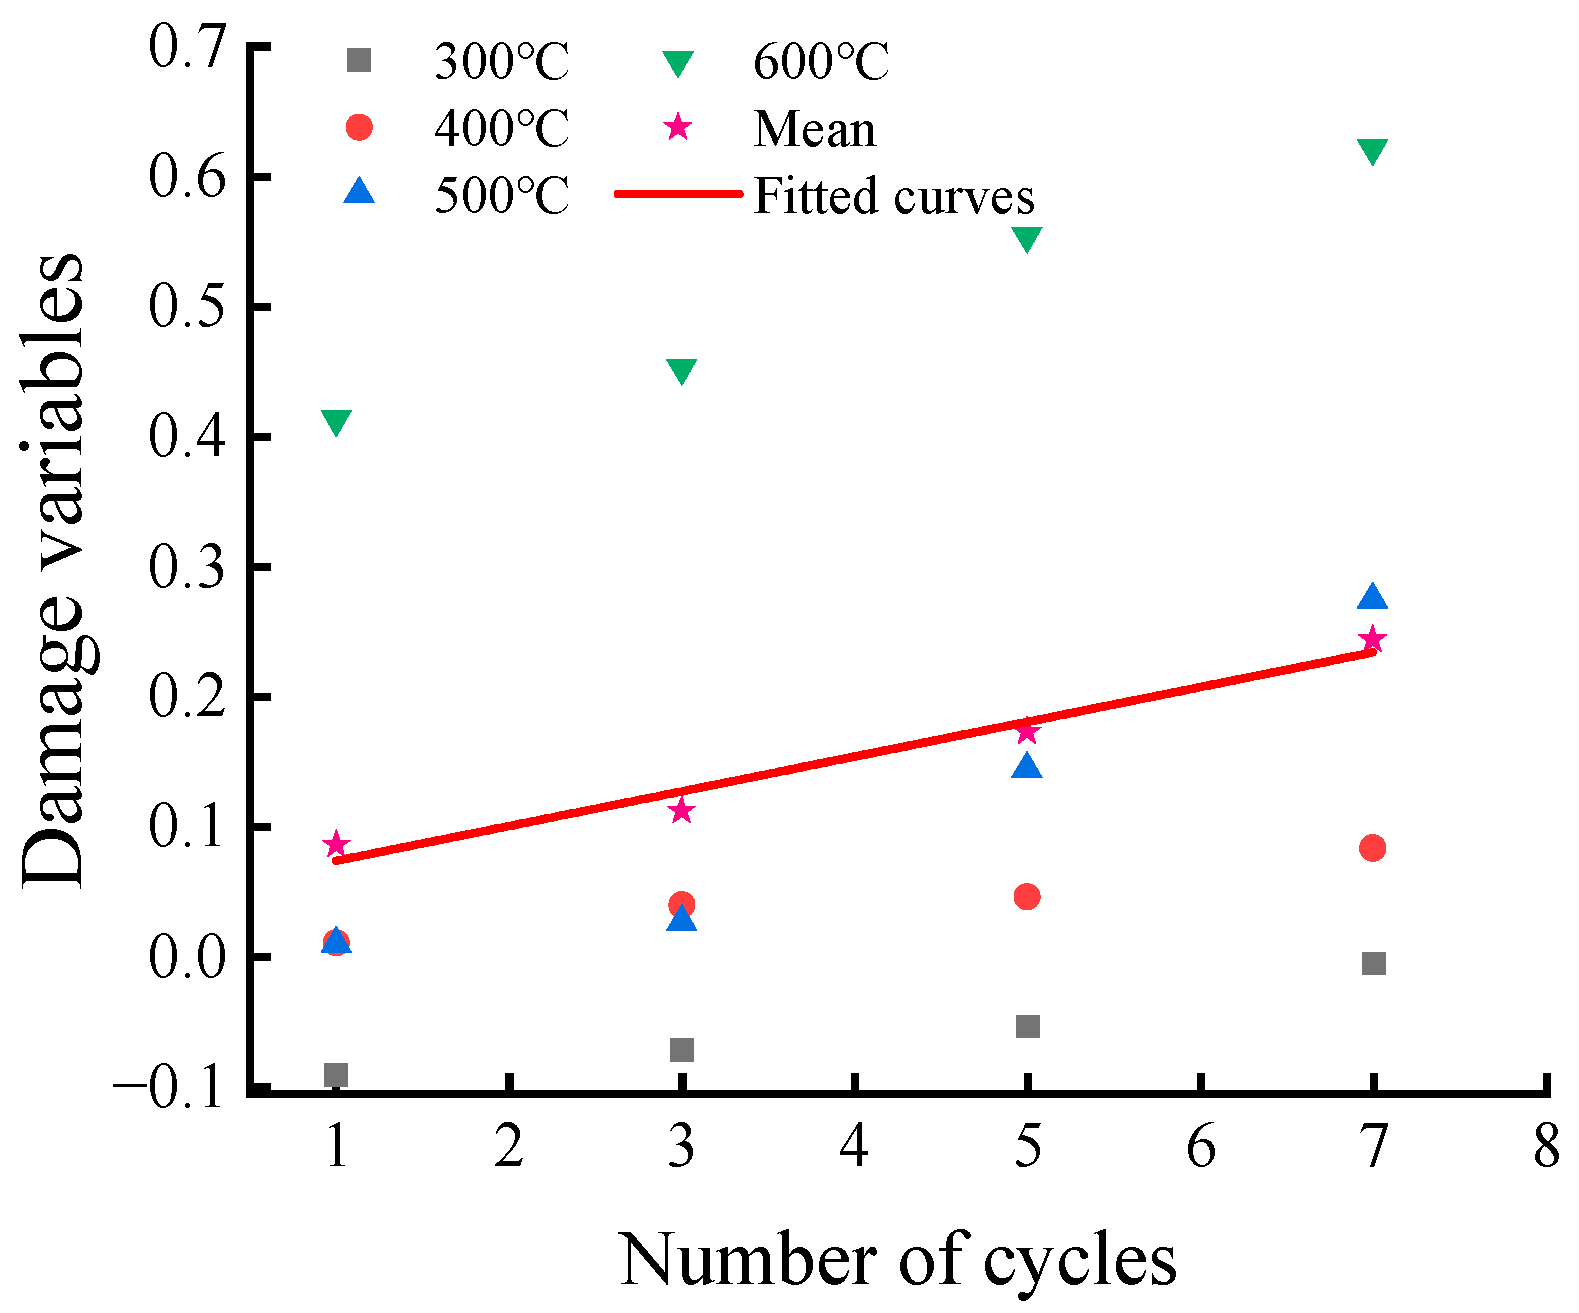
N cycles. Using the average damage variables of the thermally cycled sandstone specimens at different temperatures and cycle numbers, the data were fitted to obtain empirical formulas and plots describing the relationships between damage variables and temperature, as well as cycles. The fitting equations are shown in (2) and (3), and the fitting plots are depicted in
Figure 14 and
Figure 15. However, at 200 °C, the sandstone specimens exhibited strengthening with more cycles, so damage variables at 200 °C were not included in the fitting analysis.
Fitting equation for damage variables with number of cycles:
Fitting equation for damage variables with temperature (
T):
The changes in the physical and mechanical properties of sandstone specimens after undergoing high-temperature water-quenching cycles can be attributed to two fundamental factors. First, the elevated temperatures cause alterations in the composition of the sandstone specimens, which consequently lead to variations in their mechanical properties. Secondly, the differential expansion rates of internal air, quartz, and other mineral components within the sandstone specimens generate tensile stresses between minerals due to repeated thermal cycles. When the tensile stress exceeds the thermal stress, cracks form, resulting in a reduction in the specimens’ physical properties and strength. Moreover, water seeping into the specimens dissolves specific mineral components, weakening the bonding between mineral particles and facilitating the propagation and development of cracks [
28].
As depicted in
Figure 14, the sandstone damage variable gradually increases with the number of cycles, although the rise is small because under high temperatures, crystalline water and some minerals within the specimen vaporize, dissolve, and create internal pores. When the hot sample is immersed in water for cooling, considerable temperature differences generate thermal stresses. The tensile forces between crystals can produce microcracks. Repeated thermal cycling causes separation between crystals, forming fissures. Once cracks form, water ingress promotes further propagation under hydraulic and tensile stresses. Therefore, more cycles lead to increased crack development and more severe cumulative damage in the sandstone.
From the perspective of changes in mineral composition, Su Chengdong et al. [
15] conducted X-ray diffraction analysis on high-temperature sandstone. They discovered that when the temperature is below 400 °C, kaolin disappears, and the overall mineral content decreases. A new substance called calcium feldspar emerges as the primary constituent of the sandstone. With increasing temperature, the quartz content in the sandstone increases, resulting in an apparent increase in its strength. However, at 600 °C, the strength of the specimen decreases due to a reduction in quartz content.
As shown in
Figure 15, at a fixed number of cycles, the sandstone damage variable exhibits two distinct trends with temperature. Below 400 °C, it is hypothesized that the specimen experiences increased internal porosity after high-temperature exposure. Rapid water cooling then causes shrinkage as a result of thermal contraction, densifying the internal structure and causing apparent strengthening. Above 400 °C, internal damage gradually rises with increasing temperature, as reflected by escalating damage variables. This is attributed to heightened porosity from escaping crystalline water and mineral decomposition at high temperatures, culminating in damage growth. Between 500 and 600 °C, the quartz phase change severely weakens the internal structure, further increasing damage. Aligning with the physical property changes presented earlier, this phenomenon suggests that at a constant cycle number, the sandstone structure initially strengthens, then weakens with rising temperature, as evidenced by the damage variable analysis.


