Article

Spatio-Temporal Differentiation Characteristics and Driving Factors of Urban Thermal Environment: A Case Study in Shaanxi Province, China

1
School of Architecture, Xi’an University of Architecture and Technology, Xi’an 710055, China
2
Institute of Architectural and Survey, Xi’an 710055, China
3
UniSA-STEM, University of South Australia, Mawson Lakes Campus, Adelaide 5095, Australia
*
Author to whom correspondence should be addressed.
Sustainability 2023, 15(17), 13206; https://doi.org/10.3390/su151713206
Submission received: 19 July 2023 / Revised: 19 August 2023 / Accepted: 30 August 2023 / Published: 2 September 2023

Abstract

:
Rapid urbanization and global warming have led to a series of ecological and health problems caused by the deterioration of urban thermal environment (UTE). Using a comprehensive analysis of meteorological and remote sensing data for Shaanxi Province, a model of urban thermal differentiation (UTD) was developed, and the spatio-temporal characteristics of UTE in different regions were analyzed. Using the Geo-explore model, natural and socio-economic factors were chosen to explain the spatio-temporal distribution changes in UTE. The results showed that the UTD and Geo-explore models can be used to estimate spatio-temporal differentiation characteristics and change patterns of UTE. This method can describe UTE’s spatial distribution and change characteristics well, making it suitable for multiple-perspective evaluations. In Shaanxi Province, the spatio-temporal distribution of UTE shows a decreasing trend from south to north and east to west. After 2000, the UTD showed a relatively stable performance in the Southern, Central, and Northern regions. The atmospheric temperature (AT) varied greatly across regions due to different factors. UTE mitigation and improved urban design can be achieved using this method.

1. Introduction

Rapid industrialization and urbanization in the last few decades have changed the land cover, anthropogenic heat flux, and microclimate in China [1]. These changes have significantly impacted the microclimate, atmospheric quality, urban life quality, and human thermal environment [2,3]. The efficient monitoring and rapid analysis of, and quick response to UTE deterioration have become some of the primary problems of urban climate and environment research [4]. A high AT can lead to high cooling energy consumption [5], reduce urban thermal comfort (UTC) [6], and cause serious public health problems [7]. Previous studies have revealed that differential heating produces mesoscale winds, which help pollutants to circulate and move upward, leading to atmospheric pollution issues [8,9]. With global warming, the UTE may worsen in the coming years. UTE is not only associated with temperature, but also with natural and socio-economic conditions [10]. In order to mitigate the sustained deterioration of the UTE and establish a scientific basis for risk assessment and mitigation strategies, the spatial patterns of UTE must be analyzed using multisource data and their influencing factors.
In several studies, observations from ground meteorological stations have been used to evaluate UTE spatial patterns [11], and numerical simulation data from thermal infrared satellite data have been widely used to understand land surface heat distribution [12]. The use of meteorological observation data has several advantages, including providing observations at multiple time scales and facilitating the in-depth analysis of the relationship between UTE and local climate conditions. However, they are susceptible to the spatial distribution of ground-based observation points and have certain limitations [4,13]. Thermal infrared remote sensing data can, however, overcome the limitations of ground-based stations, and provide complete region temperatures of a research area [14]. However, thermal infrared remote sensing data are often affected by a variety of factors, such as spatial and temporal resolution, which prevent continuous and real-time observational data from being obtained [15,16], and 1.5 m atmospheric temperatures cannot be obtained directly. As a result, these data are often used to indirectly reflect the UTE. Previous studies have shown that land surface temperature (LST) is often positively correlated with AT [17,18,19,20], and this is usually influenced by the type of land [21], seasonal evolution [20], etc. This is because different materials, such as asphalt and cement, have different physical and chemical properties [22,23], different heat storage capacities, and different abilities to reflect and scatter heat [24]. Therefore, the LST is greatly different in the daytime. The AT is stable within a certain area, and reflects the real situation of UTE better than LST [4,25]. Despite all of the efforts to explain the changes in UTE characteristics, many studies have shown that, when temperature rises clearly, the UTE changes dramatically [26,27]. However, only a few studies have examined the characteristics of AT changes on a spatio-temporal scale by dividing the study area into three parts according to the climate regions.
The UTE is affected by different natural and socio-economic factors, for example, wind speed, humidity, and solar radiation [28]. The increases in population and anthropogenic activities in urban areas have also changed the UTE distribution pattern [29]. Spatial proximity was found to be related to land-use and urban patterns, which in turn affects the spatial patterns of UTE [30]. Using the correlation of urban AT with city underlying surface, it was found that the day temperature in Nankai district has a remarkable linear relationship with the ratio of green area, water area, plot ratio, and anthropogenic heat [31]. In a study which analyzed the influence factors by using the spatial principal component analysis (PCA) method instead of the multiple quasi-lateral judgment method in Shanghai, the results showed that four factors, including urban building and population density, industrial layout, and underlying surface type, are leading factors influencing the spatial pattern of UTE [16,32]. Meanwhile, most studies have focused on specific factors, such as rainfall [33], land use, land cover change [16], and population [34]. Only some have focused on the causes of UTE increase based on natural and socio-economic factors [10,12,26].
We examined the spatio-temporal variation in the UTE variables and influencing factors in Shaanxi Province, China, for three different geographical locations (Southern Shaanxi area (SSA), Central Shaanxi area (CSA), and Northern Shaanxi area (NSA)). As far as we are aware, no previous study has focused on the different geographical locations of Shaanxi Province. Therefore, based on the survey data of atmospheric environmental data, and natural and socio-economic data of Shaanxi Province, China, the objectives of this paper are to: (1) evaluate the AT of spatio-temporal characteristics based on the UTD model; (2) explore the main influences affecting the distribution and spatio-temporal variations in the UTE; and (3) provide a rationale for potential AT migration. This study will enhance our understanding of the spatio-temporal variation in UTE and provide a useful reference for mitigating the urban heat island in Shaanxi Province.

2. Materials and Methods
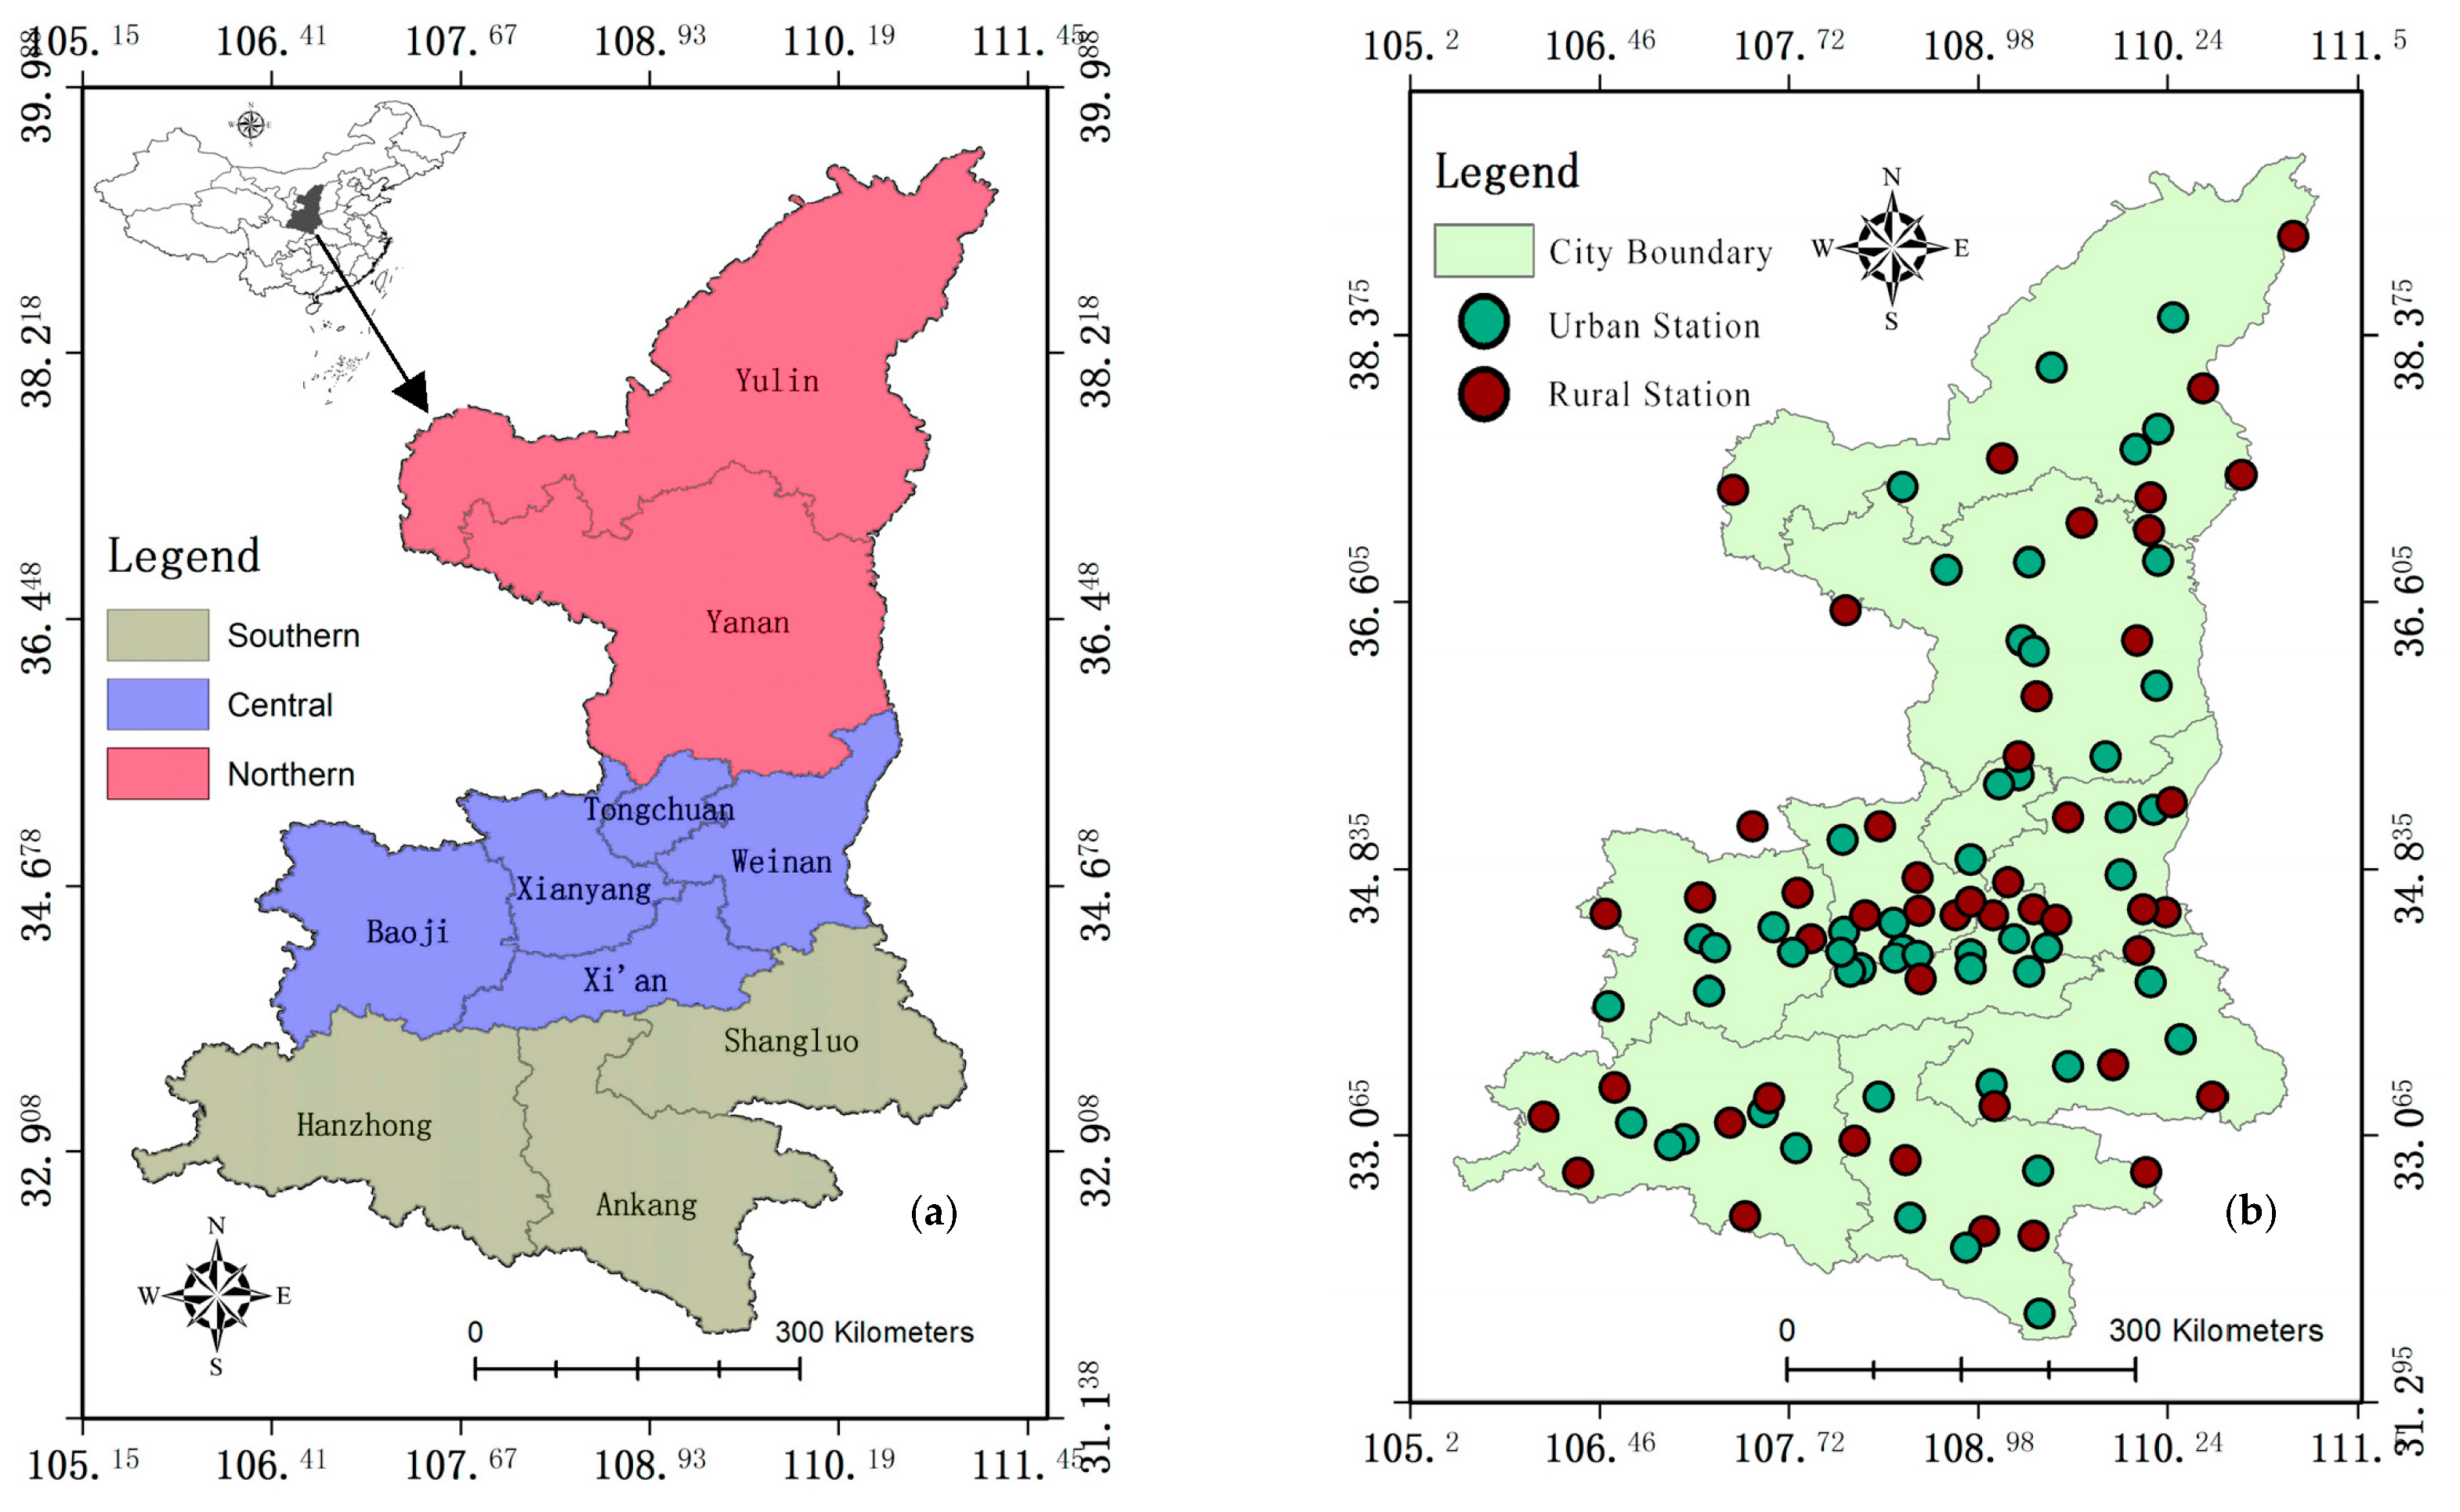
2.1. Study Area

The study was conducted in Shaanxi Province (105°29′–111°15′ E and 31°42′–39°35′ N) (Figure 1a), which is located in northwestern China, and consists of 10 cities. The permanent resident population of Shaanxi has exceeded 38 million, including about 25 million in urban areas, and the urbanization rate reached 64.02% in 2022. The study area has a temperate continental climate with an annual mean temperature of 7–16 °C and yearly precipitation of 300–700 mm. The study area is usually divided into three parts, including the SSA, CSA, and NSA, due to their characteristics of geographical difference, which cover three typical climate zones from south to north, including a humid climate, sub-humid climate, and semi-arid climate [35]. According to the land cover datasets from the Land and Resources Bulletin (2019), about 7% and 20% of the area is covered by buildings and cultivated land in Shaanxi Province, respectively. Most of the non-urban areas are covered by forest and farmland, accounting for 61.1% and 14.4%, respectively. Among them, 81% of the arable land is distributed in the northern Shaanxi Plateau and the Guanzhong Plain, and 54.7% of the forest land is mainly distributed in Yan’an City, Hanzhong City, and Ankang City. Many previous studies have proved that the urban–rural differences in AT and emissions are significant [10,13,18] (https://www.mnr.gov.cn/sj/tjgb/201807/ (accessed on 10 September 2022)).

2.2. Data Sources and Processing
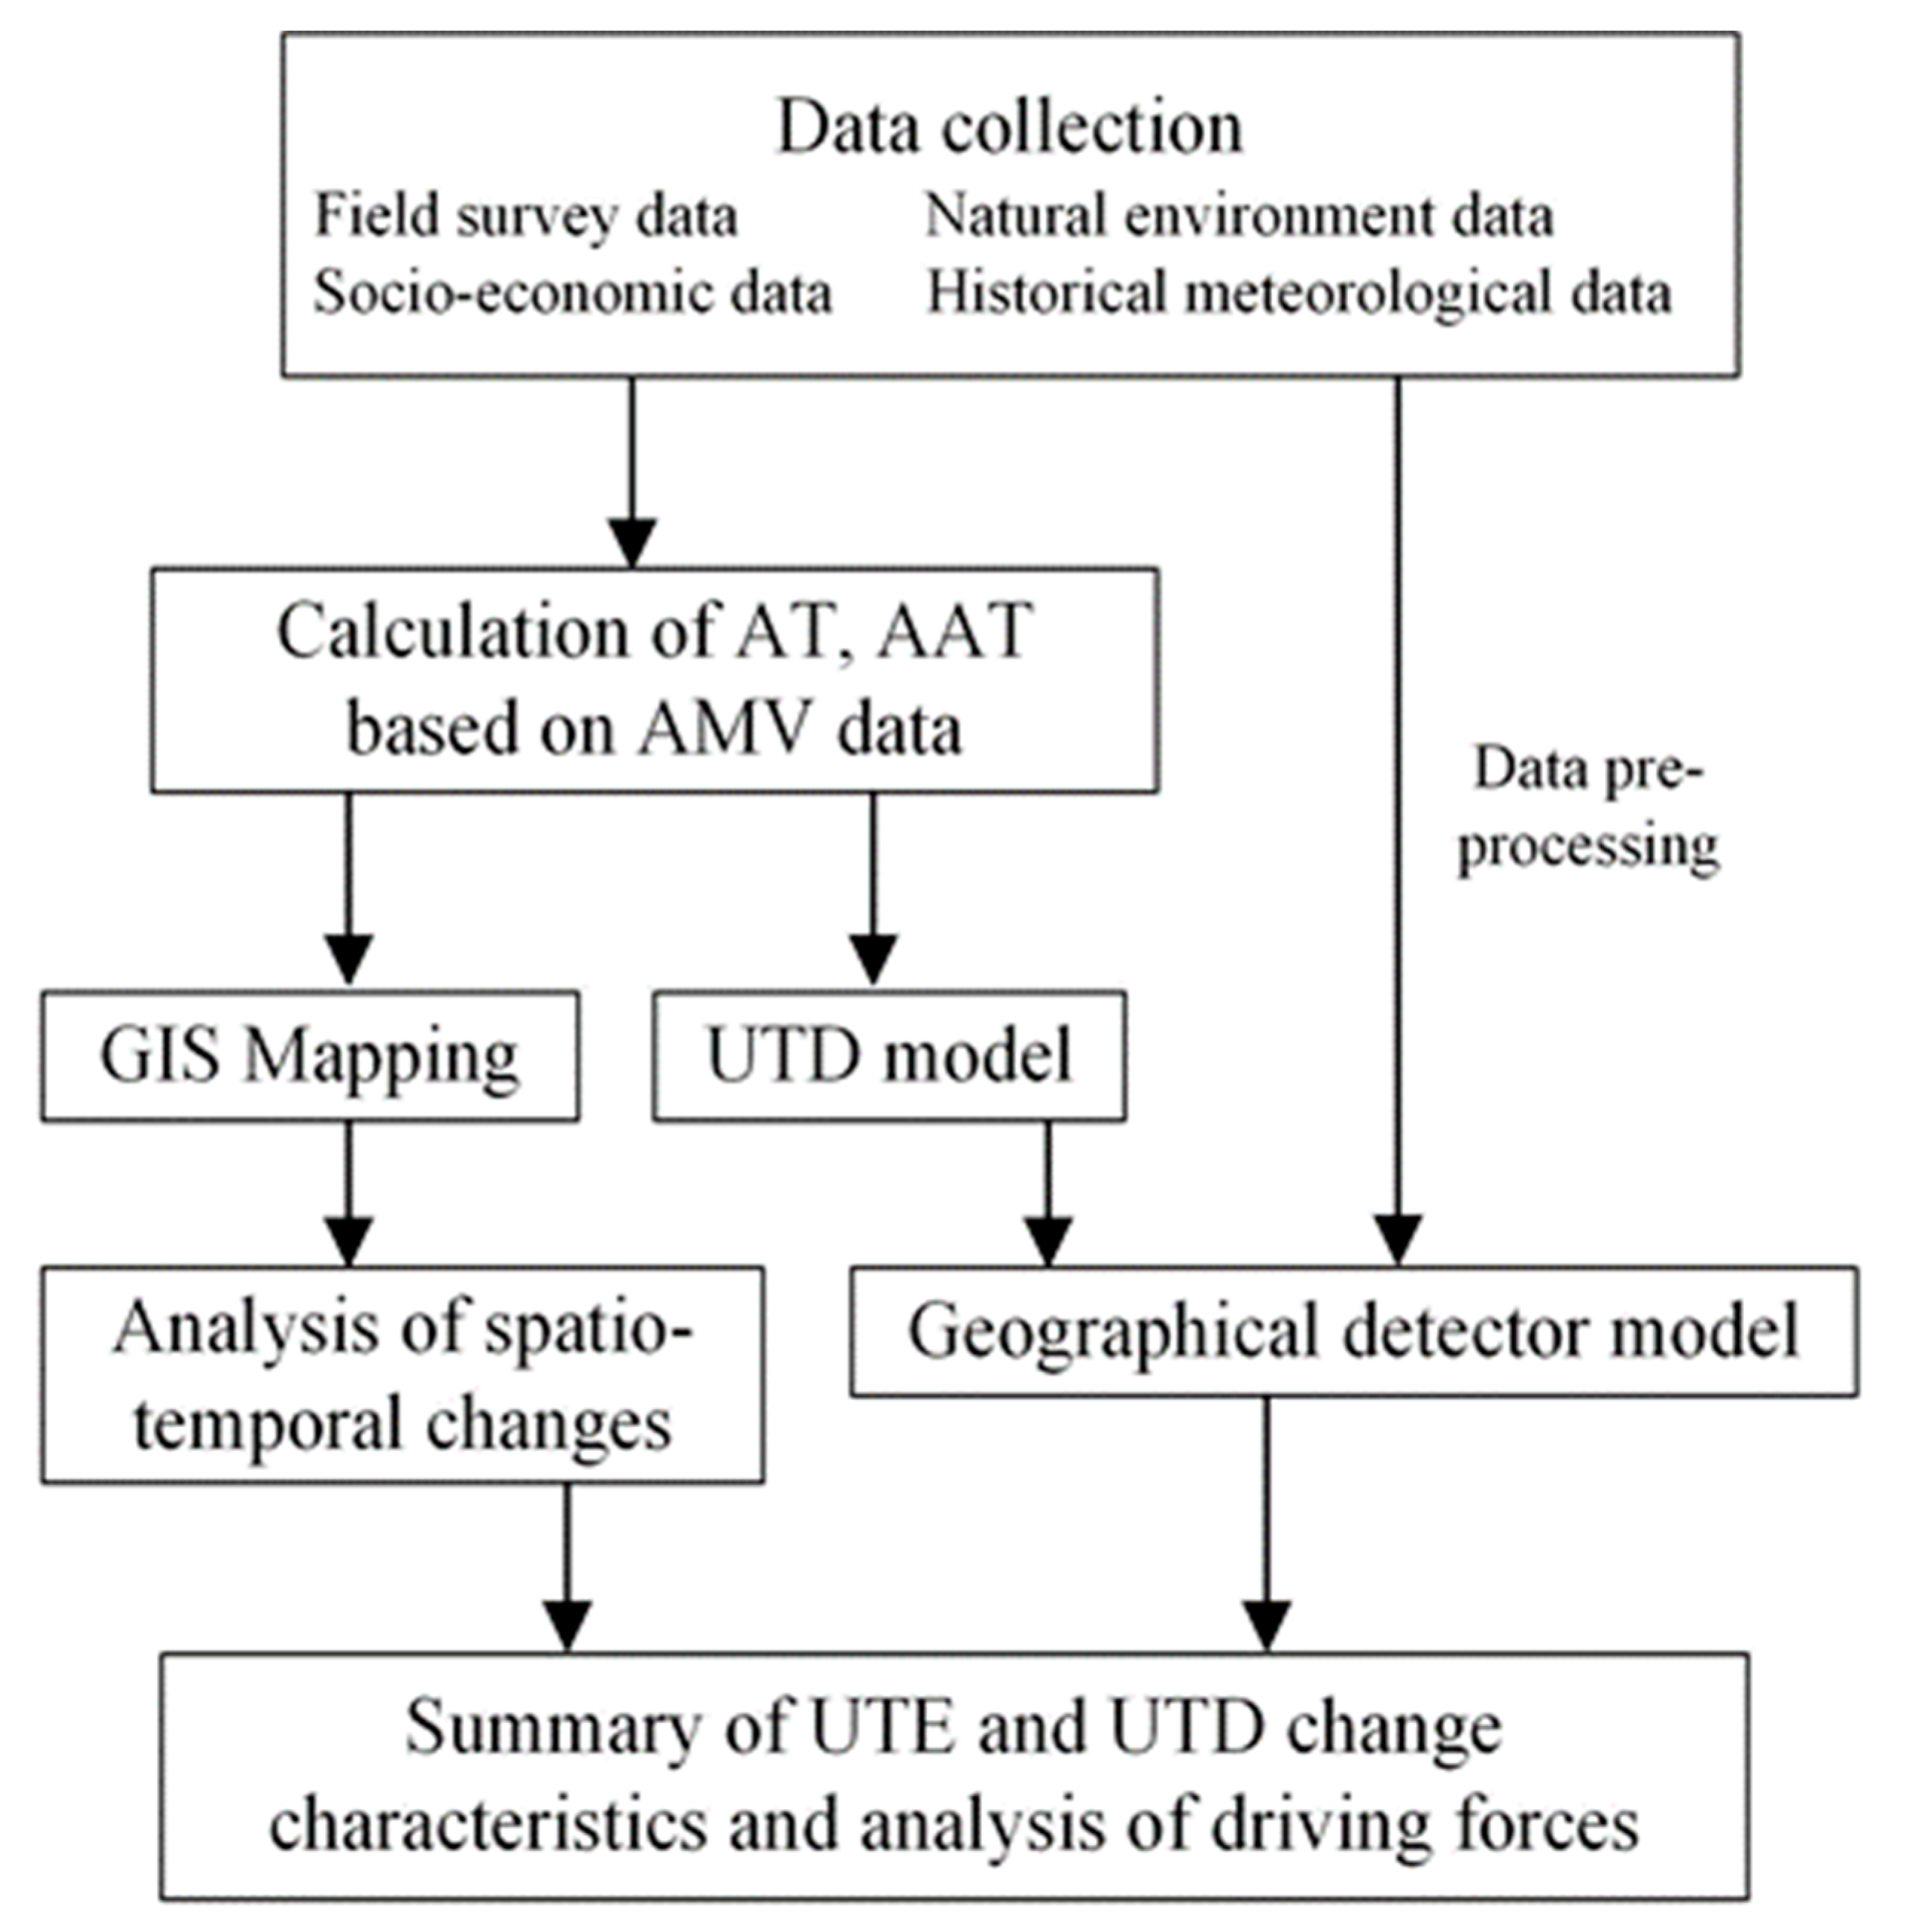
The daily AT data, including in-situ data of AT, near-surface tem perature, pressure, rainfall, humidity, evaporation, sunshine duration, maximum and minimum temperature, and hourly wind speed from 1970 to 2017, were used in this study (http://data.cma.cn/ (accessed on 7 September 2022)). Daily AT was observed at 99 stations, including 16, 18, and 15 rural background stations, and 17, 16, and 17 urban background stations in the SSA, CSA, and NSA, respectively (Figure 1b). All meteorological observation stations are automatic monitoring stations, with a height of 2–10 m, usually including global position system (GPS), sensors, collectors, power supply, communication interfaces, etc., which usually continuously observe, record, and transmit data using a wireless network on a 24 h basis. Meanwhile, seven natural and six socio-economic factors, including population, gross domestic product (GDP), urbanization rate, built-up area, green coverage rate, and park area per capita (http://tjj.shaanxi.gov.cn/tjsj/ (accessed on8 September 2022)), were selected for the correlation analysis of the temperature change response in the Southern, Central and Northern areas, respectively (Table 1). Four season observations were used, and the analysis was conducted for the daytime in this study.
Firstly, as the smallest unit of analysis, the monthly atmospheric temperature (MAT) was used. The AT was calculated by using the arithmetic mean value (AMV) of the daily temperature data. The annual atmospheric temperature (AAT) was calculated using MAT and AMV. Following that, a spatial and temporal distribution map of AAT in Shaanxi Province was developed using the Kriging interpolation method, using 1970, 1980, 1990, 2000, 2010, and 2017 as time nodes. In each time period, 99 stations were counted for statistics (Figure 2) and a change monitoring function based on ArcGIS10.5 software (State of California, USA) was used to generate maps of spatial change. After that, the UTD model was used to assess the changes in the spatial distribution of AAT. Finally, the Geo-explore model was used to explain the reasons for the uneven distribution of AT in the Southern, Central, and Northern areas of Shaanxi Province.1

2.3. Methods

2.3.1. Contagion Index

Landscape metrics are algorithms for quantifying a specific spatial configuration of various land uses [36], and can also be used for the analysis of UTE patterns. Based on the resampled AT maps with a resolution of 500 m × 500 m, Fragstats 4.0 was used to calculate the contagion index (CONTAG) of UTE based on the diversity and heterogeneity of the landscape [37].
C O N T A G = 1 + 2 ln   m 1 i = 1 m k = 1 m ( P i ) ( g i k / k = 1 m g i k ) ln   P i   ( g i k / k = i m g i k ) 100
where P i is the proportion of landscape occupied by patch type (class) i. gik is the number of adjacencies between pixels of path types (classes) i and k based on the double-count method. m is the number of patch types (classes) present in the landscape. The classes stand for the ultra-low, low, normal, high, and ultra-high temperature types, respectively, which were calculated by adding or subtracting 1 or 2 times the standard average temperature with a mean square error.

2.3.2. UTD Index

Contagion index describes the degree of aggregation or extension trend of different patch types in the landscape [38]. In order to quantitatively analyze the quantitative and spatial distribution characteristics of UTD, the UTD model was developed based on the contagion index. The formula is calculated as follows:
T Q = i = 1 m S i × I i   / i = 1 m S i
    U T D = T Q / C O N T A G
I = f t =           2 ,                         0     t <   T 2 m           1 ,     T 2 m t   < T m       0 ,             T m   t <   T + m       1 ,     T + m   t   <   T + 2 m 2 ,                               T + 2 m     1
T = ( T T m i n ) / ( T m a x T m i n )
where TQ means the area ratio of different heat island types; I i represents the different heat island types, which can be expressed by Equation (4), in which –2, –1, 0, 1, and 2 represent the ultra-low, low, normal, high, and ultra-high temperature areas, respectively; and T stands for the arithmetic mean value of the normalized temperature value as determined by Equation (5), which can be calculated by using the simple arithmetic mean model. m represents the mean square error of normalized temperature. S i represents the area occupied by different temperature types. i is the total number of heat island types in the landscape. UTD index stands for the ratio of TQ to landscape contagion index. Usually, the lower the contagion index, the higher the ratio of UTD, which means the higher the differentiation degree of UTE.

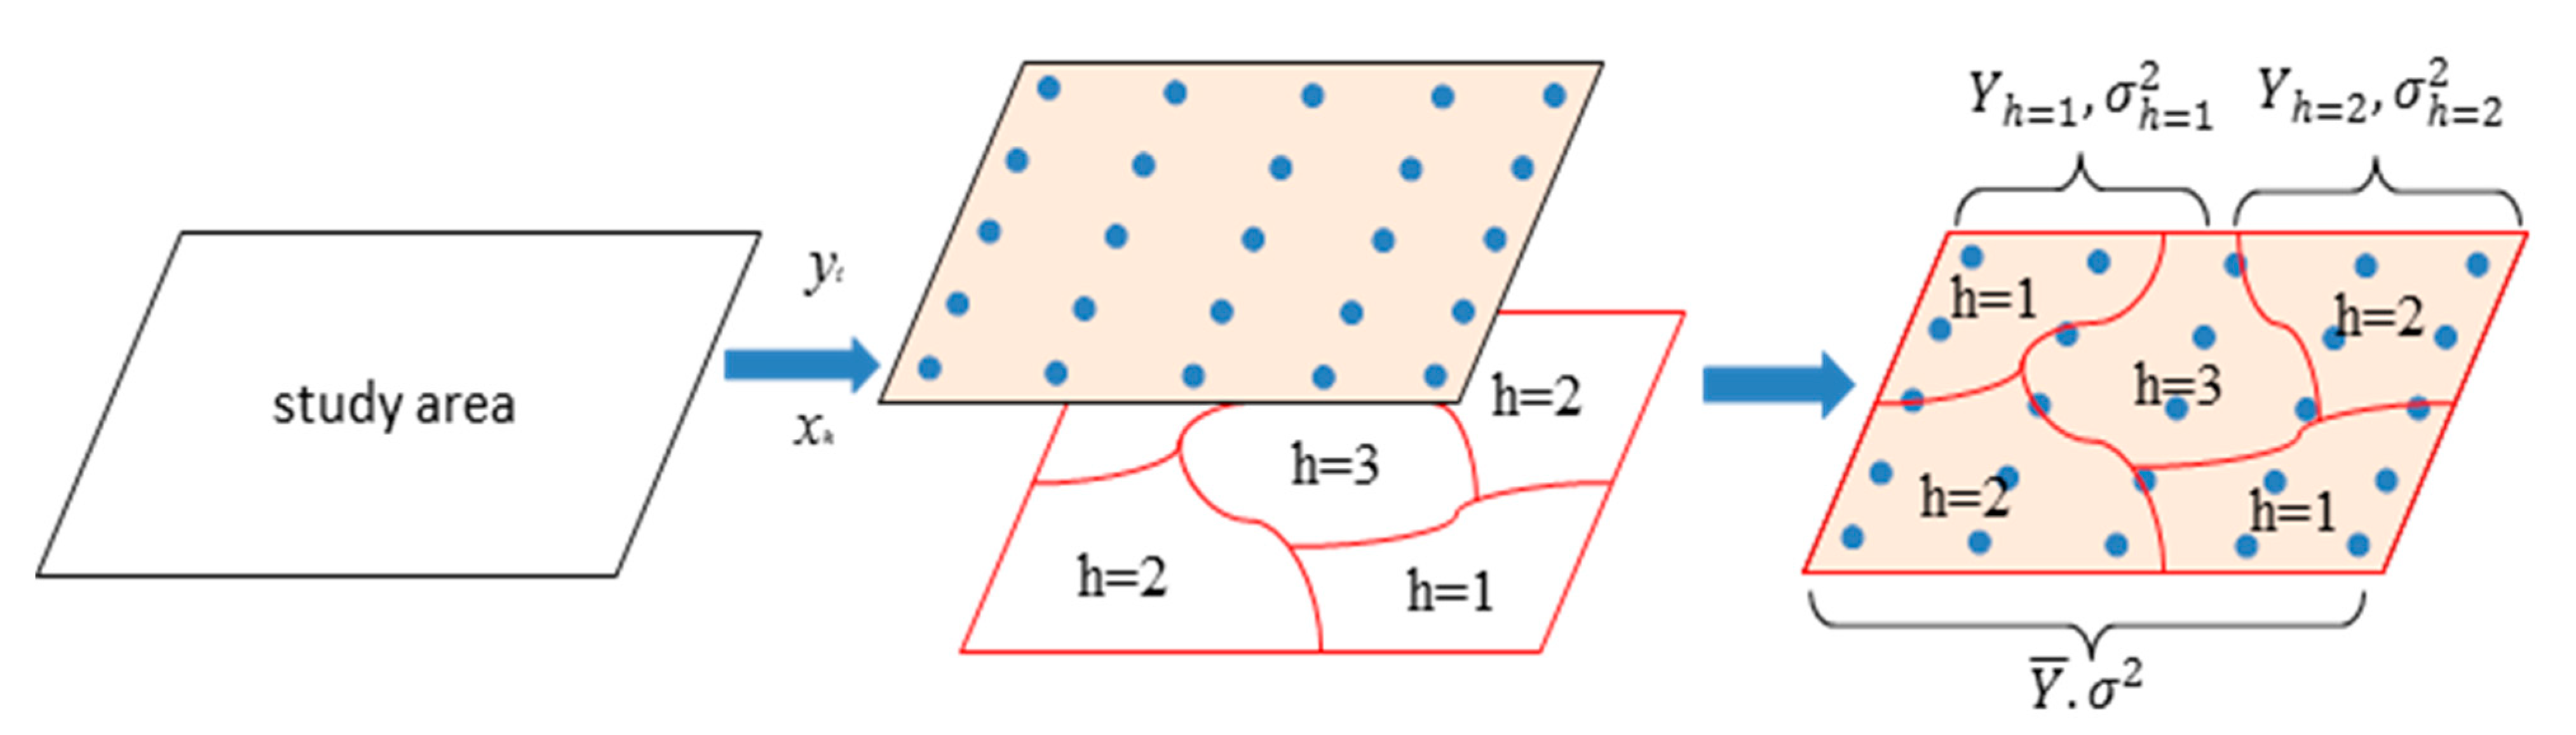
2.3.3. Geo-Explore Model

Spatial differentiation is one of the basic features of geographical phenomena [26]. Wang (2016) further developed a model that can be used to explain its formation reasons. The Geo-explore model usually consists of four parts: a factor detector, risk detector, ecological detector, and interaction detector [39]. In this study, the differentiation of UTE was calculated based on the differentiation and factor detection model (Figure 3).
The formula of the Geo-explore model is as follows:
  q = 1 h = 1 L N h σ h 2 N σ 2 = 1 S S W S S T
S S W = h = 1 L N h σ h 2
S S T = N σ 2
where h (h = 1,2……L) is the number of the layer Y or factor X; N h and N are the layer number and number of units in the whole study area; σ h 2 and σ 2 are the variance in the variables h and Y. SSW and SST are the sum of the squares and the total squares, respectively. q ranges from 0 to 1, where a higher number indicates that spatial differentiation of the study area becomes more serious. When q = 1, the variable Y is completely controlled by the factor X; when q = 0, there is no relationship between the variable Y and the factor X. In this study, the calculation and statistical analysis were conducted by the Python and Geo-explore models.

3. Results

3.1. Analysis of Spatio-Temporal Characteristics of AAT

During 1970−2017, the spatio-temporal distribution of the temperature was higher in the southeast and decreased in the northwest (Figure 4). Ankang City formed a lasting high-temperature center in the southern area. From 1970 to 2017, the temperature in the Central area increased steadily. From east to west, the average temperature decreased successively. The temperature decreased from east to west in the NSA.
The spatio-temporal change characteristics of UTE in the SSA, CSA, and NSA were different during the periods of 1970−1980, 1980−1990, 1990−2000, 2000−2010, and 2010−2017 (Figure 5). The spatio-temporal changes in different stages showed that the first changes occurred in the NSA during 1970−1980 (Figure 5a), where the maximum temperature increased by 2.1 °C. the second change was located in the eastern Central area, where the maximum temperature increased by 1.6 °C. The largest changes in the thermal environment were in the southeast and northeast of Shaanxi Province during the period of 1980−1990 (Figure 5b), with an increasing trend in Shaanxi Province during the period of 1990−2000 (Figure 5c). The fastest urbanization was also observed in the period of 2000−2010 (Figure 5d). The slight temperature changes are mainly distributed in the eastern and northern parts of Shaanxi Province (Figure 5e). The results showed that the greatest temperature changes were mostly located in the northwest of the NSA (Figure 5f).

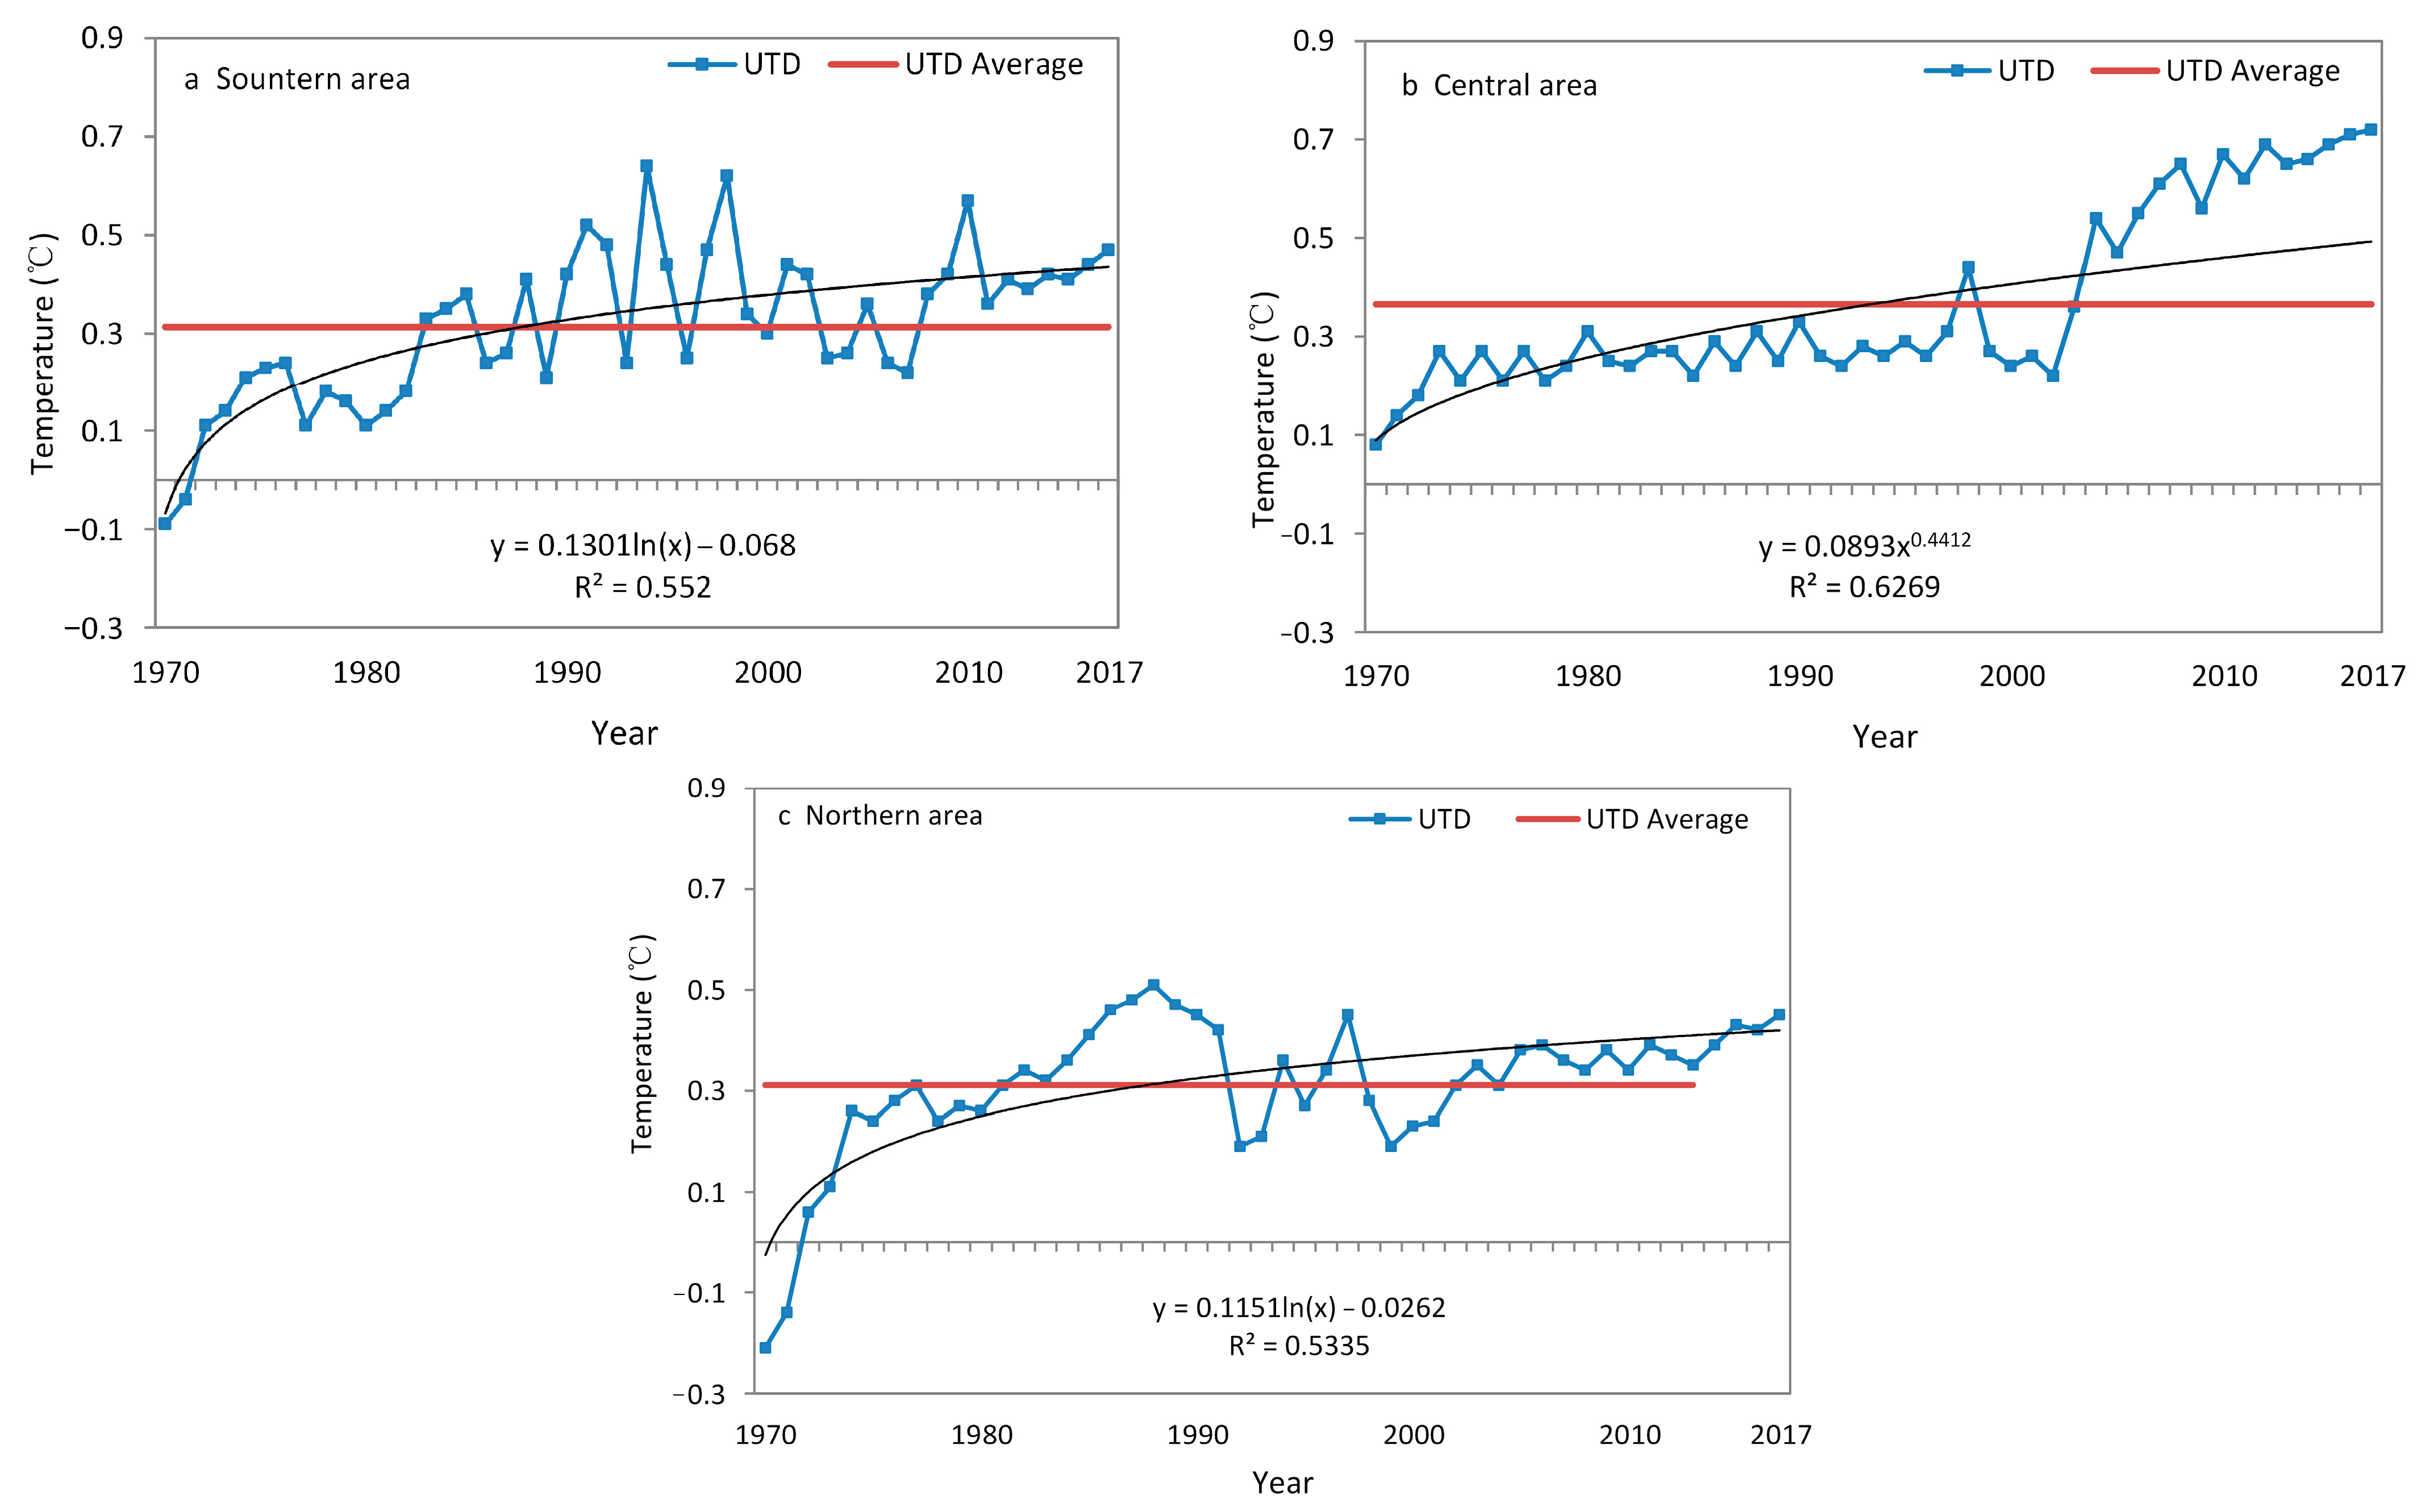
3.2. Analysis of the UTD Changes

The UTD index was calculated by formulas 2–4 (Table 2). According to Table 1, the UTD index increased significantly between 1970 and 1990 and between 2000 and 2010 by 0.51 and 0.27, respectively. The UTD index for the Southern area increased by 0.56, indicating aggravation of the UTD during 1970−2017, mainly between 1970 and 1990. During 1970−1980 and 2000−2017, the UTD index for the Central area increased significantly by 0.23 and 0.48, which was a significant increase in Shaanxi Province. As a result of the expansion of urban built-up areas and high population density, the UTD index of the Central area increased by 0.64 from 1970 to 2017, leading to an abnormal change. Additionally, the UTD index of the Northern area changed significantly during 1970−1990, with a cumulative increase of 0.66 in the past 20 years, making it the most dramatic region in Shaanxi during this period. The correlation coefficients between the UTD and the UTE are 0.55, 0.64, and 0.53, respectively. The below table shows that the value of the UTD is increasing, which means that the UTD is becoming more and more serious (Figure 6).

3.3. Analysis of the Causes of Temperature Spatio-Temporal Evolution

Using the Principal Component Analysis (PCA) method, seven natural factors, including altitude, surface temperature, precipitation, sunshine durations, average wind speed, evaporation, and relative humidity, were selected in order to further investigate the causes of temperature changes in different regions and times of the study area. In addition, six socio-economic factors were selected, such as population, green coverage fate, and park area per capita. In order to determine the correlation between the temperature change patterns and the influencing factors in the SSA, CSA, and NSA, the spatial detection and analysis model was used to analyze the relationship between AT change patterns and their driving factors in different regions in 2017 (Table 3 and Table 4), where their explanatory power and significance factor are, respectively, expressed as q and p.
According to Table 2, precipitation was the key factor influencing the AT in the Southern areas, followed by elevation and evaporation capacity. A key factor influencing the AT in the Central area was relative humidity, followed by surface temperature and elevation. The AT was most affected by evaporation in the Northern area, followed by elevation and relative humidity. According to the geographical scope of Shaanxi Province, there were differences in the factors influencing AT in different regions. Geographic detection also revealed that elevation, sunshine duration, relative humidity, and surface temperature were the four main natural factors influencing the AT in Shaanxi Province, with q values of 0.625, 0.612, 0.538, and 0.493, respectively. As a result, the elevation determines the regional temperature. According to Table 3, the main factor influencing the AT in the Southern and Central areas was park area per capita, followed by built-up area. In the Northern area, urbanization rate, GDP, and built-up area were the main factors influencing the AT. At the same time, geographical detection was conducted in the whole study area, and the results showed that the main socio-economic factors influencing the AT distribution in the entire area of Shaanxi Province were park area per capita, green coverage rate, and urbanization rate. The q values were 0.692, 0.613, and 0.517, respectively, indicating that socio-economic factors influenced the AT changes differently across geographical and climatic zones.

4. Discussion

As part of this study, we examined the spatio-temporal characteristics of the UTE in different regions in Shaanxi Province, as well as the factors that drive its distribution.
Because of an important trade center in the Southern area, Ankang City has become the second thermal center in the Southern area in terms of regional characteristics of the terrain, such as a basin in the Qinling Mountain abdomen, and rapid urbanization and urban population density after 2000, which contributed to the phenomenon. Located in the south piedmont of the Qinling Mountains, China’s climate demarcation line between north and south, Hanzhong is the gateway between Shaanxi and Sichuan Province. In the east of the Central area, Guanzhong plain had a larger population, was denser industry, and had a higher AAT than other areas. According to He et al. (2011) [33], the west of Baoji City is a mountainous area with a greater vegetation cover density than the Central area, as well as a relatively sparse population, a weak industrial density, and a smaller land carrying capacity, resulting in a lower AAT, which is consistent with Wang’s (2016) research findings [4].
Second, artificial construction activities in Shaanxi Province are closely related to the spatio-temporal variation in AAT (Figure 4), which may increase the intensity of UTE [18,41], resulting in the deterioration of the UTE in different areas between 1970 and 2017, including the Southern, Central, and Northern regions. This is consistent with previous studies conducted in Shaanxi Province [28,33] which found that significant changes in the UTE have been observed in the northwest and southeast of Shaanxi Province. Due to having imperious surfaces which absorb solar radiation and releasing long-wave radiation [28], which directly warms the air, vegetation reduces solar radiation.
Third, because of its relatively concentrated population distribution, large average population density, and diversified and rapid economic development [13], the Central area has become the largest area of UTE change in Shaanxi Province. Shaanxi Province’s “beautiful mountains project”, implemented at the end of the last century, contributed to the improvement of the whole environmental quality in the Northern area, not only improving the regional ecological environment but also contributing to the improvement of the region’s thermal environment. According to Wang et al. [4] (2016), the thermal environments in the SSA, CSA, and NSA are quite different, and the changes in the Central and Northern areas are significant. Considering that vegetation cools and humidifies the UTE, while man-made surfaces have the opposite effect, in their field measurements, Zhang [26] (2019) and Wang [4] (2016) also identified such gradients within urban land use and land cover (LULC). It is also widely accepted that changing LULC is one of the main factors influencing UTE change [5].
Lastly, the continuous rise of AT in Shaanxi Province over the past 47 years was a positive response to global warming. Second, it was closely related to the high-speed industrialization and urbanization process in Shaanxi Province. Statistics show that both of these factors, in Shaanxi Province, increased by an average of 15.8%, and 1.34% per year during the past 47 years. Our results revealed that the geographical latitudes of the Southern, Central, and Northern areas increased successively, with a minimum of 31.42 °C, a maximum of 39.35 °C, and a latitude difference of 753 m. According to the above analysis, the average AT was the highest in the SSA, followed by the CSA, and was lowest in the NSA. Meanwhile, the average elevations of the three areas were 1583, 520, and 1050 m, with Southern Shaanxi having the highest elevation, and Shangluo City having an elevation of 800 m; Ankang city had an elevation of 330 m, and Hanzhong City had an elevation of 510 m. the maximum temperature in Southern Shaanxi occurred in Ankang, and the minimum temperature occurred in the Shangluo area, which supports the general theory that, the higher the average elevation, the lower the AT. Our results were in accordance with MAT statistics at different stations. A linear correlation was found between the characteristics of temperature distribution in the Central area and its economy and industrialization. During rapid industrialization, large emissions of greenhouse gases were released, with cumulative and average annual growth rates of 6.8% and 7.1%, respectively, which contributed to the warming of local microclimates. The Northern area temperatures decreased from south to north and east to west. One reason for this was the temperature gradient characteristic, which was naturally formed by the geographical location difference; on the other hand, it was the moreso result of the higher industrialization level in the eastern part of the NSA than that in the western part of Shaanxi Province.

5. Conclusions

Through the use of the Geo-explore model, this study examined the spatio-temporal differentiation characteristics’ variation in UTE and its influencing factors. There was an overall increase in AAT differences between the Southern, Central, and Northern areas at different times. Spatio-temporal patterns of the AT showed a decreasing trend from south to north and east to west, with the most obvious changes in the northern area. The UTD performance was relatively stable, and the characteristics of mutation were demonstrated in the SSA, CSA, and NSA, with the NSA having the largest change range, followed by the SSA, and the CSA having the smallest change range. In Shaanxi Province, the differentiation of the UTE has increased since 2000 in different regions. According to the Geo-explorer model, elevation, sunshine duration, relative humidity, and surface temperature were the main factors influencing AT changes in Shaanxi Province. The AT changes were primarily influenced by the park area per capita, green coverage rate, and urbanization rate, with urbanization causing most of the changes in UTE in the Central area of Shaanxi Province. The purpose of this study is to provide a scientific basis for mitigating UTE, as well as practical guidelines for mitigating the UTE by improving our understanding of how the AT interacts with natural and socioeconomic factors.
However, we only conducted our study in one province using in-situ observation. Despite the fact that observations were conducted at various stations, the data from a limited number of stations does not represent the full range of UTE. UTD indexes calculated using a limited number of stations may vary with the selection of stations, resulting in the uncertainty of this study. Meanwhile, this study only analyzed the UTE characteristics and their influencing factors during the daytime, without considering the nighttime UTE characteristics and their influencing factors. For future studies, not only the nighttime UTE characteristics should be considered, but also more observation stations will be needed to increase the reliability of the results. Although our results are consistent with many previous studies, it is possible that the UTD in other provinces may show different patterns. In the future, relative humidity will also need to be studied. It is also necessary to conduct a comparison among different cities.

Author Contributions

Conceptualization, X.F. and M.L.; methodology, M.L.; Software, Z.Z.; Validation, X.F. and M.L.; formal analysis, S.S.; investigation, M.L.; data curation, M.L. and Y.W.; writing—original draft, X.F.; writing—review & editing, S.S. and F.L.; visualization, Y.W.; supervision, F.L.; funding acquisition, F.L. and X.F. All authors have read and agreed to the published version of the manuscript.

Funding

This research was funded by National Natural Science Foundation of China, grant number 51608419, and Social Science Foundation of Shaanxi Province, grant number 2023F014.

Institutional Review Board Statement

Not applicable.

Informed Consent Statement

Not applicable.

Data Availability Statement

Not applicable.

Conflicts of Interest

The authors declare no conflict of interest.

References

  1. Xia, T.; Wang, J.; Song, K.; Da, L. Variations in air quality during rapid urbanization in Shanghai, China. Landsc. Ecol. Eng. 2014, 10, 181–190. [Google Scholar] [CrossRef]
  2. Cao, C.; Lee, X.; Liu, S.; Schultz, N.; Xiao, W.; Zhang, M.; Zhao, L. Urban heat islands in China are enhanced by haze pollution. Nat. Commun. 2016, 7, 12509. [Google Scholar] [CrossRef] [PubMed]
  3. Lee, Y.; Din, M.; Ponraj, M.; Noor, Z.; Iwao, K.; Chelliapan, S. Overview of urban heat island (UHI) phenomenon towards human thermal comfort. Environ. Eng. Manag. J. 2017, 16, 2097–2112. [Google Scholar]
  4. Wang, Z.; Luo, H.; Li, Y.; Li, H. Effects of Urbanization on Temperatures over the Qinling Mountains in the Past 50 Years. J. Appl. Meteorol. Sci. 2016, 27, 87–96. [Google Scholar]
  5. Ren, Z.; He, X.; Pu, R.; Zheng, H. The impact of urban forest structure and its spatial location on urban cool island intensity. Urban Ecosyst. 2018, 21, 863–874. [Google Scholar] [CrossRef]
  6. Salata, F.; Golasi, L.; Petitti, D.; Vollaro, E.; Coppi, M.; Vollaro, A. Relating microclimate, human thermal comfort and health during heat waves: An analysis of heat island mitigation strategies through a case study in an urban outdoor environment. Sustain. Cities Soc. 2017, 30, 79–96. [Google Scholar] [CrossRef]
  7. Wong, L.; Alias, H.; Aghamohammadi, N.; Aghazadeh, S.; Sulaiman, N. Physical, Psychological, and Social Health Impact of Temperature Rise Due to Urban Heat Island Phenomenon and Its Associated Factors. Biomed. Environ. Sci. 2018, 31, 545–550. [Google Scholar]
  8. Carlson, T. Applications of remote sensing to urban problems. Remote Sens. Environ. 2003, 86, 273–274. [Google Scholar] [CrossRef]
  9. Amiri, R.; Weng, Q.; Alimohammadi, A.; Alvipanah, S. Spatial–temporal dynamics of land surface temperature in relation to fractional vegetation cover and land use/cover in the Tabriz urban area, Iran. Remote Sens. Environ. 2009, 113, 2606–2617. [Google Scholar] [CrossRef]
  10. Ren, Z.; Li, Z.; Wu, F.; Ma, H.; Xu, Z.; Jiang, W.; Wang, S.; Yang, J. Spatiotemporal Evolution of the Urban Thermal Environment Effect and Its Influencing Factors: A Case Study of Beijing, China. Int. J. Geo-Inf. 2022, 11, 278. [Google Scholar] [CrossRef]
  11. Sun, K.; Cheng, S. Genetic algorithm-based surface component temperatures retrieval by integrating MODIS TIR DATA from Terra and Aqua satellites. J. Infrared Millim. Waves 2012, 31, 462–468. [Google Scholar] [CrossRef]
  12. Huang, M.; Yue, W.; Xiang, H. Correlation analysis between land surface thermal environment and landscape change and its scale effect in Chaohu Basin. China Environ. Sci. 2017, 37, 3123–3133. [Google Scholar]
  13. Jin, K.; Wang, F.; Zong, Q.; Qin, P.; Liu, C. Impact of variations in vegetation on surface air temperature change over the Chinese Loess Plateau. Sci. Total Environ. 2020, 716, 136967. [Google Scholar] [CrossRef] [PubMed]
  14. Cai, Y.; Chen, Y.; Tong, C. Spatiotemporal evolution of urban green space and its impact on the urban thermal environment based on remote sensing data: A case study of Fuzhou City, China. Urban For. Urban Green. 2019, 41, 333–343. [Google Scholar] [CrossRef]
  15. Ren, Y.; Parker, D.; Ren, G.; Dunn, R. Tempo-spatial characteristics of sub-daily temperature trends in mainland China. Clim. Dyn. 2015, 46, 2737–2748. [Google Scholar] [CrossRef]
  16. Yao, R.; Wang, L.; Huang, X.; Niu, Y.; Chen, Y.; Niu, Z. The influence of different data and method on estimating the surface urban heat island intensity. Ecol. Indic. 2018, 89, 45–55. [Google Scholar] [CrossRef]
  17. Chen, X.; Zhang, Y. Impacts of urban surface characteristics on spatiotemporal pattern of land surface temperature in Kunming of China. Sustain. Cities Soc. 2017, 32, 87–99. [Google Scholar] [CrossRef]
  18. Liu, H.; Huang, B.; Gao, S.; Wang, J.; Yang, C.; Li, R. Impacts of the evolving urban development on intra-urban surface thermal environment: Evidence from 323 Chinese cities. Sci. Total Environ. 2021, 771, 144810. [Google Scholar] [CrossRef]
  19. Zhang, P.; Bounoua, L.; Imhoff, M.; Wolfe, R.; Thome, K. Comparison of MODIS land surface temperature and air temperature over the continental USA meteorological stations. Can. J. Remote Sens. 2014, 40, 110–122. [Google Scholar]
  20. Berg, E.; Kucharik, C. The dynamic relationship between air and land surface temperature within the Madison, Wisconsin urban heat island. Remote Sens. 2022, 14, 165. [Google Scholar] [CrossRef]
  21. Trotter, L.; Dewan, A.; Robinson, T. Effects of rapid urbanization on the urban thermal environment between 1990 and 2011 in Dhaka Megacity, Bangladesh. AIMS Environ. Sci. 2017, 4, 145–167. [Google Scholar] [CrossRef]
  22. Kumi-Baoteng, B.; Stemn, E.; Agyapong, A. Effect of urban growth on urban thermal environment: A case study of Sekondi-Takoradi Metropolis of Ghana. J. Environ. Earth Sci. 2015, 5, 32–41. [Google Scholar]
  23. Lee, P.S.H.; Park, J. An effect of urban forest on urban thermal environment in Seoul, South Korea, based on Landsat imagery analysis. Forests 2020, 11, 630. [Google Scholar] [CrossRef]
  24. Watson, F.; Lockwood, R.; Newman, W.; Aderson, T.; Garrott, R. Development and comparison of Landsat radiometric and snowpack model inversion techniques for estimating geothermal heat flux. Remote Sens. Environ. 2008, 112, 471–481. [Google Scholar] [CrossRef]
  25. Wu, J.; Li, X.; Li, S.; Liu, C.; Yi, T.; Zhao, Y. Spatial heterogeneity and attribution analysis of urban thermal comfort in China from 2000 to 2020. Int. J. Environ. Res. Public Health 2022, 19, 5683. [Google Scholar] [CrossRef]
  26. Zhang, Y.; Wang, X.; Balzter, H.; Qiu, B.; Cheng, J. Directional and zonal analysis of urban thermal environmental change in Fuzhou as an indicator of urban landscape transformation. Remote Sens. 2019, 11, 2810. [Google Scholar] [CrossRef]
  27. Ye, H.; Li, Z.; Zhang, N.; Leng, X.; Meng, D.; Zheng, J.; Li, Y. Variations in the effects of landscape patterns on the urban thermal environment during rapid urbanization (1990–2020) in megacities. Remote Sens. 2021, 13, 3415. [Google Scholar] [CrossRef]
  28. Ji, Y.; Peng, Y.; Li, Z.; Li, J.; Liu, S.; Cai, X.; Yin, Y.; Feng, T. Driving Mechanism of Differentiation in Urban Thermal Environment during Rapid Urbanization. Remote Sens. 2023, 15, 2075. [Google Scholar] [CrossRef]
  29. Hokao, K.; Phonekeo, V.; Srivanit, M. Assessing the impact of urbanization on urban thermal environment: A case study of Bangkok Metropolitan. Int. J. Appl. Sci. Technol. 2012, 2, 243–256. [Google Scholar]
  30. Sharmin, T.; Steemers, K.; Matzarakis, A. Microclimatic modelling in assessing the impact of urban geometry on urban thermal environment. Sustain. Cities Soc. 2017, 34, 293–308. [Google Scholar] [CrossRef]
  31. Tian, Z.; Zhu, N.; Liu, J. Relationship Between Heat Island Effect and Artificial Factors. J. Tianjin Univ. 2005, 38, 380–383. [Google Scholar]
  32. Xiong, Y.; Zhang, F. Effect of human settlements on urban thermal environment and factor analysis based on multi-source data: A case study of Changsha city. J. Geogr. Sci. 2021, 31, 819–838. [Google Scholar] [CrossRef]
  33. He, Y.; Zhang, L. Temporal and spatial characteristics of climatic change from 1980 to 2006 in Shaanxi Province. J. Arid Land Resour. Environ. 2011, 25, 59–63. [Google Scholar]
  34. Kalnay, E.; Cai, M. Impact of Urbanization and Land-use change on Climate. Nature 2003, 423, 528–531. [Google Scholar] [CrossRef]
  35. Arnfield, A.J. “Köppen Climate Classification”. Encyclopedia Britannica, 7 April 2023. Available online: https://www.britannica.com/science/Koppen-climate-classification (accessed on 23 April 2023).
  36. Kevin, M.; Barbara, J. FRAGSTATS—Spatial Pattern Analysis Program for Quantifying Landscape Structure; USDA Forest Service, Pacific Northwest Research Station: Portland, OR, USA, 1995; pp. 58–59.
  37. Ji, W.; Ma, J.; Twibell, R.; Underhill, K. Characterizing urban sprawl using multi-stage remote sensing images and landscape metrics. Computers. Environ. Urban Syst. 2006, 30, 861–979. [Google Scholar] [CrossRef]
  38. Wu, Q.; Tan, J.; Guo, F.; Li, H.; Chen, S. Multi-Scale Relationship between Land Surface Temperature and Landscape Pattern Based on Wavelet Coherence: The Case of Metropolitan Beijing, China. Remote Sens. 2019, 11, 3021. [Google Scholar] [CrossRef]
  39. Wang, H.; Huang, S.; Ren, Y.; He, L.; Xiao, B. Preliminary analysis of the subsurface temperature and air temperature changes in Xi’an, China. Chin. J. Geol. 2014, 3, 874–887. [Google Scholar]
  40. Wang, J.; Xu, C. Geodetector: Principle and prospective. Acta Geogr. Sin. 2017, 72, 116–134. [Google Scholar]
  41. Qiang, C.; Leydon, J.; He, Y. Impact of COVID-19 Restrictions on the Urban Thermal Environment of Edmonton, Canada. Environ. Manag. 2023, 72, 862–882. [Google Scholar] [CrossRef]
Figure 1. Geographic location. (a) Shaanxi Province, (b) location of meteorological observation stations.
Sustainability 15 13206 g001
Figure 2. Methodology flowchart.
Sustainability 15 13206 g002
Figure 3. The principle of Geo-explore model [40].
Sustainability 15 13206 g003
Figure 4. The AAT map of Shaanxi Province from 1970 to 2017; (a) 1970, (b) 1980, (c) 1990, (d) 2000, (e) 2010, (f) 2017.
Sustainability 15 13206 g004
Figure 5. Changes in thermal environment of Shaanxi Province; (a) 1970–1980, (b) 1980–1990, (c) 1990–2000, (d) 2000–2010, (e) 2010–2017, (f) 1970–2017.
Sustainability 15 13206 g005
Figure 6. The changes in UTD in Shaanxi Province.
Sustainability 15 13206 g006
Table 1. The information of data collection.
ParameterSpecific ElementsUnitDataData Sources
Daily AT dataAir temperature°C1970–2017http://data.cma.cn (accessed on 8 September 2022)
Near-surface temperature°C
PressurePa
Rainfallmm
Humidity%rh
Evaporationmm
Sunshine durationh
Maximum and minimum temperature°C
Hourly wind speedm/s
Natural factorsRelative humidity%1970–2017http://tjj.shaanxi.gov.cn/tjsj/ (accessed on 9 September 2022)
Surface temperature°C
Evaporation capacitymm
Sunshine durationh
Average wind speedm/s
Precipitationmm
Socio-economic factorsPopulationNP1960–2017http://tjj.shaanxi.gov.cn/tjsj/ndsj/tjnj/ (accessed on 15 September 2022)
or http://tjj.xa.gov.cn/tjsj/tjxx/1.html (accessed on 15 September 2022)
Gross domestic productBillion1970–2017
Urbanization rate%
Built-up areaKm21970,1980,1990–2020
Green coverage rate%1970,1980,1990,2000–2017
Park area per capitaM2/per capita1970–2017
Table 2. The UTD of thermal environment in Shaanxi Province.
AreaSouthern AreaCentral AreaNorthern Area
YearUTDUTDUTD
1970−0.090.08−0.21
19800.110.310.26
19900.420.330.45
20000.300.240.23
20100.570.670.34
20170.470.720.45
Table 3. Results of seven natural factors influencing AT in different areas of Shaanxi Province in 2017.
FactorsSouthern AreaCentral AreaNorthern Area
q
Value
p
Value
Sorting of
q Values
q
Value
p
Value
Sorting of
q Values
q
Value
p ValueSorting of
q Values
Relative humidity0.0101.00070.4281.00010.1770.9473
Surface temperature0.1281.00060.3871.00020.0611.0005
Evaporation capacity0.2490.99920.0891.00040.5470.0001
Sunshine duration0.1760.14440.0001.00070.1591.0004
Average wind speed0.1581.00050.0561.00050.0261.0006
Precipitation0.6290.00710.0231.00060.0001.0007
Average elevation0.2351.00030.3551.00030.4320.9992
Table 4. Results of six socio-economic factors influencing AT in different areas of Shaanxi Province in 2017.
FactorSouthern AreaCentral AreaNorthern Area
q
Value
p
Value
Sorting of
q Values
q
Value
p
Value
Sorting of
q Values
q
Value
p
Value
Sorting of
q Values
Population0.0221.00050.0851.00050.0251.0006
GDP0.0031.00060.1491.00040.3220.6272
Urbanization rate0.0331.00040.0461.00060.3770.9991
Built-up area0.3180.00320.2001.00020.2241.0003
Green coverage rate0.0781.00030.1891.00030.0311.0005
Park area per capita0.6530.00010.4780.98810.0341.0004
Disclaimer/Publisher’s Note: The statements, opinions and data contained in all publications are solely those of the individual author(s) and contributor(s) and not of MDPI and/or the editor(s). MDPI and/or the editor(s) disclaim responsibility for any injury to people or property resulting from any ideas, methods, instructions or products referred to in the content.

