1. Introduction
The current global food system is responsible for up to a third of total global greenhouse gas (GHG) emissions [
1,
2]. The majority of these emissions are due to livestock farming, both as direct emissions, especially from ruminants, and due to soil emissions from large areas that are used for the cultivation of animal feed [
3,
4]. One estimate suggests that 20% of the total global GHG emissions are directly related to livestock [
5], and a recent study found that phasing out animal agriculture would contribute half of the reductions necessary to limit global warming to 2.0 °C by 2100 [
6]. Reducing the climate impact of our food systems is thus vital to reach the reduction targets specified in the Paris Agreement, and global transition to a more plant-based diet is an important option for achieving this aim [
6,
7,
8].
In Denmark, the municipality of Copenhagen is currently pursuing the aim of reducing GHG emissions from its public kitchens by at least 25% per capita by 2025 relative to 2018 levels [
9], and the ambition of the target is expected to increase. Most municipalities and regions in Denmark are not yet at a point in their sustainability efforts where they have started considering quantified reductions in food-related emissions and dietary changes [
10]. Quantifying a reduction in emissions from public kitchens requires both attention to the different conditions in the institutions providing meals and an understanding of how the choice of methodology impacts the estimated benefit of dietary interventions. Generally, the choice of LCA approach has the potential to significantly affect the result, especially when assessing production systems with multiple products to which the total environmental impacts of production must be allocated [
11,
12,
13]. The estimated effect of dietary changes and the relative importance of alterations in food procurement for public kitchens can thus be significantly influenced by the choice of the assessment method.
Additionally, to eventually achieve lasting and society-wide transformation of the average citizen’s diet, attention to food habits is required. Dietary habits formed in childhood are believed to last into adulthood, and the formation of these habits and preferences are heavily influenced by the food environment during childhood [
14]. It is well known that the socioeconomic status and the food consumed at home affects the future dietary habits of children [
15], and providing healthy and sustainable alternatives in schools and other institutions can potentially aid in the development of better habits. Developing the taste for a sustainable diet in childhood can be an important part of gradually achieving more sustainable preferences in the population as a whole. Pertinently placed for this, Copenhagen has 15 so-called “Food Schools”. In this subset of the municipality’s 70 public schools, lunch is prepared on the school premises instead of being delivered from a central kitchen, and food education and participation in preparation of the food is incorporated into the curriculum to varying extents [
16]. The Food Schools are part of a larger trend that has taken place in public kitchens of Copenhagen during the last decade. The share of organic food in public meals was increased to 87% by 2017 without an increase in the costs through a combination of changing tender requirements and working together with the kitchens [
9]. Importantly, all food procurement is documented, so it is possible to determine the climate impact of the current diet and implement possible changes to this diet while considering variations between assessment methods. Additionally, by selecting schools with different base conditions, such as pupil composition and dietary requirements, the importance of an individualized approach and the potential impact of differences between schools can also be addressed.
As part of research into the transition of food procurement in public kitchens, the Copenhagen House of Food, the University of Copenhagen, World Resources Institute and Potsdam Institute for Climate Research collaborated on the Climate KIC project “Shifting Urban Diets” led by the EAT Foundation. The project focused on implementing the EAT-Lancet recommendations for a local adaptation of the Planetary Health Diet [
17] in the Municipality of Copenhagen, which the Danish Food Based Dietary Guidelines are a local adaptation of. This study originated as part of this collaboration.
Previous studies have reported on the significant climate mitigation potential of transitioning to more plant-based diets [
2,
3,
18,
19,
20] and the effects of the choice of LCA methodology on the estimated emissions related to certain food items [
11,
12,
13]. A previous study calculated the effect on GHG emissions of transitioning from the current average Danish diet to consumption aligned with the national dietary guidelines using two different LCA databases [
21]. This study adds to the previous one by using other databases and focusing specifically on institutional kitchens. In the context of institutions, a few studies have investigated food-related GHG emissions in different ways, such as based on specific meal plans [
22] and as part of a project aimed at reducing emissions across multiple activities in schools with a focus on student involvement [
23]. Finally, a previous Danish study estimated the dietary changes necessary in childcare facilities in Copenhagen to achieve the 25% reduction goal of the municipality [
24], which this study complements by focusing on schools.
This study adds to previous research by (i) combining input directly from school kitchens and dialogue with staff with detailed procurement data documenting the actual food purchased over a year, (ii) demonstrating the complexity of this type of assessment by including three different databases of food emission factors compiled using different LCA methodologies in the context of specific case studies, and (iii) highlighting differences in the baseline food procured by three school kitchens that were selected as cases and potential differences in the effect on emissions of specific transition scenarios at the individual school level.
The objectives were firstly to determine the baseline GHG emissions from food procured by the kitchens of three selected Food Schools and subsequently calculate scenarios for reducing food-related GHG emissions of school kitchens. The calculations were carried out using three databases based on different LCA methodologies to investigate the importance of methodology on the result. The assessment took into account differences between the schools and their local constraints and preferences to showcase how scenarios of this kind cannot be centrally decided upon but rather have to be tailored to conditions in the individual institution. An additional objective was to assess the potential effect of implementing the scenarios on the food expenditure of schools to ensure that changes to the diet would not have negative effects on the budget.
2. Methods
2.1. Schools Included in the Study
Three Food Schools in Copenhagen were included in this study. Two of the three schools are ordinary public schools, while the third is a smaller public school specifically for pupils with special needs, such as ADHD and autism (
Table 1). The schools were chosen for the study based on their willingness to participate. The schools are located in different parts of the city, which affects the composition of the student body. It was required that the schools provided data about their procurement during a year and that they were willing to participate in preparatory interviews and research visits conducted by students. The schools comprise 20% of Copenhagen’s total number of Food Schools.
2.2. Assessment of Baseline GHG Emissions from the School Kitchens
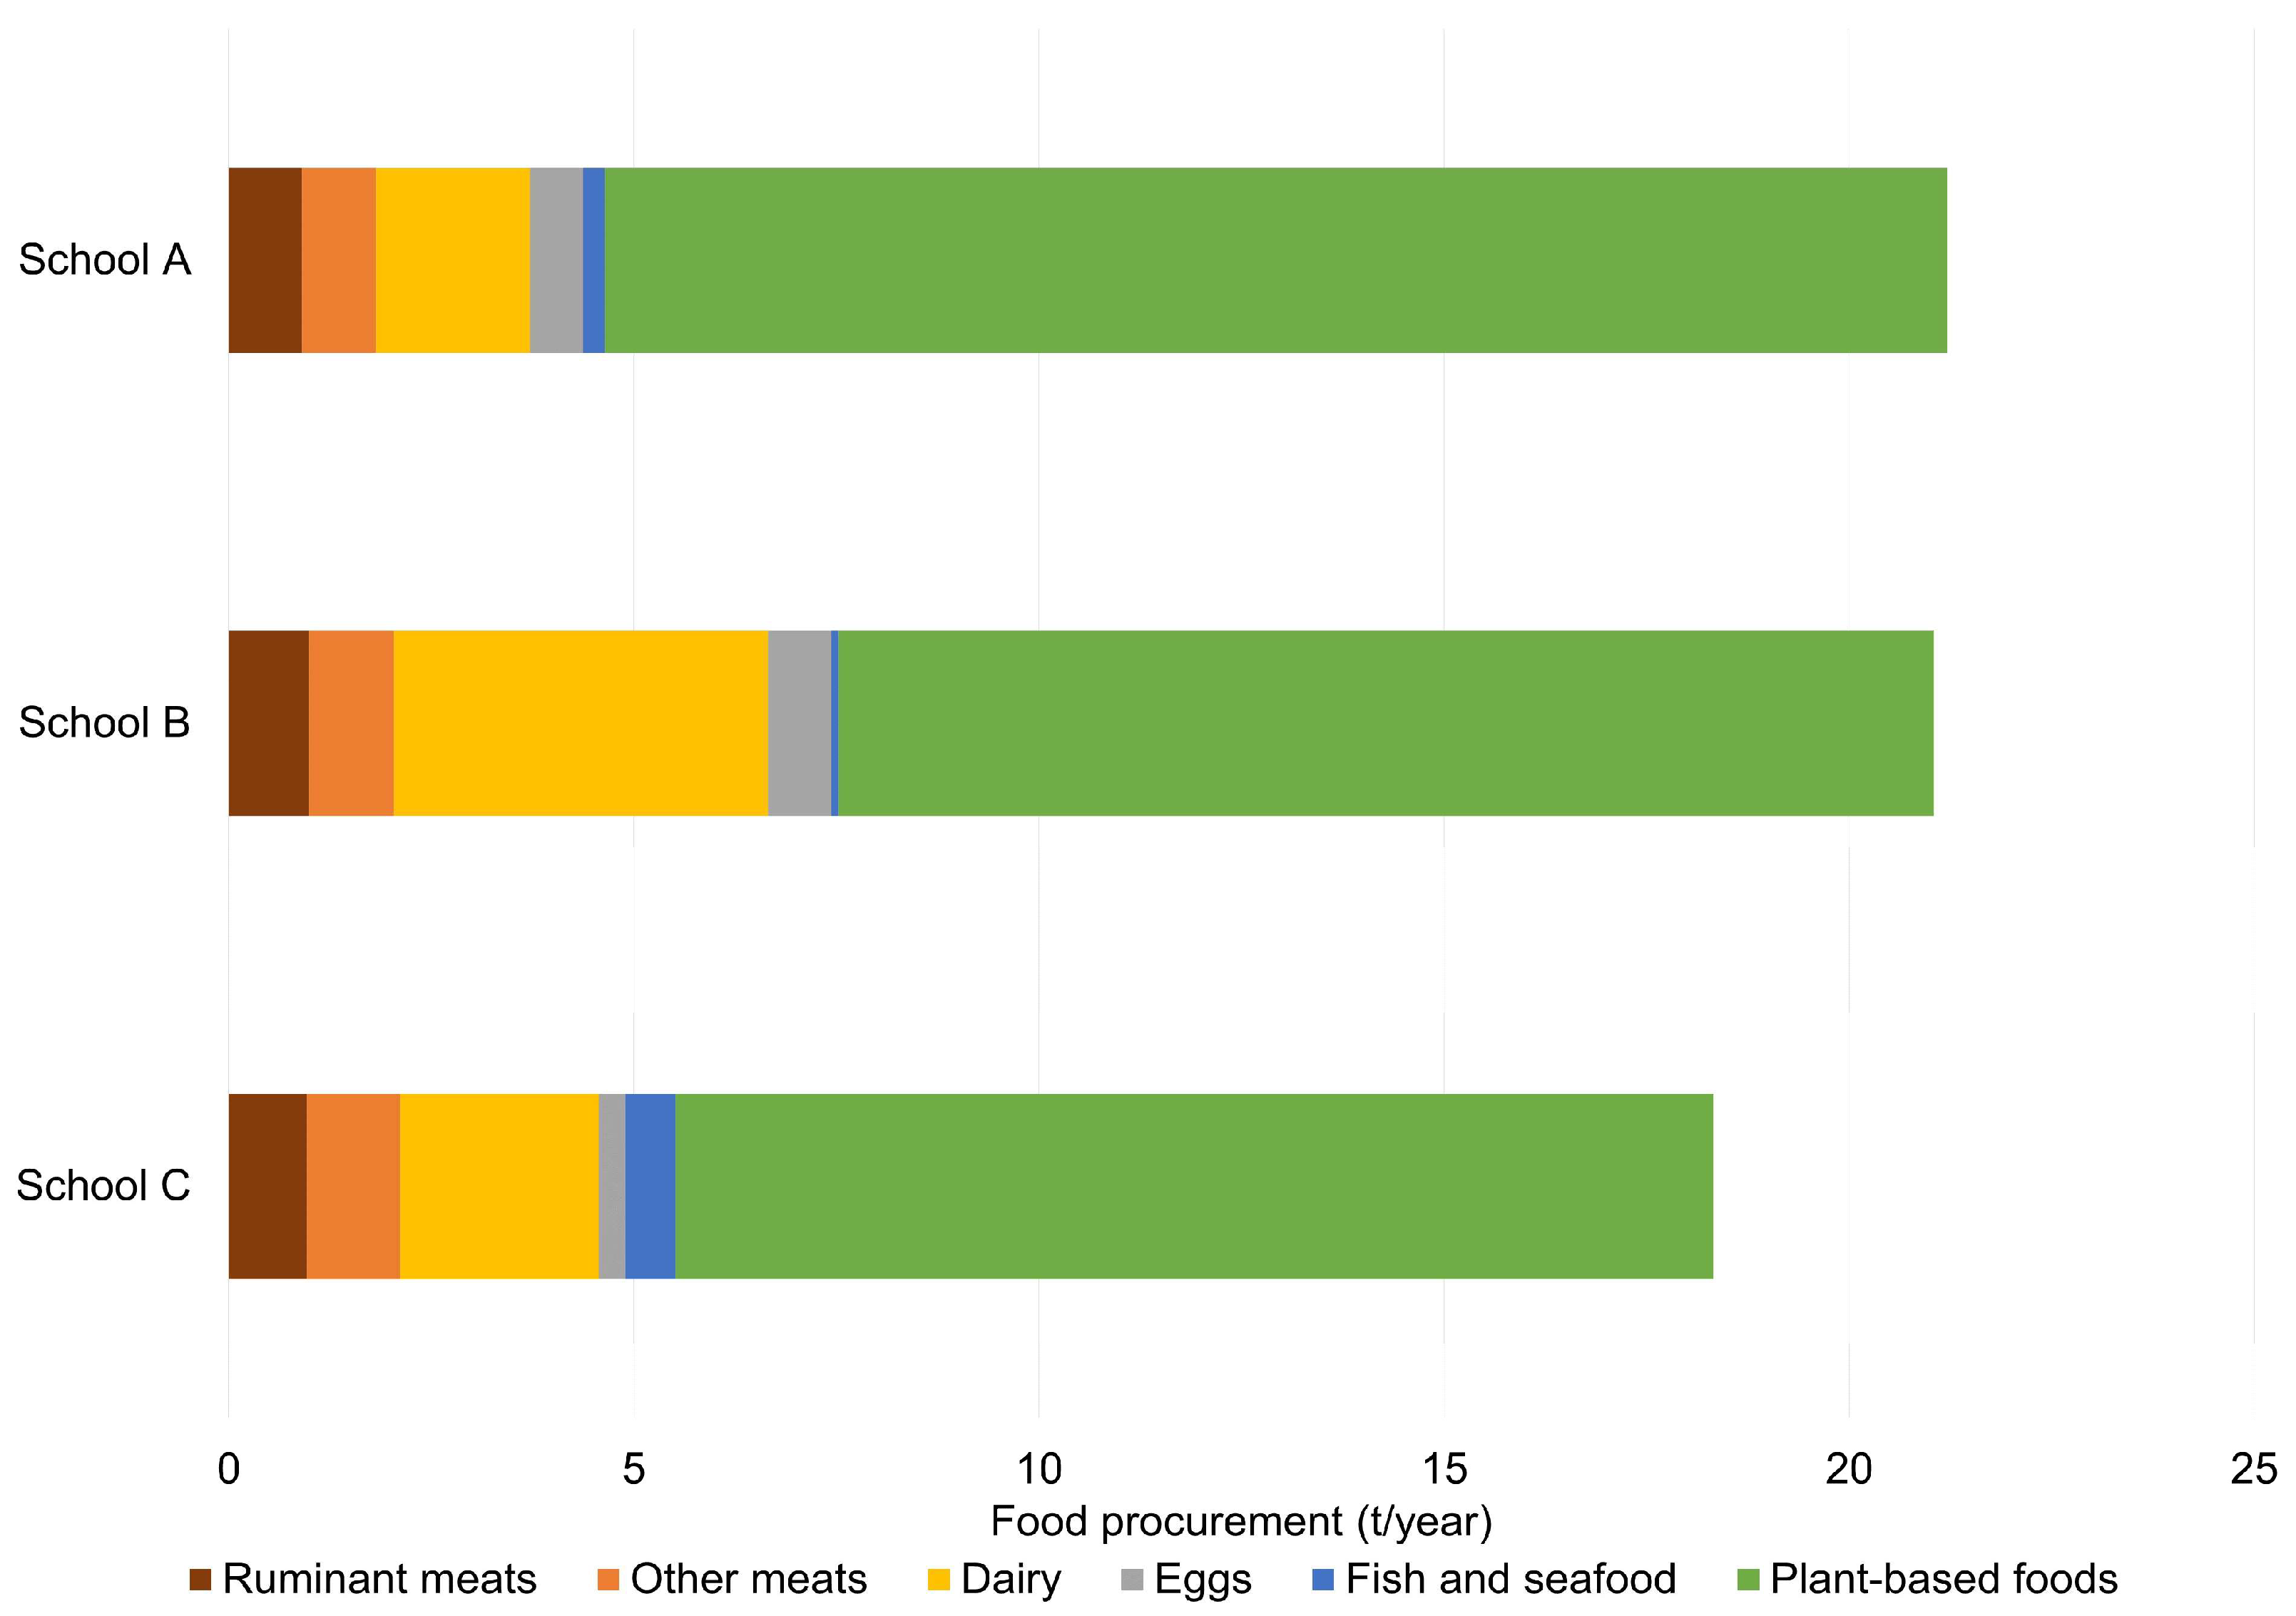
2.2.1. Assessment of Baseline Food Procurement
The baseline GHG emissions from the production of food bought by the school kitchens were assessed based on purchasing data obtained from the supplier combined with emission factors from life-cycle assessment (LCA) databases. The baseline assessment was based on procurement data from 2017. For School B, the available data covered the entire year (1 January 2017 to 31 December 2017), whereas for Schools A and C, the data collection ranged from 21 January 2017 to 31 December 2017. Data from the two latter schools were therefore subsequently harmonized to be equivalent to one year by adjusting the purchased amounts of all individual products under the assumption that the type of products purchased during the first 20 days of January did not deviate significantly from those purchased in the rest of the year. All individual food items purchased by the school were mapped to relevant foods or food groups in the LCA databases used. The schools each procured 500–700 different food products during the baseline year, including unprocessed single-ingredient items such as fruit or eggs, processed single-ingredient items such as flour or spices, and processed multi-ingredient items such as condiments or bread. None of the databases contained every single specific product purchased by the schools, so proxies were used in some cases to map products not included in the specific database. Proxies were selected as much as possible based on the similarity in the type of food product and geographical origin. In most cases, very similar proxies were used, such as using tomato ketchup as a proxy for another processed, tomato-based condiment. For some processed foods, no similar product was available, so they were mapped according to the main ingredient of the product, e.g., candy products being mapped as sugar. For a few products, an obvious proxy did not exist. This was the case for some baking ingredients, such as baking powder or food colorings, and some spices. These were mapped using other products in the same general category, such as the category of “spices”. Importantly, these products were used in very small amounts and comprised a very small fraction of the total food procurement, so they did not have a significant impact on the overall result.
After mapping all the food items to corresponding items, categories, or proxies in the databases, the calculation of baseline emissions was conducted by multiplying the procured amount of each food item with the corresponding emission factor from the database. Food items and their related emissions were then sorted into categories, such as beef, dairy, fruit, etc., to enable adjustment on a category level in the scenarios, two of which were based on adjusting the procured amount of the categories beef and meat (
Section 2.3).
2.2.2. Use of LCA Databases and LCA Methodology
Because of the large number of existing approaches within the family of LCA methodologies, including when applied to food [
29], three independent LCA databases of food GHG emission factors were used to present a span of baseline emissions and reduction potentials and evaluate the scale of the differences between them. This is important to showcase how comparability between assessments made with different methods is affected and discuss how the choice of LCA methodology behind the databases affects the outcome of applying emission factors to the cases. The main methodological differences between the databases are (i) whether the database is based on a large array of individual food items or larger food groups, (ii) whether the LCA conducted is attributional or consequential, and for the attributional databases, (iii) whether the allocation in the attributional LCA is carried out according to a bottom-up or top-down approach (
Table 2).
(i) Number of food items included: A database consisting of many individual food items allows more precise mapping. However, for foods that are not included and where no directly similar proxies exist, the accuracy of the assessment may be challenged because there are no average food group values to apply to them. A database consisting of fewer, larger food groups has the opposite limitation. The mapping is less precise, but it is less challenging to map niche products because they can be included in a more general category.
(ii) Attributional or consequential LCA: The attributional LCA method is aimed at quantifying what fraction of the studied environmental effects can be attributed to an individual product or process. It attributes these effects through a normative modeling approach, where outputs and inputs to the system processes are allocated by the functional unit [
30,
31]. A consequential LCA is change-oriented. It is aimed at estimating what the environmental effects will be from a change in a system where products and processes are linked in a market setting [
30,
32]. Both approaches have strengths and weaknesses, and the choice of approach depends on whether a current or past static system or the future effect of a change or decision is being analyzed [
31].
(iii) Allocation in attributional LCA: In attributional LCA, different choices can be made regarding how to allocate the environmental effects to various stages in production, distribution, etc. The main aspect relevant here is the difference between a bottom-up and a top-down approach. A bottom-up approach, or process-based LCA (PLCA), assesses the inputs and outputs at every step in the production of every part or ingredient in the final product, quantified in, e.g., mass [
33]. A top-down approach, or economic input–output LCA (EIO-LCA) assesses the environmental effects from a bird’s eye view. It is based on economic transactions between different sectors instead of physical inputs and outputs. The economic flows are used as a proxy for modeling the flow of goods and services between sectors, which are then linked to environmental effects [
32].
The UCPH database is primarily based on a comprehensive systematic review by Clune et al. [
34], supplemented with values from other studies if none were available in the main source. The system boundary is cradle to regional distribution center (RDC), meaning that emission factors obtained from this review include emissions from agricultural production, upstream emissions related to inputs for production (fertilizer, feed, etc.), processing and packaging, and transport up to the point right before the product is distributed to retailers. Values obtained from other studies with other system boundaries were harmonized using estimates of emissions from processing, packaging, transport, and retail [
34]; emissions from transport to household by the consumer; and refrigeration and cooking [
35]. Three types of attributional LCA approaches were included in the main review used [
34]: (i) process-based (bottom-up), (ii) economic input–output (top-down), and (iii) hybrids between these two methods. An assessment of potential bias was made comparing median values for studies using bottom-up and top-down methods in two selected food categories: beef and dairy. These categories were selected due to the high number of relevant studies across the LCA approaches. It was found that there was a high correlation between results from process-based and economic input–output studies [
34].
The CFP database was developed as a global initiative by the World Resources Institute. Its purpose is to assist food providers in assessing the climate impact of the food served and provide knowledge needed to diminish this impact [
36]. The calculator, based on Poore and Nemecek [
2], is used by signatories of the pledge to determine their baseline food-related GHG emissions. The system boundary of this database is comparable to the UCPH database as its scope is cradle to point of purchase by a Cool Food Pledge signatory and therefore excludes emissions at retail and consumer stages. Beyond the farmgate, the CFP calculator includes emissions from transport, processing, packaging, and, unlike the UCPH database, upstream losses along the supply chain [
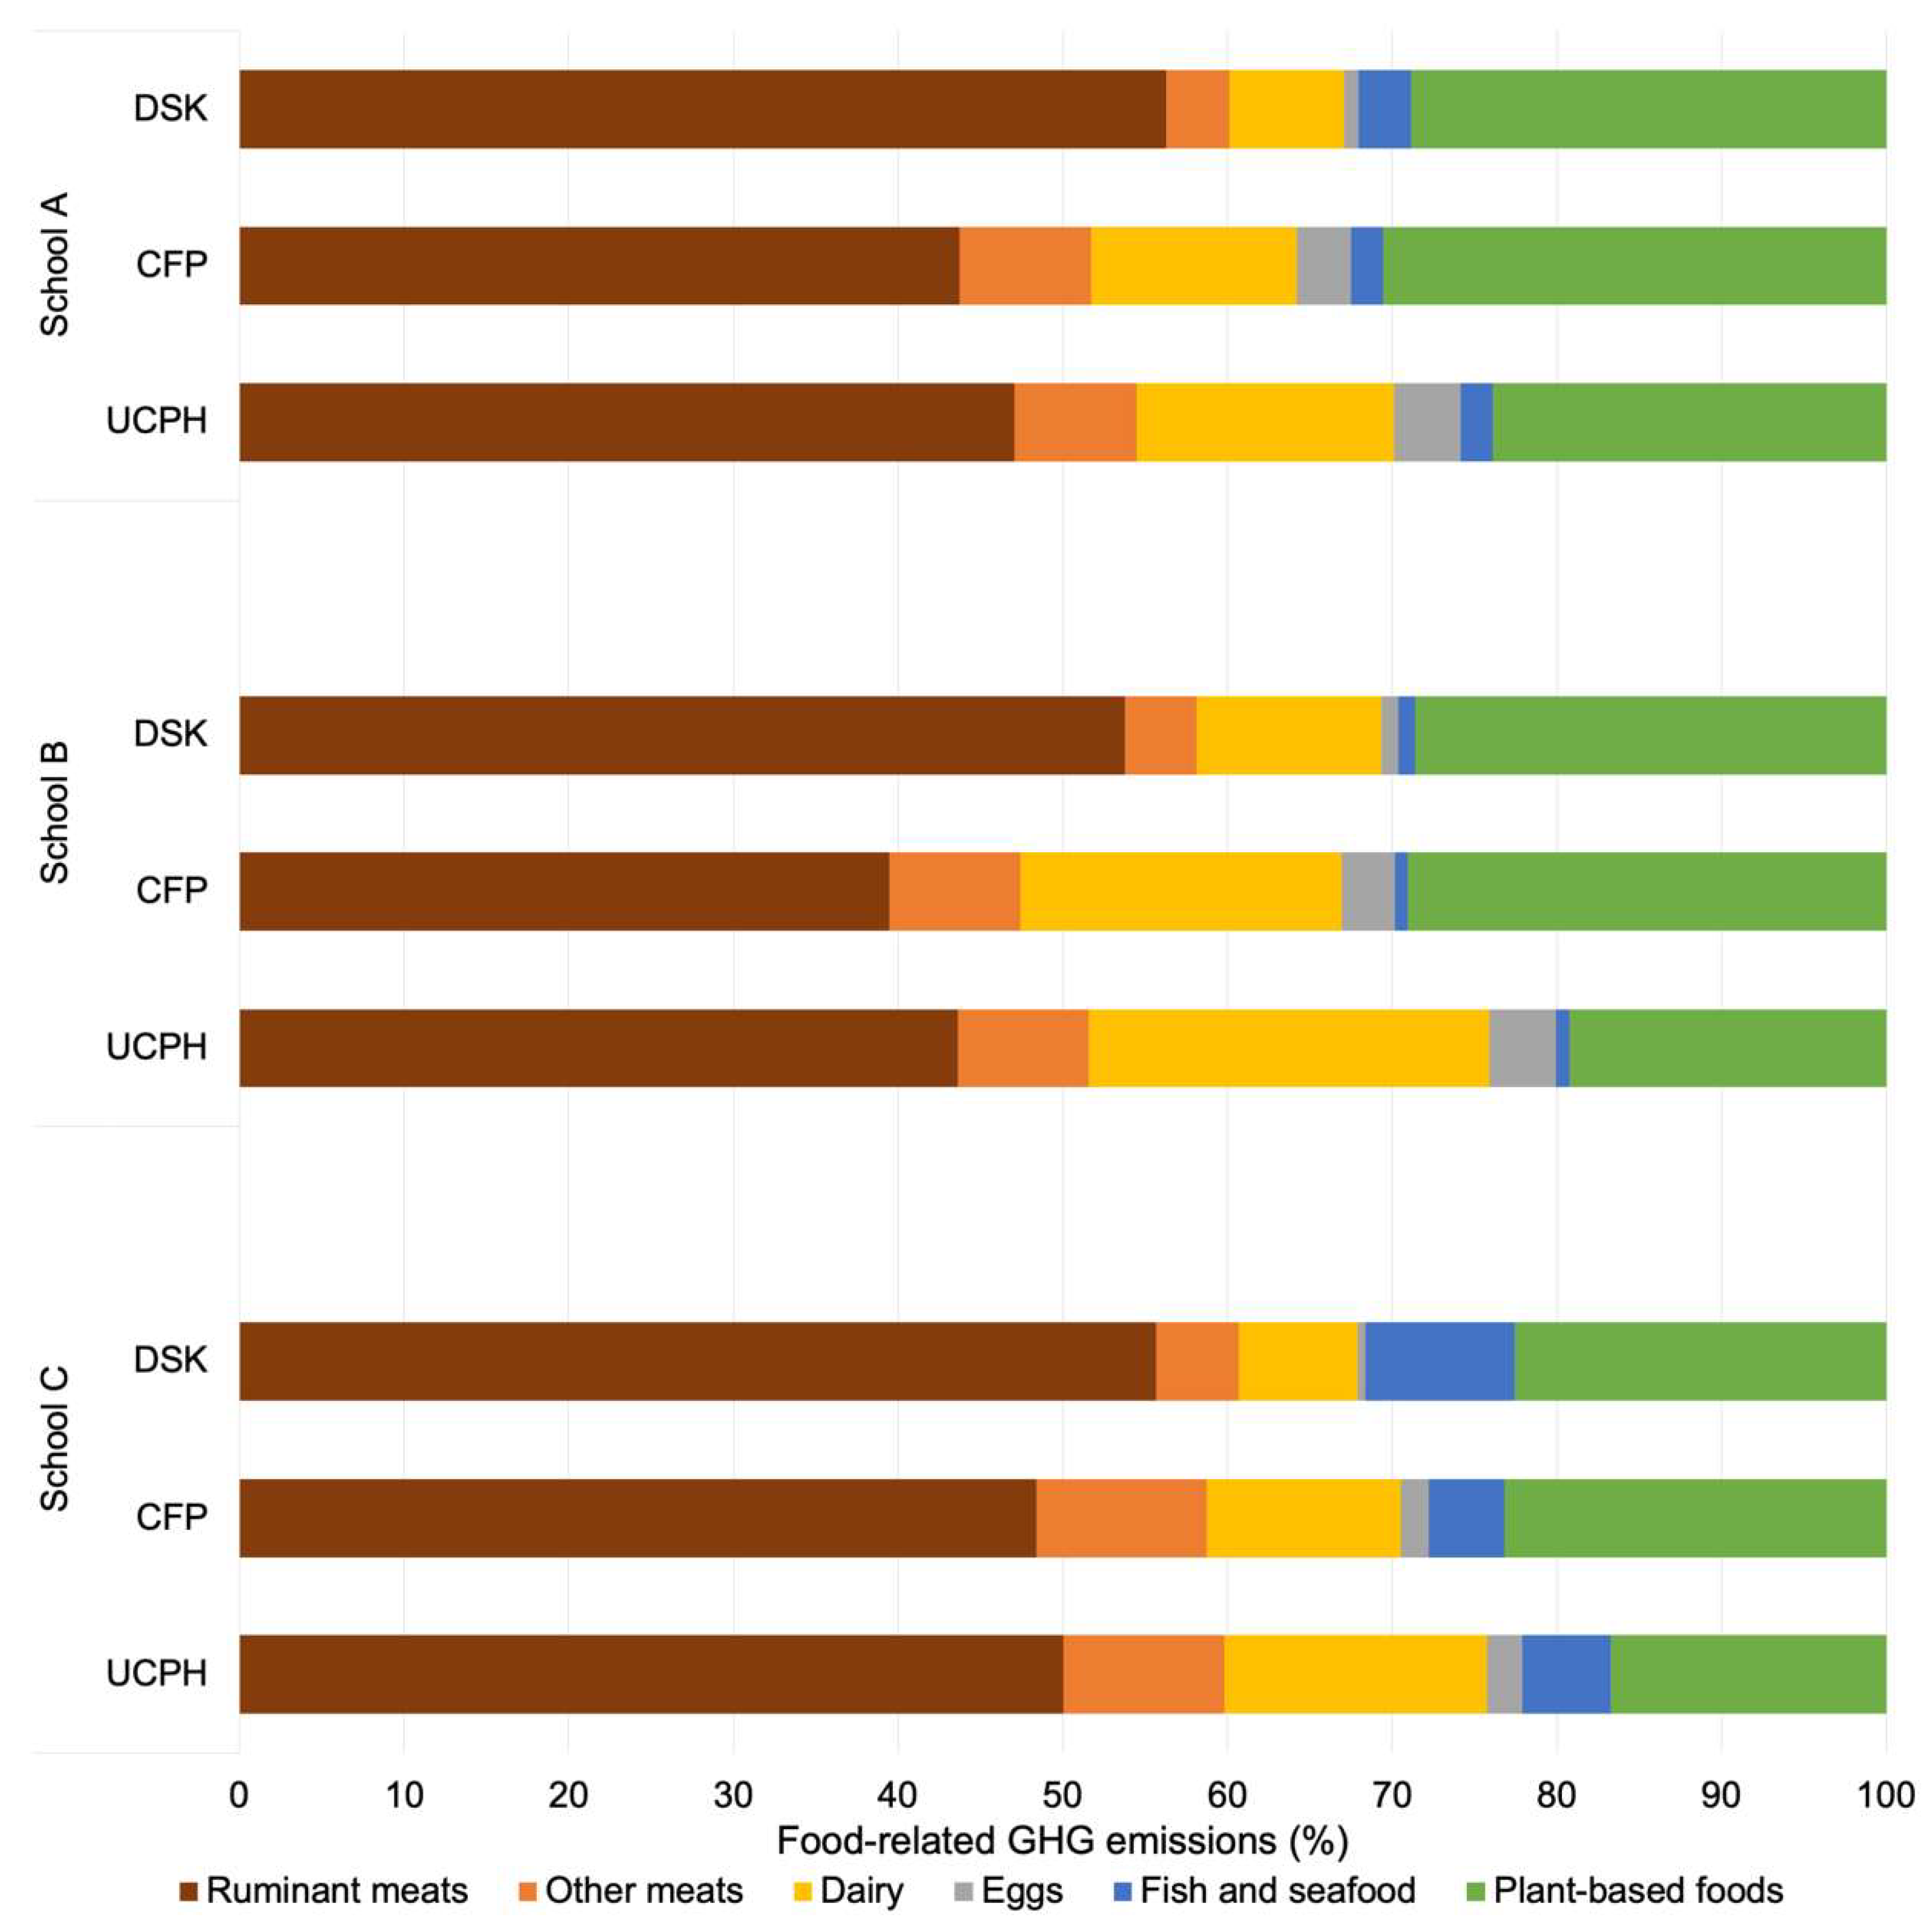
33]. In general, the emission factor estimates for most food groups are higher in the CFP database than in the UCPH and DSK databases. This is likely due to differences in the specific factors included in post-farmgate emissions as well as due to the inclusion of upstream losses in the CFP calculator.
The DSK database was developed by 2.0 LCA Consultants for the Danish think tank Concito [
37]. It is made up of very specific food items, a large proportion of which are processed foods, such as preserved foods, prepackaged meals, baked goods, snacks, and beverages. For example, it includes different values for 10 types of frozen pizza but has no values for almonds. It includes no general overarching categories, such as fruit, spices, etc. However, unlike the other two databases, the values in the DSK database are based on a consequential LCA. Emission factors in the database therefore include not only emissions arising from the individual product but also an estimation of the effect that purchasing a given product has on emissions from related products on the market [
38]. The database also includes land use change and indirect land use change, in contrast to the two other databases. Furthermore, economic allocation of emissions from processes resulting in more than one product is used. Therefore, the total emissions from ruminant meats are high and emissions from dairy are lower than in the UCPH and CFP databases because the meat has been assigned a higher economic value than the milk produced. The scope of the database is cradle to retail. However, emissions from the retail stage have a low impact on total emissions, estimated to represent 10–30 g CO
2e per kg of product [
38].
2.3. Scenarios for Reduction
Three scenarios were included in this study and calculated for all schools at implementation levels from 0–100%, assuming a linear implementation (
Table 3). These scenarios were built upon scenarios developed by master’s students at the University of Copenhagen as part of the course “Climate Solutions”. They were developed based on visits to a school and interviews with staff members. Subsequently, scenarios were synthesized from the student-developed scenarios and calculated for all schools.
The three scenarios illustrate different development trajectories with varying levels of ambition. Scenarios that are ambitious beyond what was determined realistic at present by the school were included to showcase the increased potential of GHG reductions from such scenarios, regardless of their real-life relevance for the case schools.
The three scenarios were as follows: (i) The No Beef (NB) scenario, where all beef is replaced 1:1 by poultry. As two of the schools do not serve pork for cultural and religious reasons, this would leave them with poultry and mutton (of which all schools consume very little) as the only meat sources besides fish and seafood. (ii) The Vegetarian (VEG) scenario, where all meat (beef, pork, and poultry) as well as fish and seafood are replaced 1:1 with legumes, specifically dried legumes, such as dried beans, chickpeas, and lentils, as these have a similar protein content by weight. (iii) The Danish Food Based Dietary Guidelines (DDG) scenario, where the entire procurement is aligned with the current official dietary guidelines.
The DDG scenario is more complex than the other two because it is a complete adjustment of the school food to fit the guidelines instead of a replacement of individual food groups. Because the Food Schools do not provide the entire daily food requirements for their pupils, it was not possible to directly use the average daily or weekly amounts from the guidelines as they are recommended based on the daily intake of an adult [
39]. Instead, the recommended amounts (in g day
−1) were converted to percentages (
Table 4). These were used to calculate the proportion of individual food groups in the school food, assuming that the total quantity of food consumed would remain at the current level when a scenario was implemented. The adjustment to the dietary guidelines was carried out with individual consideration to conditions at the case schools, e.g., the schools not currently buying pork did not have pork added to their procurement in the DDG scenario. For animal products, added fat, and added sugar, the method was to adjust the purchase to either be at or below the mean percentage in the guidelines. Thus, if a school’s purchase of dairy was already less than 16.5% by weight of the total food procured, it remained at its current level. If not, it was adjusted to 16.5%. For vegetable foods, the goal was to adjust the amounts so procurement of these foods was either at or above the mean percentage. For example, if vegetables already accounted for 18.4% or more of the total food procured by a school, it remained at its current level. If not, it was adjusted to 18.4%. This was carried out to not inadvertently make the scenarios more unhealthy or “green” than the school’s current procurement. Grains, the major source of carbohydrates in the diet, was used to sum up to 100% when other food groups had been adjusted according to the principles mentioned above. In the Planetary Health Diet, of which the Danish guidelines are a local adaptation, grains are used in an equivalent manner to add up the total recommended energy intake because no scientific evidence exists supporting an exact percentage intake of grains as long as carbohydrates constitute no more than 60% of the energy intake [
17].
The schools consider meat an important part of the meal; this is agreed upon by pupils and the kitchen staff. However, many kitchens in Denmark and globally are conscious of the role red meat plays in the climate footprint of the food they serve and are already trying to reduce the amount. As all scenarios are presented at implementation levels of 0–100%, the VEG scenario can showcase various levels of reduction in meat consumption without adjusting other aspects of the diet, e.g., a 50% implementation of the scenario corresponds to a 50% reduction in meat consumption.
As the scenarios in general assume a level of replacement of some food groups with others, e.g., meat replaced by legumes, it was necessary to assess whether this replacement could negatively affect the average macronutrient composition. This was conducted by applying average values for the content of protein, fat, and carbohydrate to individual food groups and calculating the amount of energy obtained from those three sources in the individual scenarios. The data on nutrient content was obtained from a database maintained by the Danish National Food Institute [
40]. Due to the considerable number of specific products purchased combined with the average nutritional values used, this assessment can only be seen as indicative and can by no means be used as a certain argument for the health impact of implementing the scenarios. Despite this caveat, it was tentatively concluded that none of the scenarios appeared to have negative effects on the macronutrient composition of the food. All the scenarios seemed to increase the amount of energy coming from carbohydrates but in no cases beyond the 60% threshold that has previously been identified as the maximum intake in a healthy diet [
17]. In general, the effect on total intake of protein and fat was negligible, but most scenarios increased the percentage of energy coming from protein slightly and decreased the percentage coming from fat. Importantly, all scenarios reduced the percentage of energy coming from saturated fat (of animal origin). Further information on this supplementary assessment can be found in
Table S1.
2.4. Statistical Analysis and Confidence Intervals of Emission Factors
An ANOVA test of variance was performed to identify whether there were statistically relevant differences (significance threshold: 0.05) between the results from the three databases and/or between the three schools when implementing the scenarios. Additionally, the confidence intervals for emission factors across the three databases was calculated based on the aggregated data for all schools. Because the databases contain a different number of food categories, ranging from the CFP database using broader categories to the UCPH and DSK databases being more granular in different ways, it was necessary to adjust the emission factors to fit the CFP database to be able to calculate the confidence intervals. This was conducted using the following method: (i) annual amount of food procurement was aggregated into the category of the database with the fewest categories (CFP) and averaged across all three schools, (ii) average annual GHG emissions were calculated with the UCPH and DSK databases aggregated to match the categories of the CFP database, and (iii) average emission factors matching the categories in the CFP database were determined for the three databases. Subsequently the confidence intervals were calculated. These can be found in
Table S2.
The type of uncertainty that is displayed in the confidence intervals arises from the methodological choices behind the databases. It can be assumed that the databases utilize some of the same original data, so the variability is a structural uncertainty as described by Solazzo et al. [
41].
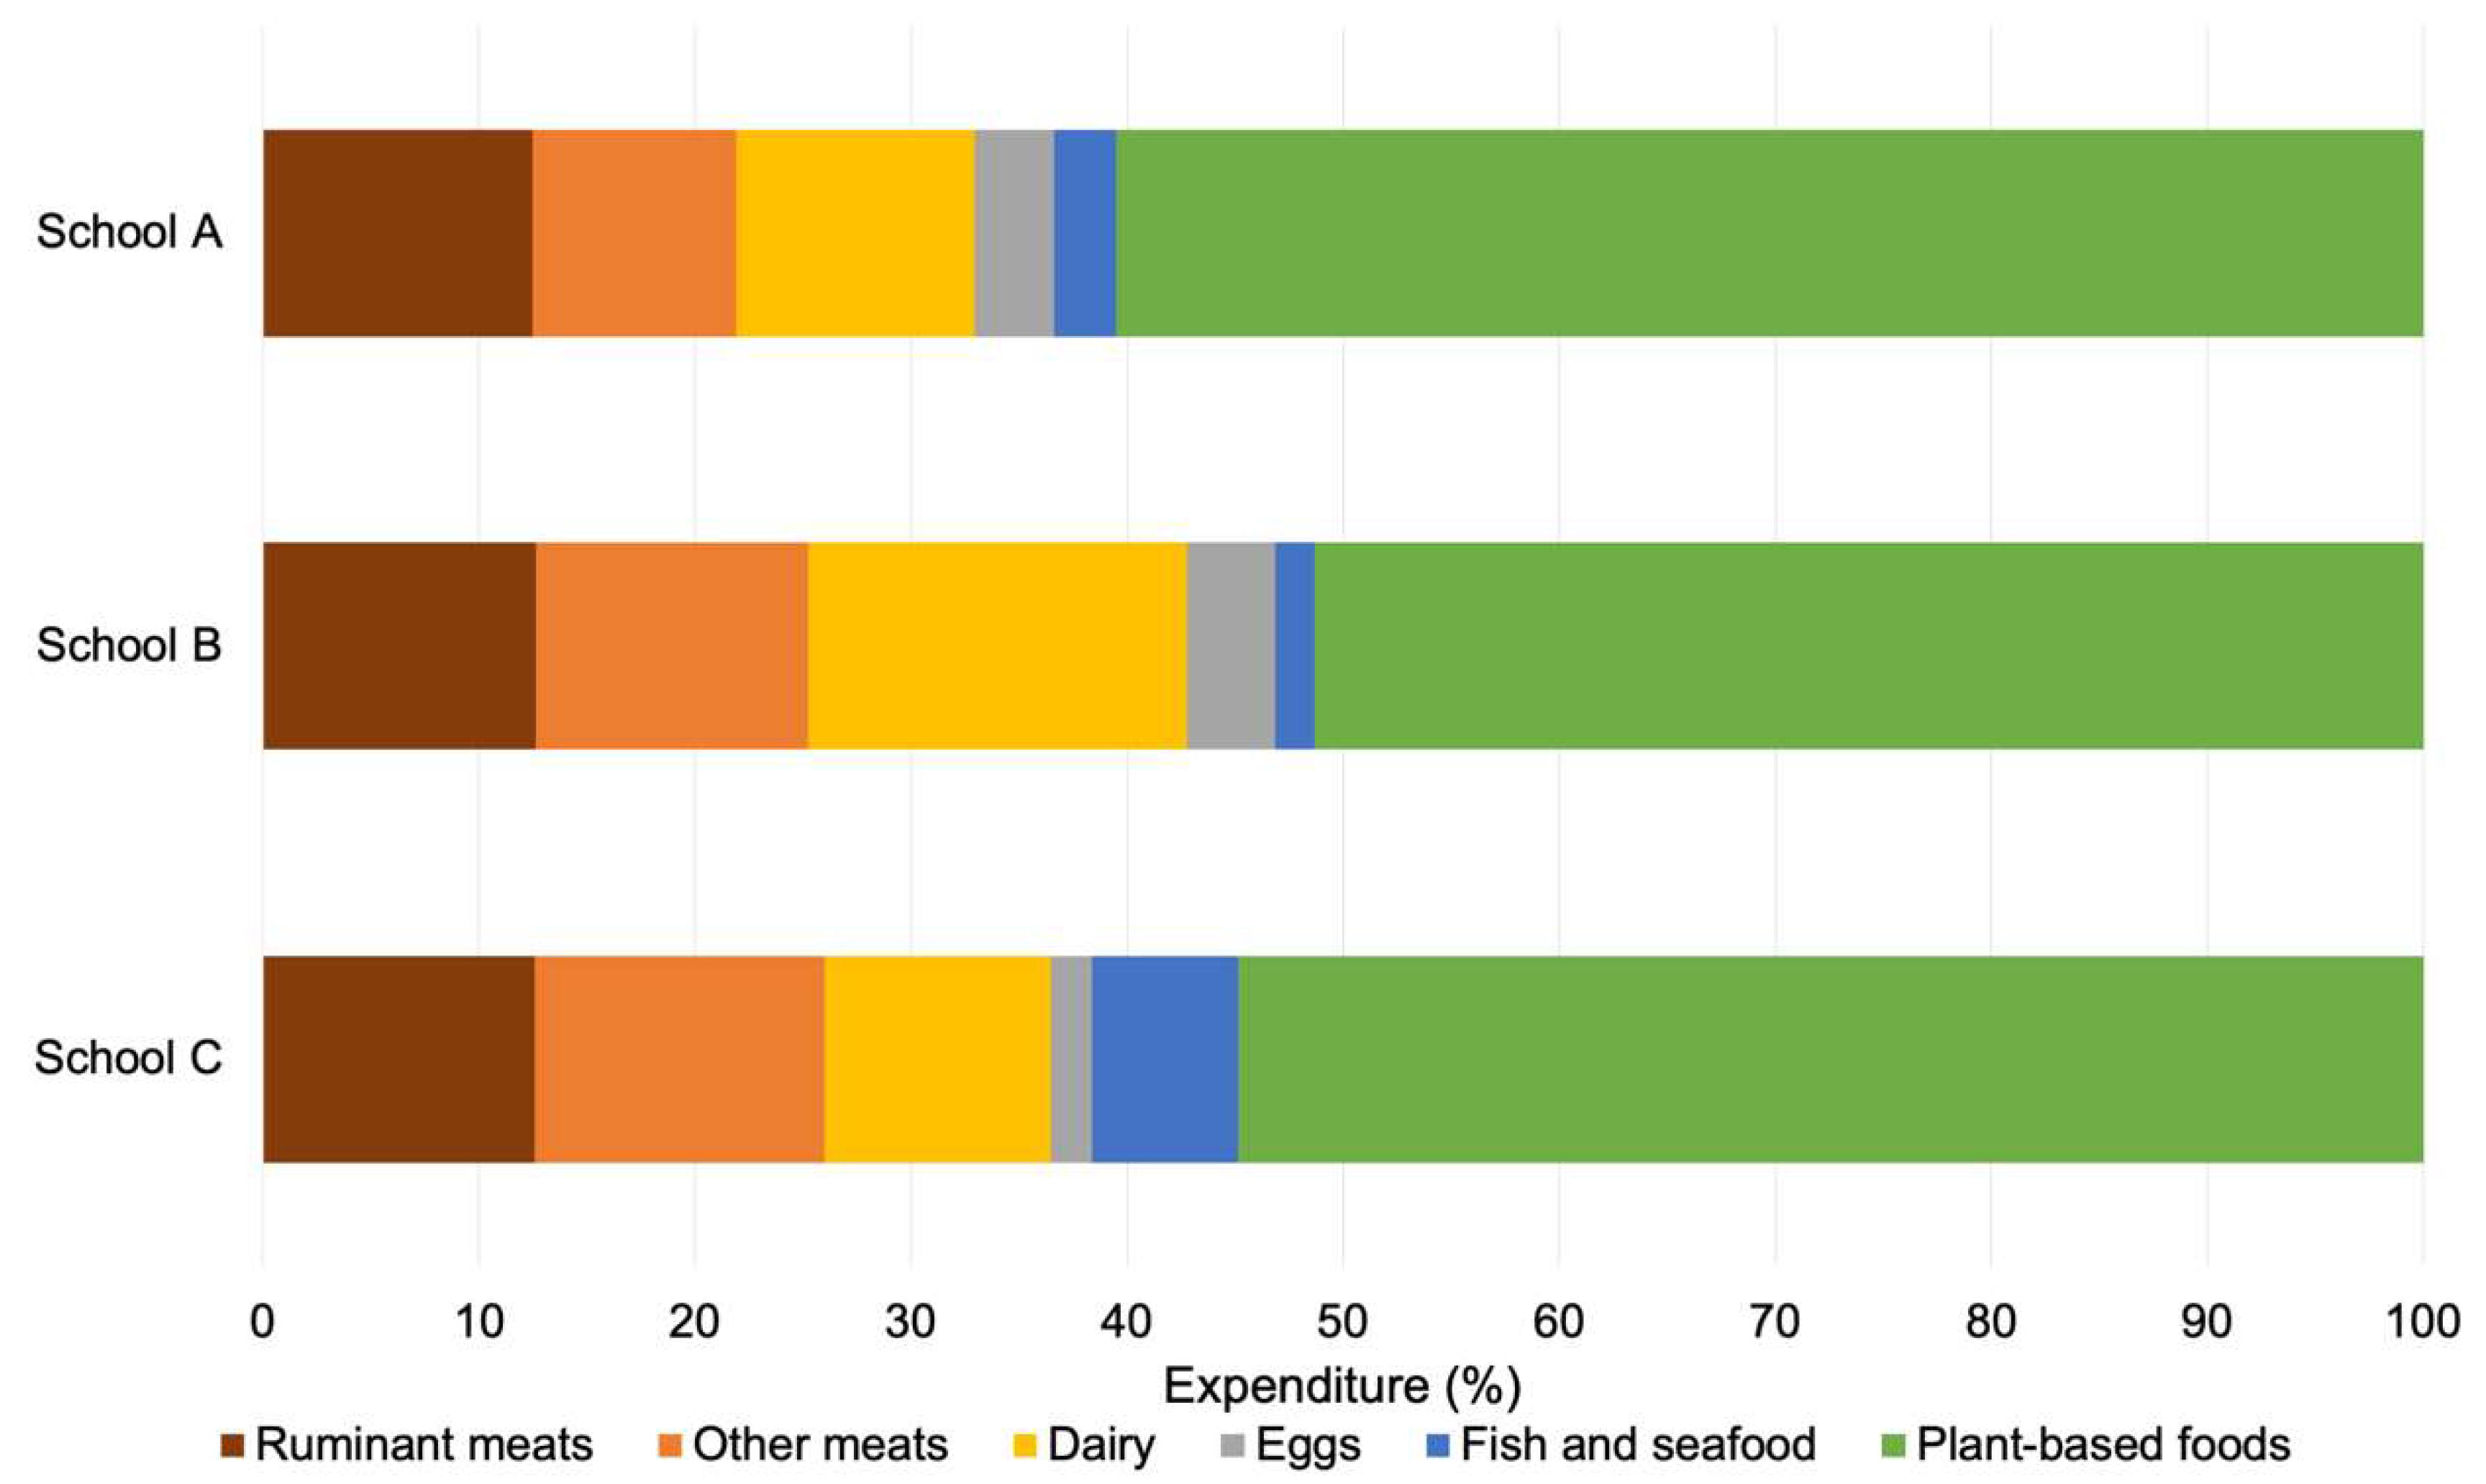
2.5. Implications of Scenarios on Food Expenditure
The economic effects of implementing the scenarios were assessed directly based on the expenditure of the kitchens in the baseline year as the purchasing data obtained from the supplier for each school also provided price information. Expenditure on different food groups was calculated and adjusted with the same percentage as consumption of the food group affected by the scenario. This means that no changes in the prices of individual commodities were assumed; the only effect on the economy of the school arising from the scenarios was due to the increasing procurement of some food items and the reduction in procurement of others. Additionally, it was assumed that the schools would continue to purchase the same products within the product groups as was the case in the procurement data, i.e., if a school in the baseline bought more expensive meat or cheaper dairy than the average, this was assumed to also be the case in the dietary scenarios.
4. Discussion
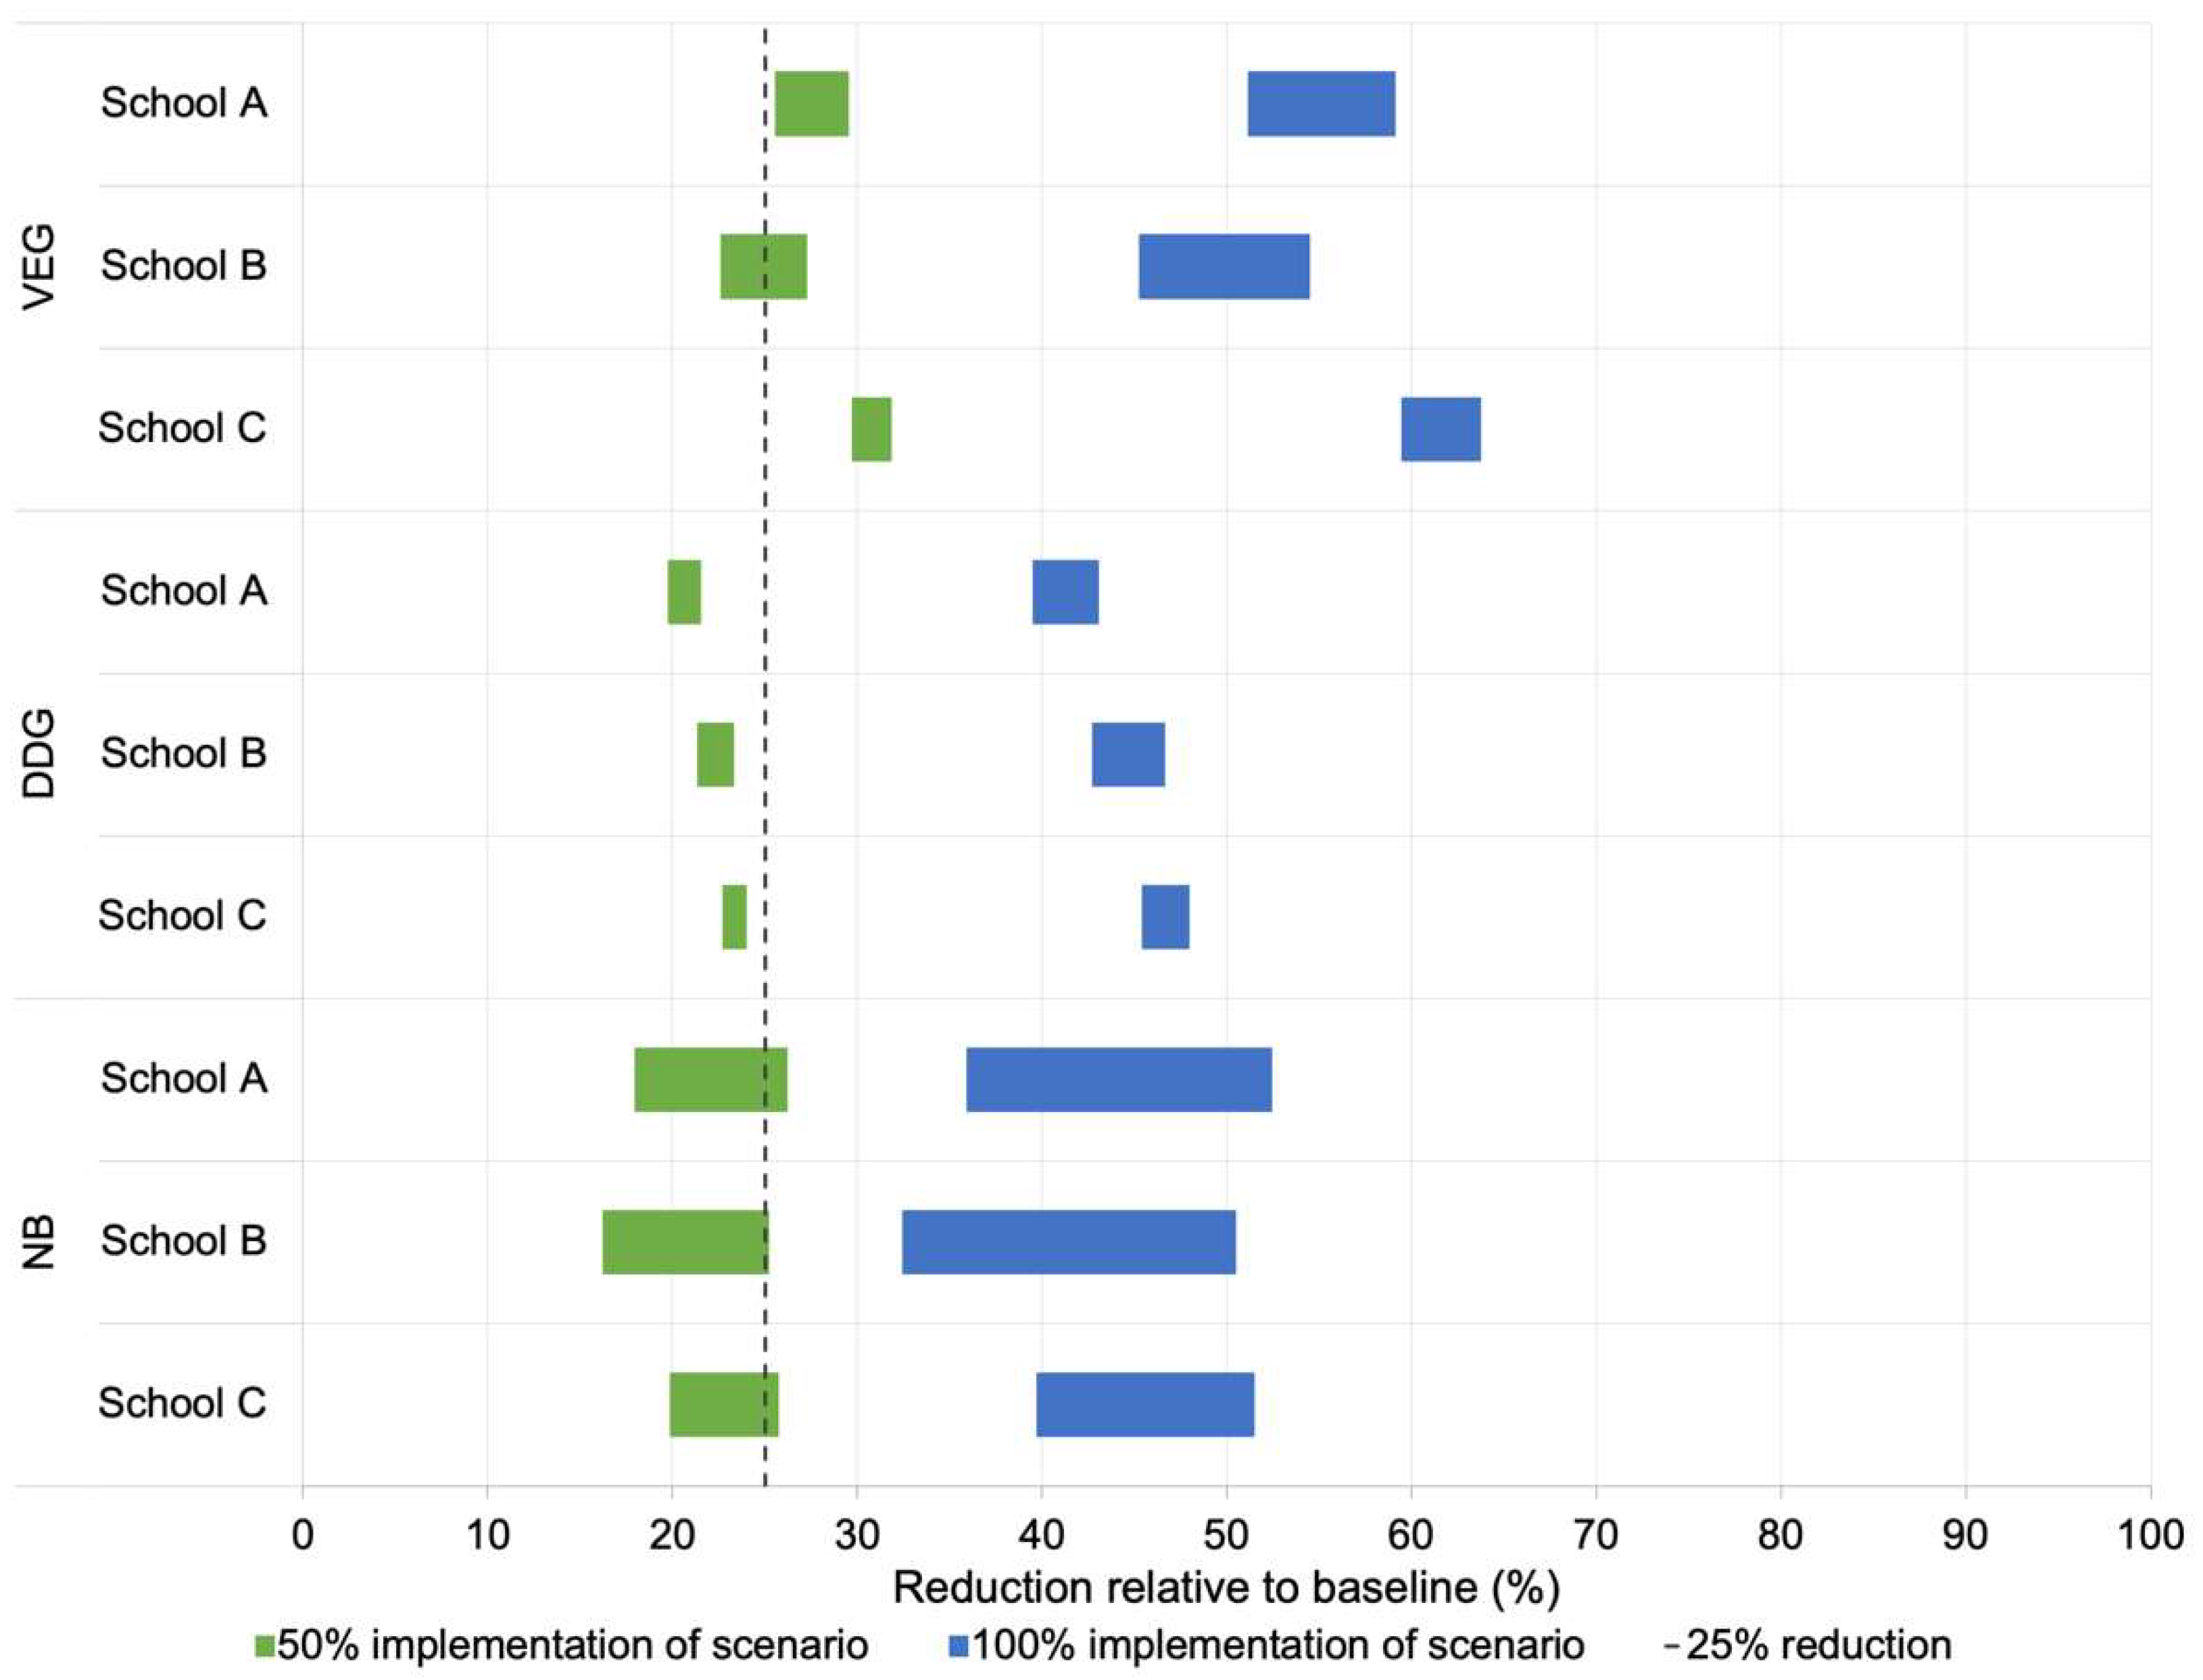
The three scenarios, NB, DDG, and VEG, present different suggestions for how an institution can achieve a sizable reduction in GHG emissions from food procurement and highlights how important it is to be aware of the LCA methodology used for calculation of food-related GHG emissions and pathways towards reduction.
The NB, DDG, and VEG scenarios led to GHG emission reductions of 32–52%, 39–48%, and 45–64%, respectively, depending on the school and database used. These findings are comparable to results from other studies exploring the potential of more plant-based diets for climate change mitigation. These results include GHG emission reductions of 61% by adoption of the Planetary Health Diet [
18], 58–86% by transforming the Danish agricultural sector to match the Planetary Health Diet [
42], 56% by adopting a flexitarian diet [
3], 29–70% by various diets with lowered meat intake [
43], and 49% by adopting a vegetarian diet [
2].
The three databases used in this study produced estimates for GHG emissions that were different at a 0.05 significance level for all the schools, both at the baselines and in the scenarios due to the different LCA methods used in the databases. Implementation of the NB scenario produced the most variable result of the three scenarios, even though the uncertainty in the emission factor for beef was found to be relatively low. This is due to the high emissions in absolute terms of ruminant meat, which amplifies even a small uncertainty. The variation identified between the databases were, of course, present in all scenarios but was less pronounced when multiple products were included, though it was still statistically significant in the other scenarios as well. A previous study comparing dietary transition scenarios similar to the DDG concluded that the choice of methodology is important for the calculated effect of the transition and that this is relevant knowledge when developing dietary guidelines [
21]. Our study adds more database comparisons supporting this conclusion and finds that this difference is pronounced in simpler scenarios that do not address the whole diet and that it also holds true when applied to case studies with different baseline conditions. Efforts are being made to reach some level of consensus when it comes to the allocation issues in LCA of meat [
44], but no unified approach exists as of yet. The effect of the LCA methodology on the results of the dietary scenarios highlights the importance of ensuring that the assumptions and approaches underlying emission factors are known and understood. This is important knowledge for restaurants, cafés, and canteens that want to calculate their emissions or use carbon footprinting of their menus as a communication tool. Both the CFP and the DSK databases are publicly available and both are currently being used by cities, municipalities, and other institutions, so a need for awareness about the importance of the choice of database is evident. This is important if comparisons are intended across institutions but also for the individual institution using carbon footprinting as a starting point for implementing initiatives to reduce emissions because the choice of database evidently affects the view of the proportion of emissions coming from different food groups.
Reducing the carbon footprint of diets is a matter of urgency due to the importance of food systems for global GHG emissions. Due to their size and reach, public kitchens can play a significant role in making this happen. However, it is important for the kitchens—and their consumers—to trust the calculations and estimates they obtain. Presenting the carbon footprint of a meal in a canteen or using the calculated reduction in emissions from implementing a change as a tool for communication can make it seem as if these values are undeniable facts. Clearly, when databases result in significantly different levels of GHG emissions, they are not. This is an important issue to be aware of and continue sharing with food professionals who are keen to work with the carbon footprint of their meals. Consumers have been found to be aware of the general order of importance of different food groups for the carbon footprint of diets, but they lack knowledge about the magnitude of the difference between them [
45]. For this reason, consumers cannot be expected to be able to identify the uncertainties related to information presented to them about the climate impact of food and diets.
Importantly, the narrowest span in potential emissions estimated with the databases was seen when using a whole-diet approach, as in the DDG scenario. This supports an approach to reduction in food-related GHG emissions that addresses the whole diet instead of targets such as aiming for a set reduction in consumption of specific foods. The most certain approach is also in some ways the simplest and most justifiable: adjust meals to fit the Planetary Health Diet or a local adaptation, such as the Danish Food-Based Dietary Guidelines. The Planetary Health Diet assesses all diet components and is aimed at achieving a diet that is healthy without leading to environmental effects that exceed the planetary boundaries [
17]. Most current national dietary guidelines do not take sustainability into account at present, and suggestions have been made for how to create dietary guidelines that combine human health with climate and land use impacts [
46]. However, the Planetary Health Diet—and its local adaptations by extension—remains a solid approach for achieving this. Addressing the whole diet makes the DDG scenario better equipped to ensure that other components of the diet do not change towards a more carbon-intensive or less healthy direction after a single aspect has been addressed. This could be the case in the other two scenarios where, for example, dairy consumption could potentially increase while meat decreases. Consideration of these trade-offs necessitates a holistic approach that addresses the larger framework. Among the scenarios, this makes the DDG scenario the most useful for real-life implementation in schools, institutions, or canteens, and scenarios based on the Planetary Health Diet or a local adaptation can be directly implemented in kitchens globally. The municipality of Copenhagen is already acting on this by implementing meal plans living up to the standards in the dietary guidelines on some Food Schools [
47].
Given the analyses undertaken here, it is likely that all scenarios can have a positive effect on the nutritional profile of schools’ meal plans because they all reduce the amount of red meat in the diet. As previously mentioned, a supporting assessment of the effect of the scenarios on the nutritional profile of procurement has been carried out as a supplement to this study. This assessment is not precise enough to be usable for making conclusions on the specific nutritional composition of the food because it is based on average values for the nutritional content of individual foods instead of exact individual products purchased by the school. It is, however, possible to see a trend, specifically with regard to the percentage of energy coming from fat of animal origin. Animal products are the dominant source of saturated fat, which should be limited in the diet. As all scenarios reduce the intake of animal fat to align better with the recommended levels (
Table S1), the health profile of the meals can be assumed to improve at least in this regard.
Additionally, most daily meals are consumed outside of the school—and outside public kitchens in general—so an important additional benefit of a healthy and climate-friendly meal plan in schools is the potential ripple effect such a change can have on the diet and preferences of the general population. It has been demonstrated that people form their adult dietary habits based on the food and cooking practices they are exposed to as children [
14]. Furthermore, it has previously been found in a Danish context that schools can be important facilitators in the formation of healthier dietary habits by acting as normative institutions [
48]. This puts public school kitchens in a unique position. They are ideally situated for influencing the dietary habits of children and their families in a positive way while also being under public control. School kitchens can thus become catalysts for a large-scale systemic shift in dietary habits and the related GHG emissions, and large benefits could be reaped by ensuring that policies and food procurement practices support this. However, as previously mentioned, it is important that institutions that are interested in calculating and tracking their food-related emissions are aware of the impact of the method they use for the assessment, regardless of whether they intend to use it in communication with users, to generate support for a change in meal plans, or for public communication. It is paramount to not consider an LCA-based result as a fact. This is not an understanding that can be expected of casual users of publicly available databases or consumers.
Limitations
The study is limited by being based on individual schools in only one city. The schools are concrete examples of public kitchens that are used to showcase differences in calculated GHG emissions from food depending on the LCA methodology and differences in the potential for implementing initiatives to reduce GHG emissions from food procurement that arises from local conditions and preferences, so the results are not directly transferable to other kitchens in other institutions.
Additionally, the schools, kitchens, and meals plans have potentially changed since the data were collected, so the study does not provide directly usable food-related climate change mitigation strategies that can be pursued by the relevant procurement officers or school chefs. Importantly, because the schools used as case studies are designated Food Schools, at the time of data collection, they were already ambitious with regard to food education and the involvement of students as well focusing on producing food onsite with fresh produce. Due to the preexisting focus on organic food, the schools were also used to weighing highly the sustainability aspects of their food procurement. Many other schools and other institutions, both nationally and globally, will have further to go at present than these schools did at the time of data collection. Importantly, the power of the differences between LCA methods to impact the result and the effect of individualized adaptations and implementation choices has not changed since the data were collected.

 and
and 


