Article

Life Cycle Analysis of Hydrogen Powered Marine Vessels—Case Ship Comparison Study with Conventional Power System

Department of Naval Architecture, Ocean and Marine Engineering, University of Strathclyde, Glasgow G4 0LZ, UK
*
Author to whom correspondence should be addressed.
Sustainability 2023, 15(17), 12946; https://doi.org/10.3390/su151712946
Submission received: 15 June 2023 / Revised: 11 August 2023 / Accepted: 21 August 2023 / Published: 28 August 2023
(This article belongs to the Special Issue Life Cycle Assessment of the Shipping Sector)

Abstract

:
The latest International Maritime Organization strategies aim to reduce 70% of the CO2 emissions and 50% of the Greenhouse Gas (GHG) emissions from maritime activities by 2050, compared to 2008 levels. The EU has set up goals to reduce GHG emissions by at least 55% by 2030, compared to 1990, and achieve net-zero GHG emissions by 2050. The UK aims to achieve more than 68% GHG emission reduction by 2030 and net-zero GHG emissions by 2050. There are many solutions under development to tackle the challenge of meeting the latest decarbonization strategies from the IMO, EU, and UK, among which are hydrogen powered marine vessels. This paper presents a life cycle analysis study for hydrogen fuelled vessels by evaluating their performance in terms of environmental friendliness and economic feasibility. The LCA study will consider the gas emissions and costs during the life stages of the ships, including the construction, operation, maintenance, and recycling phases of the selected vessels. The results of the comparisons with the conventional version of the ships (driven by diesel generators) demonstrate the benefits of using hydrogen for marine transportation: over 80% emission reduction and around 60% life cycle cost savings. A sensitivity analysis shows that the prices of fuels and carbon credits can affect the life cycle cost, and recommendations for low H2 price and high carbon credit in the future are provided to attract the industry to adopt the new fuel.

1. Introduction

International shipping enables 80–90% of global trade and comprises about 70% of global shipping energy emissions [1]. The UK domestic maritime vessels represented around 5% of the UK’s domestic transport GHG emissions in 2020, which was more than the domestic rail and bus emissions combined [2]. According to the IMO strategy of 2018, the United Nation (UN) is expected to reduce CO2 from international ships by at least 40% by 2030, compared with 2008 levels, and work towards reductions of at least 70% by 2050 [3]. One of the solutions is to use hydrogen, with heat and water as by-products, to replace the current marine diesel oil (MDO), which is critical for the decarbonisation of both international shipping and the UK Clean Maritime Plan [4]. If used as a replacement fuel, it will need five times the volume of liquefied hydrogen to provide the same energy as HFO, or ten to fifteen times the volume if stored as compressed gas [5]. The current cost for green hydrogen production is around $66–154/MWh, which is predicted to drop to around $32–100/MWh in 2050 with the reduction in prices for both electrolysers and renewable energies [1]. In the medium to long term, green hydrogen will be the foundation of a decarbonised international shipping industry [6]. However, due to the natural property of hydrogen, there are still a few aspects that need to be studied before safe commercial application can be achieved, such as leakage [7] as well as its production, transport, and storage [8]. Nevertheless, researchers have carried out a series of studies to investigate hydrogen applications in shipping transportation. Taccani, Malabotti [9] carried out a case study of a small roll-on/roll-off passenger ferry retrofit with hydrogen fuel cells. This study introduced gaseous hydrogen as fuel and was focused on the hydrogen storage onboard, which showed that the filling process is very critical to maximizing the stored hydrogen mass. Aarskog, Danebergs [10] conducted a study to analyse the energy and cost of a high-speed passenger ferry driven by hydrogen, which showed that the OPEX could be 12% to 28% higher when using the on-board hydrogen fuel cell than when using biodiesel or diesel, in the current scenario. But with moderate technology improvements and cost development, the technology could be competitive from 2025 to 2030.
Life cycle assessment (LCA) has also been carried out by researchers to investigate the application of hydrogen in the shipping industry. Trillos, Wilken [11] have conducted the LCA for a green hydrogen (i.e., H2 produced using renewable energy) fuel cell-powered ferry compared with a conventional diesel ferry, which showed up to 89% reduction in GHG in a 30-year life. Hydrogen fuel cells also have advantages compared to batteries, especially when large on-board energy storage is required [12]. Ling-Chin and Roskilly [13] conducted an LCA study to verify the retrofit engine technologies compared with a conventional power system and showed that less fuel was consumed and less emissions released. Gilbert, Walsh [14] conducted the LCA for air emissions of alternative shipping fuels, and green hydrogen was one of the most promising candidates in regards to carbon reduction. Ling-Chin and Roskilly [15] conducted the LCA to assess the impact of a new-build hybrid system designed for roll-on/roll-off cargo ships on the environment, human health, and natural reserves. To achieve the zero GHG emission goal, Kanchiralla, Brynolf [16] conducted the LCA for potential decarbonisation solutions, such as electrolytic hydrogen, electro-ammonia, electro-methanol, and electricity, in different propulsion systems such as engines, fuel cells, and carbon capture technologies, in terms of environmental impact and costs. This study gave a detailed assessment of different decarbonisation pathways from a life cycle perspective, and the largest part of the cost was associated with the fuel, except for the battery-electric case. Wang etc. [17] developed a comprehensive life cycle assessment framework for hydrogen fuelled ships. The type of ship under evaluation was a small passenger and cargo ship operated and served in the seas around China. Jang etc. [18] applied a parametric trend lifecycle assessment (PT-LCA) for thousands of ships using hydrogen fuel cells. The relationships between emissions and ship characteristics were presented with the lifecycle benefits/harms of hydrogen and recommendations on the proper use of hydrogen as marine fuel. Wang etc. [19] evaluated the environmental impact of various alternative low-emission fuels for a super yacht using life cycle analysis. The study analysed marine gas oil (MGO), liquefied natural gas (LNG), methanol, biodiesel, and hydrogen and recommended hydrogen from renewable production as a decarbonisation solution for this particular ship type.
For all these studies, their methodology involved applying life cycle analysis and life cycle cost analysis to evaluating the performances of their research or study targets. However, among these studies, none focused on the performance evaluation of small vessels retrofitted with hydrogen fuelled engines. As an important solution for decarbonisation of the maritime industry, it is of interest to the participants in the maritime sector to understand the performances of hydrogen fuelled engines for maritime transportation, especially for the case study vessels in this article, which serve and operate in the waters around Scotland, UK.

2. Materials and Methods

2.1. Life Cycle Analysis

The LCA has been widely applied in the maritime sector, according to the ISO standards, and the following four procedures are fundamentally included for an LCA study:
  • Definition of research/analysis objectives and boundaries;
  • Life cycle inventory analysis (LCI);
  • Life cycle impact analysis (LCIA);
  • Life cycle interpretation [20,21].
Figure 1 presents the flowchart and interactions between these procedures.
To define the objectives and scope of a research study, it is customary to establish specific performance or cost criteria for the system or product under investigation, with a focus on environmental and cost impacts. These environmental impacts are typically classified into various groups, including global warming potential (GWP), acidification potential (AP), and eutrophication potential (EP). Therefore, before delving into a comprehensive analysis, the first crucial step involves setting clear study goals to understand the intended outcomes.
Once the study goals are defined, it becomes essential to establish the scope and boundaries of the analysis, as life cycle assessment (LCA) allows for a comprehensive examination of the target. By defining the scope and boundaries, the analysis avoids becoming overly extensive and time-consuming. Additionally, it enables the identification and prioritization of emissions and pollutants that significantly influence the study outcomes, while disregarding less impactful ones.
Typically, the life stages considered in the LCA are divided into four phases: construction, operation, maintenance, and scrapping. These stages provide a structured approach to evaluating the entire life cycle of the system or product in question.
Setting the scope and boundaries is a critical aspect of simplifying the study, ensuring that the results are credible, and making reasonable assumptions. By doing so, the study becomes more manageable and trustworthy, providing valuable insights into the environmental and cost implications of the researched system or product. Once the scope and boundaries of the study are established, the next step involves selecting a functional unit as a standard or scale for evaluation. This functional unit serves as a reference point that allows for meaningful comparisons between different scenarios.
To facilitate these comparisons effectively, a normalization process is applied. This process involves converting the quantities of selected emissions into various indicative emissions specific to different environmental impacts. By doing so, the data can be standardized and made comparable across diverse environmental contexts. Based on the CML database [22], the emissions contributing to global warming will be normalized by converting into an equivalent quantity of CO2, and the unit is kg CO2 equivalent. Similarly, for AP and EP, the fundamental pollutants are sulphur dioxide and phosphate (SO2 and PO43−). Usually, a functional unit could be the quantified ship performance during its service (such as cargo transport per km), but it can also be set up based on the preferences of the end-users and their objectives.
Following the goal and scope definition, the life cycle inventory analysis can be conducted as shown in the schematic diagram in Figure 2.
The process begins with the establishment of defined goals and scope from the previous step, where an initial LCA plan has been selected and defined. With this plan in place, data relevant to the LCA can be collected, normalized, and aggregated to derive preliminary results. However, the scope of the LCA analysis may be adjusted depending on the availability of pertinent data.
Following the refinement of the scope based on data availability, similar processes of data collection, normalization, and aggregation are carried out. This ensures that a modified, yet comprehensive inventory is obtained for the LCA analysis. By iteratively updating and refining the scope and data, a more accurate and complete picture of the LCA results can be achieved.
The life cycle inventory will be used as a fundamental basis for the life cycle impact analysis, which consists of three steps:
  • Impact categories selection, including indicators and characterization models;
  • Emissions classification to assign LCI results to the selected impact categories;
  • Characterization to calculate the LCI results as a base and apply characterization models to quantify the impacts based on category indicator.
During the final phase of life cycle interpretation, a sensitivity analysis is performed to assess the influence of selected inputs on the established LCA processes and outcomes, including both mid-term and end-term results. The inputs chosen for this analysis are carefully selected based on their importance, accessibility, and uncertainty. By scrutinizing these key factors, the sensitivity analysis helps to understand the robustness and reliability of the LCA results, offering valuable insights into the overall study. For the sensitivity assessment, key parameters will be selected and addressed to understand their impact on the final outcomes of the LCA. It is conducted by varying the collected/assumed value of a parameter, such as 50%, 150%, or 200% of the used value. The trends or the pattern of changing or impacting the final LCA results will be observed to indicate the significance of the key parameters to the LCA outcomes. In the meantime, an uncertainty treatment will be conducted to analyse the confidence levels of the key parameters and data. The selection approaches of data/parameters in sensitivity assessment and uncertainty treatment are different: (1) in sensitivity assessment they are selected based on the data importance to the study; (2) in the uncertainty treatment the selection is according to the data availability. The levels of confidence will be categorized into three levels: low, medium, and high. The higher category means the data, or the values, are more trustworthy. The consequence level is also defined by three levels: severe, intermedium, and slight. The categorisation in this uncertainty treatment is conducted by the project team in which they apply their experience and judgement to provide a level for each parameter and data point. The product of the confidence and consequence levels will present the impacts of the parameters on the LCA outcomes (Table 1).
The outcomes of the LCIA analysis will highlight the notable advantages of using a hydrogen fuelled engine. These results typically yield recommendations for end-users regarding the selection of various alternatives. Additionally, during the interpretation process, the conclusions, limitations, and recommendations of the LCA analysis are presented. This presentation not only elucidates the decisions made but also outlines the constraints inherent in the analysis. By providing this comprehensive interpretation, stakeholders gain a clear understanding of the benefits and considerations associated with the implementation of hydrogen fuelled engines.

2.2. Governing Formula

The analysis approach will follow the LCA guidelines and will be customised with the study. A system breakdown in which the ship is divided into two entities with a consideration of four life stages is shown in Figure 3. The two partial entities are ship hull and machinery while the four stages are construction, operation, maintenance, and scrapping. Figure 3 presents what main activities will be considered under different life stages. As this study investigates the life cycle performances of the hydrogen and HFO powered marine vessel, the main focus is on the main and auxiliary engines. The software ShipLCA v1.4, developed in EU H2020 project—SHIPLYS, has been deployed to ensure the same ship construction, maintenance, and dismantling data are applied. The additional equations will be necessary to estimate the fuel consumption for the hydrogen version of the case ships. The estimation is conducted using the following steps:
A.
Theoretical energy provided from main engine to shaft:
Eprovide = mfuel × LHVMDO × η
where,
Eprovide is the energy provided from the engine to the shaft during operation (kWh),
mfuel is the mass quantity of the fuel oil consumption (kg),
LHVMDO represents the lower hearing value of the MDO (kWh/kg),
and η is the estimated energy efficiency of the original power plant.
B.
Hydrogen fuel required to provide equivalent energy:
mH2 = Eprovide/(ηH2 × LHVH2)
where,
Eprovide is the energy provided from the engine to the shaft during operation (kWh),
mH2 is the mass quantity of the hydrogen consumption (kg),
LHVH2 represents the lower hearing value of the hydrogen (kWh/kg),
and ηH2 is the estimated energy efficiency of the hydrogen power plant.
To clarify the usage of these two equations, the masses of two fuels are estimated following the engine project guide and ship operational data.

2.3. Data Collection and Assumption

Data for four case ships, including a mainland ferry, a pelagic trawler, a large tug ship, and an interisland ferry, were collected. The case specific details for the four ships are shown in Table 2.
To proceed with the LCA analysis, the following assumptions have been applied to the case ship study and inputted into the ShipLCA software:
  • The carbon credit is around 70 € per tonne CO2 based on the study from [23]. The sulphur credit is 7788 € per tonne according to the study from [24].
  • Two types of fuels are under consideration and comparison: hydrogen and marine diesel oil (MDO); the hydrogen fuel in the UK is about 2500 € per tonne [25]; and the MDO price is according to the data found in [26].
  • As the database from ShipLCA has been used, these data include the specification of hull and outfitting processing, transportation means, electricity types, maintenance strategies, and end-of-life scenarios.
  • The operational phase considers the fuel production processes for MDO, hydrogen, and lubricant oils.
  • The drydocking schedule varies. Usually, a drydocking survey is conducted every 2.5 years, and, in some cases, every 5 years for large commercial vessels. In this study, a drydocking is assumed to be conducted every 2.5 years for the purpose of surveying, cleaning, and repairing.
  • For the end-of-life scenarios, the costs of the scrapping are based on the material quantities to be treated from both the ship hull and machineries.
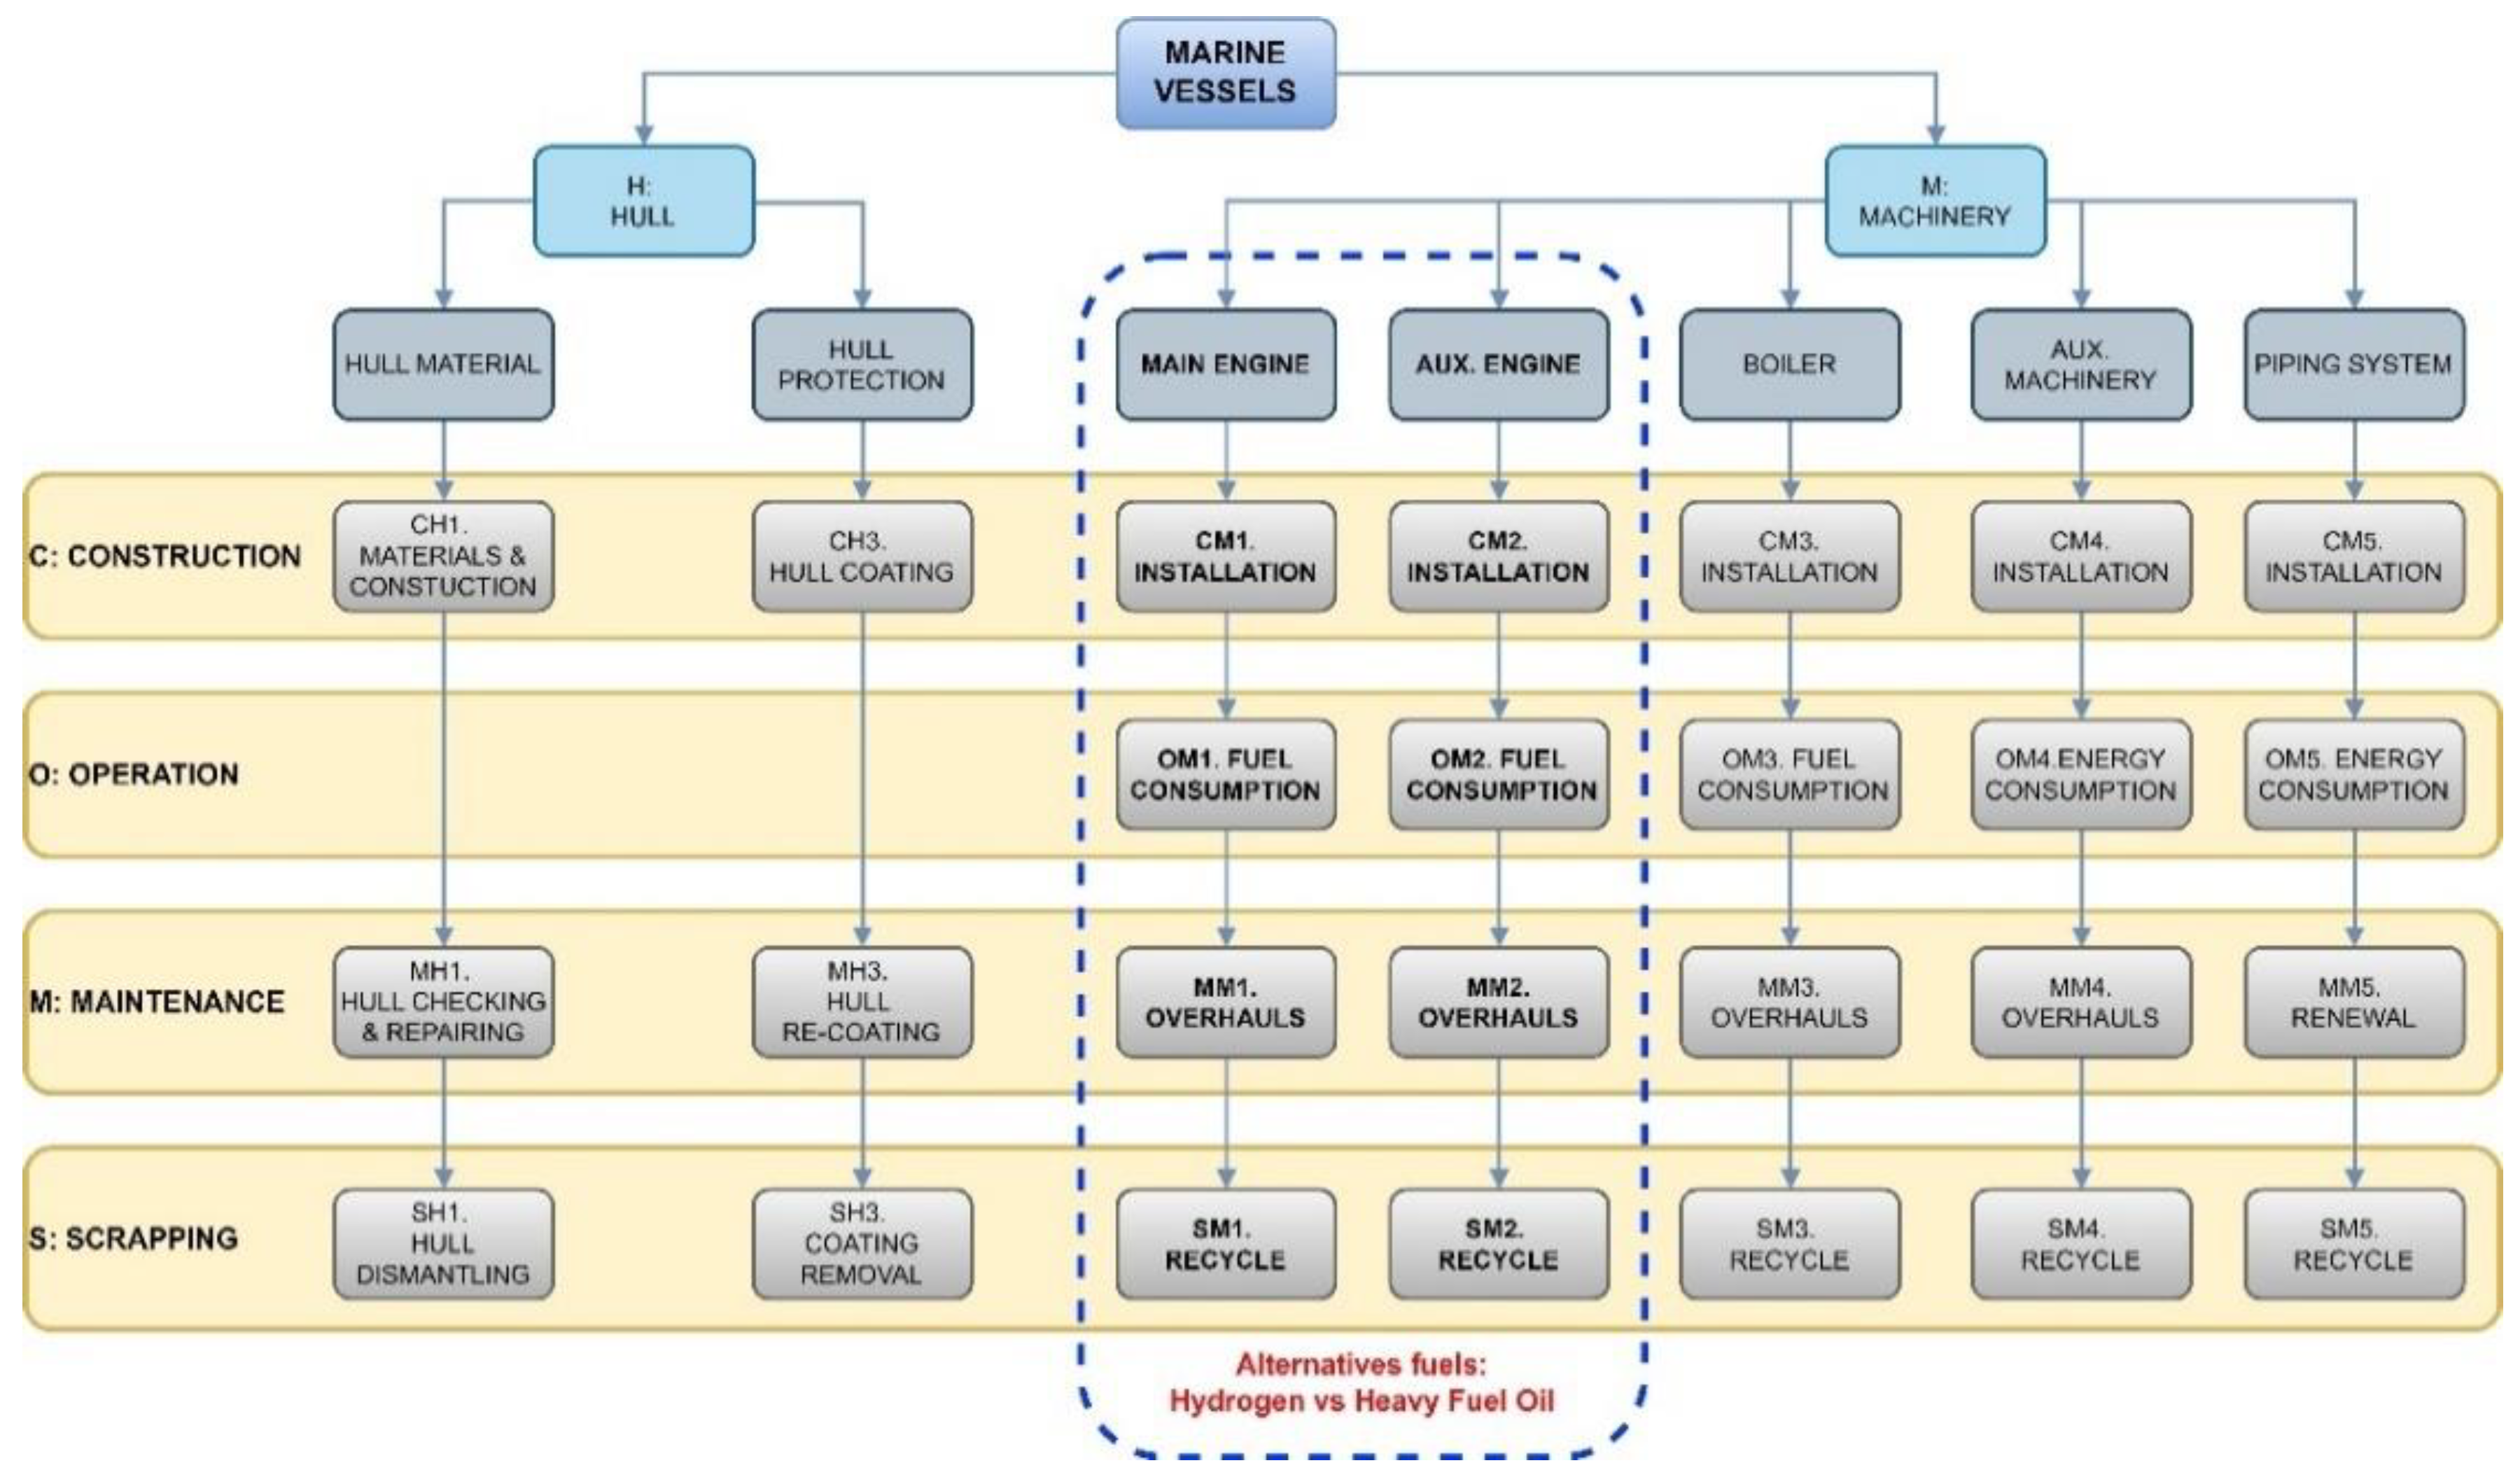
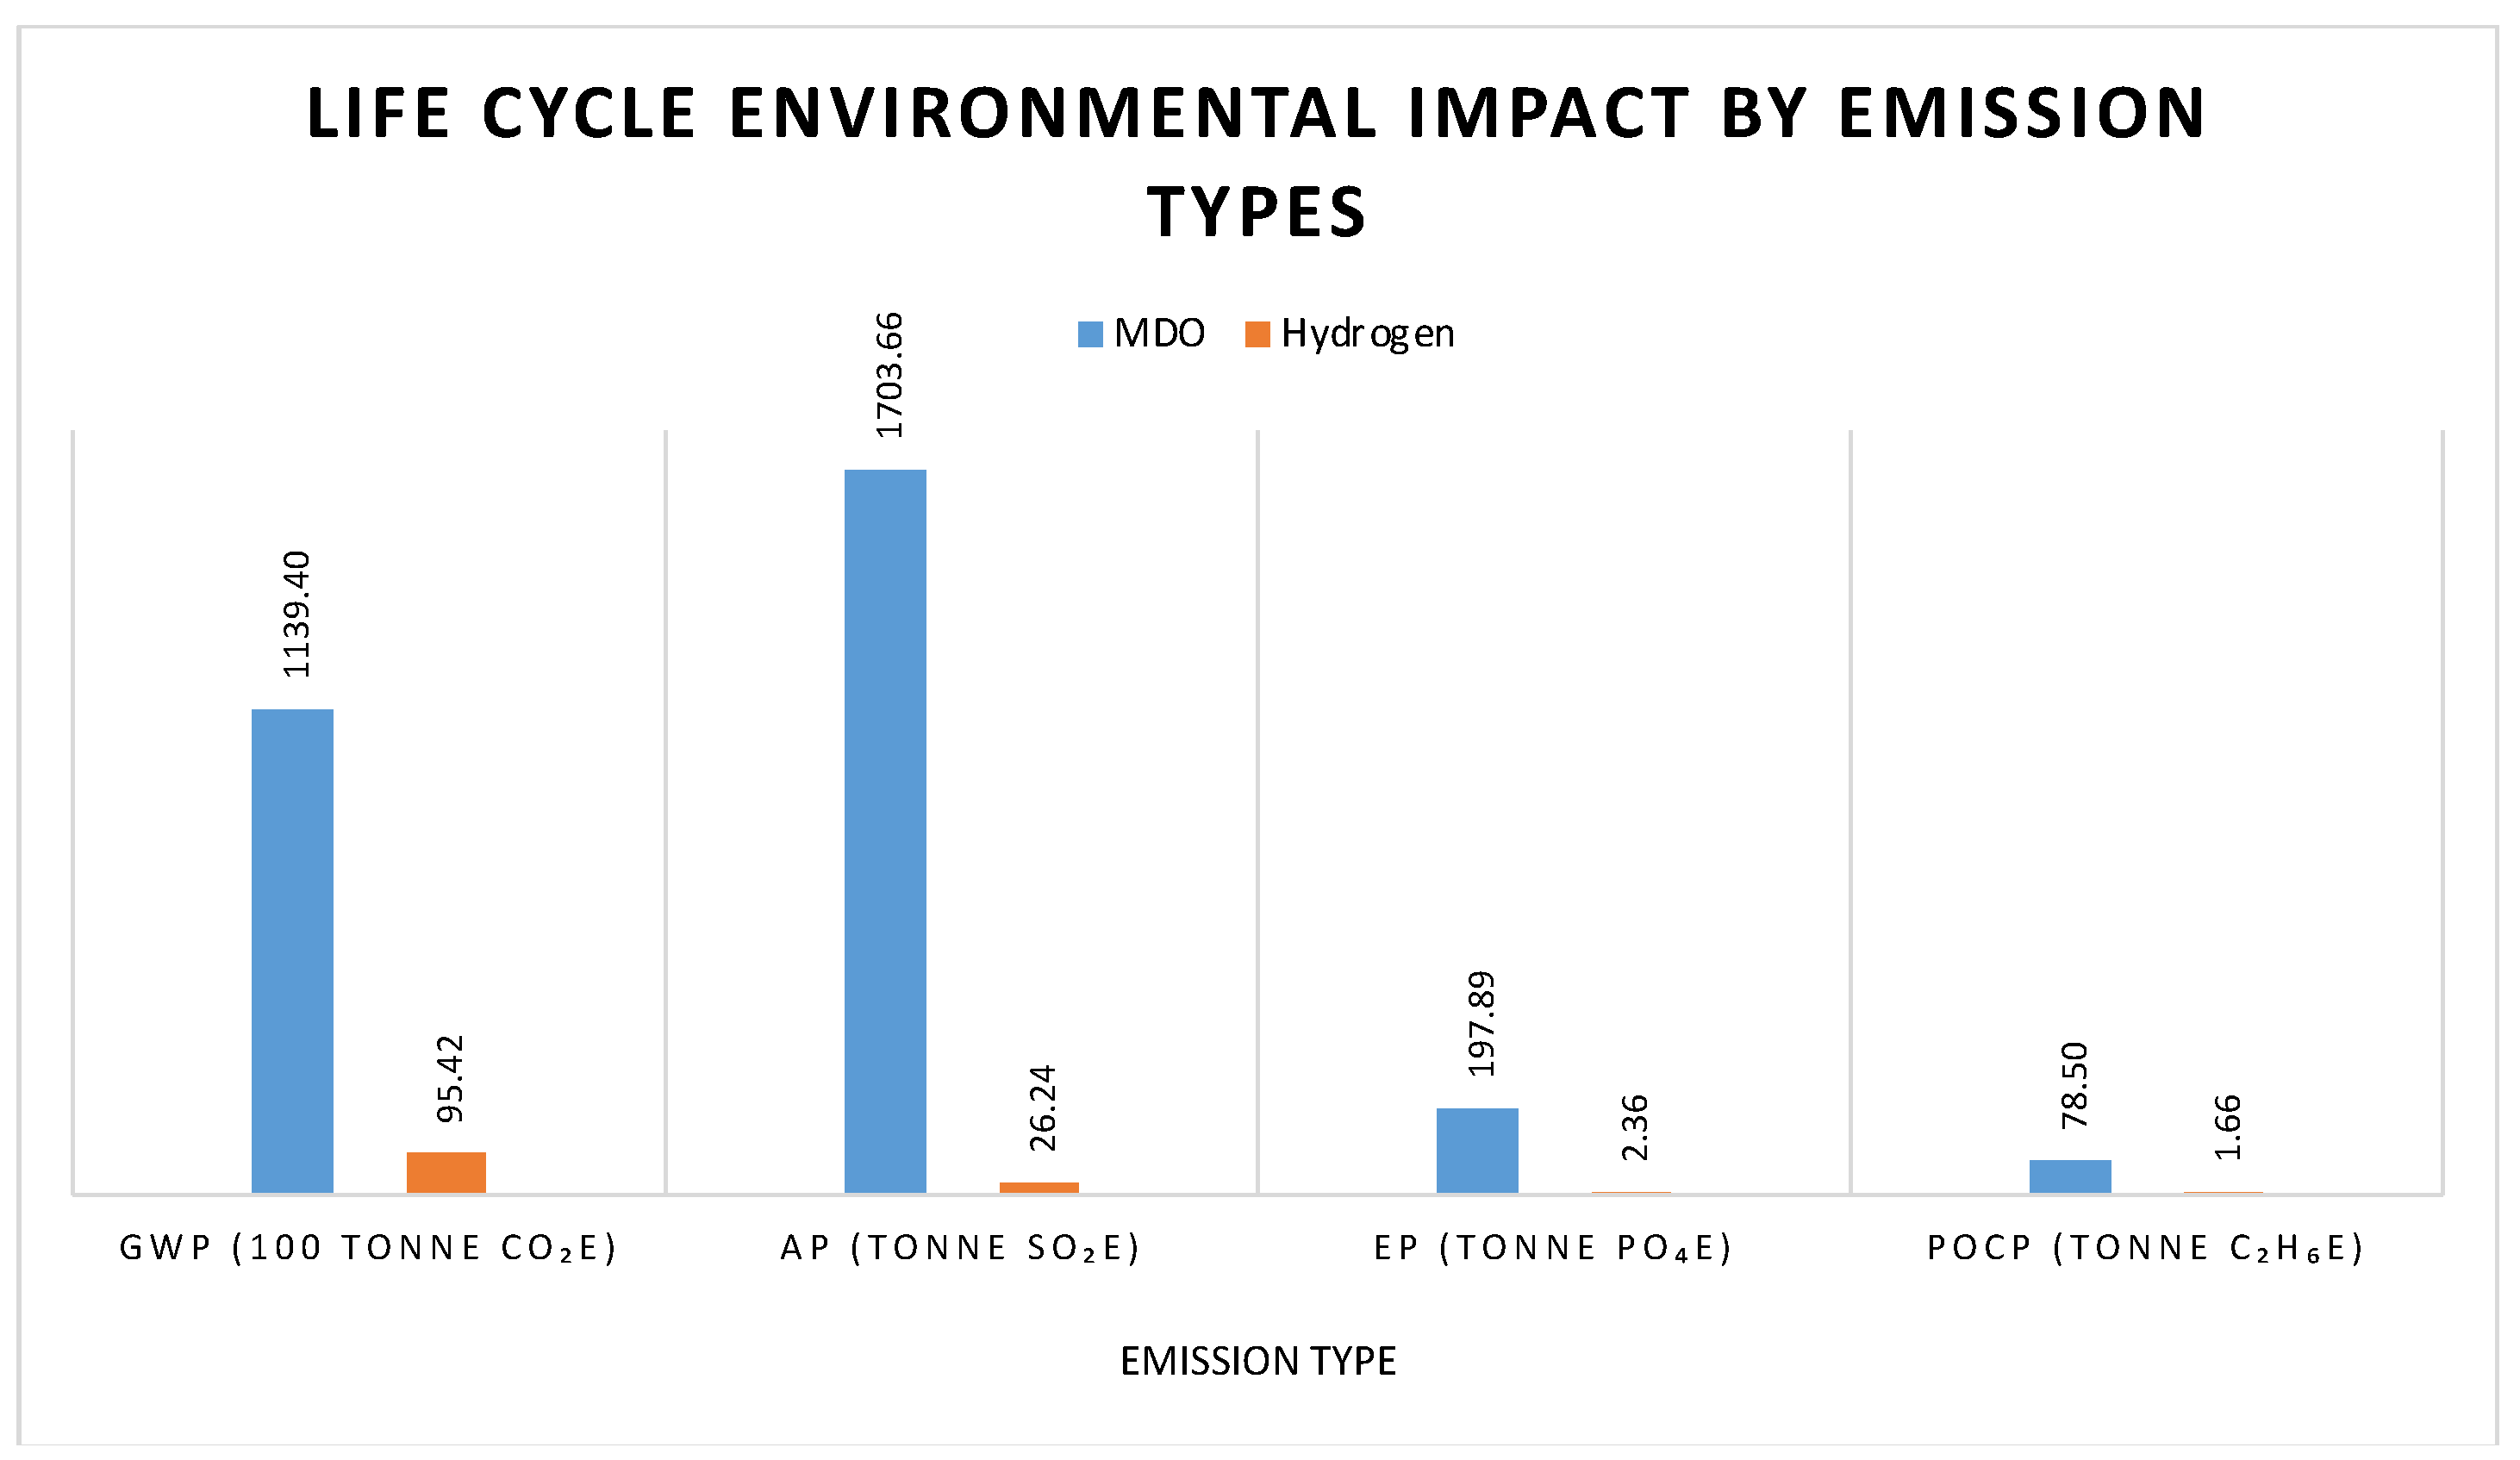
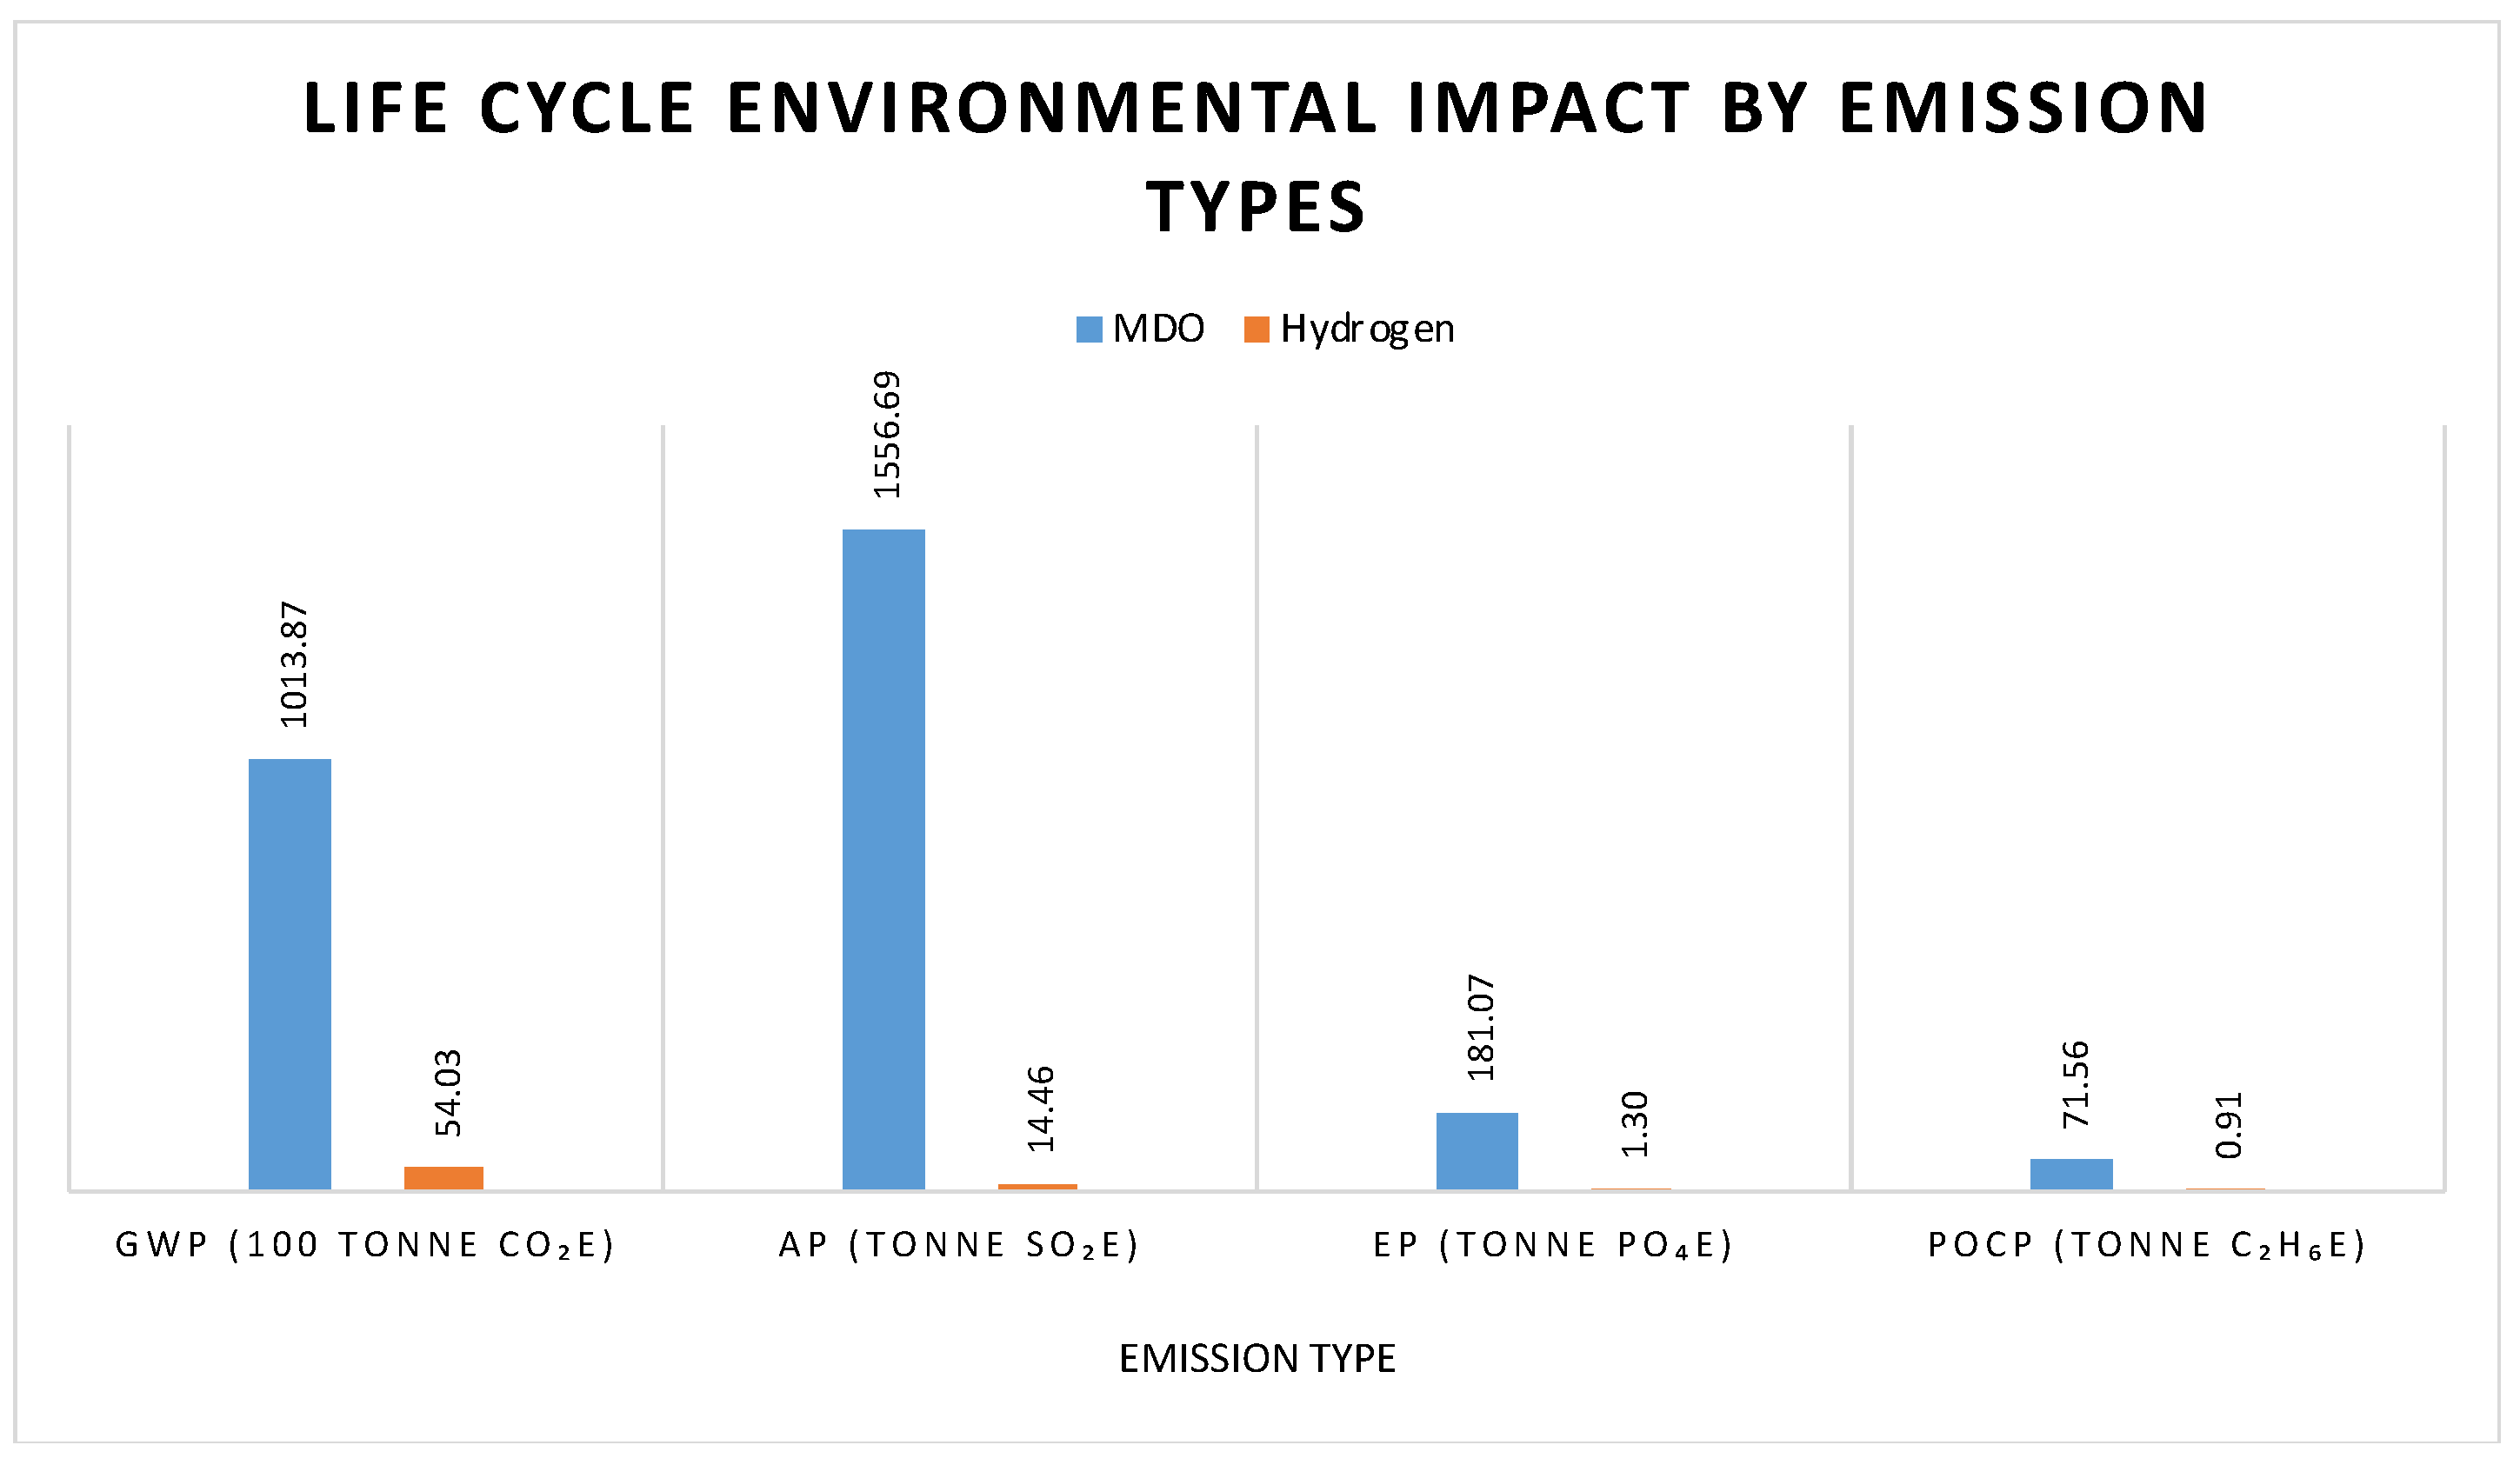
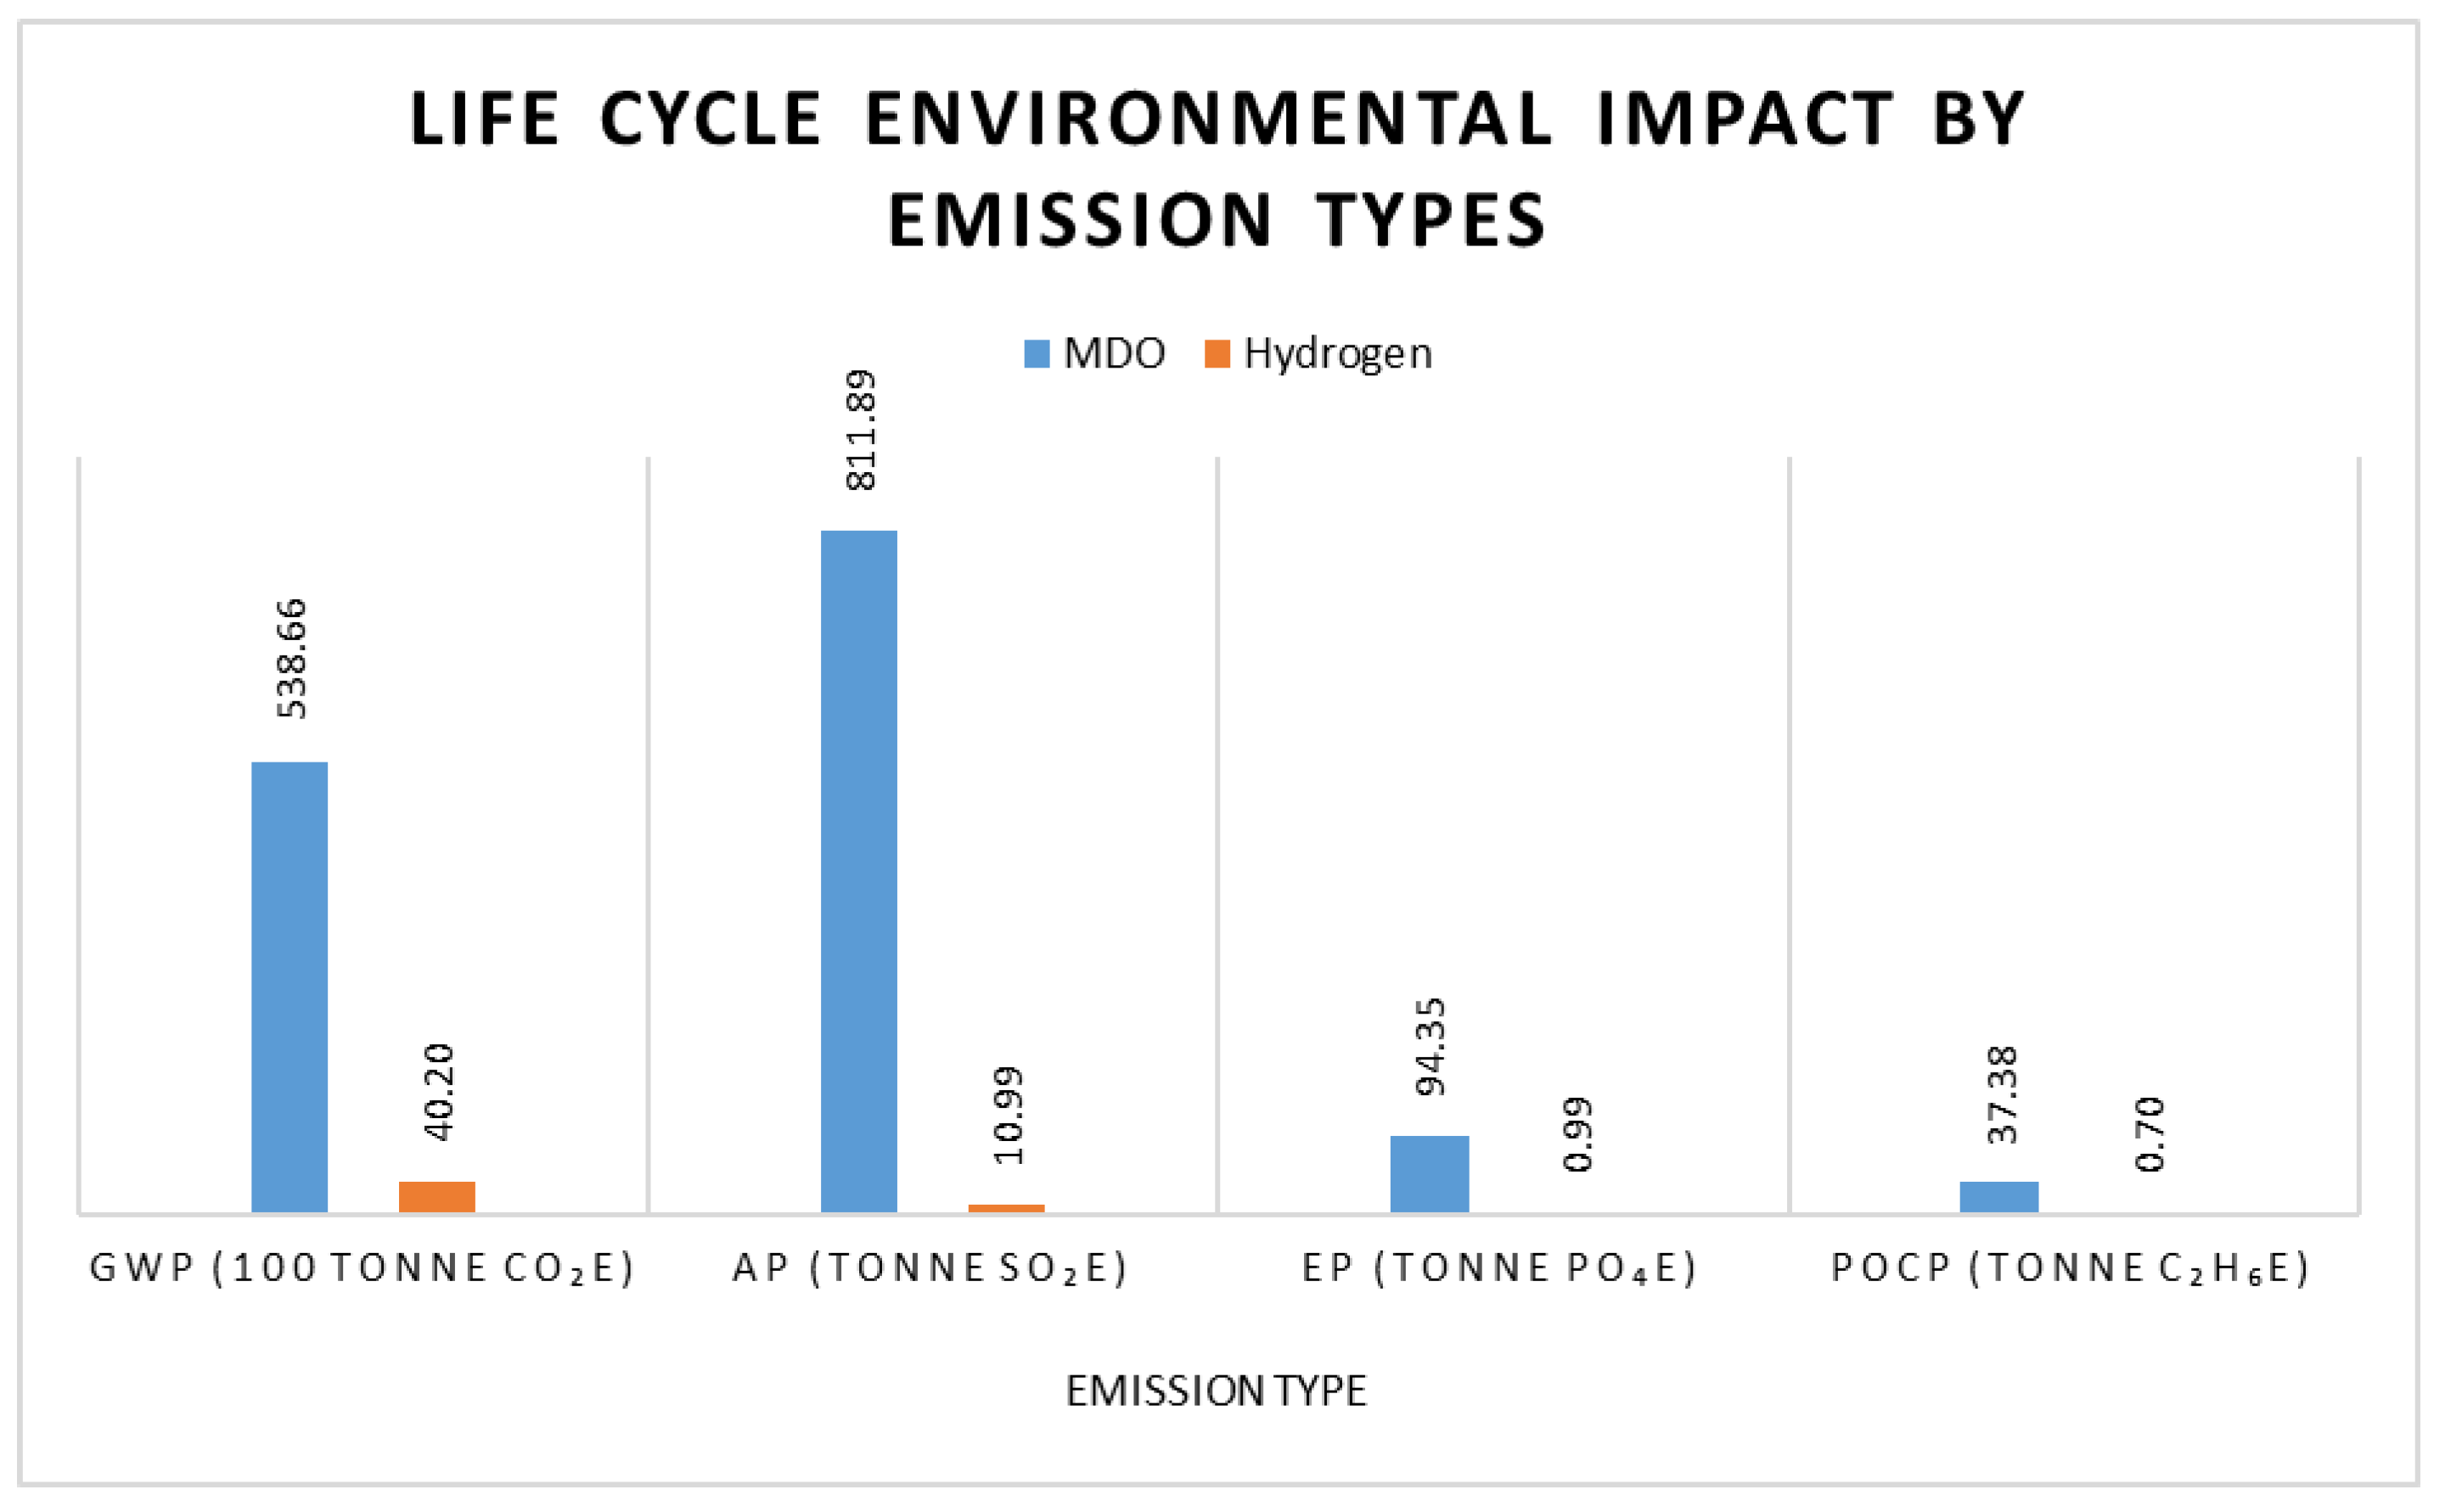
  • Four different categories of the environmental impacts are taken into account: global warming potential (GWP), acidification potential (AP), eutrophication potential (EP) and photochemical ozone creation potential (POCP). The indicative emissions for normalisation and impact evaluation are CO2, SO2, PO4, and C2H6, respectively.
  • The study will consider a 30-year operation for all the case study ships.
The following are the limitations of the study due to data availability and will be further discussed in the next section:
  • The hull structure remains unchanged while considering different versions of the case study vessels.
  • The hydrogen engine, and therefore the price quotation, are not yet available, so the work has a limitation regarding the engine investment because it applies the same engine price for different versions of the case study vessels.
  • The cost of the construction phase in the LCCA is mainly estimating the cost of materials based on empirical equations, the supply chain of the engines, and the construction and installation activities (e.g., cutting, bending, welding, blasting, and coating), which might not be sufficiently reflecting the real-world costs; although, the outcomes of the comparison studies will not be significantly affected.

3. Results

3.1. Life Cycle Assessment (Environmental Impact)

This section presents the evaluation results for four case study ships in terms of environmental impacts. The figures below show the results for four case vessels, i.e., mainland ferry, pelagic trawler, large tug ship, and interisland ferry (Figure 4, Figure 5, Figure 6 and Figure 7).
From the LCA results, it can be seen that the emissions from the MDO version of the ship were much greater than those from the H2 version for the global warming potential (GWP), to which CO2 is one of the main contributors. With the replacement of MDO by H2, the CO2 emissions from ship operation were significantly reduced because the combustion of H2 releases no CO2. For the mainland ferry, the GWP reduction was about 79.71%, which was the lowest reduction among all the case ship vessels. This is because the construction phase contributes a large amount of GHGs, resulting a lower GWP reduction. For the other three vessels, with the replacement of MDO with H2, a GWP reduction of over 91% was achieved.
In terms of AP, EP, and POCP results for all four ships, the reductions reached over 98% as H2 is a green fuel contributing to none of these environmental potentials.

3.2. Life Cycle Cost Assessment (Economy Impact)

In the meantime, the LCCA estimated and investigated the cost of the two versions of the case ships to compare how the total cost/investment varied while applying H2 as fuel instead of MDO. The same activities were under consideration as the LCA analysis and the focus was the cost from capital investment, energy cost, fuel cost, etc. For the case ships, the results are shown in Figure 8, Figure 9, Figure 10 and Figure 11.
With the LCCA analysis, the most important phase was the operation phase, which occupied the largest portion of the total cost since the fuel cost accumulated over the operation stage. This represented about 88% and 80% of the total cost for MDO and H2 version ships, respectively. The two limitations described in the previous section are not considered to have significantly affected the outcomes of this work. This is because the cost is accumulating from the cradle to the grave of the selected ships and most of the costs are from the operational phase.
Additionally, with the consideration of carbon credits, the more carbon emission released, the more carbon credits need to be purchased. This will provide ship operators an option to optimise the cost and policy makers can moderate the carbon credits rate to accelerate the adoption of green fuels in the maritime industry.
Therefore, the prices of the fuels and the carbon credit play vital roles in this cost evaluation. In the next section, a further evaluation will be conducted to illustrate how these two parameters can impact the LCCA results.

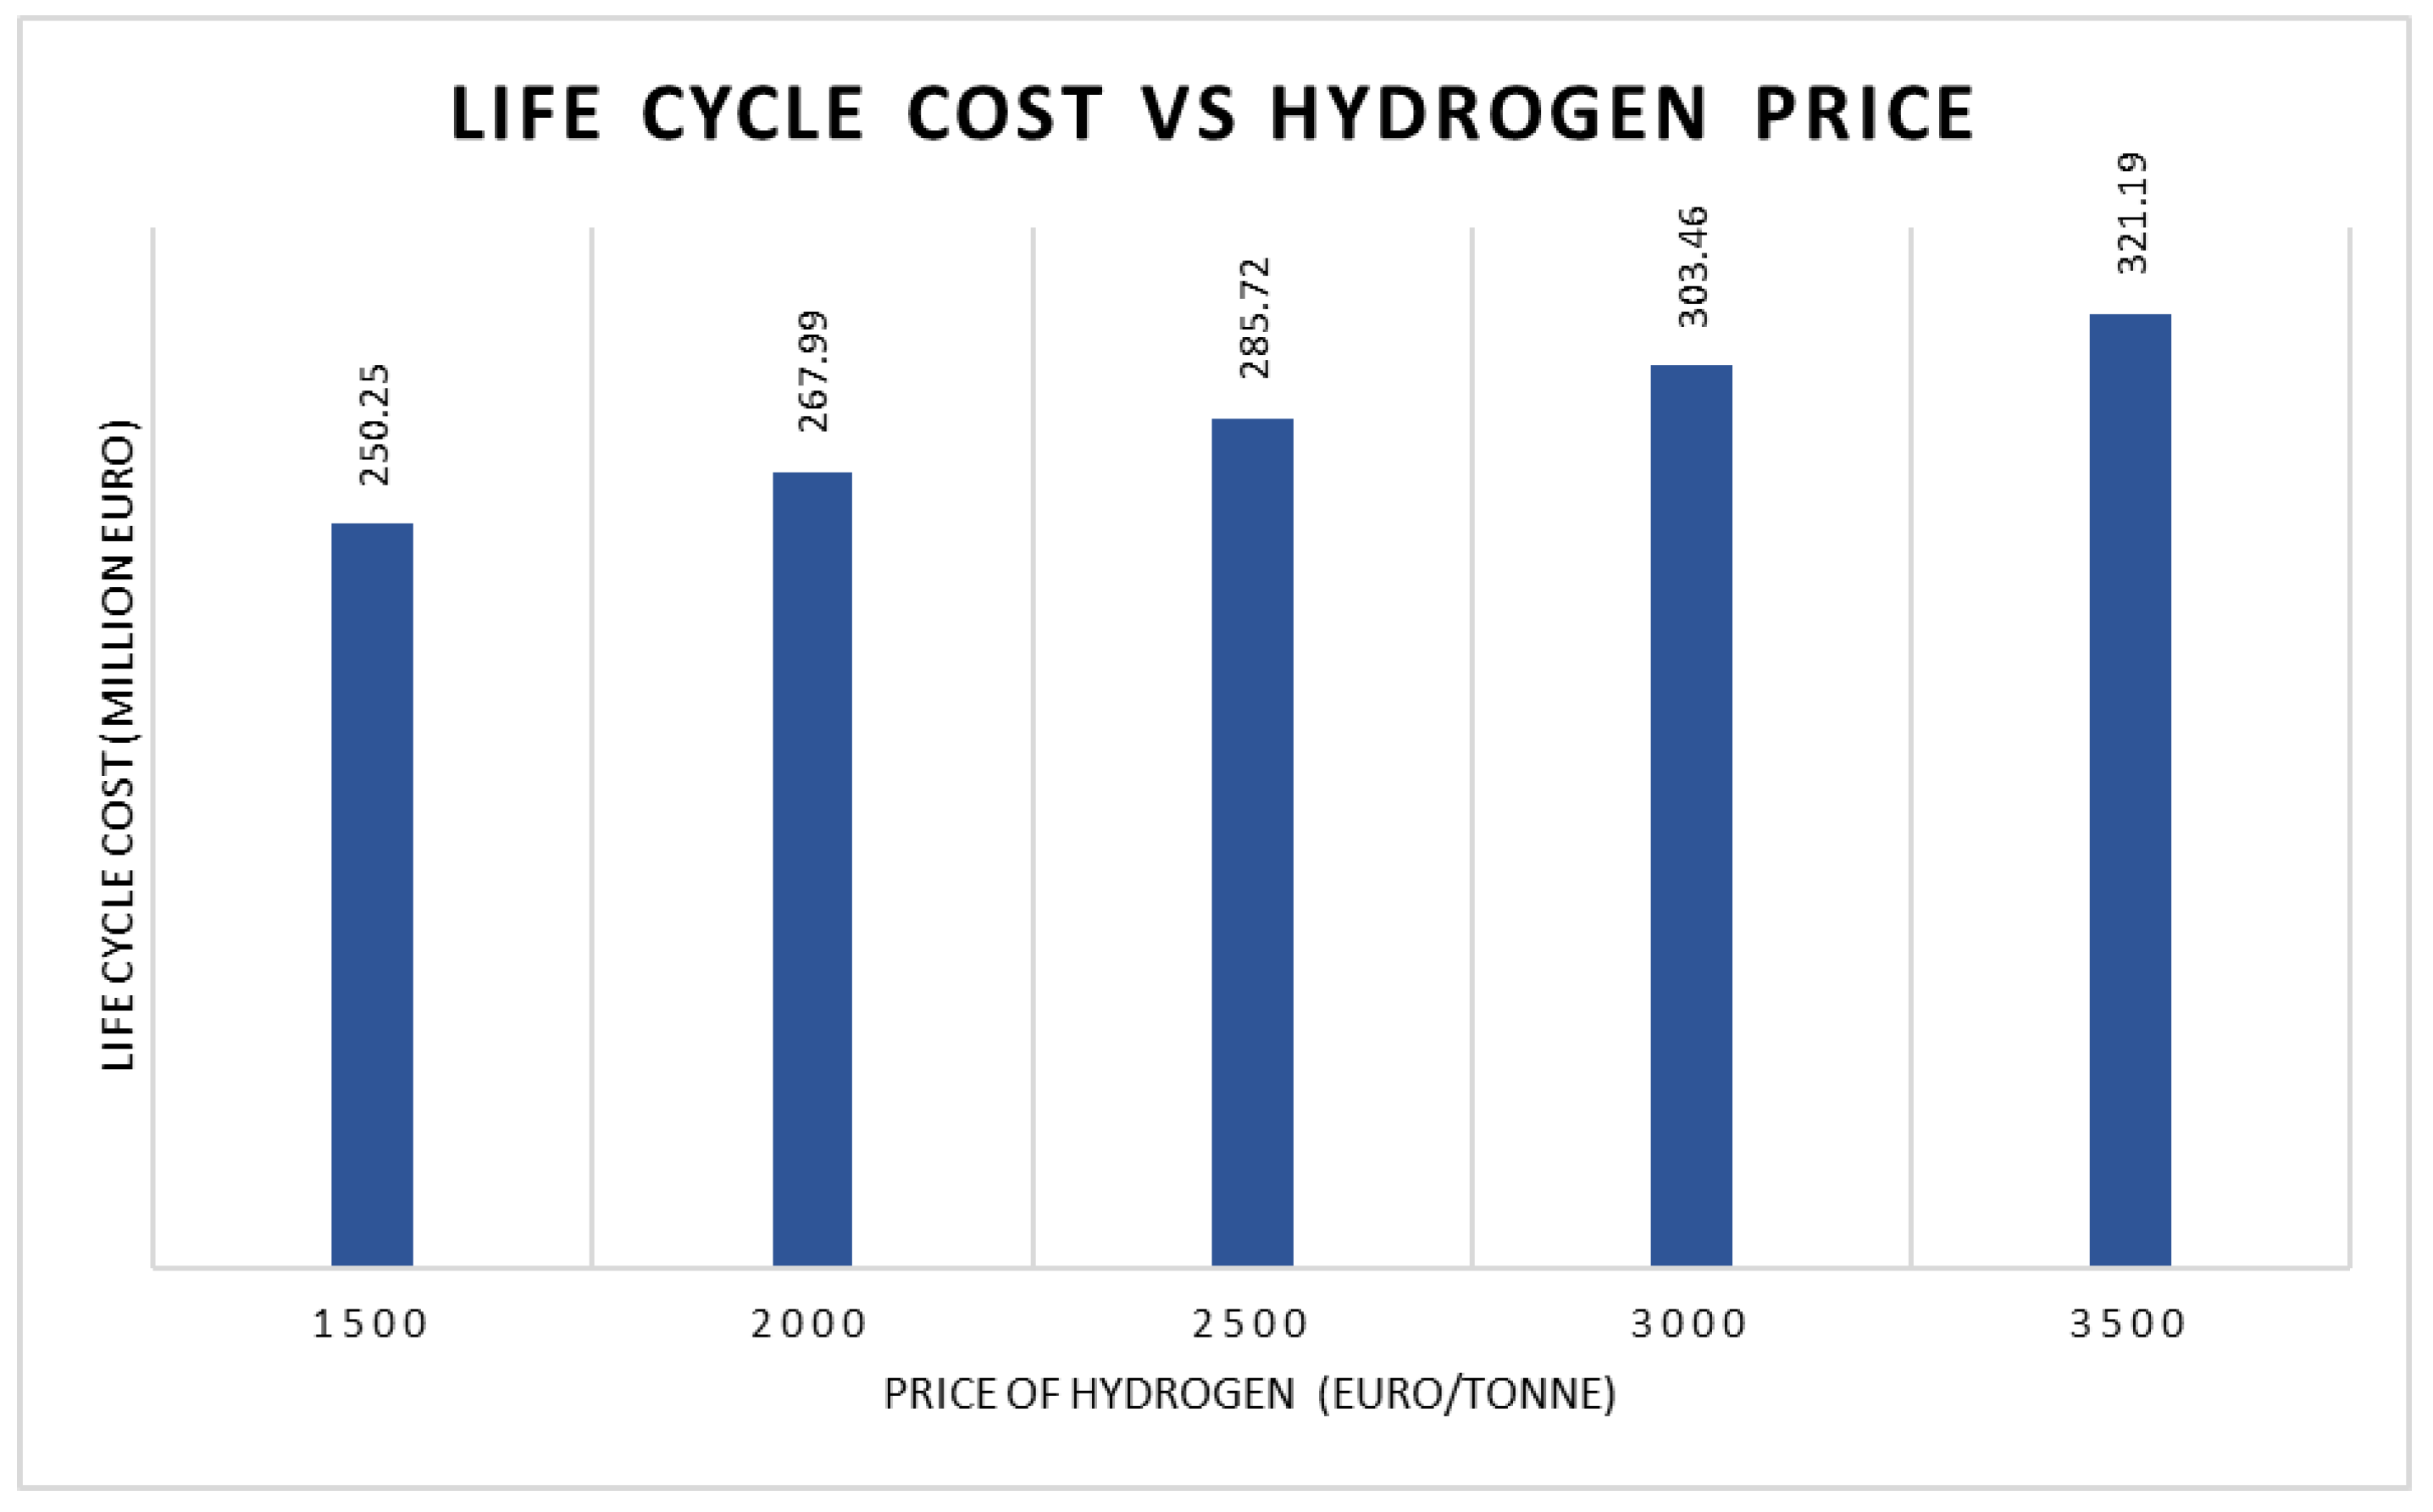
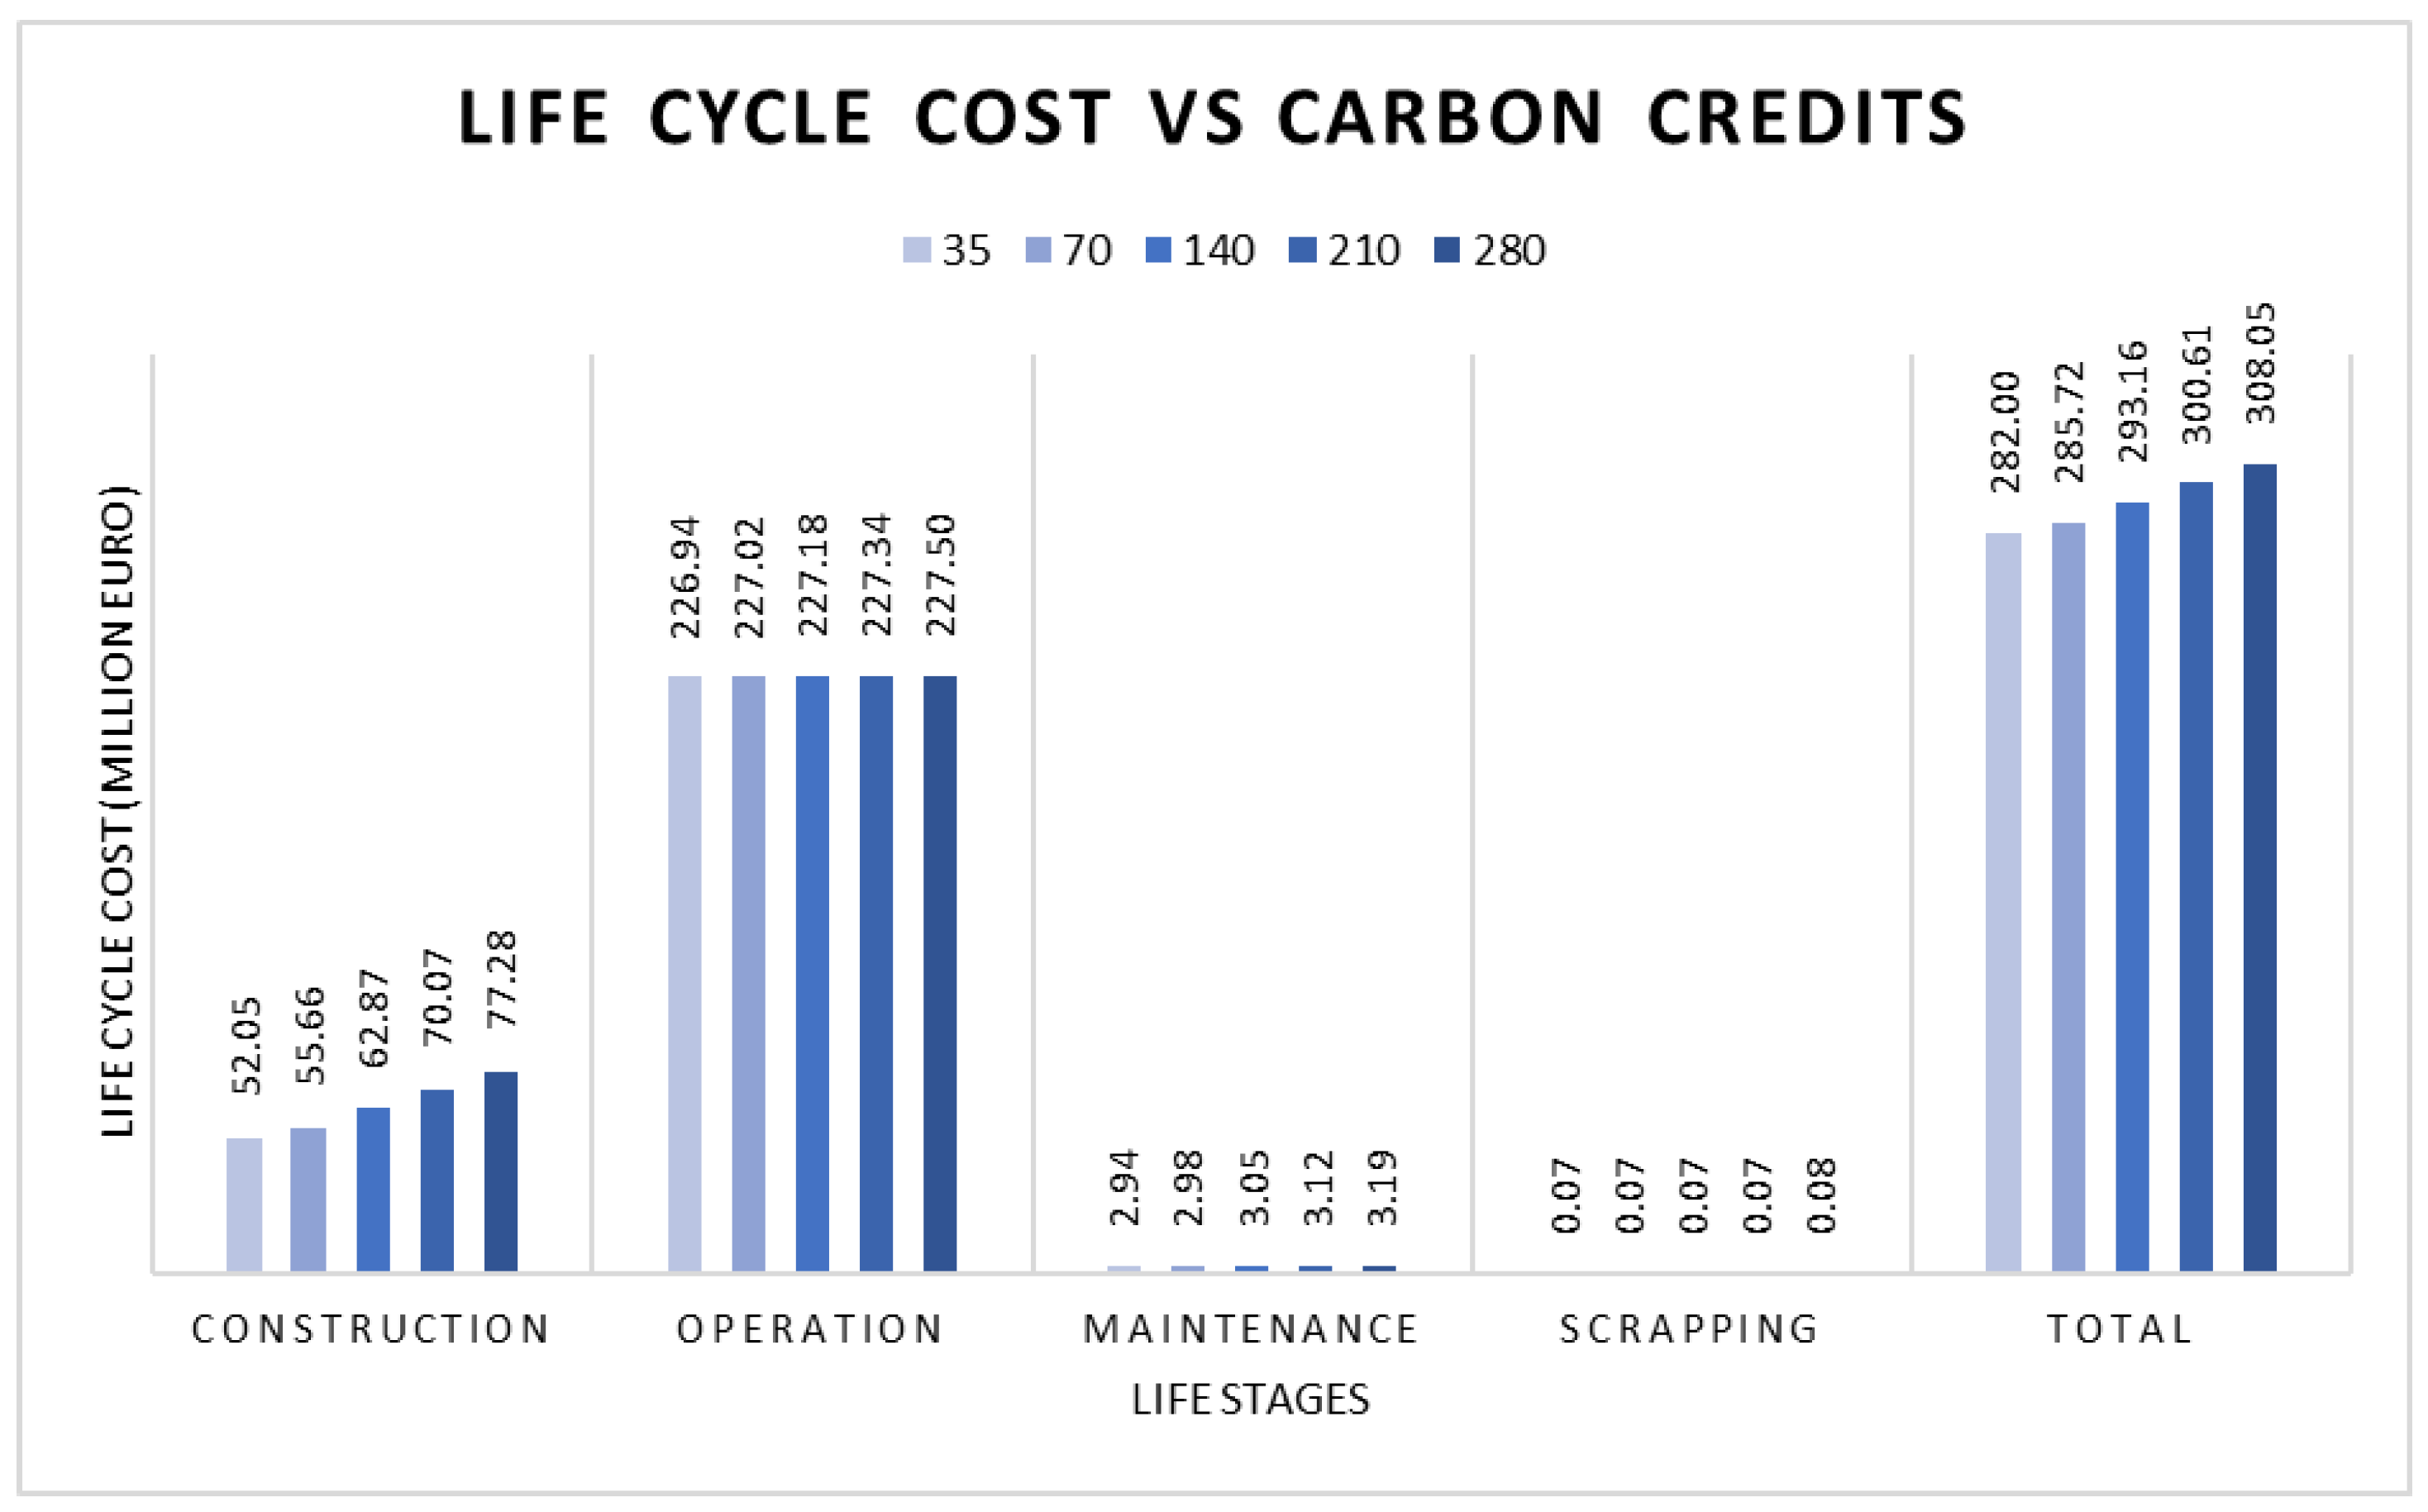
3.3. Sensitivity Assessment

From the study, assumptions were made due to the lack of data to determine comparable results from different scenarios. To test the impact of the assumed parameters, further analysis will be conducted by repeating the LCA analysis with varied assumed values in this section. As not only an assessment of individual parameters, but also a generalised approach for any further investment on parameter sensitivities, this section describes how the sensitivity assessment works and what the results looks like.
The main assumption that may affect the results is the price of hydrogen fuel, which fluctuates for different regions and industries. From the additional run of the LCA and with the hydrogen price ranging from 1500 Euro/ton to 3500 Euro/ton, it was found that the life cycle total cost increased linearly, as shown in Figure 12, which was within expectations. It will be recommended to limit the price of hydrogen fuel to encourage its application by reducing the life cycle expenditures. Another factor assessed was the carbon credit price and the original input was 70 Euro/ton CO2. The situations of 35, 140, 210, and 280 Euro/ton CO2 were evaluated and compared. The effect on the life cycle cost was also linear, but due to the usage of green hydrogen, the increment of cost mainly resulted from the construction phase (Figure 13). The fact is that even though the credit was increasing it was still lower than the traditional version of the ship because the carbon credit for the traditional ship will be even larger due to the large quantity of CO2 emissions from fossil fuels.

3.4. Uncertainty Treatment

The LCA analysis uses data collected from the Neptune project and is also based on data from the literature and assumptions. Therefore, an uncertainty treatment should be included to evaluate the confidence of the parameters/data used in the LCA so that the LCA is trustworthy. The method to conduct the uncertainty treatment is to identify the key parameters/data and use experts’ judgement to categorise the confidence level of each parameter and data point. For this study, the experts among the project team were consulted for their opinions on the key parameters/data selection and their confidence levels.
Ten parameters/data were eventually selected based on the approach of the LCA to estimate the environmental impacts. The confidence levels of all these parameters and data were judged and commented on by the partners and finally summarised and averaged, as listed in Table 3.

4. Conclusions

To follow the IMO’s maritime emission control strategy of reducing 70% of the CO2 emissions and 50% of the GHG by 2050, a range of technologies has emerged, including the usage of hydrogen as a marine fuel for transportation. The application of hydrogen is challenging and one of the purposes of this article was to evaluate the life cycle performance of vessels with hydrogen fuel replacing traditional fuels from the perspective of environmental protection (emissions) and economic feasibility (cost). The following findings were concluded with the support of in-house software SHIPLCA:
  • This paper first provided a generalised LCA approach to evaluate the applications of new alternative green fuels to assess and compare the environmental and economy impacts.
  • Four vessels were investigated, and as expected, hydrogen brought significant improvement by lowering emissions and cost due to the facts of fuel price and carbon credits.
  • The most significant phase of the ship’s life on the environment and economy was the operational phase due to the high fuel consumption and long operational years.
  • A sensitivity analysis was conducted to test how these two parameters, H2 price and carbon credits, can affect the life cycle performance results. It was observed that the lower H2 price will be more attractive; however, a higher carbon credit increased the cost but the overall cost (3.08 × 10⁸ Euro) was still lower than the traditional vessel with MDO (6.67 × 10⁸ Euro).
  • For the uncertainty treatment, the assumptions in this study were evaluated considering their confidence and consequence levels and their impacts on the LCA outcomes were determined.

Author Contributions

Conceptualization, H.W., M.Z.A., X.X. and E.B.; methodology, H.W., M.Z.A., X.X. and E.B.; software, H.W.; validation, H.W.; formal analysis, H.W.; investigation, H.W., M.Z.A., X.X. and E.B.; resources, H.W., M.Z.A., X.X. and E.B.; data curation, H.W., M.Z.A., X.X. and E.B.; writing—original draft preparation, H.W. and X.X.; writing—review and editing, M.Z.A., X.X. and E.B.; visualization, H.W. and M.Z.A.; supervision, E.B.; project administration, X.X. and E.B.; funding acquisition, E.B. All authors have read and agreed to the published version of the manuscript.

Funding

This research was funded by Innovate UK, project number 10009681.

Institutional Review Board Statement

Not applicable.

Informed Consent Statement

Not applicable.

Data Availability Statement

No new data were created or analyzed in this study. Data sharing is not applicable to this article.

Acknowledgments

The Maritime Safety Research Centre (MSRC) at the University of Strathclyde is an industry–university partnership involving Strathclyde’s Department of Naval Architecture, Ocean & Marine Engineering and sponsors of Royal Caribbean Group and DNV. The opinions expressed herein are those of the authors and do not reflect the views of the UK DfT, DNV, or RCG.

Conflicts of Interest

The authors declare no conflict of interest.

References

  1. IRENA. A Pathway to Decarbonise the Shipping Sector by 2050; International Renewable Energy Agency: Masdar City, United Arab Emirates, 2021. [Google Scholar]
  2. Department for Transport. UK Domestic Maritime Decarbonisation Consultation: Plotting the Course to Zero; Department for Transport: London, UK, 2022. [Google Scholar]
  3. IMO. Initial IMO Strategy on Reduction of GHG Emissions from Ships; IMO: London, UK, 2018; Available online: https://www.imo.org/en/OurWork/Environment/Pages/IMO-Strategy-on-reduction-of-GHG-emissions-from-ships.aspx (accessed on 5 December 2022).
  4. Department for Transport. Clean Maritime Plan; UK Government: London, UK, 2019.
  5. Marketa, P. Decarbonising Maritime Transport: The EU Perspective; EU Think Tank: Brussel, Belgium, 2020. [Google Scholar]
  6. Stefanides, M. A Pathways to Decarbonise the Shipping Sector by 2050 Presenter; International Renewable Energy Agency: Masdar City, United Arab Emirates, 2022. [Google Scholar]
  7. Warwick, N.; Griffiths, P.; Keeble, J.; Archibald, A.; Pyle, J.; Shine, K. Atmospheric Implications of Increased Hydrogen Use. 2022. Available online: https://assets.publishing.service.gov.uk/government/uploads/system/uploads/attachment_data/file/1067144/atmospheric-implications-of-increased-hydrogen-use.pdf (accessed on 5 December 2022).
  8. Frazer-Nash Consultancy. Fugitive Hydrogen Emissions in a Future Hydrogen Economy; Technical Report; Frazer-Nash Consultancy: Glasgow, UK, 2022. [Google Scholar]
  9. Taccani, R.; Malabotti, S.; Dall’Armi, C.; Micheli, D. High energy density storage of gaseous marine fuels: An innovative concept and its application to a hydrogen powered ferry. Int. Shipbuild. Prog. 2020, 67, 33–56. [Google Scholar] [CrossRef]
  10. Aarskog, F.G.; Danebergs, J.; Strømgren, T.; Ulleberg, Ø. Energy and cost analysis of a hydrogen driven high speed passenger ferry. Int. Shipbuild. Prog. 2020, 67, 97–123. [Google Scholar] [CrossRef]
  11. Trillos, J.C.G.; Wilken, D.; Brand, U.; Vogt, T. Life cycle assessment of a hydrogen and fuel cell ropax ferry prototype. In Progress in Life Cycle Assessment 2019; Springer: Berlin/Heidelberg, Germany, 2021; pp. 5–23. [Google Scholar]
  12. Gomez Trillos, J.C.; Wilken, D.; Brand, U.; Vogt, T. HySeas III: The World’s First Sea-Going Hydrogen-Powered Ferry–A Look at its Technical Aspects, Market Perspectives and Environmental Impacts. In Nutzung Regenerativer Energiequellen und Wasserstofftechnik 2019, ELMAR/26. REGWA Symposium 2019, Stralsund, Germany, 6–8 November 2019; HOST—Hochschule Stralsund: Stralsund, Germany, 2019; pp. 57–80. [Google Scholar]
  13. Ling-Chin, J.; Roskilly, A.P. A comparative life cycle assessment of marine power systems. Energy Convers. Manag. 2016, 127, 477–493. [Google Scholar] [CrossRef]
  14. Gilbert, P.; Walsh, C.; Traut, M.; Kesieme, U.; Pazouki, K.; Murphy, A. Assessment of full life-cycle air emissions of alternative shipping fuels. J. Clean. Prod. 2018, 172, 855–866. [Google Scholar] [CrossRef]
  15. Ling-Chin, J.; Roskilly, A.P. Investigating the implications of a new-build hybrid power system for Roll-on/Roll-off cargo ships from a sustainability perspective—A life cycle assessment case study. Appl. Energy 2016, 181, 416–434. [Google Scholar] [CrossRef]
  16. Kanchiralla, F.M.; Brynolf, S.; Malmgren, E.; Hansson, J.; Grahn, M. Life-Cycle Assessment and Costing of Fuels and Propulsion Systems in Future Fossil-Free Shipping. Environ. Sci. Technol. 2022, 56, 12517–12531. [Google Scholar] [CrossRef] [PubMed]
  17. Wang, Z.; Zhao, F.; Dong, B.; Wang, D.; Ji, Y.; Cai, W.; Han, F. Life cycle framework construction and quantitative assessment for the hydrogen fuelled ships: A case study. Ocean Eng. 2023, 281, 114740. [Google Scholar] [CrossRef]
  18. Jang, H.; Jeong, B.; Zhou, P.; Ha, S.; Park, C.; Nam, D.; Rashedi, A. Parametric trend life cycle assessment for hydrogen fuel cell towards cleaner shipping. J. Clean. Prod. 2022, 372, 133777. [Google Scholar]
  19. Wang, Y.; Maidment, H.; Boccolini, V.; Wright, L. Life cycle assessment of alternative marine fuels for super yacht. Reg. Stud. Mar. Sci. 2022, 55, 102525. [Google Scholar]
  20. ISO 14044:2006; Environmental Management—Life Cycle Assessment—Requirements and Guidelines. The International Organization for Standardization: Geneva, Switzerland, 2006.
  21. ISO 14040:2006; Environmental Management—Life Cycle Assessment—Principles and Framework. The International Organization for Standardization: Geneva, Switzerland, 2006.
  22. CML. CML-IA Characterisation Factors—Leiden University; Institute of Environmental Sciences (CML): Leiden, The Netherlands, 2016. [Google Scholar]
  23. World Bank. State and Trends of Carbon Pricing 2022; World Bank: Washington, DC, USA, 2022. [Google Scholar]
  24. Maibach, M.; Schreyer, C.; Sutter, D.; Van Essen, H.P.; Boon, B.H.; Smokers, R.; Schroten, A.; Doll, C.; Pawlowska, B. Handbook on Estimation of External Cost in the Transport Sector, Produced within the Study Internalisation Measures and Policies for All external Cost of Transport (IMPACT) version 1.0; CE Delft: Delft, The Netherlands, 2007. [Google Scholar]
  25. Petro Industry News (PIN). How Much Does a Gallon of Hydrogen Fuel Cost? 2023. Available online: https://www.petro-online.com/news/measurement-and-testing/14/breaking-news/how-much-does-a-gallon-of-hydrogen-fuel-cost/57718 (accessed on 5 December 2022).
  26. Ship & Bunker. World Bunker Prices. 2023. Available online: https://shipandbunker.com/prices (accessed on 1 February 2023).
Figure 1. The life cycle assessment procedures.
Sustainability 15 12946 g001
Figure 2. Schematic chart of life cycle inventory analysis.
Sustainability 15 12946 g002
Figure 3. Overall study scope and system.
Sustainability 15 12946 g003
Figure 4. Mainland Ferry—Life Cycle Environmental Impacts.
Sustainability 15 12946 g004
Figure 5. Pelagic Trawler—Life Cycle Environmental Impacts.
Sustainability 15 12946 g005
Figure 6. Large Tug Ship—Life Cycle Environmental Impacts.
Sustainability 15 12946 g006
Figure 7. Interisland Ferry—Life Cycle Environmental Impacts.
Sustainability 15 12946 g007
Figure 8. Mainland Ferry—Life Cycle Cost Impacts.
Sustainability 15 12946 g008
Figure 9. Pelagic Trawler—Life Cycle Cost Impacts.
Sustainability 15 12946 g009
Figure 10. Large Tug Ship—Life Cycle Cost Impacts.
Sustainability 15 12946 g010
Figure 11. Interisland Ferry—Life Cycle Cost Impacts.
Sustainability 15 12946 g011
Figure 12. Total life cycle cost vs. hydrogen price.
Sustainability 15 12946 g012
Figure 13. Total life cycle cost vs. carbon credits (phase view).
Sustainability 15 12946 g013
Table 1. Impact matrix: confidence and consequence levels.
Consequence
SlightIntermediumSevere
ConfidenceLow369
Medium246
High123
Table 2. Data collection for the case study ships.
Life StagesParametersMainland FerryPelagic
Trawler
Large Tug Interisland
Ferry
Units
DesignLength overall12569.938.465.4m
Length between perpendiculars11961.83558.4m
Breadth19.515.613.413.8m
Depth89.57.95.6m
Draught5.37.96.03.6m
Block Coefficient0.590.550.650.49-
Service speed2415.213.511kn
Number of crew331256
Engine Power4 × 540054002 × 21502 × 1200kW
Ship total price352884.5million €
ConstructionNumber of Engines4122
Engine weight207 × 463.215.6 × 210.7 × 2tonne
Maximum engine output5400540021501200kW
OperationAnnual working hours1200120012001200
Number of engines running4122(@85% MCR)
Actual working power per engine4590459018281020kW
(85% MCR)
Actual specific fuel oil consumption175175202188g/kWh
Actual specific lubricating oil consumption0.60.5--g/kWh
Table 3. Uncertainty treatment: parameters/data and their impacts.
No.Parameter/DataConfidence Consequence Final Impact
1Carbon creditMediumIntermediumMedium
2MDO priceHighSevereLow
3Hydrogen priceMediumSevereMedium
4Drydocking intervalMediumSlightLow
5Scrapping costLowSlightLow
6Engine efficiencyMediumSevereMedium
7Electricity typeHighIntermediumLow
8Operational yearsLowSevereHigh
9SFOCHighSevereLow
10Transportation meansLowSlightLow
Disclaimer/Publisher’s Note: The statements, opinions and data contained in all publications are solely those of the individual author(s) and contributor(s) and not of MDPI and/or the editor(s). MDPI and/or the editor(s) disclaim responsibility for any injury to people or property resulting from any ideas, methods, instructions or products referred to in the content.

