

Virtual Reality as a Tool for Sustainable Training and Education of Employees in Industrial Enterprises

Abstract
:1. Introduction
2. Review of the Literature
3. Materials and Methods
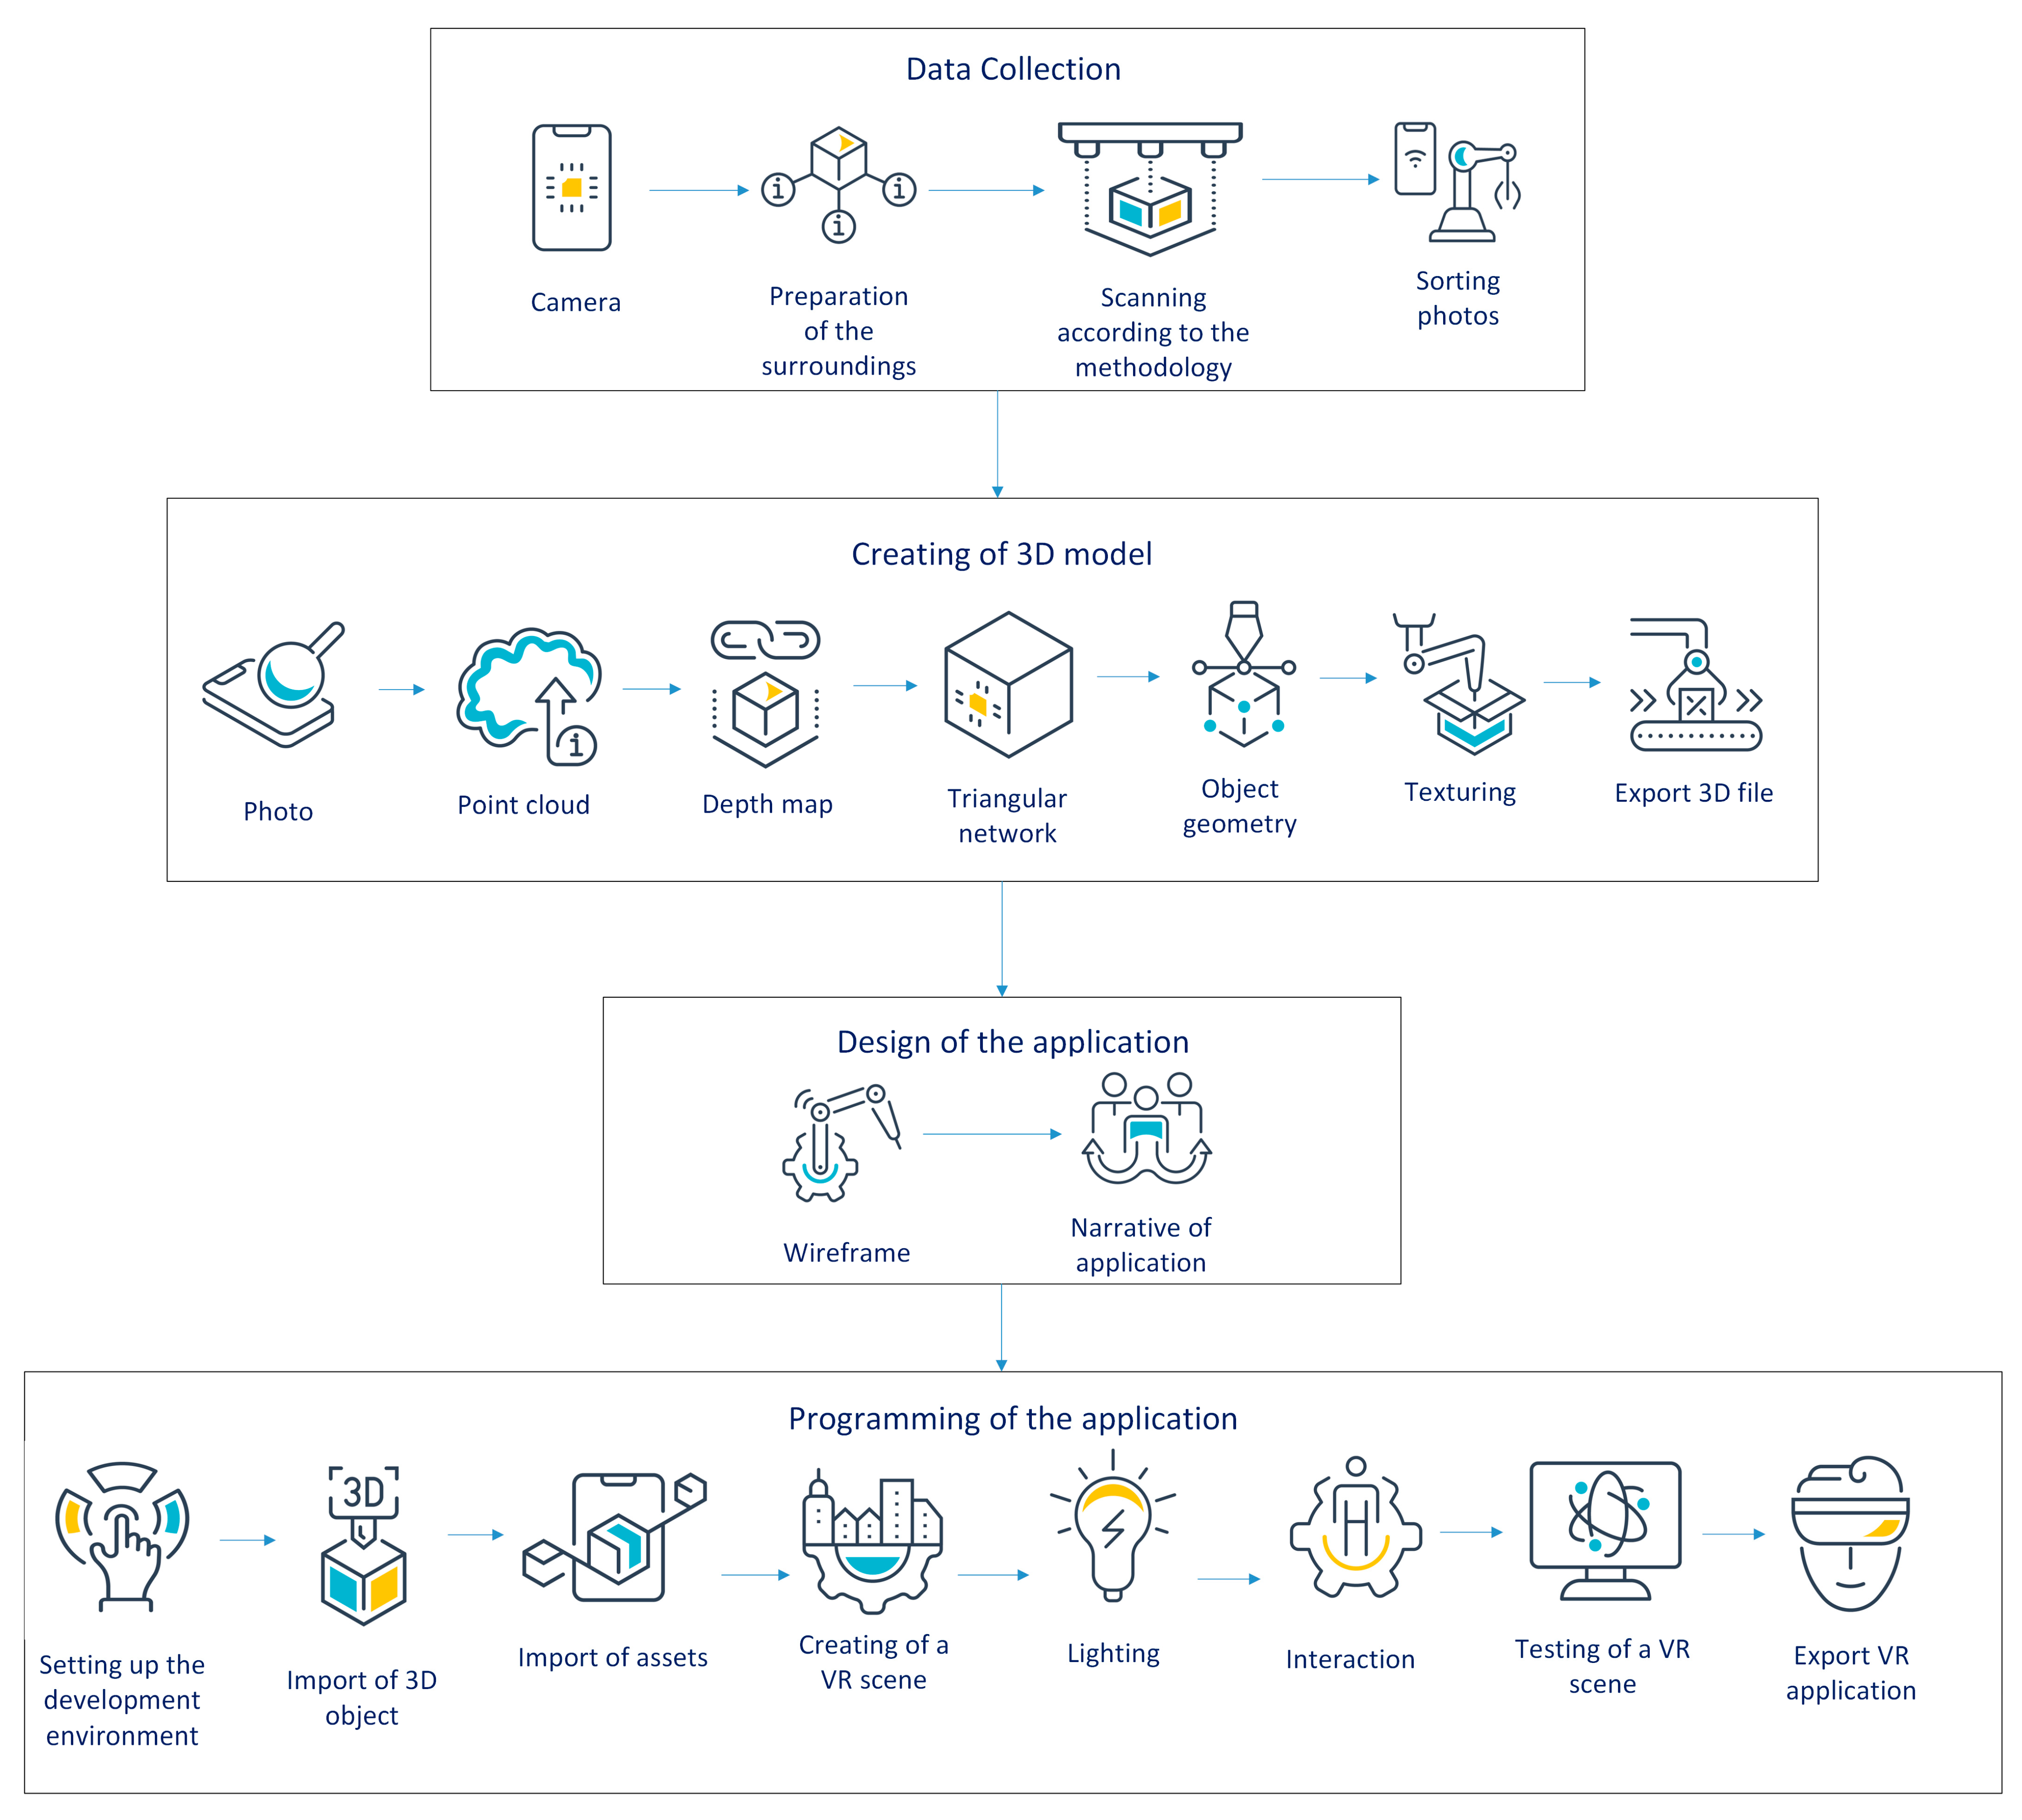
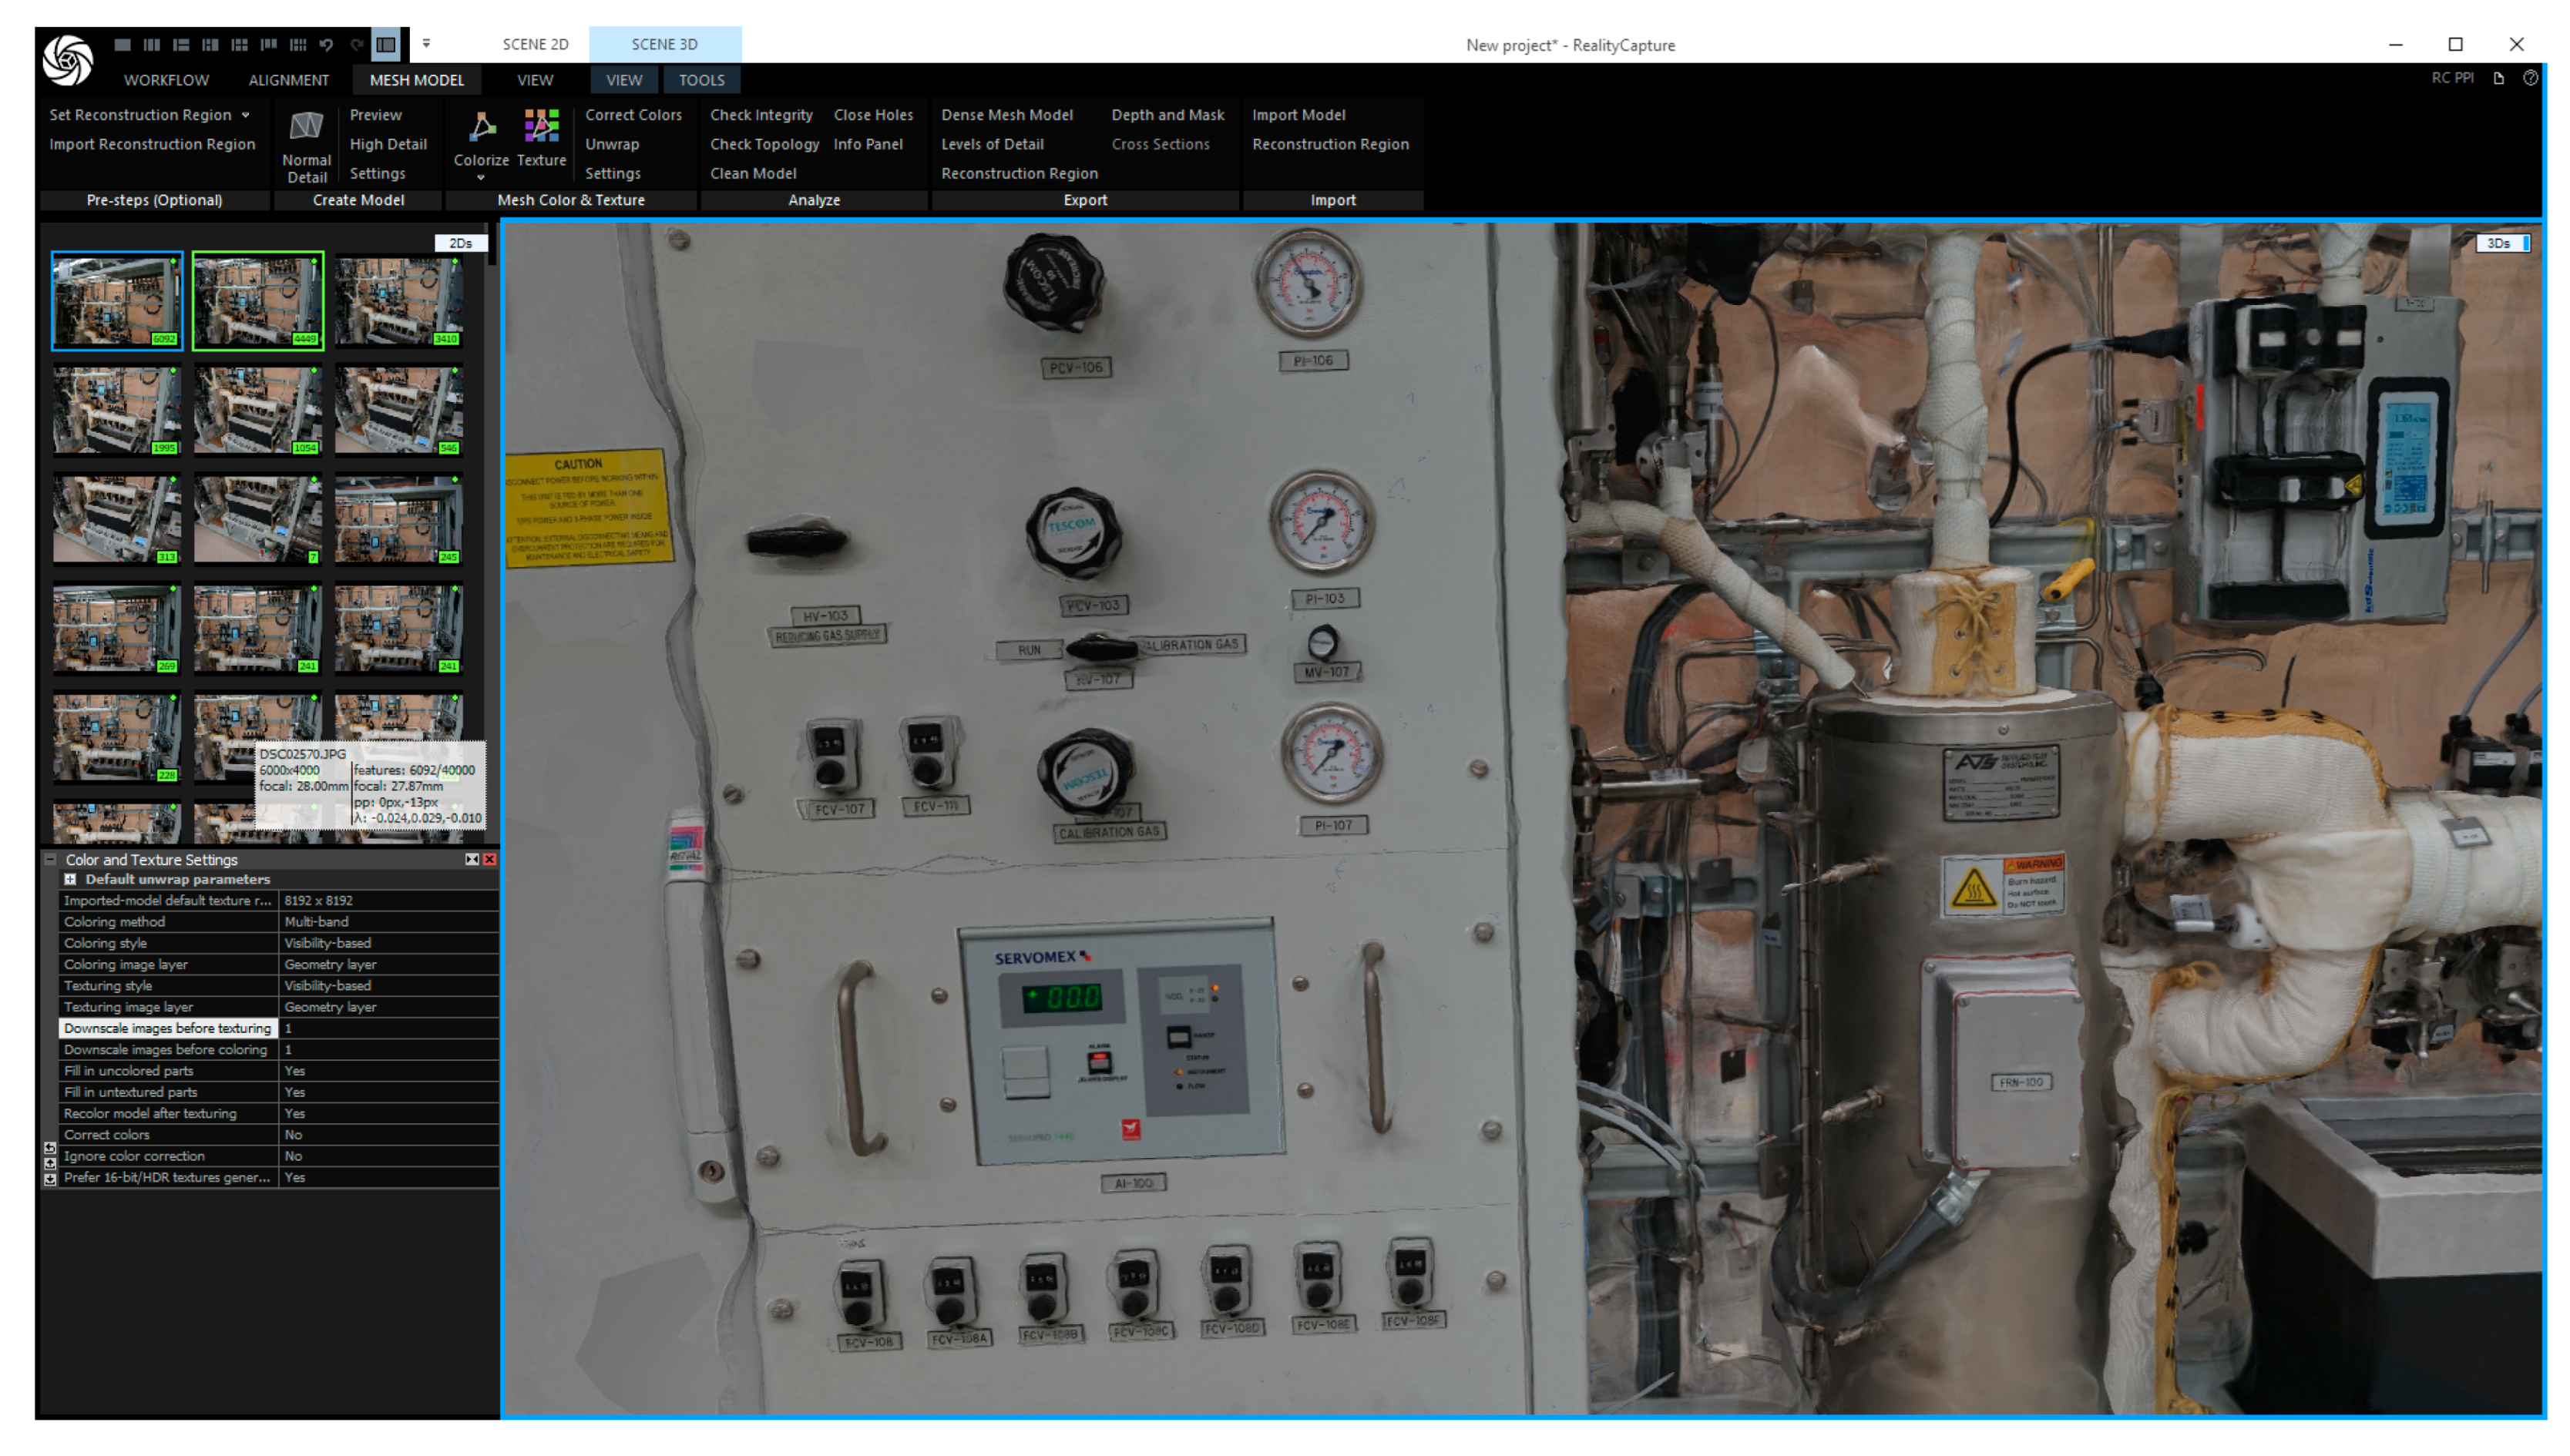
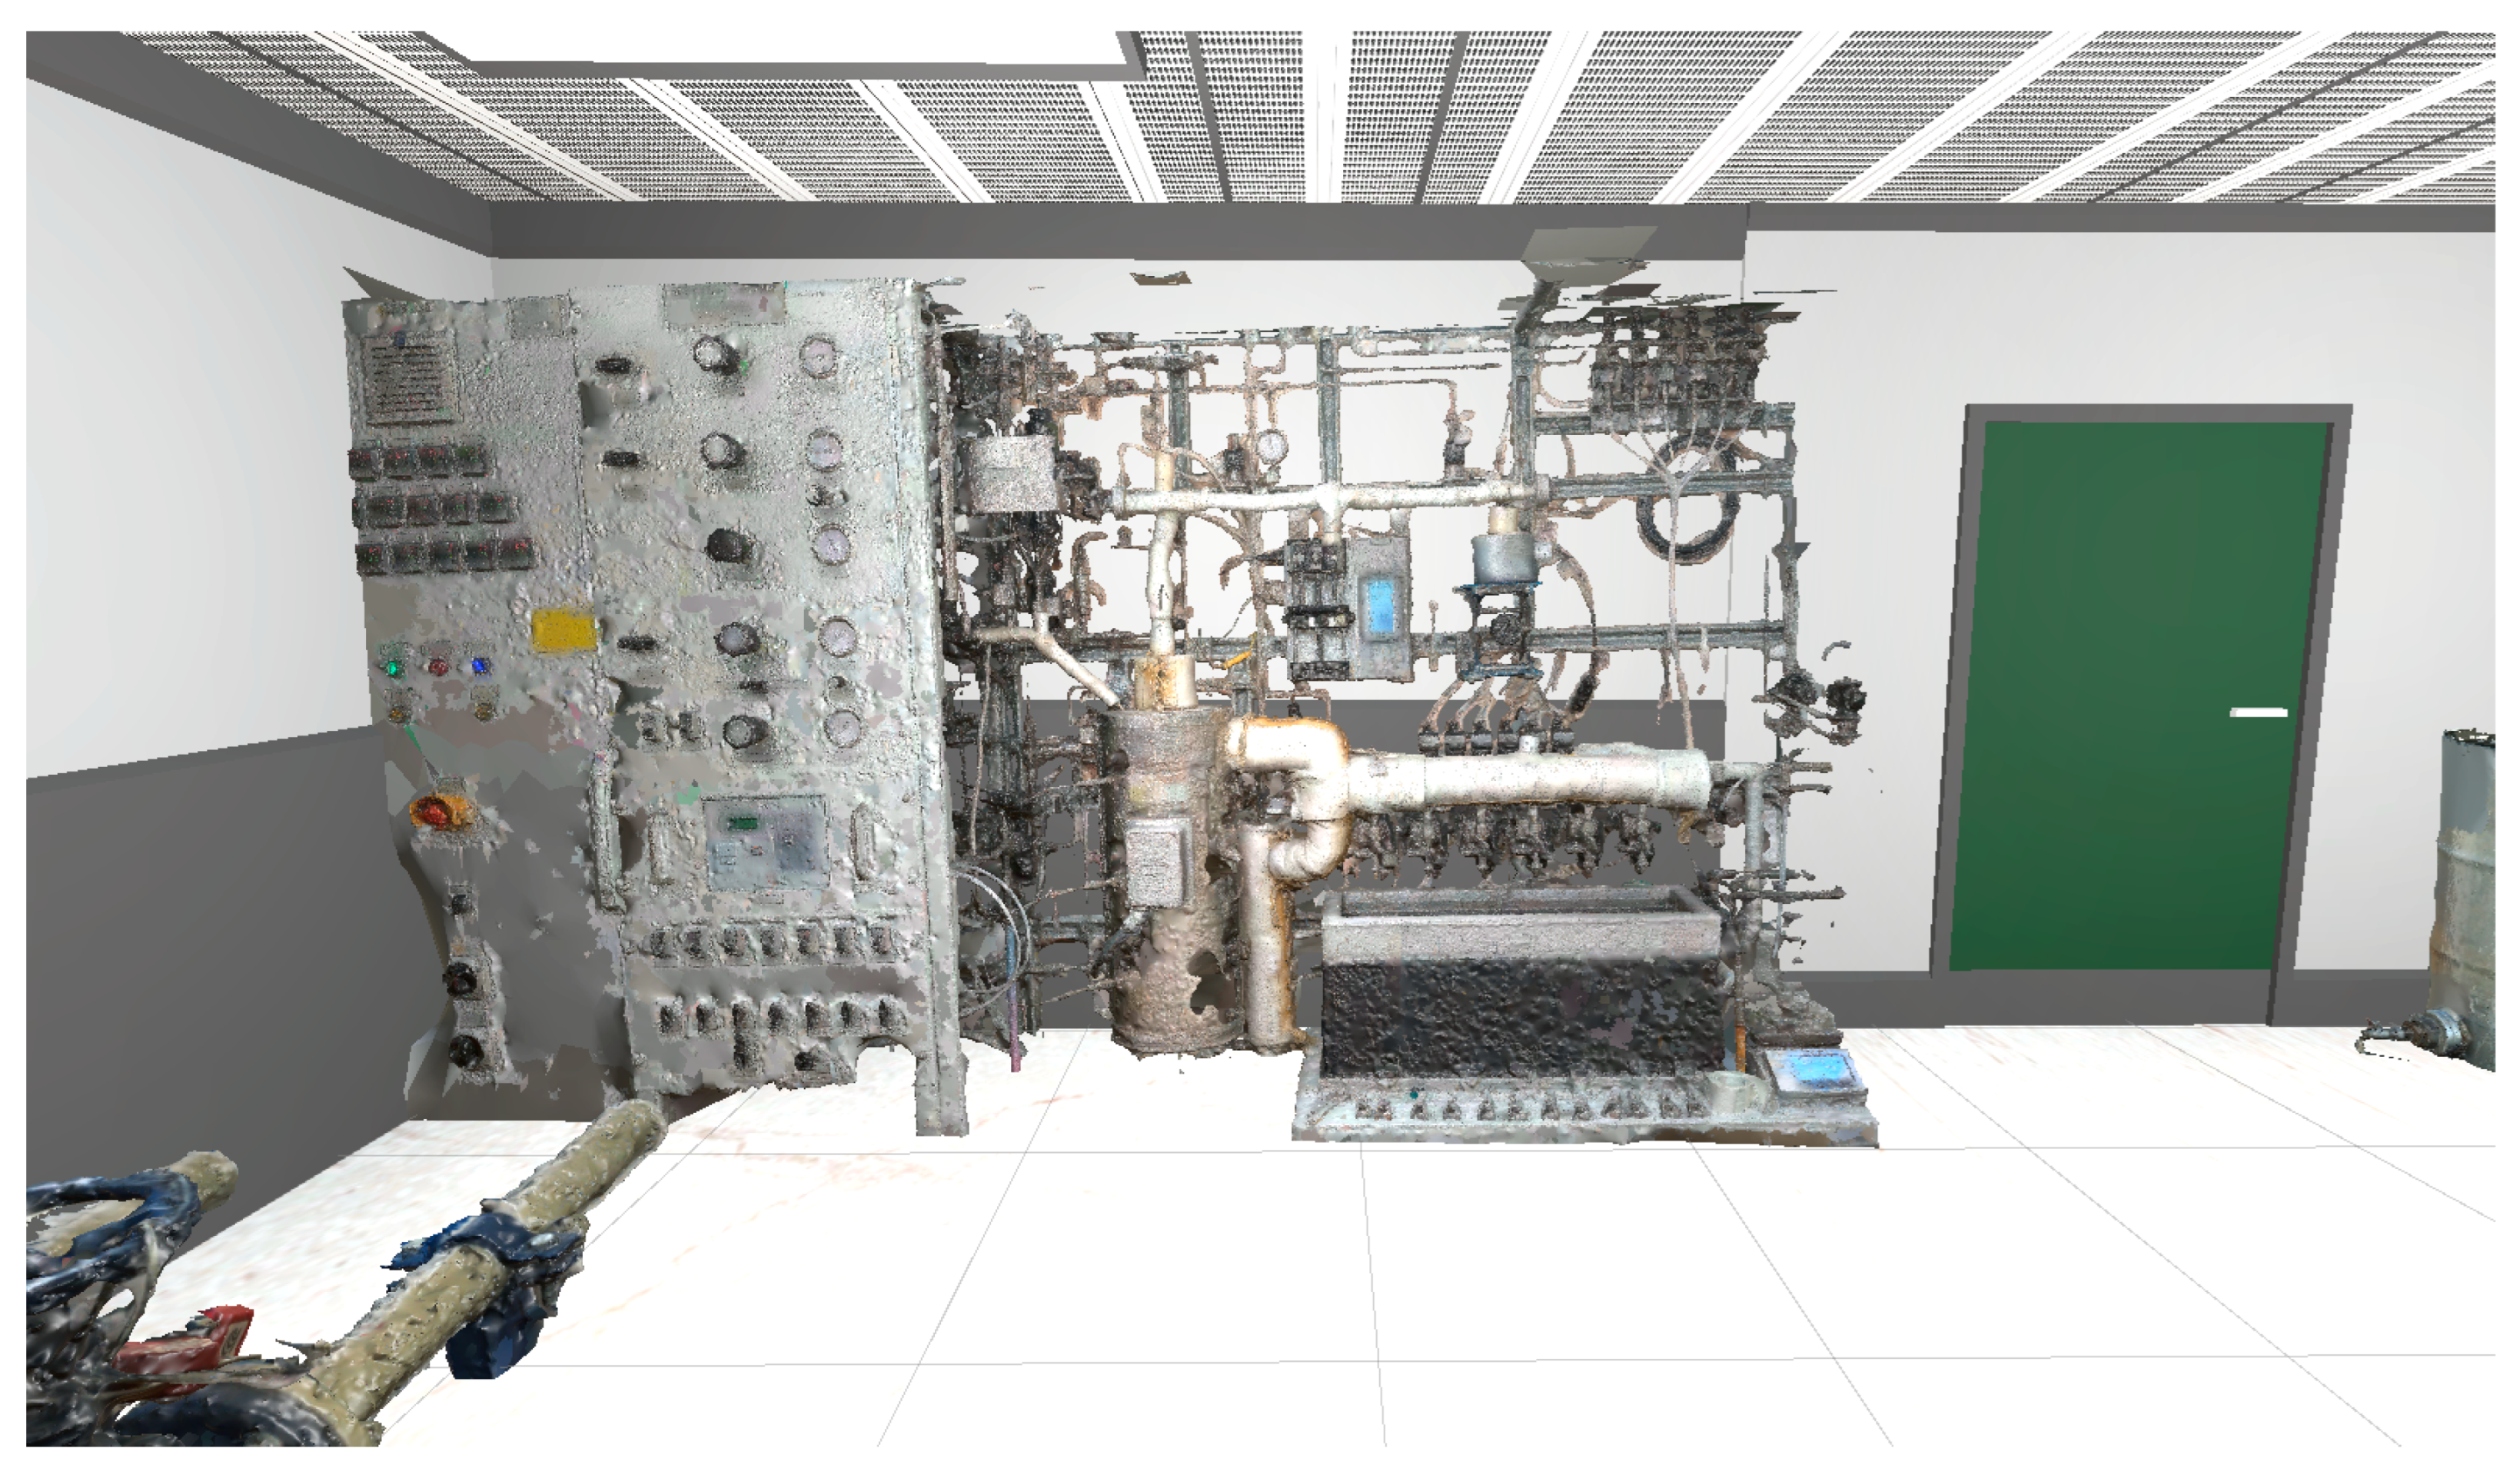
3.1. Photogrammetry for Modeling Scenes of Virtual Reality Applications
- Positional location (terrestrial, aerial, satellite);
- Number of images (single-image, multi-image);
- Processing technology (analog, analytical, digital) [40].
- Natural Feature Extraction: This step aims to extract characteristic groups of pixels that are invariant to changing camera positions while taking the images. This function searches the images for fundamental similarity, and during this step, many input photos are discarded from the further evaluation process. By analyzing the photos discarded, subsequent image-taking practice can be considerably improved.
- Image Matching: This step aims to find images representing views of the same scene. To this end, we use image retrieval techniques to find images that share some features without trying to resolve matches for all features. The ambition is to simplify the image with a compact image descriptor function that enables an efficient calculation of distances between all image descriptors.
- Features Matching: This step aims to compare all similarities between pairs of candidate images. First, we perform photometric matches between a set of descriptors from a couple of input images. For each element in image A, we obtain a list of candidate elements in image B.
- Structure From Motion: This step aims to understand the geometric relationship behind all the observations provided by the input images and derive a rigid structure of the scene (3D points) with the position, orientation, and internal calibration of all cameras.
- Depth Maps Estimation: We select the N best/closest cameras in the vicinity for each image. We select front parallel planes based on the intersection of the optical axis with the pixels of the selected neighboring cameras.
- Meshing: This step aims to create a dense geometric surface representation of the scene. First, we merge all depth maps into a global one in which compatible depth values are merged into cells.
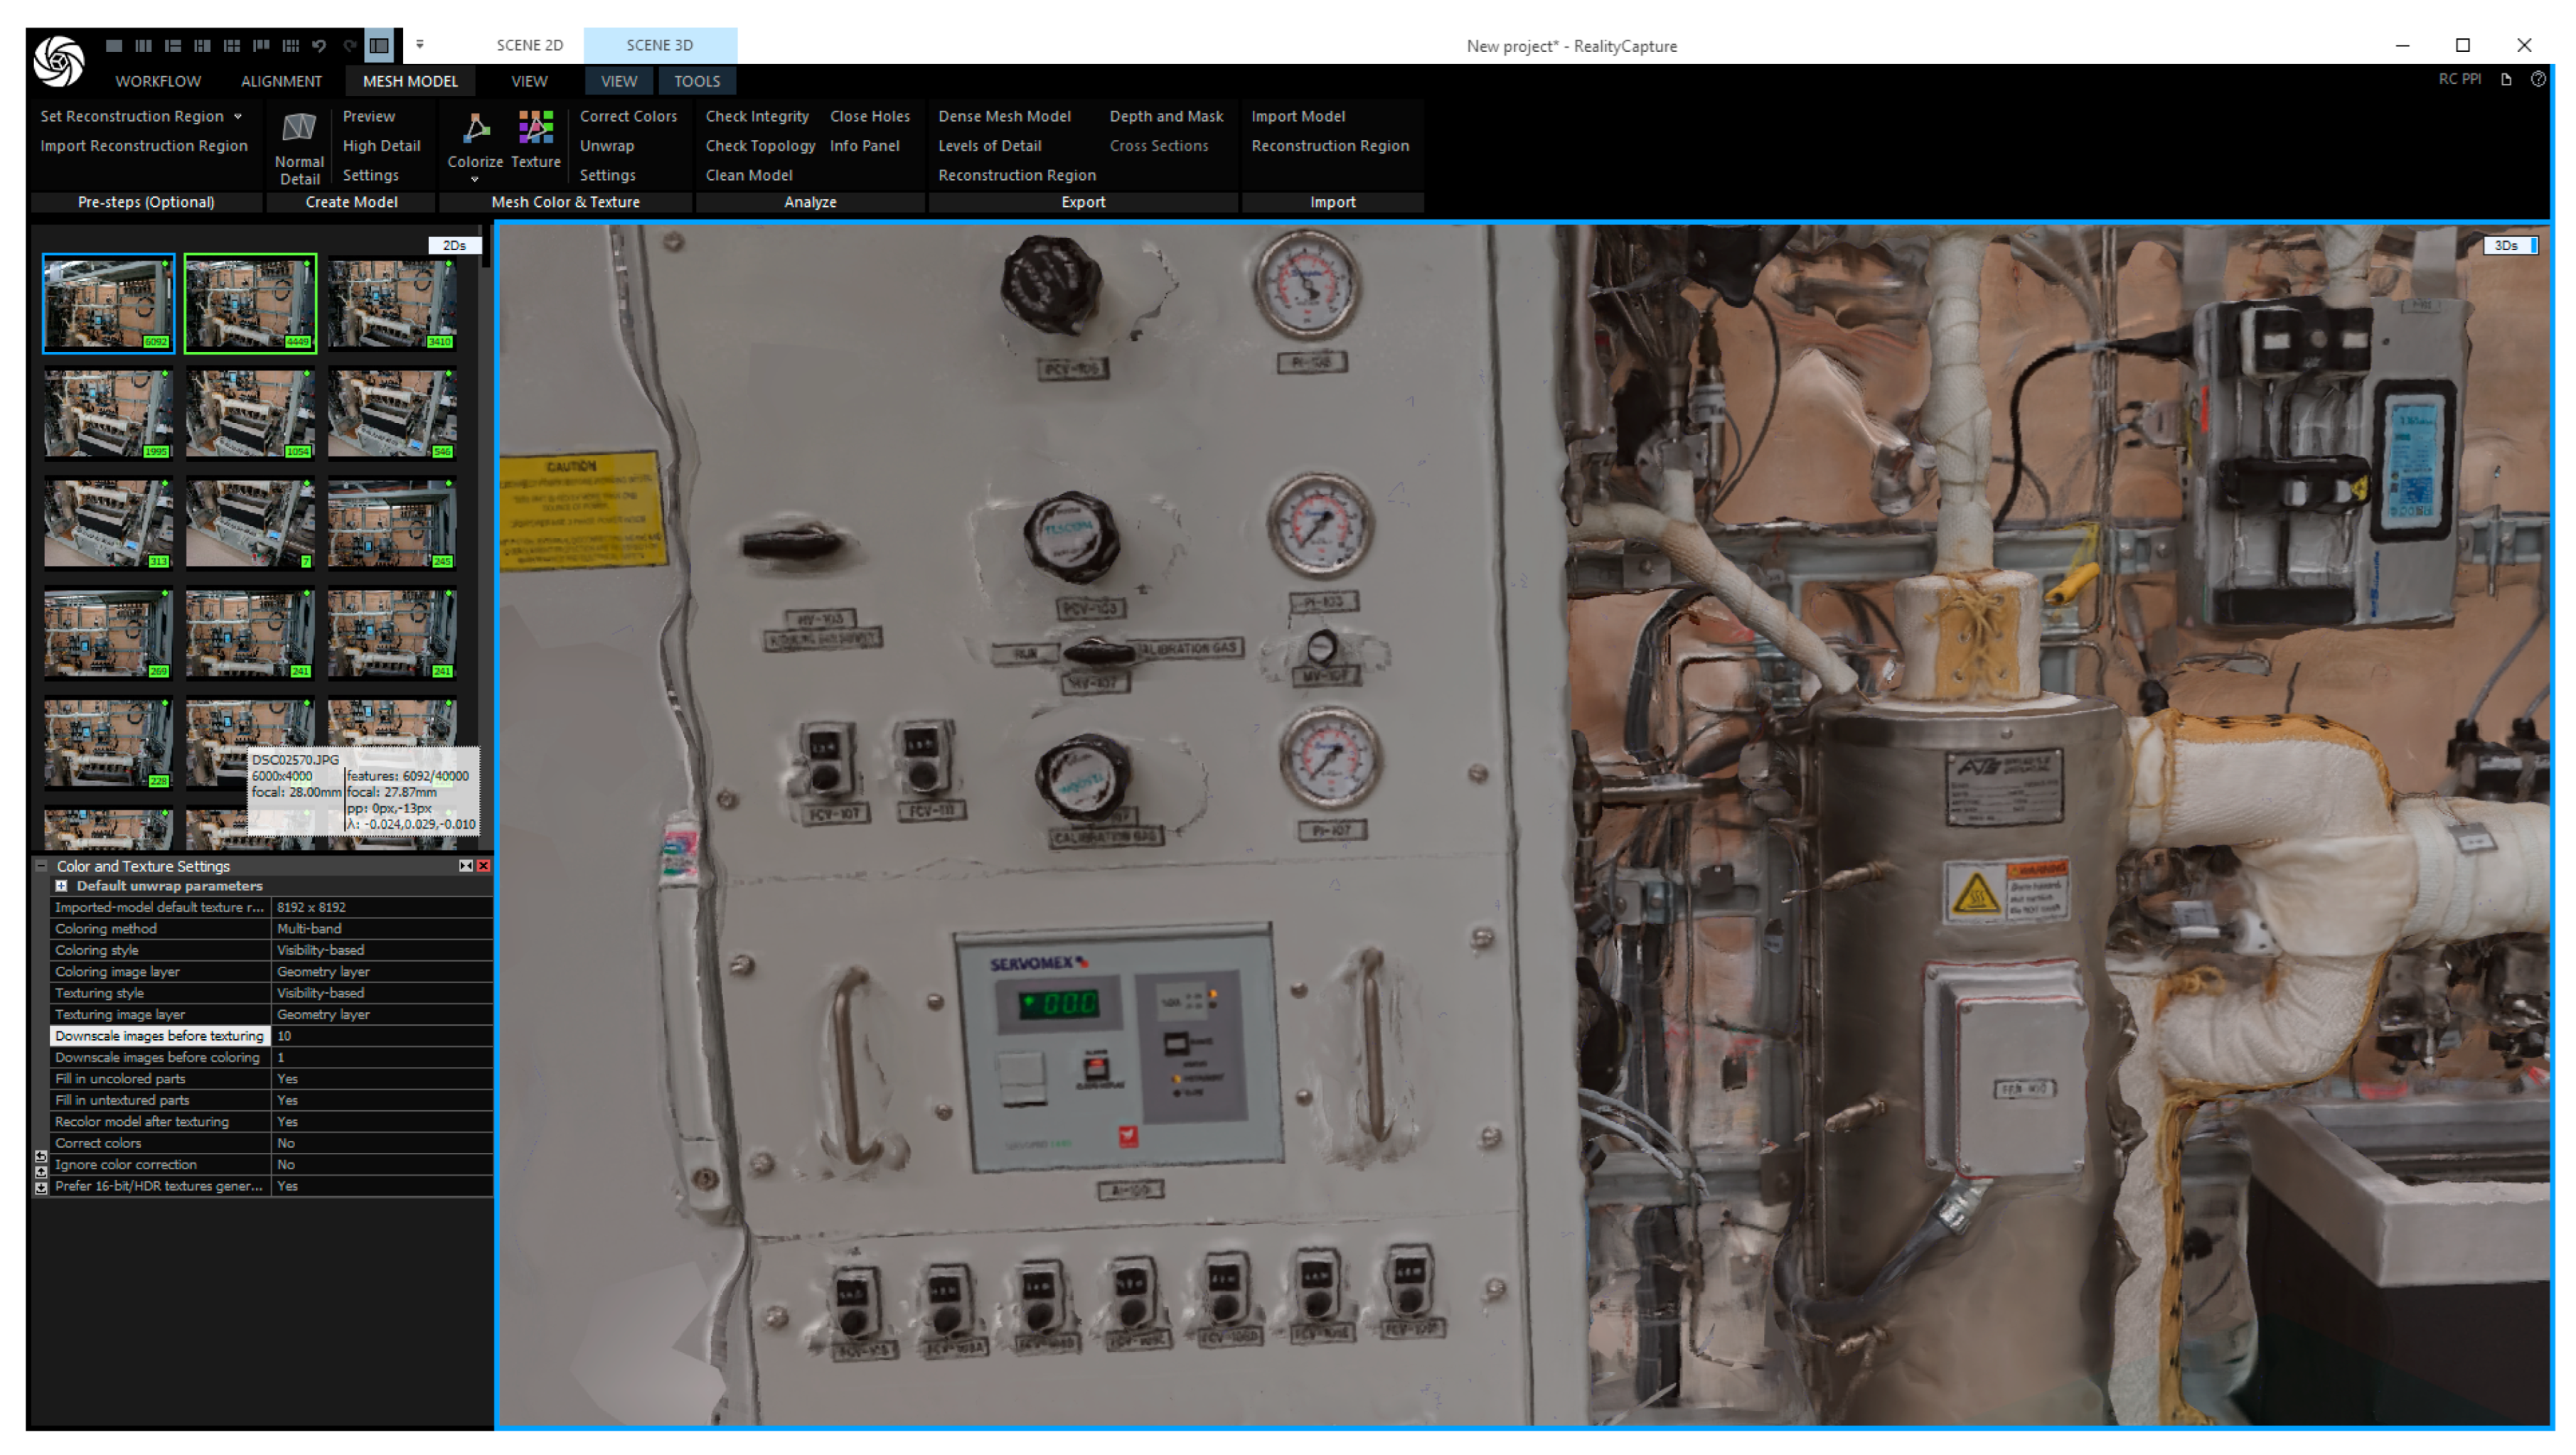
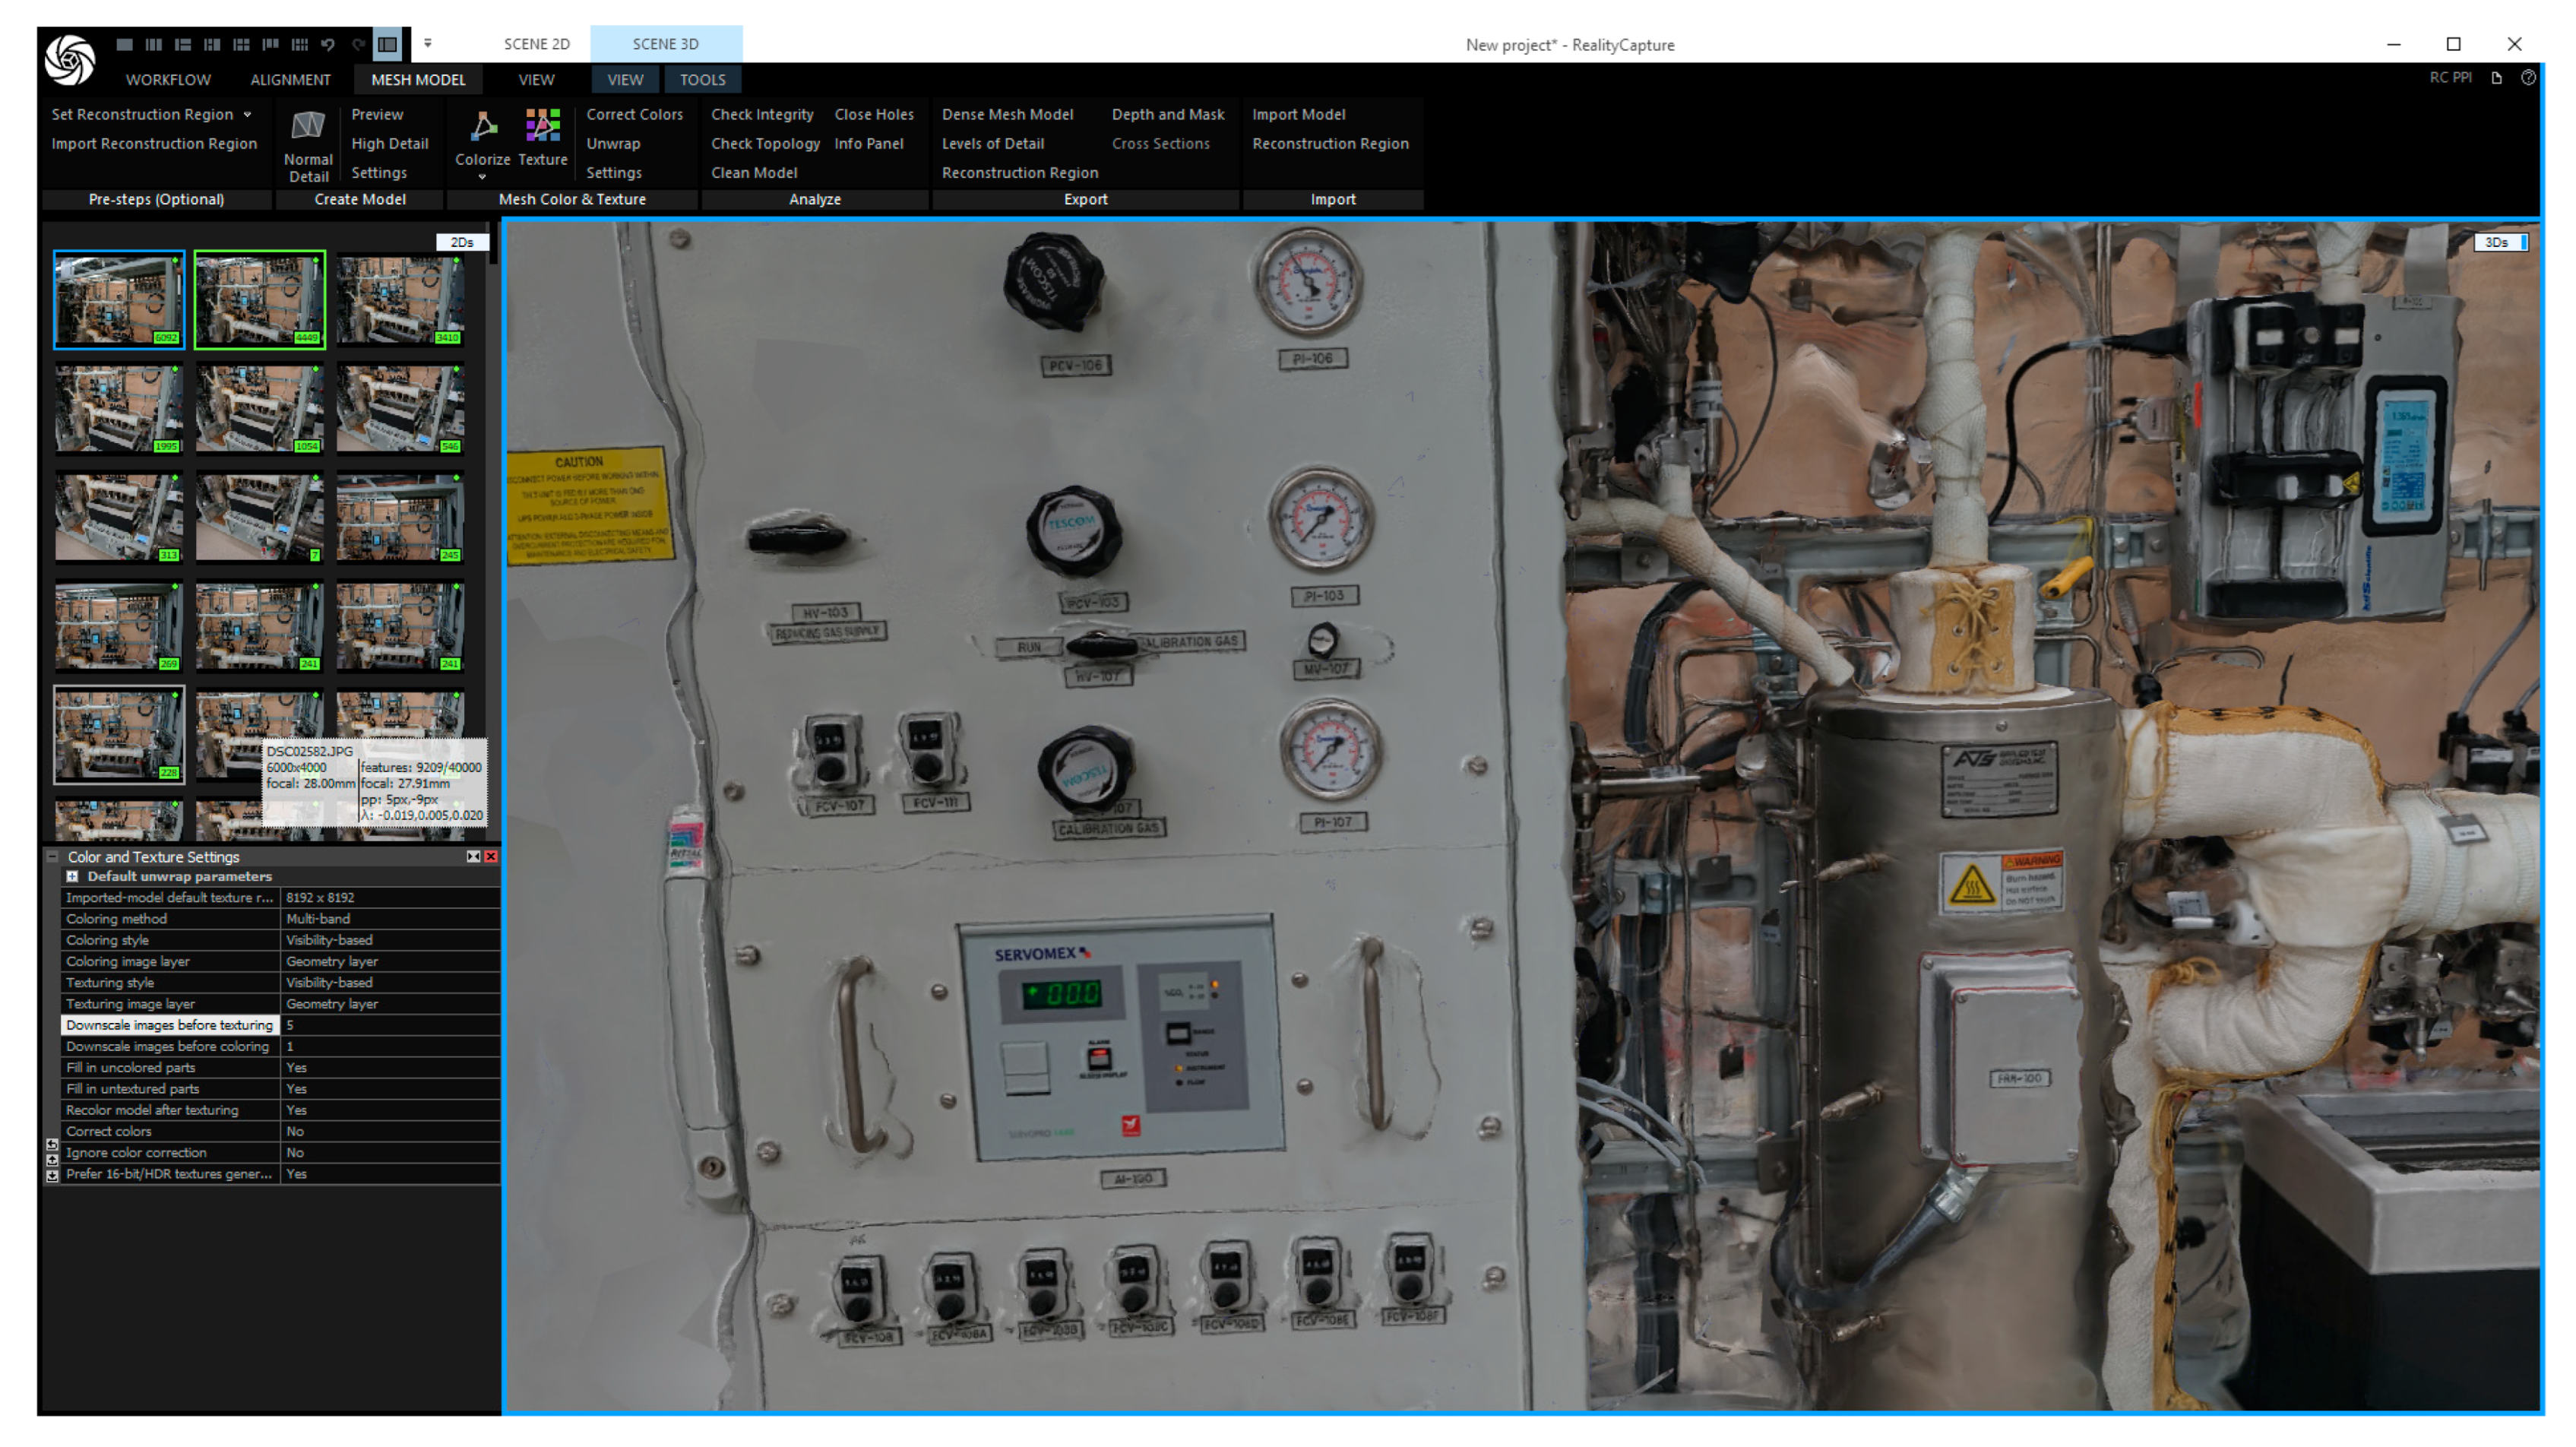
- Texturing: This step aims to texture the generated mesh to obtain a realistic model.
3.2. Improving Safety Skills and Employee Training
- (1)
- On-the-job training: Hands-on training and observation by experienced staff members can provide employees with the skills they need to perform their duties safely.
- (2)
- Workshops and seminars: Workshops and seminars can be held to educate employees on the importance of safety and the best practices for working safely.
- (3)
- E-Learning courses: Online courses or modules can provide employees with the knowledge they need to work safely at their own pace and in their own time.
- (4)
- Safety manuals: Detailed safety manuals can be provided to employees as a reference for safe work practices.
- (5
- Safety incentives: Implementing safety incentives, such as rewards for safe work practices, can encourage employees to prioritize safety in the workplace.
- (6)
- Safety drills: Regular safety drills can help employees become familiar with emergency procedures and improve their response time in the event of an emergency.
- (7)
- Regular safety meetings: Regular safety drills can help employees become familiar with emergency procedures and improve their response time in an emergency.
- (8)
- Virtual Reality approach: VR simulations can recreate real-life scenarios, allowing employees to practice their skills in a safe and controlled environment. This technology can reduce the cost of training by eliminating the need for physical travel and other expenses associated with traditional training methods. VR training can be customized to meet the specific needs and goals of the organization, and it can provide measurable results, such as improved accuracy and performance, allowing organizations to track the effectiveness of the training and make any necessary improvements. At least, VR can simulate dangerous situations, allowing employees to practice emergency procedures and improve their response time during an emergency.
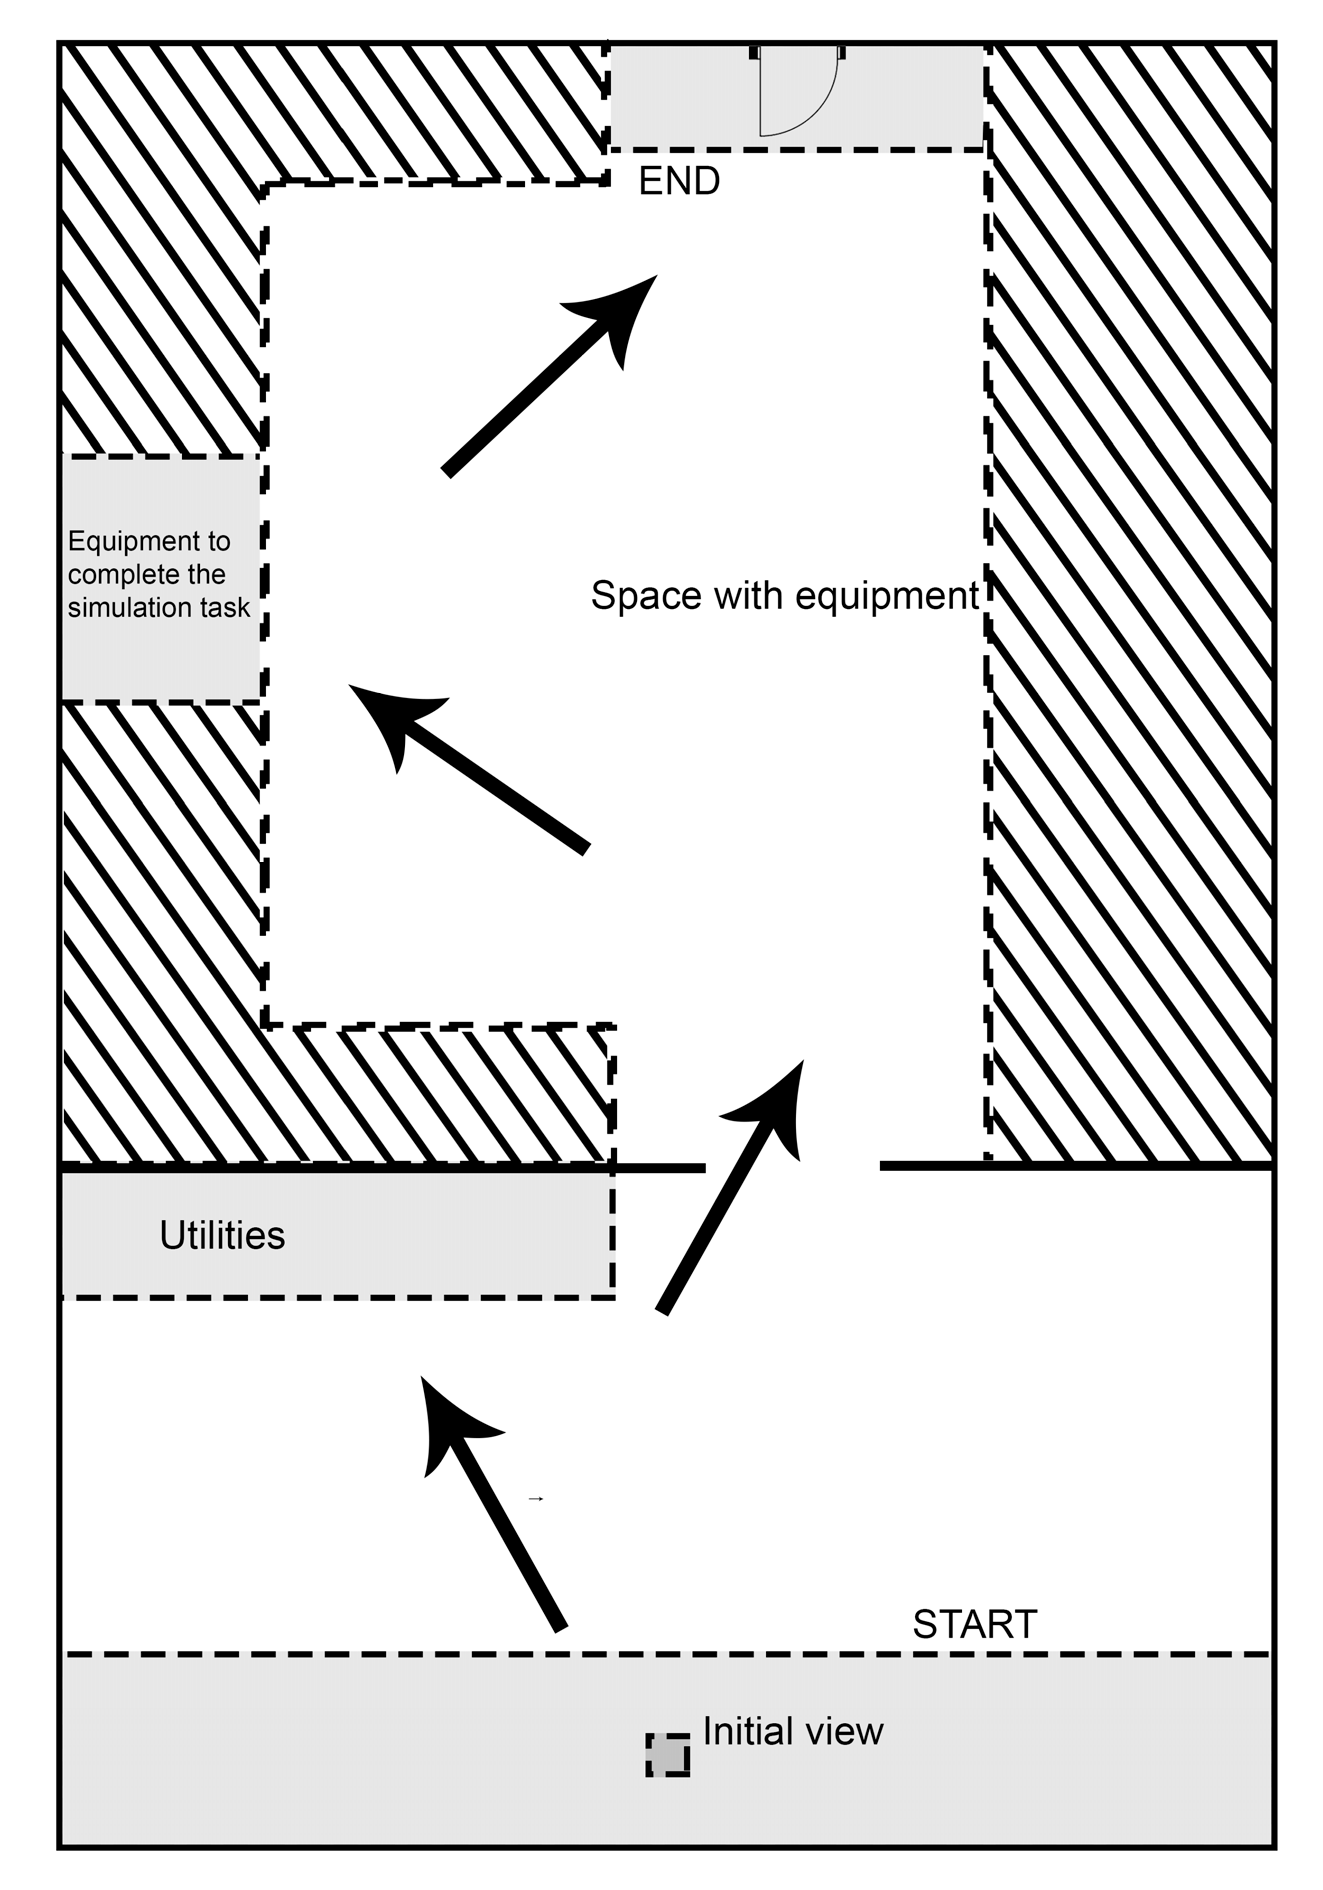
3.3. Research Methods
4. Results and Discussion
Discussion
5. Conclusions
Author Contributions
Funding
Institutional Review Board Statement
Informed Consent Statement
Data Availability Statement
Acknowledgments
Conflicts of Interest
References
- Rueda Márquez de la Plata, A.; Cruz Franco, P.A.; Ramos Sánchez, J.A. Applications of Virtual and Augmented Reality Technology to Teaching and Research in Construction and Its Graphic Expression. Sustainability 2023, 15, 9628. [Google Scholar] [CrossRef]
- Drucker, P.F. Management Challenges for the 21st Century; HarperBusiness: New York, NY, USA, 2001. [Google Scholar]
- Desa, A.F.N.; Habidin, N.F.; Hibadullah, S.; Fuzi, N.; Zamri, F. Occupational Safety and Health Admúinistration (OSHA) Practices and OSHA Performance in Malaysian Automotive Industry. J. Stud. Soc. Sci. 2013, 4, 1–15. [Google Scholar]
- Seo, H.J.; Park, G.M.; Son, M.; Hong, A.-J. Establishment of Virtual-Reality-Based Safety Education and Training System for Safety Engagement. Educ. Sci. 2021, 11, 786. [Google Scholar] [CrossRef]
- Paszkiewicz, A.; Salach, M.; Dymora, P.; Bolanowski, M.; Budzik, G.; Kubiak, P. Methodology of Implementing Virtual Reality in Education for Industry 4.0. Sustainability 2021, 13, 5049. [Google Scholar] [CrossRef]
- Mujtaba, B.G.; Kaifi, B. Safety Audit Considerations for a Healthy Workplace that Puts «People Before Profit» and OSHA Compliance. Health Econ. Manag. Rev. 2023, 4, 11–25. [Google Scholar] [CrossRef]
- Piwowar-Sulej, K. Human resources development as an element of sustainable HRM—With the focus on production engineers. J. Clean. Prod. 2021, 278, 124008. [Google Scholar] [CrossRef]
- Snell, S.; Shad, M.; Bohlander, G.W. Managing Human Resoursces, 18th ed.; Cengage Learning, Inc.: Boston, MA, USA, 2020. [Google Scholar]
- Davidescu, A.A.; Apostu, S.-A.; Paul, A.; Casuneanu, I. Work Flexibility, Job Satisfaction, and Job Performance among Romanian Employees—Implications for Sustainable Human Resource Management. Sustainability 2020, 12, 6086. [Google Scholar] [CrossRef]
- Jensen, L.; Konradsen, F. A review of the use of Virtual Reality head-mounted displays in education and training. Educ. Inf. Technol. 2018, 23, 1515–1529. [Google Scholar] [CrossRef]
- Sherman, W.R.; Craig, A.B. Understanding Virtual Reality: Interface, Application, and Design, 2nd ed.; Morgan Kaufmann: Burlington, MA, USA, 2018. [Google Scholar]
- Radianti, J.; Majchrzak, T.A.; Fromm, J.; Wohlgenannt, I. A systematic review of immersive Virtual Reality applications for higher education: Design elements, lessons learned, and research agenda. Comput. Educ. 2020, 147, 103778. [Google Scholar] [CrossRef]
- Berg, L.P.; Vance, J.M. Industry use of Virtual Reality in product design and manufacturing: A survey. Virtual Real. 2017, 21, 1–17. [Google Scholar] [CrossRef]
- Parong, J.; Mayer, R.E. Learning science in immersive Virtual Reality. J. Educ. Psychol. 2018, 110, 785–797. [Google Scholar] [CrossRef]
- Wei, Z.; Yuan, M. Research on the Current Situation and Future Development Trend of Immersive Virtual Reality in the Field of Education. Sustainability 2023, 15, 7531. [Google Scholar] [CrossRef]
- Qureshi, A.H.; Alaloul, W.S.; Hussain, S.J.; Murtiyoso, A.; Saad, S.; Alzubi, K.M.; Ammad, S.; Baarimah, A.O. Evaluation of Photogrammetry Tools following Progress Detection of Rebar towards Sustainable Construction Processes. Sustainability 2023, 15, 21. [Google Scholar] [CrossRef]
- Li, Y.; Ying, S.; Chen, Q.; Guan, J. An Experiential Learning-Based Virtual Reality Approach to Foster Students’ Vocabulary Acquisition and Learning Engagement in English for Geography. Sustainability 2022, 14, 15359. [Google Scholar] [CrossRef]
- Neumann, W.P.; Winkelhaus, S.; Grosse, E.H.; Glock, C.H. Industry 4.0 and the human factor—A systems framework and analysis methodology for successful development. Int. J. Prod. Econ. 2021, 233, 107992. [Google Scholar] [CrossRef]
- Yildirim, G.; Elban, M.; Yildirim, S. Analysis of Use of Virtual Reality Technologies in History Education: A Case Study. Asian J. Educ. Train. 2018, 4, 62–69. [Google Scholar] [CrossRef]
- Moreno, E.F.; Pacheco, E.E.; Andaluz, V.H.; Mullo, A.S. Multi-user Virtual Training Assistant for Maintenance on Energized Medium-Voltage Lines. In Proceedings of the 11th International Conference on Education Technology and Computers (ICETC 2019), Amsterdam, The Netherlands, 28–31 October 2019. [Google Scholar]
- Zhang, K.; Suo, J.; Chen, J.; Liu, X.; Gao, L. Design and implementation of firesafety education system on campus based on Virtual Reality technology. In Proceedings of the 2017 Federated Conference on Computer Science and Information Systems (FedCSIS), Prague, Czech Republic, 3–6 September 2017. [Google Scholar]
- Bell, J.T.; Fogler, H.C. The application of Virtual Reality to (chemical engineering) education. In Proceedings of the IEEE Virtual Reality 2004, Chicago, IL, USA, 27–31 March 2004. [Google Scholar]
- Li, J.-Z.; Zhang, S.-H. Application of Virtual Reality Technologies to the Simulation of Coal Miners’ Safety. In Proceedings of the IEEE International Workshop on Open-source Software for Scientific Computation (OSSC), Guiyang, China, 18–20 September 2009. [Google Scholar]
- Bo, T.; Hongqing, Z.; Ning, W.; Yuangang, J.; Guowei, J. Application of Virtual Reality in fire teaching of mining. In Proceedings of the 7th International Conference on Computer Science &Education (ICCSE), Melbourne, VIC, Australia, 14–17 July 2012. [Google Scholar]
- Peña, A.M.; Ragan, E.D. Contextualizing construction accident reports in virtual environments for safety education. In Proceedings of the IEEE Virtual Reality (VR), Los Angeles, CA, USA, 18–22 March 2017. [Google Scholar]
- Vergara, D.; Extremera, J.; Rubio, M.P.; Dávila, L.P. Meaningful Learning Through Virtual Reality Learning Environments: A Case Study in Materials Engineering. Appl. Sci. 2019, 9, 4625. [Google Scholar] [CrossRef]
- Pham, H.C.; Dao, N.-N.; Kim, J.-U.; Cho, S.; Park, C.-S. Energy-Efficient Learning System Using Web-Based Panoramic Virtual Photoreality for Interactive Construction Safety Education. Sustainability 2018, 10, 2262. [Google Scholar] [CrossRef]
- Gabajová, G.; Furmannová, B.; Medvecká, I.; Grznár, P.; Krajčovič, M.; Furmann, R. Virtual Training Application by Use of Augmented and Virtual Reality under University Technology Enhanced Learning in Slovakia. Sustainability 2019, 11, 6677. [Google Scholar] [CrossRef]
- Tadeja, S.K.; Lu, Y.; Rydlewicz, M.; Rydlewicz, W.; Bubas, T.; Kristensson, P.O. Exploring gestural input for engineering surveys of real-life structures in Virtual Reality using photogrammetric 3D models. Multimed. Tools Appl. 2021, 80, 31039–31058. [Google Scholar] [CrossRef]
- Queisner, M.; Pogorzhelskiy, M.; Remde, C.; Pratschke, J.; Sauer, I.M. VolumetricOR: A New Approach to Simulate Surgical Interventions in Virtual Reality for Training and Education. Surg. Innov. 2022, 29, 406–415. [Google Scholar] [CrossRef] [PubMed]
- Triantafyllou, V.; Kotsopoulos, K.I.; Tsolis, D.; Tsoukalos, D. Practical Techniques for Aerial Photogrammetry, Polygon Reduction and Aerial 360 Photography for Cultural Heritage Preservation in AR and VR Applications. In Proceedings of the 13th International Conference on Information, Intelligence, Systems and Applications, IISA 2022, Corfu, Greece, 18–20 July 2022. [Google Scholar]
- Aggarwal, D.; Banerjee, K.; Bali, V.; Gupta, M.; Kumar, P.; Kumari, P. A Study for the Development of a Photogrammetry Based AR and GR Projection System and Examining its Further Application. In Proceedings of the 1st International Conference on Informatics, Noida, India, 14–16 April 2022. [Google Scholar]
- Herrera, R.M.; Jiménez, V.M.; Corchado, M.A.R.; Corchado, F.F.R.; Romero, J.R.M. Virtualizing 3D Real Environments Using 2D Pictures Based on Photogrammetry. In Lecture Notes in Computer Science (Including Subseries Lecture Notes in Artificial Intelligence and Lecture Notes in Bioinformatics); Springer: Cham, Switzerland, 2022; Volume 13264, pp. 169–180. [Google Scholar]
- Tolle, H.; Dewi, R.K.; Brata, K.C.; Perdamean, B. Framework for Development of 3D Temple Objects based on Photogrammetry Method. Int. J. Adv. Comput. Sci. Appl. 2022, 13, 564–571. [Google Scholar] [CrossRef]
- Fernandez, A.A.; Mora, S.R.; Damerell, R.A. Work-in-Progress-Photogrammetry within Virtual Reality. In Proceedings of the 7th International Conference of the Immersive Learning Research Network, Virtual, Online, 17 May–10 June 2021. [Google Scholar]
- Krajčovič, M.; Gabajová, G.; Matys, M.; Grznár, P.; Dulina, Ľ.; Kohár, R. 3D Interactive Learning Environment as a Tool for Knowledge Transfer and Retention. Sustainability 2021, 13, 7916. [Google Scholar] [CrossRef]
- Hernández-Chávez, M.; Cortés-Caballero, J.M.; Pérez-Martínez, Á.A.; Hernández-Quintanar, L.F.; Roa-Tort, K.; Rivera-Fernández, J.D.; Fabila-Bustos, D.A. Development of Virtual Reality Automotive Lab for Training in Engineering Students. Sustainability 2021, 13, 9776. [Google Scholar] [CrossRef]
- Krajčovič, M.; Gabajová, G.; Matys, M.; Furmannová, B.; Dulina, Ľ. Virtual Reality as an Immersive Teaching Aid to Enhance the Connection between Education and Practice. Sustainability 2022, 14, 9580. [Google Scholar] [CrossRef]
- Unity Real-Time Development Platform. 3D, 2D VR & AR Engine. Available online: https://unity.com/ (accessed on 11 July 2022).
- Žďárská, M. Vývoj Fotogrammetrického Mapování na Našem Území. Bachelor’s Thesis, University of South Bohemia in České Budějovice, České Budějovice, Czech Republic, 2013. [Google Scholar]
- AliceVision. Photogrammetry Pipeline. Available online: https://alicevision.org/#photogrammetry (accessed on 11 July 2022).
- Holuša, V.; Beneš, F.; Vaněk, M. Utilization of Augmented and Virtual Reality in Geoscience. GeoSci. Eng. 2022, 68, 22–32. [Google Scholar] [CrossRef]
- Luhmann, T.; Chizhova, M.; Gorkovchuk, D.; Hastedt, H.; Chachava, N.; Lekveishvili, N. Combination of terrestrial laserscanning, uav and close-range photogrammetry for 3D reconstruction of complex churches in Georgia. ISPRS Ann. Photogramm. Remote Sens. Spat. Inf. Sci. 2019, 42, 753–761. [Google Scholar] [CrossRef]
- Gabara, G.; Sawicki, P. A New Approach for Inspection of Selected Geometric Parameters of a Railway Track Using Image-Based Point Clouds. Sensors 2018, 18, 791. [Google Scholar] [CrossRef]
- Luhmann, T.; Chizhova, M.; Gorkovchuk, D. Fusion of UAV and Terrestrial Photogrammetry with Laser Scanning for 3D Reconstruction of Historic Churches in Georgia. Drones 2020, 4, 53. [Google Scholar] [CrossRef]
- Solem, D.-Ø.E.; Nau, E. Two New Ways of Documenting Miniature Incisions Using a Combination of Image-Based Modelling and Reflectance Transformation Imaging. Remote Sens. 2020, 12, 1626. [Google Scholar] [CrossRef]
- Kingsland, K. Comparative analysis of digital photogrammetry software for cultural heritage. Digit. Appl. Archaeol. Cult. Herit. 2020, 18, e00157. [Google Scholar] [CrossRef]
- Hellmuth, R.; Wehner, F.; Giannakidis, A. Datasets of captured images of three different devices for photogrammetry calculation comparison and integration into a laserscan point cloud of a built environment. Data Brief 2020, 33, 106321. [Google Scholar] [CrossRef] [PubMed]
- Przybilla, H.-J.; Bäumker, M.; Luhmann, T.; Hastedt, H.; Eilers, M. Interaction between direct georeferencing, control point configuration and camera self-calibration for RTK-based UAV photogrammetry. Int. Arch. Photogramm. Remote Sens. Spat. Inf. Sci.–ISPRS Arch. 2020, 43, 485–492. [Google Scholar] [CrossRef]
- Ospina-Mateus, H.; Quintana Jiménez, L.A.; Lopez-Valdes, F.J.; Salas-Navarro, K. Bibliometric analysis in motorcycle accident research: A global overview. Scientometrics 2019, 121, 793–815. [Google Scholar] [CrossRef]
- El-Say, K.M.; Hosny, K.M. Optimization of carvedilol solid lipid nanoparticles: An approach to control the release and enhance the oral bioavailability on rabbits. PLoS ONE 2018, 13, e0203405. [Google Scholar] [CrossRef]
- Concepcion-Grande, P.; Chamorro, E.; Cleva, J.M.; Alonso, J.; Gómez-Pedrero, J.A. Correlation between reading time and characteristics of eye fixations and progressive lens design. PLoS ONE 2023, 18, e0281861. [Google Scholar] [CrossRef]
- Salazar, A.; Moreno-Pulido, S.; Prego-Meleiro, P.; Henares-Montiel, J.; Pulido, J.; Donat, M.; Sotres-Fernandez, G.; Sordo, L. Correlation Between Opioid Drug Prescription and Opioid-Related Mortality in Spain as a Surveillance Tool: Ecological Study. JMIR Public Health Surveill. 2023, 9, e43776. [Google Scholar] [CrossRef]
- Abdelhameed, A.H.; Abdelhafez, W.A.; Saleh, K.I.; Hamad, A.A.; Mohamed, M.S. Formulation and optimization of oral fast dissolving films loaded with nanosuspension to enhance the oral bioavailability of Fexofenadine HCL. J. Drug Deliv. Sci. Technol. 2023, 85, 104578. [Google Scholar] [CrossRef]
- Briš, R.; Litschmannová, M. Statistika II; VSB–Technical University of Ostrava: Ostrava, Czech Republic, 2008. [Google Scholar]
- McHugh, M.L. Multiple comparison analysis testing in ANOVA. Biochem. Medica 2011, 21, 203–209. [Google Scholar] [CrossRef]
- Cuevas, A.; Febrero, M.; Fraiman, R. An anova test for functional data. Comput. Stat. Data Anal. 2004, 47, 111–122. [Google Scholar] [CrossRef]
- Ozcelik, B.; Erzurumlu, T. Comparison of the warpage optimization in the plastic injection molding using ANOVA, neural network model and genetic algorithm. J. Mater. Process. Technol. 2006, 171, 437–445. [Google Scholar] [CrossRef]
- Shaw, R.G.; Mitchell-Olds, T. ANOVA for unbalanced data: An overview. Ecology 1993, 74, 1638–1645. [Google Scholar] [CrossRef]
- Gelman, A.; Tjur, T.; McCullagh, P.; Hox, J.; Hoijtink, H.; Zaslavsky, A.M. Discussion paper analysis of variance–Why it is more important than ever. Ann. Stat. 2005, 33, 31–33. [Google Scholar] [CrossRef]
- Kuznetsova, A.; Brockhoff, P.B.; Christensen, R.H.B. lmerTest Package: Tests in Linear Mixed Effects Models. J. Stat. Softw. 2017, 82, 1–26. [Google Scholar] [CrossRef]
- Mair, P.; Wilcox, R. Robust statistical methods in R using the WRS2 package. Behav. Res. Methods 2020, 52, 464–488. [Google Scholar] [CrossRef]
- Kaur, S.; Awasthi, L.K.; Sangal, A.L.; Dhiman, G. Tunicate Swarm Algorithm: A new bio-inspired based metaheuristic paradigm for global optimization. Eng. Appl. Artif. Intell. 2020, 90, 103541. [Google Scholar] [CrossRef]
- Wagenmakers, E.-J.; Love, J.; Marsman, M.; Jamil, T.; Ly, A.; Verhagen, J.; Selker, R.; Gronau, Q.F.; Dropmann, D.; Boutin, B.; et al. Bayesian inference for psychology. Part II: Example applications with JASP. Psychon. Bull. Rev. 2018, 25, 58–76. [Google Scholar] [CrossRef]
- Azlan, A.A.; Hamzah, M.R.; Sern, T.J.; Ayub, S.H.; Mohamad, E. Public knowledge, attitudes and practices towards COVID-19: A cross-sectional study in Malaysia. PLoS ONE 2020, 15, e0233668. [Google Scholar] [CrossRef]


| Parameter | Value |
|---|---|
| Number of images | 256 images |
| Number of images applied | 252 images |
| Individual image size | ~9.5 MB |
| Individual image resolution | 6000 × 4000 px |
| Details | Images Downscale | Time |
|---|---|---|
| Low details | 2 | 7571 s |
| Normal details | 5 | 2288 s |
| High details | 10 | 87 s |
| Details | Images Downscale | Time |
|---|---|---|
| Low details | 1 | 406 s |
| Normal details | 5 | 198 s |
| High details | 10 | 93 s |
| Quantitative Research | Qualitative Research |
|---|---|
| It focuses on collecting and analyzing numerical data, often through large-scale surveys or experiments, to test hypotheses and establish causal relationships. | It explores and understands people’s experiences, attitudes, and behaviors through in-depth interviews, observations, and other non-numerical data sources. |
| It uses statistical methods to analyze the data and draw inferences about the study population. | It uses interpretive and inductive methods to analyze the data and understand the underlying meanings and patterns. |
| The goal is to generalize the results to a larger population. | The goal is to gain a deeper understanding of a particular phenomenon. |
| Pros | Cons |
|---|---|
| Cost-effective: Questionnaires are relatively cheap to administer and can be distributed to many participants. | Low response rate: The response rate for questionnaires can be low, especially if the participants are not motivated to complete it. |
| Convenient: Participants can complete the questionnaire at their own pace and in their own time, which can increase the response rate. | Limited data quality: The data collected from questionnaires can be limited by the participant’s ability to accurately understand and answer the questions. |
| Easy to analyze: The data collected from questionnaires can be easily analyzed using statistical software, making it possible to generate accurate results quickly. | Bias: The questionnaire may contain biases, such as leading questions or social desirability bias, that can affect the validity of the results. |
| Anonymous: Participants can provide honest and candid answers without fear of judgment or retaliation, as the questionnaire is usually anonymous. | Lack of depth: The data collected from questionnaires may not provide a deep understanding of the research topic, as participants can only provide brief answers. |
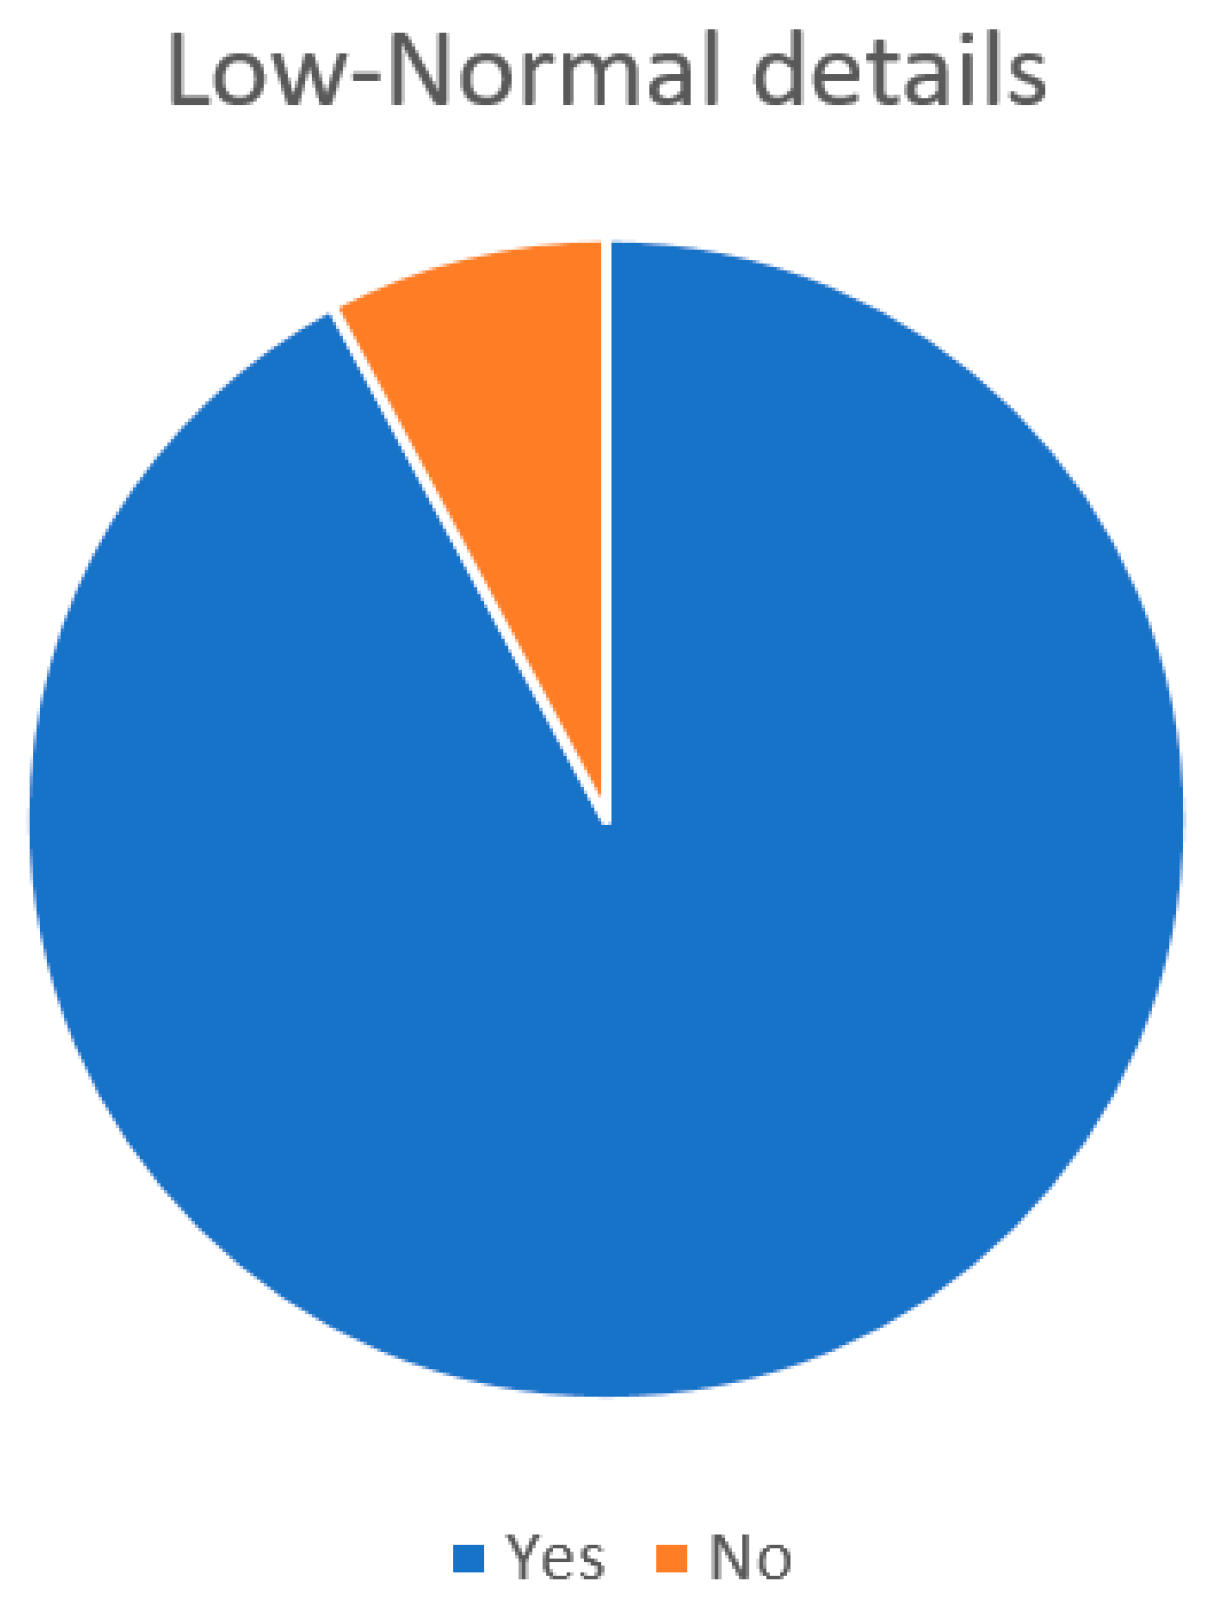
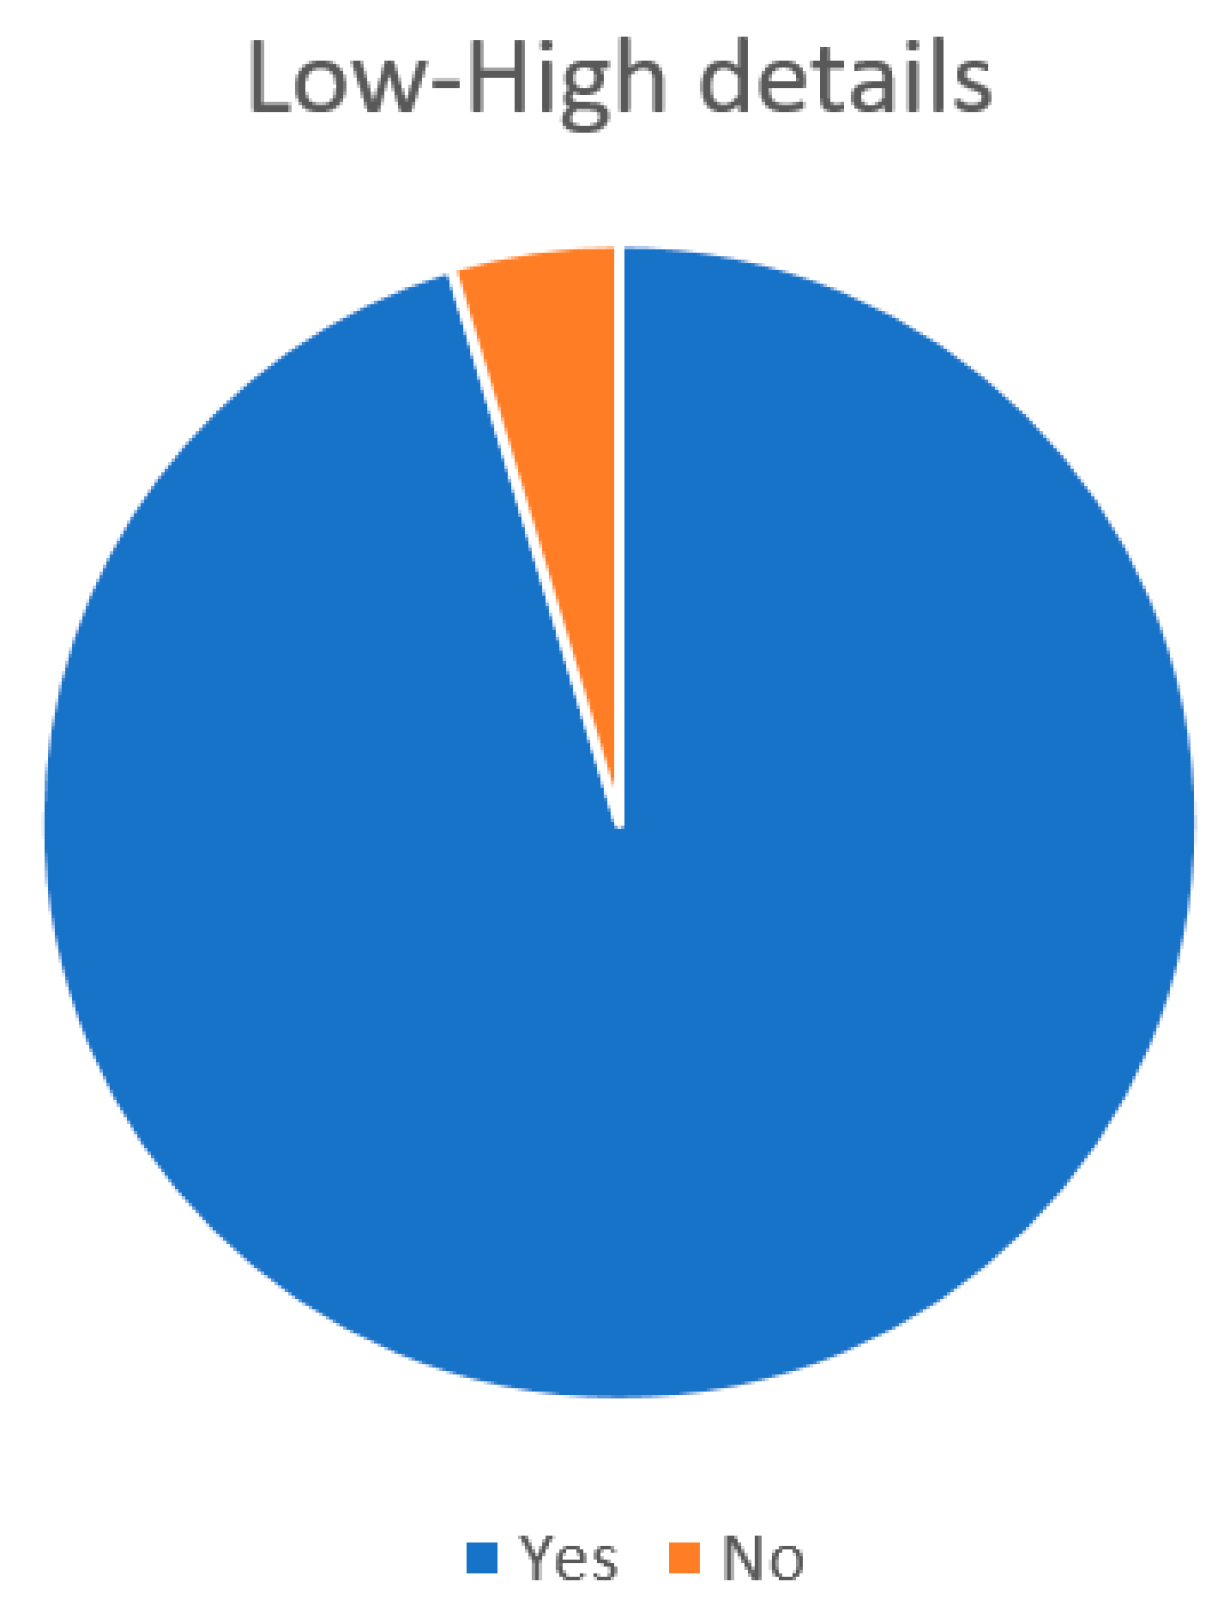
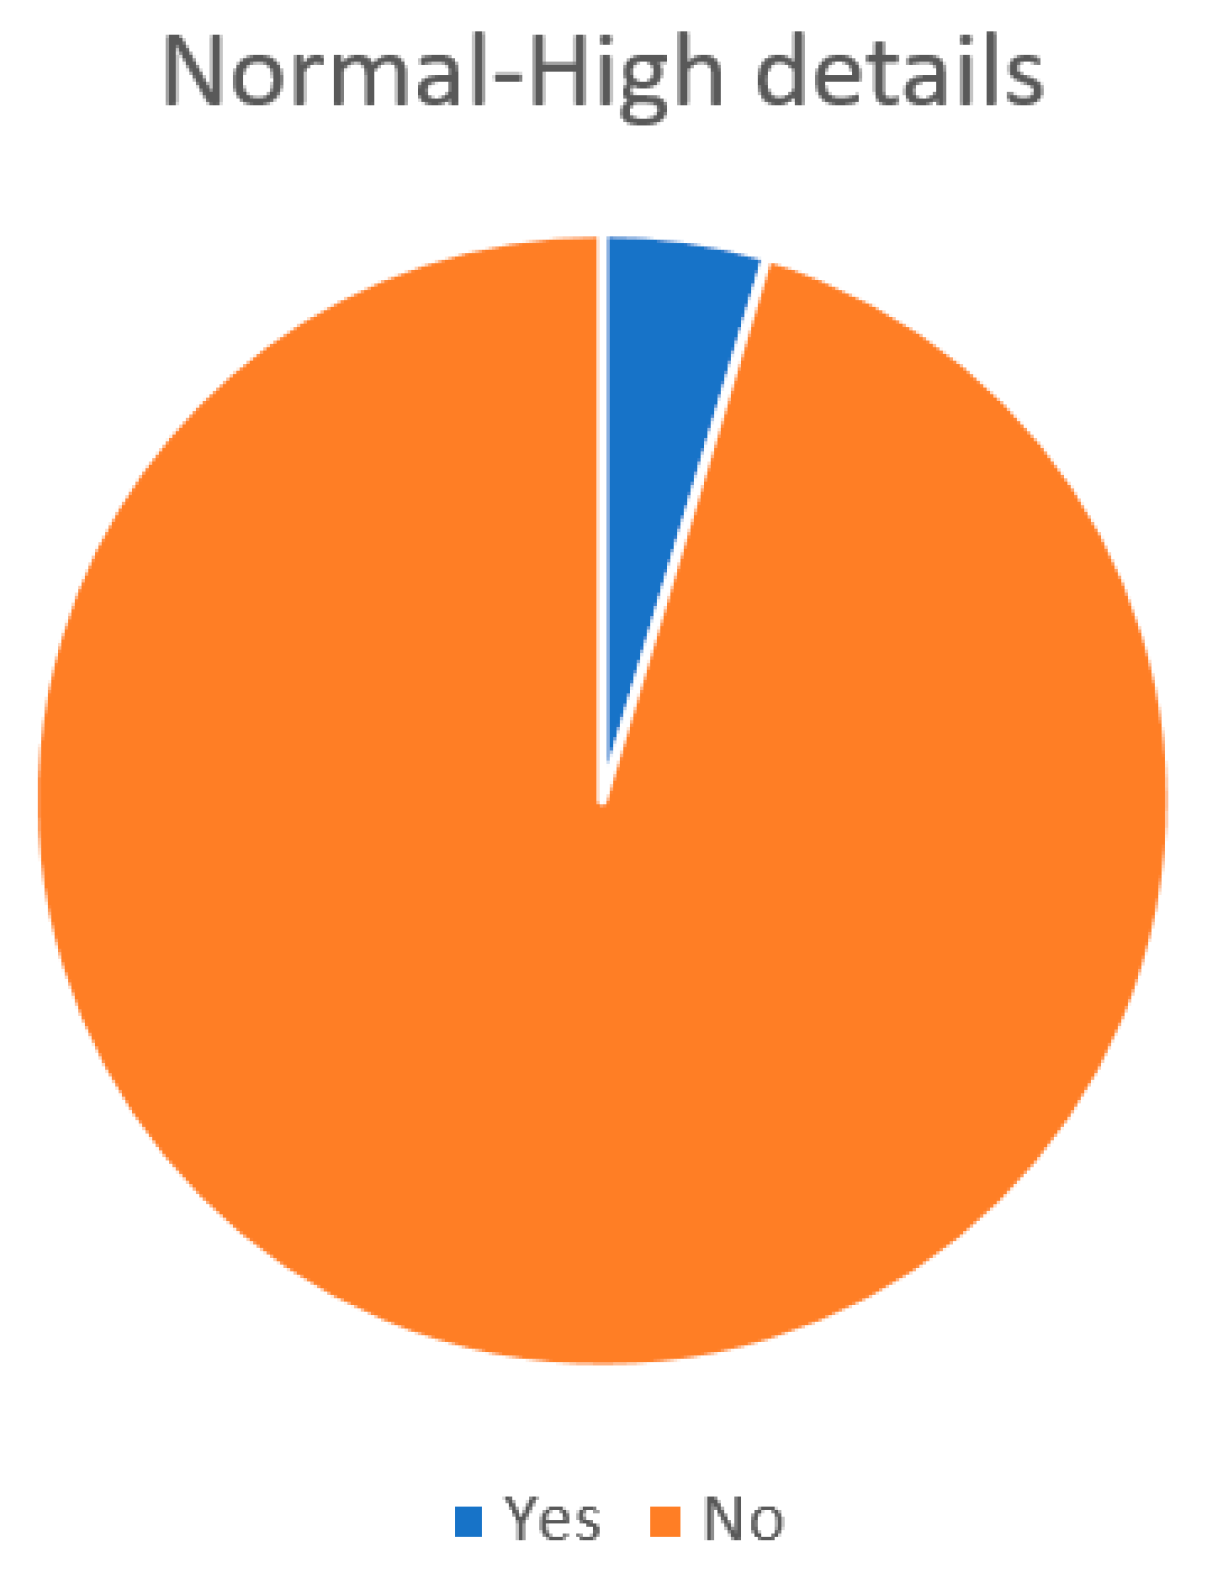
| Details | Difference between Low and Normal Details | Difference between Low and High Details | Difference between Normal and High Details |
|---|---|---|---|
| Yes | 59 | 61 | 3 |
| No | 5 | 3 | 61 |
| Positive response percentage | 92.19 | 95.31 | 4.69 |
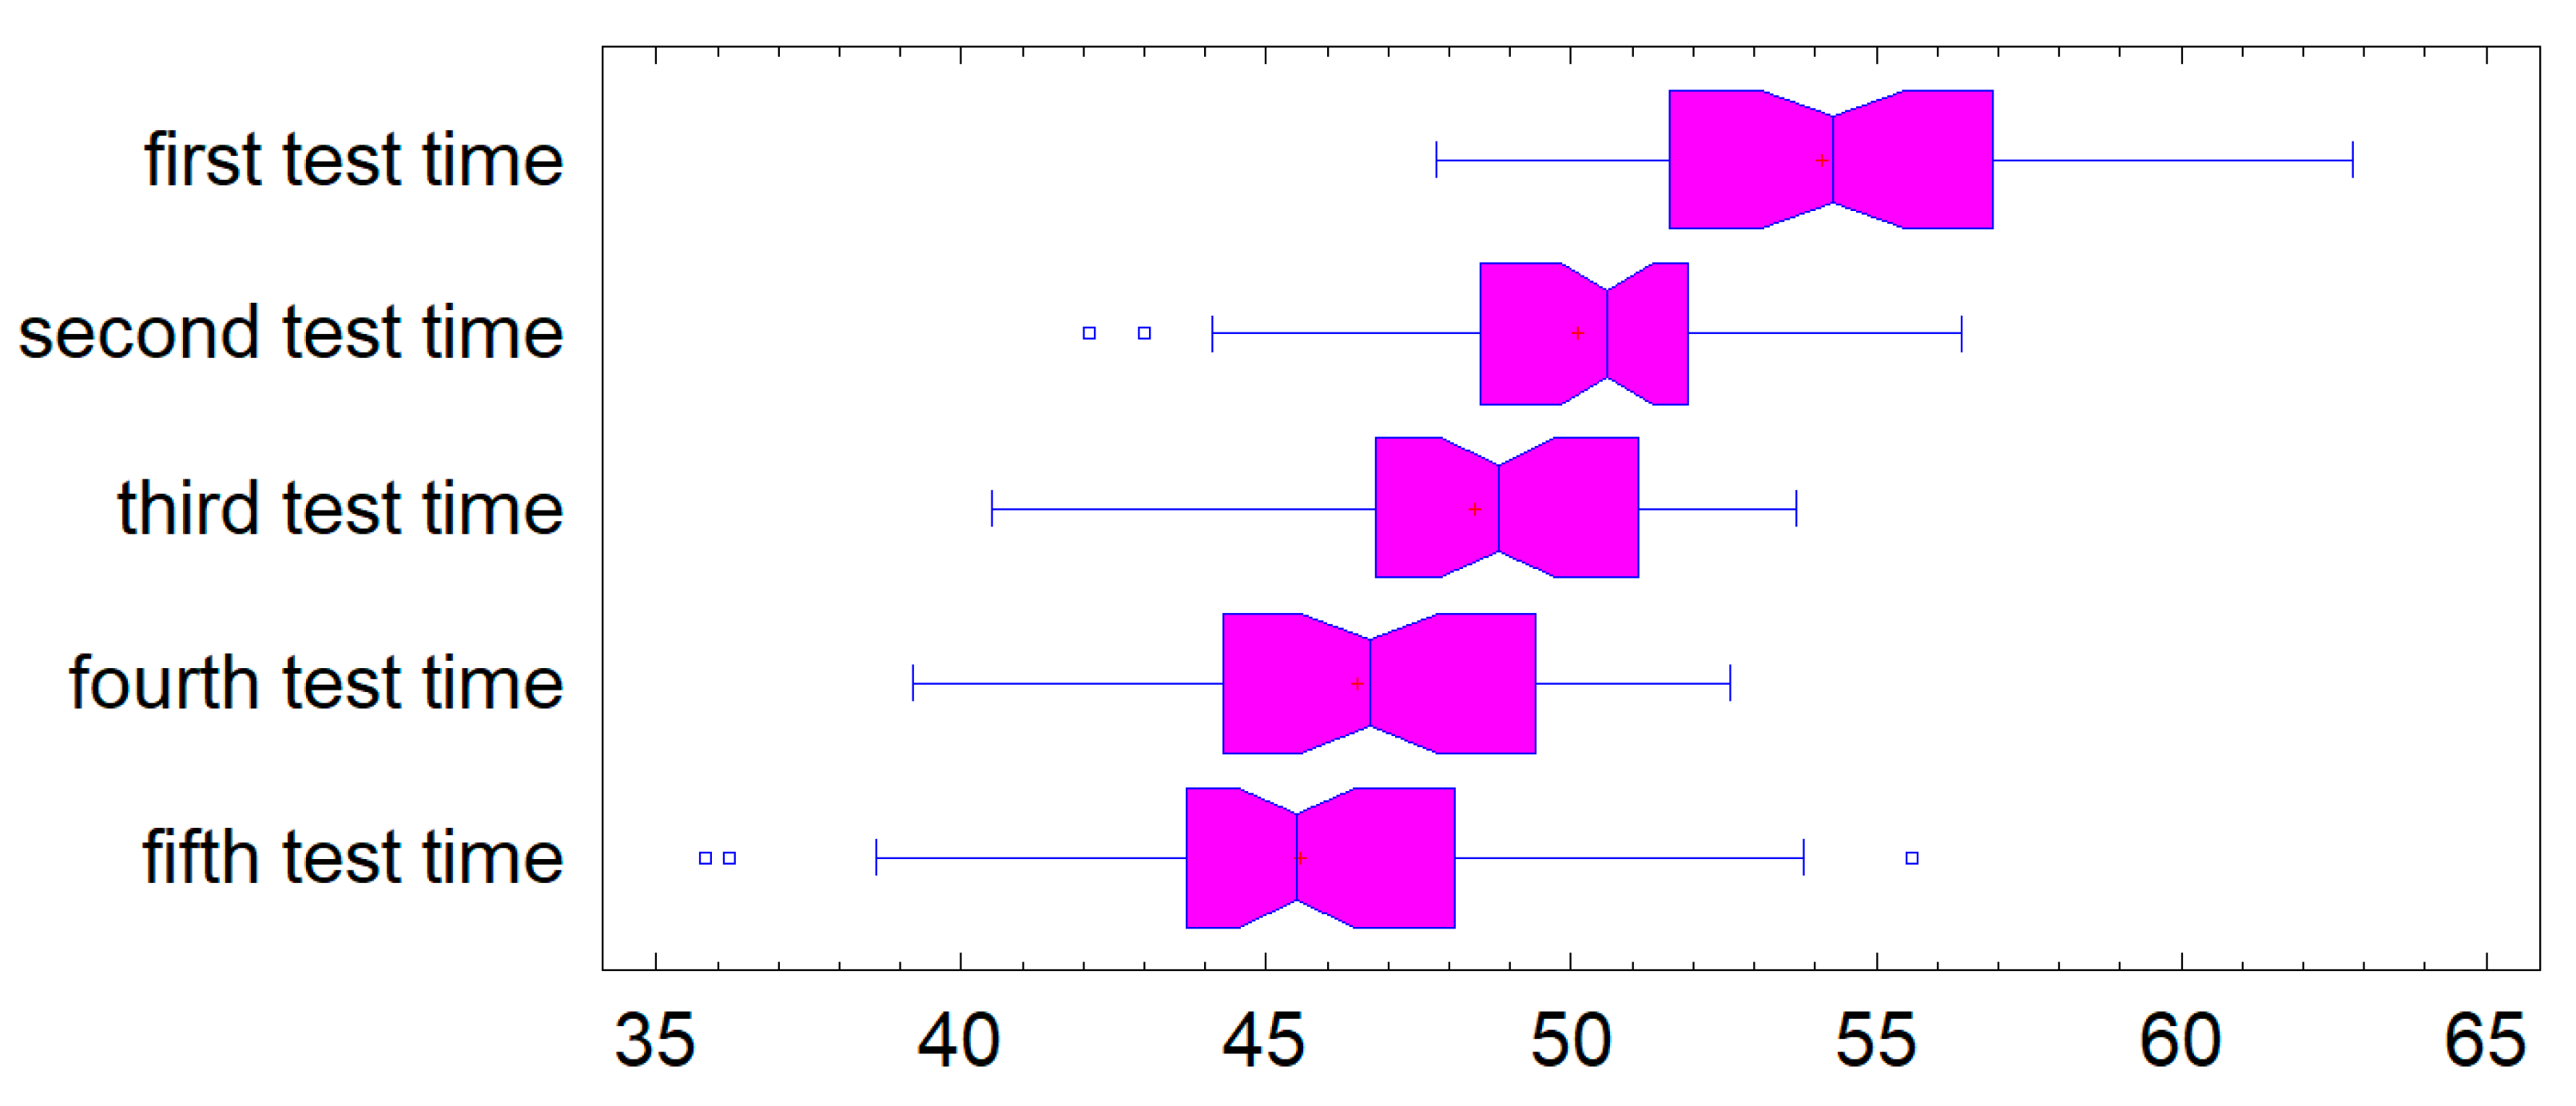
| Count | Average | Standard Deviation | Variance | Minimum | Maximum | Range | |
|---|---|---|---|---|---|---|---|
| 1. Test time | 49 | 54.1082 | 3.40862 | 11.6187 | 47.8 | 62.8 | 15.0 |
| 2. Test time | 49 | 50.1 | 2.97776 | 8.86708 | 42.1 | 56.4 | 14.3 |
| 3. Test time | 49 | 48.4143 | 3.25634 | 10.6038 | 40.5 | 53.7 | 13.2 |
| 4. Test time | 49 | 46.4878 | 3.21738 | 10.3515 | 39.2 | 52.6 | 13.4 |
| 5. Test time | 49 | 45.549 | 3.99865 | 15.9892 | 35.8 | 55.6 | 19.8 |
| Total | 49 | 48.9318 | 4.52815 | 20.5041 | 35.8 | 62.8 | 27.0 |
| Std. Skewness | Std. Kurtosis | |
|---|---|---|
| 1. Test time | 0.442152 | −0.300114 |
| 2. Test time | −1.65789 | 1.36076 |
| 3. Test time | −1.26748 | −0.403727 |
| 4. Test time | −1.01272 | −0.608321 |
| 5. Test time | 0.0303627 | 1.04377 |
| Total | 0.154852 | 0.0405092 |
| Sum of Squares | Df | Mean Square | F-Ratio | p-Value | |
|---|---|---|---|---|---|
| Between groups | 2246.36 | 4 | 561.59 | 48.89 | 0.0000 |
| Within groups | 2756.65 | 240 | 11.486 | ||
| Total (Corr.) | 5003.01 | 244 |
| Count | Average | Homogeneous Groups | |
|---|---|---|---|
| 5. test time | 49 | 45.549 | X |
| 4. test time | 49 | 46.4878 | X |
| 3. test time | 49 | 48.4143 | X |
| 2. test time | 49 | 50.1 | X |
| 1. test time | 49 | 54.1082 | X |
| Contrast | Difference | +/− Limits | |
| 1. test time–2. test time | * 4.00816 | 1.3488 | |
| 1. test time–3. test time | * 5.69388 | 1.3488 | |
| 1. test time–4. test time | * 7.62041 | 1.3488 | |
| 1. test time–5. test time | * 8.55918 | 1.3488 | |
| 2. test time–3. test time | * 1.68571 | 1.3488 | |
| 2. test time–4. test time | * 3.61224 | 1.3488 | |
| 2. test time–5. test time | * 4.55102 | 1.3488 | |
| 3. test time–4. test time | * 1.92653 | 1.3488 | |
| 3. test time–5. test time | * 2.86531 | 1.3488 | |
| 4. test time–5. test time | 0.938776 | 1.3488 | |
Disclaimer/Publisher’s Note: The statements, opinions and data contained in all publications are solely those of the individual author(s) and contributor(s) and not of MDPI and/or the editor(s). MDPI and/or the editor(s) disclaim responsibility for any injury to people or property resulting from any ideas, methods, instructions or products referred to in the content. |
© 2023 by the authors. Licensee MDPI, Basel, Switzerland. This article is an open access article distributed under the terms and conditions of the Creative Commons Attribution (CC BY) license (https://creativecommons.org/licenses/by/4.0/).
Share and Cite
Holuša, V.; Vaněk, M.; Beneš, F.; Švub, J.; Staša, P. Virtual Reality as a Tool for Sustainable Training and Education of Employees in Industrial Enterprises. Sustainability 2023, 15, 12886. https://doi.org/10.3390/su151712886
Holuša V, Vaněk M, Beneš F, Švub J, Staša P. Virtual Reality as a Tool for Sustainable Training and Education of Employees in Industrial Enterprises. Sustainability. 2023; 15(17):12886. https://doi.org/10.3390/su151712886
Chicago/Turabian StyleHoluša, Věroslav, Michal Vaněk, Filip Beneš, Jiří Švub, and Pavel Staša. 2023. "Virtual Reality as a Tool for Sustainable Training and Education of Employees in Industrial Enterprises" Sustainability 15, no. 17: 12886. https://doi.org/10.3390/su151712886