Article

Digital Technology and Green Development in Manufacturing: Evidence from China and 20 Other Asian Countries

1
School of Economics and Management, Zhejiang University of Science and Technology, Hangzhou 310023, China
2
International Business School, Zhejiang Yuexiu University, Shaoxing 312069, China
3
Business School, UCSI University, Kuala Lumpur 56000, Malaysia
4
School of Public Policy and Urban Affairs, Northeastern University, Boston, MA 02115, USA
5
School of Sociology and Population Studies, Beijing 100872, China
6
College of Intelligence and Computing, Tianjin University, Tianjin 300072, China
*
Author to whom correspondence should be addressed.
Sustainability 2023, 15(17), 12841; https://doi.org/10.3390/su151712841
Submission received: 1 June 2023 / Revised: 18 August 2023 / Accepted: 22 August 2023 / Published: 24 August 2023

Abstract

:
The global interest in environmental protection and sustainable development has grown steadily in recent years, sparking widespread concern about green development in the manufacturing industry among governments, enterprises, and scholars around the world. Despite this heightened interest, research on the influence of the digital economy on the manufacturing industry’s green development remains scarce. This article analyzes the impact of the digital economy on the green development of the manufacturing industry and examines the role of human capital and trade competitiveness in this context. Using a two-way fixed-effects model of panel data analysis, we investigated the GTFP (Green Total Factor Productivity) of the Chinese manufacturing industry, as well as that of the overall industry and 20 other Asian countries along the “Belt and Road”. Our findings indicate a positive association between the digital economy and both the overall GTFP and the manufacturing GTFP in China. The countries situated along the Belt and Road experience a U-shaped trend in their GTFP due to the impact of the digital economy. The digital economy displays a delayed impact, and its eco-friendly value is realized, to different extents, after two sequential periods. In addition, human capital and trade competitiveness are threshold variables in the relationship between the digital economy and the green development of the manufacturing industry. When human capital exceeds a certain threshold and trade competitiveness exceeds a certain threshold, the digital economy has a positive effect on GTFP. This study offers unique insights into the impact of the digital economy on the green development of the manufacturing industry. By addressing this research gap, this study gives policymakers the ability to leverage these findings to promote sustainable practices across the industry. Ultimately, the valuable insights provided by this study may contribute to the ongoing efforts to advance the green development of the manufacturing industry.

1. Introduction

Manufacturing is changing as a result of digitization, becoming a highly dynamic and integrated system [1]. However, as the manufacturing sector expands, it gives rise to a host of challenges centered on energy use and pollution, which result in global warming and recurrent episodes of extreme climatic conditions. Rather than serving as a catalyst for economic growth, the environment is presently becoming an impediment to realizing such ambitions [2]. According to research on Belt and Road nations, economic advancement in many countries has led to damaging effects on the environment. Environmental degradation [3], an increase in carbon emissions [4], and unequal energy consumption [5] are among the issues cited as evidence of these negative impacts. Moreover, the global remote sensing of the ecological environment conducted by China’s Ministry of Science and Technology and the National Remote Sensing Center indicates that some countries within the Belt and Road region exhibit low forest coverage and fragile ecological environments, juxtaposed with an elevated degree of human-related activities. As a result, matters related to sustainable developmental and environmental preservation have come into sharp focus within the Belt and Road area. One such country is Russia, which has undergone a transition towards a green economy with a focus on sustainable environmental development. To achieve this, Russia is modifying its traditional economic development model, which was formerly primarily reliant on exporting raw materials, moving towards a contemporary, sustainable model [6]. Cheng and Ge’s study illustrates that the growing awareness of environmental issues among Malaysian citizens necessitates the establishment of a green economy [7]. Furthermore, it is clear that the Chinese government is placing significant emphasis on environmental regulation and the sustainable advancement of the Belt and Road Initiative (BRI), along with other nations along the Belt and Road [7]. It is posited that renewable energy and trade may act as enablers of green economic growth in emerging Asian economies [8]. As an essential element for the advancement of sustainable development, the concept of green development has gained prominence. The objective of our research is to examine the topic of green transformation within the industrial sector.
The rise of the digital economy has captured widespread attention. The Exponential Climate Action Roadmap indicates that digitization can decrease carbon emissions by 15% worldwide. Moreover, the International Energy Agency has highlighted that digital technology can contribute to considerable reductions in the energy consumption of truck operations, resulting in a potential energy saving of up to 20–25%. The digital economy acts as a catalyst in promoting sustainable development across various industries [9], and it is a key enabler for the improvement of manufacturing GTFP [10]. Digital transformation has the potential to significantly enhance the GTFP of organizations, particularly those in the manufacturing, non-high-tech, and non-polluting sectors [11]. As a result, numerous countries have incorporated sustainable green development objectives into their developmental frameworks, with a particular focus on green industries as an essential step towards enhancing economic restructuring [12,13]. As the digital economy continues to grow, its dependence on big data applications is becoming increasingly apparent. However, this growth has given rise to a considerable demand for energy and power in global data centers, thereby contributing to approximately 2% of the world’s greenhouse gas emissions. The issue of e-waste, which remains challenging to recycle, is also a growing concern, as up to 50 million tons are anticipated to be generated globally each year. In their study on the influence of the digital economy on GTFP in Belt and Road nations, Wang and Ren discovered that increased growth in this sector was associated with a notable decline in GTFP [14]. The negative impacts were more pronounced in middle- and high-income countries. However, there is a dearth of empirical research that explores the intricate relationship between digitalization and green development.
Our paper presents several novel contributions:
(1)
This article pioneers an examination of the correlation between the digital economy and green development in the manufacturing sector and in Asian countries within the Belt and Road region. The study acknowledges the prevailing economic and environmental issues within China’s manufacturing industry and within the countries along the Belt and Road; furthermore, it suggests relevant policies for addressing these problems.
(2)
To evaluate the effect of the digital economy on GTFP across diverse domains, this study uses three econometric models. The models include a baseline assessment of China’s manufacturing sector, as well as two comparative models for exploring the digital green effect in China and 20 other Asian countries.
(3)
Three sets of regression models with variables related to the growth of the digital economy that were delayed by two periods were utilized to strengthen the findings of our work. This method was used to simultaneously assess the lag effects of the digital economy on a number of nations and sectors.
(4)
The essay develops a threshold effect model to highlight the significance of human capital and manufacturing trade competitiveness in the link between the digital economy and green growth.
Section 2 explores the relevant literature sources; this is followed by the establishment and detailing of our research models, metrics, and methodology in Section 3. Section 4 presents and scrutinizes the empirical findings, while Section 5 concludes with our recommendations for the Chinese manufacturing sector and the Belt and Road countries.

2. Related Works

2.1. Digital Economy

2.1.1. Definition and Measurement

In 1994, Don Tapscott wrote his first monograph on the digital economy. Subsequently, some scholars divided the digital economy into clear subdivisions, emphasizing the basic elements of the digital economy. The internet, e-commerce, digital delivery and services, and the retailing of commodities are the four pillars of the digital economy. The expansion of e-commerce and the internet’s fusion with communication technologies are receiving increased attention, encouraging the growth of e-commerce and commercialization [15]. In 2013, the OECD defined it in terms of a business that trades goods and services over the internet. Subsequently, some studies considered the digital economy to constitute a digital presentation of end-to-end transaction and cooperation processes based on data and technologies, using the internet and cloud technologies [16,17]. At the G20 Summit in 2016, Chinese scholars initially defined the concept of the digital economy, stating that the digital economy relies on the use of digital data and contemporary networks to drive economic activities. Digital data are used as a vital input for production, while contemporary networks serve as crucial containers to facilitate these activities. The White Paper on the Development of China’s Digital Economy [18] defined it as follows: “The digital economy is a system that prioritizes the inclusion of digital knowledge and information as primary production factors. This system is propelled by digital technology and supported by modern information networks, effectively serving as a critical means of transportation”.
It is critical to thoroughly analyze the digital economy since it is expanding quickly and taking center stage in global growth. In 1998, the U.S. systematically measured the scale of the digital economy and discussed the impact of IT and e-commerce on the U.S. economy [19]. The method that the China Academy of Information and Communications Technology uses to measure the scale of the digital economy includes two components: industrial digitization and digital industrialization. The method for measuring the scale of industrial digitalization uses the growth accounting framework (EU KLEMS), the core content of which is the growth accounting model and the measurement of the sub-industry ICT capital stock, considering the overall ICT capital stock and regional capital stock in China as the industry digitization scale. In addition, Xu Xianchun’s team at Tsinghua University measured the scale of the digital economy. The digital economy has emerged as an economy that relies heavily on digital technology and is commonly interchanged with the terms “internet economy” or “network economy”. It encompasses the digitization of industries, combined with the broader concept of digitalization. Any economic system that utilizes data to allocate resources and improve productivity, either directly or indirectly, falls under this category.

2.1.2. Effects

The digital economy can effectively promote economic growth and create significant value because it has the following characteristics: data dominance, pervasiveness, substitution, and innovation. First, the ability to unleash digital dividends and the use of data as a production motivator are its basic characteristics [20,21]. The second factor relates to integration and permeability. It can penetrate all aspects of social life through the cross-border integration of IT and industries [22]. Technological innovation is one of the aspects of digital transformation.
The digital economy determines the regional innovation capacity [23]. The most cutting-edge technologies and inventions are most strongly affected by the digital economy [24]. We now live in a digital economy as a result of advances in science and technology. Meanwhile, digital empowerment has promoted the elevated performance of collaborative innovation in manufacturing [25]. In addition, as digital economy levels rise, there is a corresponding increase in innovation in the region [23]. The capacity for regional innovation increases with the volume of the digital economy. Moreover, market reliance on digitization has given rise to the platform economy [26], which removes the obstacles between corporate and personal transactions, breaking down the constraints of time and space and thus allowing transactions to take place anytime and anywhere [27,28]. As research continues to advance, it has been discovered that the digital revolution drives the structural transformation of industries [29]. Innovation and entrepreneurship foster the following three components of the transformation and advancement of industrial structures: rapid industrial change, a more complex industrial structure, and a rationalized industrial structure. For ecologically friendly development, the link between green development and the digital economy is becoming highly significant, and the relationship between CO2 emissions and the digital economy follows a U-shaped, non-linear pattern [30]. The digital economy can decrease PM2.5 to a notable extent [31].

2.1.3. The Digital Economy in China and the Belt and Road Countries

China relies on bilateral cooperative relations with neighboring, friendly countries, and the Belt and Road holds high the banner of win–win cooperation. As a means of bolstering the economies of numerous nations, the digital economy has caught the interest of nations along the Belt and Road. In April 2018, the Digital ASEAN Project was officially launched with the aim of empowering the dynamic regional digital economy [32]. A worldwide program called the Digital Belt and Road Initiative (DBAR) gives nations a way to exchange knowledge, expertise, and data while showcasing the value of Earth observation technologies and global data applications for sustainable development [33]. An advanced infrastructure, smart manufacturing, and a skilled ICT workforce have brought dramatic changes to the manufacturing industry in Asian countries [1]. Internet penetration may help widen the export gap between low- and high-income countries [34]. In addition to updating the trade model and fostering international trade and the economy [35], promoting digital transformation in Belt and Road countries also helps Chinese manufacturing enterprises to go global and improve their international status. Although the digital economy has exhibited strong momentum in Asian countries, many developing countries have not fully adapted to the digital economy [36]. ICT has a smaller influence on economic growth in emerging nations than it does in many wealthy nations [37]. However, weak infrastructures, technical incompetence, security loopholes, and user hesitancy are all obstacles that Asian economies should overcome during the sustainable development process [38].
Digital empowerment for economic advancement is a catalyzer for all countries. It is a strategic imperative for nations seeking to attain economic dominance, offering a platform for innovation, efficiency, and transformation. As such, it represents a critical enabling mechanism for optimal economic development and sustainable advancement.

2.2. GTFP

There is no clear definition of the concept of green development, and most scholars have defined green development based on related concepts. Some scholars have summarized the concept, that is, balancing economic and ecological benefits while focusing on green economic growth, and they emphasize the need for symbiotic and coordinated economic, social, and environmental development [39].
To enhance the dependability of evaluations of sustainable development, it is common practice to incorporate environmental variables into the assessment of economic development efficiency, specifically to examine the efficiency of green improvement. At present, the utilization of DEA has emerged as a prominent technique for gauging production efficiency, as it serves to measure regional green total factor productivity (GTFP) from an efficiency standpoint. All of the GTFP mentioned in this article refers to Green Total Factor Productivity. TFP is recognized as one of the most important indicators employed for evaluating the caliber of economic growth and as the principal gauge for reflecting advancements in technology and enhancements of efficiency for economic growth. Nevertheless, considering the swift rate of economic development, it is inevitable that there will be a rise in both energy consumption and pollution. Researchers created the metric of GTFP to address two issues: the difficulty of pricing resources and the environment due to ambiguous property rights regarding resources and the environment and the difficulties posed by the fact that traditional TFP resource consumption and economic development do not occur simultaneously and are not synchronized.
GTFP is an important indicator that simultaneously balances economic growth and environmental protection, sustainable economic development, and harmonious coexistence between human beings and nature. When measuring GTFP, Chung, Färe, and Grosskopf initially presented the DDF model in 1999 and then measured ML productivity on this basis [40]. The ML index can measure the pollutant output in the production process and incorporate it into the TFP index system. Subsequently, after considering the input and output slackness, Tone proposed the slack-based measure (SBM) model, which effectively overcomes the radial and angular defects [41]. Other scholars proposed a more operable SBM-DDF model based on Tone’s research [42]. This model can eliminate the pollution variables from the production function, further enhancing its applicability.

3. Research Design

3.1. Model Construction

We construct a benchmark model (Model (1)) with China’s manufacturing GTFP as the explanatory variable and the digital economy as the core explanatory variable for regression. The variables and data are discussed in detail in the next section. Considering that, in the process of the analysis, there may be unobservable individual heterogeneity that affects the independent variables; this paper draws on previous approaches [43,44] to choose a fixed-effects model with more robust results for analysis.
To more thoroughly investigate how the digital economy supports overall GTFP in China, Model (2) is introduced for comparison with Model (1). The explanatory variables are the overall GTFP in each province of China, and the core explanatory variables and each control variable are the same as those in Model (1).
At the same time, we adopt an international perspective on our research topic. The digital economy has a spatial spillover effect. If a country has an outstanding level of digital utilization, it can drive the development of its neighboring countries’ digital economies accordingly. Therefore, the Belt and Road data analysis platform of Peking University serves as the foundation for the research object of Model (3). The subjects selected for this paper are 20 countries that work closely with China in the international division of labor in global value chains, including Bangladesh, Brunei, Cambodia, Cyprus, India, Indonesia, Iran, Israel, Jordan, Lebanon, Malaysia, Oman, Pakistan, Philippines, Singapore, Sri Lanka, Thailand, Turkey, Kazakhstan, and Kyrgyzstan. All the variables in Model (3) are the same as those in Model (1) and Model (2).
G T F P 1 i t = δ 0 + δ 1 d e i t + δ 2 Z i t + μ i + ν t + ε i t
G T F P 2 i t = α 0 + α 1 d e i t + α 2 Z i t + μ i + ν t + ε i t
G T F P 3 i t = β 0 + β 1 d e i t + β 2 Z i t + μ i + ν t + ε i t
The subscript i denotes the province in Models (1) and (2), and it denotes the twenty Asian countries in Model (3); t denotes the year; GTFP1 denotes the manufacturing GTFP; GTFP2 denotes the total GTFP of industry in China; GTFP3 denotes the GTFP of the 20 Asian countries; de denotes the degree of digitization; Z represents the control variables used in this paper; μ and ν are province- and time-fixed effects, respectively; and ε is the random disturbance term.
In addition, the development of the digital economy cannot be achieved without the promotion of high-quality talent, and the improvement of manufacturing trade competitiveness can improve the innovation characteristics of the digital economy and thus increase GTFP. To further investigate the moderating effect of the digital economy on the GTFP of China’s manufacturing industry, this paper introduces human capital and manufacturing trade competitiveness into the threshold model for analysis.
G T F P 1 i t = α 1 d e i t I ( e d i t γ 1 ) + α 1 d e i t I ( γ 1 e d i t γ 2 ) + + α n d e i t I ( γ n 1 e d i t γ n ) + α n + 1 d e i t I ( e d i t > γ 1 ) + θ Z i t + μ i + ε i t
G T F P 1 i t = α 1 d e i t I ( t c i t γ 1 ) + α 1 d e i t I ( γ 1 t c i t γ 2 ) + + α n d e i t I ( γ n 1 t c i t γ n ) + α n + 1 d e i t I ( t c i t > γ 1 ) + θ Z i t + μ i + ε i t
In Equations (4) and (5), I(·) is the indicator function, and ed and tc are threshold variables.

3.2. Data Description

3.2.1. Explanatory Variables

The explained variable in Model (1) is the GTFP of the Chinese manufacturing industry. This paper draws on previous scholars’ calculation methods and calculates the interprovincial manufacturing GTFP based on the SBM model and the ML index [45,46,47]. We can decompose the ML index into two components that reflect technological progress and the efficiency of technological change over time.
M L 0 = x t + 1 , y t + 1 , x t , y   t = D 0 t x t + 1 ,   y t + 1 D 0 t x t ,   y t × D 0 t + 1 x t + 1 ,   y t + 1 D 0 t + 1 x t ,   y t 1 / 2 = D 0 t + 1 x t + 1 ,   y t + 1 D 0 t x t ,   y t × D 0 t x t + 1 ,   y t + 1 D 0 t + 1 x t + 1 ,   y t + 1 × D 0 t x t ,   y t D 0 t + 1 x t ,   y t 1 / 2 = EFFCH × TECH
Here,  D 0 t x t , y t = i n f θ : x t , y t / θ S t = s u p θ : x t , θ y t / θ S t 1  and  D 0 t + 1 x t + 1 , y t + 1 = i n f θ : x t + 1 , y t + 1 / θ S t + 1 = s u p θ : x t + 1 , θ y t + 1 / θ S t + 1 1 . St is the production technology level at time t; St+1 is the production technology level at time t + 1; xt and yt are the input and output at time t, respectively; and xt+1 and yt+1 are the input and output at time t + 1, respectively. If  x t , y t S t D 0 x t , y t 1 . Only if  x t , y t  is on the technology frontier does  D 0 x t , y t = 1 . The ML index’s geometric mean is utilized to calculate changes in total factor production from period t to t + 1.
When ML > 1, GTFP is rising; when it is less than 1, it is falling. If EFFCH > 0, then the industrial output increases due to changes in technology and the production scale. If TECH > 0, then technological progress leads to industrial output growth. Finally, the ML productivity index can be obtained using linear programming, resulting in GTFP1. Based on the DEA Malmquist index method for measuring the GTFP of China’s manufacturing industry, we refer to the input and output indicators selected in recent works [48,49] when measuring GTFP and then add the undesired output. We select capital, labor, and energy factor inputs as the main input factors. (1) For the capital factor input, we select the amount of manufacturing fixed-asset investment to represent and obtain the actual amount of manufacturing fixed asset investment for each region, excluding the price factor by deflating the price index. (2) Regarding the labor factor input, the number of employees in the manufacturing industry in every area can be used to represent this input. (3) Concerning the energy factor input, we use the manufacturing sales output value/the gross industrial output value of each region and industrial final energy consumption to estimate this input. The specific calculation method is manufacturing energy consumption = (manufacturing sales output value/industry gross output value) × industrial final energy consumption. Second, the outputs include undesired outputs and desired outputs. The actual value of the manufacturing sales output value in each region after excluding the price factor is used as the desired output. In this paper, we choose manufacturing pollution emissions as the undesired output and estimate manufacturing SO2 emissions using the ratio of the manufacturing sales output to the gross industrial output and industrial SO2 emissions in each region. We use the estimation results as a proxy for undesired outputs, as shown in Table 1.
The explanatory variables in Model (2) are the GTFP levels in China. The calculation method is the same as that of the explained variables in Model (1), and, after referencing previous research [50,51], we selected the indicators presented in Table 2.
As per the SBM model and ML index, and based on Maxdea 5.2 software, the present study conducts a computation for the GTFP1 of the manufacturing sector of China and GTFP2 for the entire industry for the period from 2000 to 2022. The respective calculations are outlined in Figure 1. The findings indicate a higher level of GTFP2 in industry overall as compared to the manufacturing sector GTFP1. Over time, the level of green optimization of the whole industry has gradually improved. Heavy industry dominates China’s manufacturing industry, where most enterprises implement a high-input rough development mode, characterized by high resource and energy consumption, low productivity, and substantial waste discharge. From 2006 to 2009, the manufacturing industry experienced a decline in GTFP1. Furthermore, the rapid growth of industrial enterprises during this period and the traditional focus on economic interests hindered sustainable development due to weak environmental awareness, high energy consumption, high levels of pollution, and low efficiency and output. As of 2010, China’s manufacturing sector has been focused on achieving high-quality development and undergoing transformation and upgrading. However, these efforts are currently focused on the middle and downstream parts of the manufacturing industry chain; this results in poor foundations and shortcomings in the high-end and core aspects of the industrial chain, creating a predicament for China’s manufacturing sector.
The explained variable in Model (3) is the GTFP of the twenty other Asian countries under consideration. The measurement method is the same as that for the explained variables in Model (1). After referring to existing studies [9,52], we measured the capital inputs in terms of the annual capital stock of each country. We adopted the perpetual inventory method to depreciate capital inputs, and we determined the depreciation rate to be 6% per year; finally, we deflated the data results to obtain the actual data. The size of the working population is the variable that responds most directly to a country’s labor input and is one of the most important indicators of a country’s level of economic development. Therefore, in this model, we take the number of all laborers in each country in the corresponding year to measure the labor input and the desired output in terms of GNP. As byproducts of economic growth, pollutants such as CO2 and sulfide emissions serve as an indicator of the environmental impact caused by this development. We choose CO2 emissions as the non-desired output. The specifics are displayed in Table 3.

3.2.2. Core Explanatory Variables

We refer to the previously established practice [53] of using the composite index of the digital economy to represent the core explanatory variables of Models (1) and (2). The entropy weight method is then applied to gauge the composite score.
In keeping with the concept of digital economy, this study adheres to the rudiments of relevance, representativeness, and accessibility, drawing on the scholarly contributions of Jiao’s research [54] to establish a comprehensive set of seven indicators and using the entropy methodology to gauge the degree of the digital economy in 20 Asian countries.
The specifics are displayed in Table 4 and Table 5.
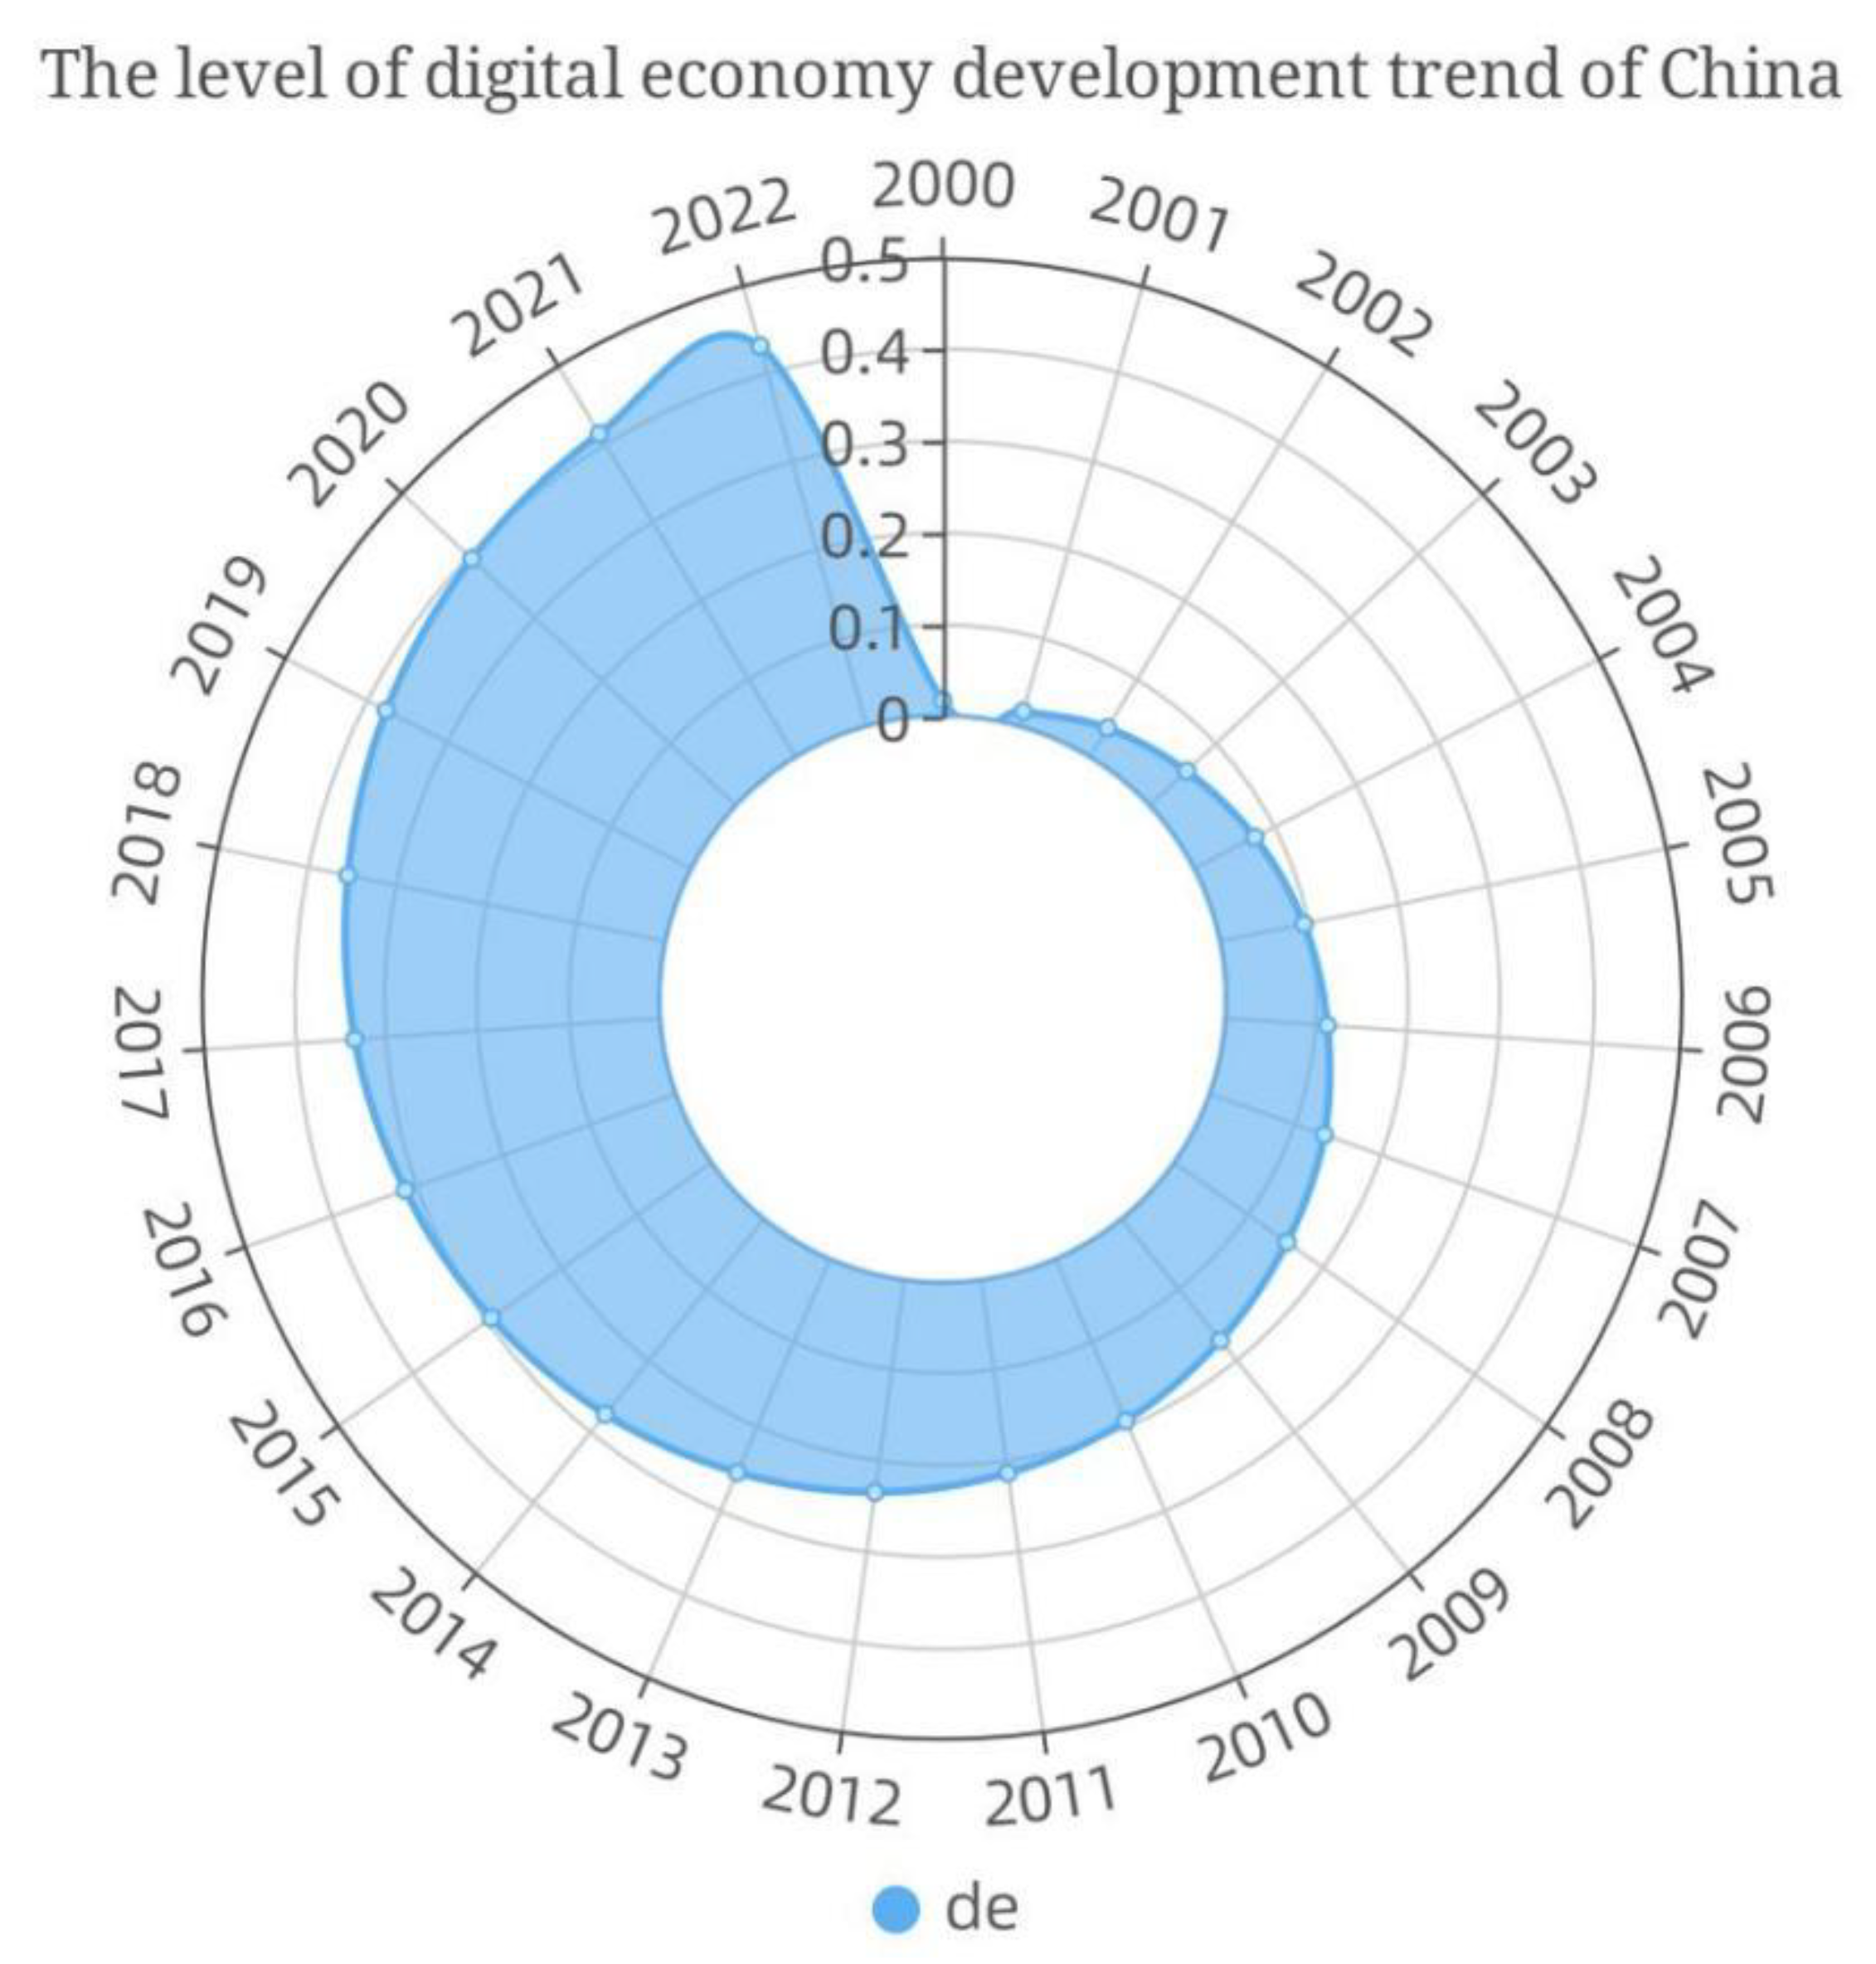
The present study conducts a focused analysis of the temporal trajectory of China’s digital economy spanning the period 2000–2022, as visually represented in Figure 2. Digitization advanced from a modest 0.018 in 2000 to the exalted level of 0.430 in 2022. As cutting-edge technologies continue to be employed, the prominence of China’s digital economy is on the rise. Over the years, the digital economy’s contribution to the national GDP has grown substantially, further solidifying its place as one of China’s most significant economic pillars. According to recent data from the China Academy of Information and Communications Technology, the scale of the digital economy has displayed continuous and dynamic expansion in recent years. Projected to rise from CNY 22.6 trillion in 2016 to CNY 50.2 trillion by 2022, it will represent more than 40% of the country’s GDP.
As shown in Figure 3, the level of digitization and the GTFP of the manufacturing industry were studied in various provinces across China. The results indicated that Beijing exhibited the highest level of digital economic development when compared to other regions in the country. Additionally, significantly higher levels of digitization were observed in the eastern coastal region than in the central and western regions. The findings pertaining to GTFP revealed that the majority of provinces exhibited medium to high levels of GTFP, with the exception of the central region, which exhibited a lower level of GTFP. Influenced by factors including geographical conditions, resource availability, and its industrial foundation, the industrial composition of the central region has consistently exhibited a predilection toward heavier industries. This disproportionate representation of heavy industries within the total industrial output value results in significantly heightened environmental pressures that surpass those observed on the national scale.
As shown in Figure 4, the digital economy and green development levels of 20 countries situated along the Belt and Road were analyzed. Notably, Singapore demonstrated the highest digitization level of 0.87, while Pakistan’s digital economy development level was only 0.01, resulting in a digital schism that cannot be overlooked. Moreover, the majority of countries demonstrate a digital development index of less than 0.23, indicating weak digital infrastructure construction and a serious lag in digital development. Overall, Asian Belt and Road countries remain at a lower–middle level in terms of the digital economy, and the digital divide is substantial. Additionally, the country with the highest GTFP level among the 20 countries is Jordan, while Iran has the lowest GTFP level. The overall green level of these 20 countries is at the upper–middle level.

3.2.3. Control Variables

Industry structure upgrading, government financial behavior, environmental regulation, the industrial scale, and technological innovation capabilities all have an impact on GTFP [55,56,57]. In Models (1) and (2), the control variables include: the degree of the industrial structure (is). To determine the overall scores for industrial rationalization and industrial upgrading, in this study, we use the entropy weight method and assess labor productivity in every province to measure the level of the local industrial structure. We use the provincial government fiscal expenditure/GDP to represent government actions (gov). We use the provincial industrial pollution investment/GDP to represent environmental regulation (en). The number of patents issued in each province is used to illustrate technical innovation (ino). For the regional industrial scale (sca), there is no uniform standard presented in the literature. In this study, the regional industrial scale is expressed using the value added of industry by province.
In Model (3), the control variables include the following. First, there is the level of the industrial structure (is), which this paper measures using the manufacturing value added/GDP for each country. For government actions (gov), we use the proportion of general government expenditure to GDP in each country. This paper uses the national environmental performance index published by Yale University to represent environmental regulation (en). We use the number of patent applications in various countries to represent technological innovation (ino). Furthermore, this paper uses the industrial added value of each country to represent the regional industrial scale (sca).

3.2.4. Threshold Variables

Human capital not only enhances the ability of the local region to develop high-quality resources, but it also increases the environmental awareness of the local people, thus facilitating green development [58]. One factor that affects the promotion of greenery is trade, both in terms of imports and exports [59,60]. In this research, we use the proportion of the number of undergraduates and junior colleges in China’s provinces to the gross population to measure human capital (ed). This study also calculates the manufacturing trade competitiveness index (tc). The manufacturing trade competitiveness index (tc) assesses the proportion of a region or country’s manufacturing foreign trade balance in relation to the entire aggregate foreign trade. The descriptive statistics for Model (1), Model (2) and Model (3) are shown in Table 6 and Table 7 respectively.
Data sources: the EPS database, WDI database, BP World Energy Statistical Yearbook, World Bank database, and Penn World Table.

4. Empirical Results and Analysis

First, this paper collects panel data from 2008 to 2019, covering 30 provinces in China, excluding Hong Kong, Macao, Taiwan, and Tibet. We perform a regression analysis on benchmark Model (1) to examine the digital green function of China’s manufacturing industry. We then examine the threshold effect of the digital economy on China’s manufacturing GTFP. Second, we calculate the GTFP of each province in China from 2008 to 2019, using the same situation that we used in Model (1) to construct Model (2) for the regression analysis, and discuss the difference between the regression results obtained and the regression results of Model (1). Third, this study compiles the 2008–2019 panel data covering twenty Asian countries (i.e., Bangladesh, Brunei, Cambodia, Cyprus, India, Indonesia, Iran, Israel, Jordan, Lebanon, Malaysia, Oman, Pakistan, Philippines, Singapore, Sri Lanka, Thailand, Turkey, Kazakhstan, and Kyrgyzstan) and conducts a regression analysis of Model (3). Finally, we compare these regression results with those of Model (2).

4.1. Stationarity Test

To avoid the error caused by spurious regression, this paper first carries out the following three-unit root tests for the panel data on the benchmark Model (1). When the p value is at the 1% level, the data are stable. Table 8 displays the results.

4.2. Analysis of the Empirical Results

Using the Stata 17 application, we found that the absence of control variables, as demonstrated in Column (1) of Table 9, illuminates the positive and statistically significant impact of the level of digital economic development on the GTFP of the manufacturing industry in China. Previous research has shown that the expansion of the digital revolution not only contributes to output growth and economic productivity but also represents a low-carbon and ecologically sustainable impact, unlocking its green potential, as exhibited in two specific aspects. Initially, productivity is increased through newer iterations of digital machinery and technology. Second, the digital platform effect has the potential to reduce transactional frictions between manufacturers and buyers, spanning temporal and spatial boundaries to enable trading opportunities at any time and in any place, thereby enhancing the efficiency and effectiveness of supply chain systems for increased output. It has been observed that, when comparing the impact of model (1) with that of model (2), the coefficient for the digital economy’s effect on manufacturing GTFP is smaller in magnitude than that of China’s industry-wide GTFP. The digital economy has the potential to enhance the green value of the manufacturing sector; however, its full potential has yet to be realized. Additionally, the influence of the is on China’s manufacturing GTFP is represented by an impact coefficient of −0.132. However, this result is not significant, which may be due to unreasonable industrial structures and the lack of a new driving force in China’s manufacturing industry structure at present. There is still plenty of room for development [61], and the promoting effect on green development is not obvious. The GTFP of Chinese manufacturing is influenced by the gov, as demonstrated by the impact coefficient of −1.273. In contrast to column (4), the outcomes are not conspicuous in column (2). These results may be attributed to the government’s fiscal expenditure priorities during the early stages of the development of China’s manufacturing industry, which mainly targeted energy-intensive, highly polluting heavy industries and related sectors. Moreover, the government’s policies for the manufacturing industry lack scientific rigor, and the formulation thereof is inadequate in terms of specifying policies aimed at balancing environmental protection and industrial optimization. The impact coefficient of en on China’s manufacturing GTFP is 18.15. The current environmental regulations have a favorable impact in terms of boosting improvements in the GTFP of manufacturing, which results in a harmony between the economy and the environment. The impact coefficient of ino for the GTFP of China’s manufacturing sector is 0.00612. In comparison to the wider industry, it is inferred that technological innovation does not make a substantial contribution to GTFP within China’s manufacturing sector. The manufacturing landscape in China exhibits a conspicuous preponderance of medium- and low-end industries and is lacking in the adoption of efficacious and ecologically friendly cutting-edge technologies, thus constraining the attainability of high-quality development. The study’s findings indicate that there exists a statistically significant negative relationship between the sca and the GTFP of the Chinese manufacturing industry. With an impact coefficient of −0.189, our results suggest that the agglomeration of energy-intensive industrial manufacturing industries in large-scale industrial regions poses a substantial challenge to achieving green development goals.
As per the findings presented in Model (3), the digital green potential of 20 Asian countries located along the Belt and Road remains limited. Our findings are also in line with those of Wang and Ren’s research [9]. As a consequence, the degree of digital green empowerment varies significantly between sectors and countries. While the quality of the digital transformation is evident in China, with the release of a digital dividend that enriches various industries and the implementation of eco-friendly practices, the majority of countries along the Belt and Road have fallen behind in terms of digital economic development, thereby presenting a significant digital divide that hinders green development. Based on a comparison of the outcomes displayed in columns (4) and (6), the research findings reveal that the green development of these countries is hindered by the illogical industrial structure. This constraint is likely to arise from the excessive resource exploitation and environmental pollution conflicts that have progressively become more apparent due to the acquisition of labor-intensive and heavy chemical industries from other developed countries. In addition, the absence of policy support for environmental optimization in these nations has resulted in adverse environmental impacts. Moreover, the nations situated along the Belt and Road corridor exhibit limited innovation potential, and the insufficient governance and investment in environmental protection by their respective governments imply that the promotion of sustainable and healthy development has reached an impasse.
In the initial phase of digital economic development, inadequate digital infrastructure and technological backwardness hindered the full realization of its green value, producing limited resources and energy consumption during the development process. Thus, digital empowerment requires an extended period of time for technological accumulation and if its green value is to be maximized. Table 10 shows that, when regressing the second-order lagged variable de with Models (1), (2), and (3), the coefficients of GTFP1 and GTFP2 significantly increase, and GTFP3 increases from −0.396 to 0.0276. These results reveal a significant lagging effect of the digital green empowerment, aligning with Wei and Hou’s conclusion [62]. Therefore, the digitization of green penetration requires prolonged development and progress to realize its effective role in the economy. Additionally, regarding the digital economy of Belt and Road countries with respect to ecological advancement, a notable U-shaped nexus of constraint and subsequent facilitation exists. To unlock the potential of the digital economy in relation to environmental friendliness, the advancement of GTFP necessitates sacrifices from the nations along the Belt and Road in terms of limited resources and investment costs.

4.3. Endogeneity and Robustness

To alleviate the interference of potential endogeneity problems in the regression results, we adopt instrumental variables and the 2SLS method to test the robustness of the results of benchmark Model (1). Drawing on previous approaches, we select the cross-product term of the number of cell phones in each province at the end of 1998 and the number of internet broadband access subscribers in each province in the previous period of the sample year. This serves as the instrumental variable [56]. As historical data, the number of cell phones by province at the end of 1998 would not have a direct and significant influence on current Chinese manufacturing GTFP, satisfying the condition of exogeneity. Additionally, there is a clear link between the advancement of internet technology and the rise of the digital economy, and, in general, provinces with a higher penetration of mobile devices are more likely to reach a better level of internet technology and digital economic development, which satisfies the correlation condition of instrumental variables. In Table 11, Column (1) displays a positive correlation between the instrumental variables and the primary explanatory factors, indicating a strong association between the two. Additionally, in Column (2), the core explanatory variables and the explanatory variables show a positive contribution. These results indicate that the study results presented above are robust.
In addition, to avoid the effect of the sample time selection, after randomly excluding the samples from 2013 and 2016, we performed the benchmark regression of Model (1) again, further validating the robustness of our research.

4.4. Threshold Effect

In Table 12, we examine threshold effects using a single-threshold model, with the threshold variables of human capital and the trade competitiveness index. The results reveal that both of them successfully pass the single-threshold test.
As shown in Table 13, the estimated coefficient pertaining to the digital economy exhibited a near-twofold increase upon exceeding the threshold value of human capital, indicating statistical significance at the 1% level. These outcomes lend credence to the assertion that augmented human capital can serve to amplify the effectiveness of the digital green effect. The digital revolution underscores the importance of creating a vast repository of skilled talents, with the cultivation of human capital serving as a viable means of providing the requisite intellectual backing to the digital transformation. High-level talent can facilitate the effective utilization of digital innovation and drive digital change, resulting in a substantial improvement in production efficiency, ultimately leading to greening.
According to the above findings, the quality of the green transformation of the digital economy is contingent on the level of the trade competitiveness index. When the trade competitiveness index falls below a certain threshold, the unfavorable influence of the digital economy on green development is inconspicuous. However, as the trade competitiveness index crosses the threshold, the digital green effect becomes visible. In the initial phase of manufacturing trade development, competition tends to be excessive due to a small trade scale, weak manufacturing trade competitiveness, and high levels of similarity in the trade product structure, resulting in an adverse effect on green development. Nevertheless, opening up opportunities for trade leads to an increase in manufacturing trade competitiveness, drawing in foreign firms with advanced digital technology and capital accumulation, which drives the spread of multinational companies, eventually promoting the level of green development of the host country. As the competitiveness of manufacturing trade reaches a certain level, various ministries compete in green technological innovation with the aid of digital technology, thus ensuring the fulfilment of long-term green goals.

5. Conclusions and Recommendations

5.1. Conclusions

(1) China’s industries have seen a respectable rise in GTFP levels as a result of the digital revolution. However, this expansion has had a detrimental effect on the green development of the 20 countries along the Belt and Road. Importantly, the consequences of the digital economy have shown remarkable variety across various industries and nations.
(2) After comparing manufacturing to industry as a whole, the study concludes that the digital green effect on the manufacturing industry is smaller than that on the whole industry, and there remain opportunities for the development of the former sector. This shortfall is attributed to various factors, including the need for adjustments to China’s manufacturing industrial structure and the scientific prioritization of government financial spending towards environmental protection and industrial optimization. Although China’s manufacturing industry is extensive in scale, a large portion of its industries operate at insufficient levels. These lower levels lack the capacity for innovative practices and advanced technology.
(3) To examine the diversity of the digital economy across different countries, the article selects 20 other Asian nations for analysis and discussion. As per the comparative analysis of China’s developmental trajectory, it is evident that there is a significant digitalization disparity within Belt and Road countries, with the majority of them trailing behind in the digital economy and having difficulty realizing its value. The rationale behind this situation is rooted in nonsensical industrial structures, insufficient policy support for environmental management, and a lack of capacity for innovation, ultimately obstructing sustainable and robust development within these countries.
(4) The digital economy showcases a distinct lag effect. It has been observed that, after a lag of two periods, there was a remarkable improvement in the green level of China’s manufacturing industry and the overall sector. However, it has a “U”-shaped impact on GTFP in the other 20 countries. The process of digitalization necessitates a protracted duration of accumulation and penetration if green empowerment is to occur.
(5) Both human capital and trade competitiveness exert threshold effects in the model. The availability of highly qualified workers is vital for unleashing digital dividends, driving the industrial sector’s growth in terms of environmental sustainability. Additionally, trade competitiveness drives the relationship in a U-shaped direction.

5.2. Recommendations

The present state of China’s manufacturing sector is characterized by its large scale but weak competitiveness. First, strengthening core technological research and development is of paramount importance, particularly in enabling the integration of new intelligent technologies into production capacity. Precision policy funding support specifically for the manufacturing industry should be provided by the government to encourage the digitalization of industrial clusters. Effective guidance from the government should also be provided for businesses, promoting high-tech, green, and intelligent development through a focus on research and development. Second, recruiting top talents and highly skilled technical workers for industry is vital, with measures put in place to enhance the quality of human capital. These measures include regular training on advanced technologies, increased investment in research and development, and technology subsidies for research and development personnel. Third, the optimization of resource allocation is also crucial, including improvements in the allocation of labor and capital within the industry. It is essential to integrate industry resources efficiently and boost the iteration and updating of the industrial chain. Optimizing collaboration between upstream and downstream partners in the manufacturing industry’s supply chain is crucial in achieving the desired regional industrial collaborations. Finally, encouraging manufacturing companies to participate in international competition and import advanced technologies and management expertise will help to improve China’s manufacturing industry’s technology and product quality, increase foreign trade, and promote international competitiveness.
Countries along the Belt and Road need to address environmental issues such as ecological vulnerability and resource depletion by implementing targeted environmental policies, developing a circular economy, and improving resource utilization efficiency while prioritizing technological innovation and low-cost, high-efficiency, and low-carbon technologies. Additionally, building a clean system is crucial. Moreover, it is recommended that these countries develop digital industry clusters, introduce supportive policies, and attract technology-oriented companies and qualified human resources. Facilitating cluster collaboration within countries via a digital operations platform is essential. Lastly, continual efforts must be made to develop a high-quality Belt and Road and to deepen cooperation between countries. Countries should deepen economic and scientific cooperation, bridge the digital and economic divide, and achieve mutually beneficial cooperation.

Author Contributions

The research study’s conception and design involved all of the authors. X.L., H.B. and F.L. were responsible for the preparation of the materials and the data collection, while Y.H. constructed the relevant study model and performed the analysis. The primary author, L.Z., drafted the initial manuscript, which was subsequently revised by C.Y. and D.L. All authors provided valuable feedback throughout the drafting process. All authors have read and agreed to the published version of the manuscript.

Funding

This work is supported in part by the Key R&D program of Zhejiang Province (2022C01083), the National Natural Science Foundation of China (62272311, 62102262).

Institutional Review Board Statement

Not applicable.

Informed Consent Statement

Not applicable.

Data Availability Statement

The data that support the findings of this study are openly available in the EPS database at https://www.epsnet.com.cn/index.html (accessed on 28 December 2022), the WDI database at https://data.worldbank.org/ (accessed on 5 January 2023), the BP World Energy Statistical Yearbook, and the Penn World Table at https://www.rug.nl/ggdc/productivity/pwt/ (accessed on 10 January 2023).

Conflicts of Interest

The authors declare no conflict of interest.

References

  1. Kim, J.; Abe, M.; Valente, F. Impacts of the digital economy on manufacturing in emerging Asia. Asian J. Innov. Policy 2019, 8, 1–30. [Google Scholar] [CrossRef]
  2. Pearce, D.; Markandya, A.; Barbier, E. Blueprint 1: For a Green Economy, 1st ed.; Routledge: London, UK, 1989. [Google Scholar] [CrossRef]
  3. Khan, A.; Chenggang, Y.; Bano, S.; Hussain, J. The empirical relationship between environmental degradation, economic growth, and social well-being in Belt and Road Initiative countries. Environ. Sci. Pollut. Res. 2020, 27, 30800–30814. [Google Scholar] [CrossRef]
  4. Lu, Q.; Fang, K.; Heijungs, R.; Feng, K.; Li, J.; Wen, Q.; Li, Y.; Huang, X. Imbalance and drivers of carbon emissions embodied in trade along the Belt and Road Initiative. Appl. Energy 2020, 280, 115934. [Google Scholar] [CrossRef]
  5. Hafeez, M.; Yuan, C.; Khelfaoui, I.; Sultan Musaad, O.A.; Waqas Akbar, M.; Jie, L. Evaluating the Energy Consumption Inequalities in the One Belt and One Road Region: Implications for the Environment. Energies 2019, 12, 1358. [Google Scholar] [CrossRef]
  6. Poltarykhin, A.L.; Alekseev, A.E.; Kudryavtsev, V.V.; Makhanova, T.A.; Voronkova, O.Y.; Aydinov, H.T. Prospects for the development of the green economy of Russian federation. Eur. Res. Stud. 2018, 21, 470–479. [Google Scholar] [CrossRef] [PubMed]
  7. Cheng, C.; Ge, C. Green development assessment for countries along the belt and road. J. Environ. Manag. 2020, 263, 110344. [Google Scholar] [CrossRef]
  8. Wei, X.; Ren, H.; Ullah, S.; Bozkurt, C. Does environmental entrepreneurship play a role in sustainable green development? Evidence from emerging Asian economies. Econ. Res. Ekon. Istraž. 2022, 36, 73–85. [Google Scholar] [CrossRef]
  9. Meng, F.; Zhao, Y. How does digital economy affect green total factor productivity at the industry level in China: From a perspective of global value chain. Environ. Sci. Pollut. Res. 2022, 29, 79497–79515. [Google Scholar] [CrossRef]
  10. Hao, X.; Wang, X.; Wu, H.; Hao, Y. Path to sustainable development: Does digital economy matter in manufacturing green total factor productivity? Sustain. Dev. 2023, 31, 360–378. [Google Scholar] [CrossRef]
  11. Wang, J.; Liu, Y.; Wang, W.; Wu, H. How does digital transformation drive green total factor productivity? Evidence from Chinese listed enterprises. J. Clean. Prod. 2023, 406, 136954. [Google Scholar] [CrossRef]
  12. Gruber, H. Proposals for a digital industrial policy for Europe. Telecommun. Policy 2019, 43, 116–127. [Google Scholar] [CrossRef]
  13. Li, K.; Kim, D.J.; Lang, K.R.; Kauffman, R.J.; Naldi, M. How should we understand the digital economy in Asia? Critical assessment and research agenda. Electron. Commer. Res. Appl. 2020, 44, 101004. [Google Scholar] [CrossRef]
  14. Wang, A.; Ren, J. The impact of the digital economy on green total factor productivity in Belt and Road countries: The mediating role of energy transition. Front. Environ. Sci. 2023, 11, 1213961. [Google Scholar] [CrossRef]
  15. Lane, N. Advancing the digital economy into the 21st century. Inf. Syst. Front. 1999, 1, 317–320. [Google Scholar] [CrossRef]
  16. Lazović, V.; Duričković, T. The digital economy in developing countries-challenges and opportunities. In Proceedings of the 2014 37th International Convention on Information and Communication Technology, Electronics and Microelectronics (MIPRO), Opatija, Croatia, 26–30 May 2014; pp. 1580–1585. [Google Scholar] [CrossRef]
  17. Turcan, V.; Gribincea, A.; Birca, I. Digital economy—A premise for economic development in the 20th century. Econ. Sociol. Theor. Sci. J. 2014, 2, 109–115. [Google Scholar]
  18. China Institute of Information and Communication. White Paper on the Development of China’s Digital Economy. 2020. Available online: http://www.caict.ac.cn (accessed on 31 December 2022).
  19. Barbet, P.; Coutinet, N. Measuring the digital economy: State-of-the-art developments and future prospects. Commun. Strateg. 2001, 42, 153–184. [Google Scholar]
  20. Miao, Z. Digital economy value chain: Concept, model structure, and mechanism. Appl. Econ. 2021, 53, 4342–4357. [Google Scholar] [CrossRef]
  21. Pan, W.; Xie, T.; Wang, Z.; Ma, L. Digital economy: An innovation driver for total factor productivity. J. Bus. Res. 2022, 139, 303–311. [Google Scholar] [CrossRef]
  22. Moriset, B.; Malecki, E.J. Organization versus space: The paradoxical geographies of the digital economy. Geogr. Compass 2009, 3, 256–274. [Google Scholar] [CrossRef]
  23. Ding, C.; Liu, C.; Zheng, C.; Li, F. Digital economy, technological innovation and high-quality economic development: Based on spatial effect and mediation effect. Sustainability 2022, 14, 216. [Google Scholar] [CrossRef]
  24. Gagulina, N.; Samoylov, A.; Novikov, A.; Yanova, E. Innovation-Driven Development and Quality of Living under Conditions of Digital Economy. In E3S Web of Conferences; EDP Sciences: Les Ulis, France, 2020; Volume 157, p. 04037. [Google Scholar] [CrossRef]
  25. Yang, J.; Ying, L.; Gao, M. The influence of intelligent manufacturing on financial performance and innovation performance: The case of China. Enterp. Inf. Syst. 2020, 14, 812–832. [Google Scholar] [CrossRef]
  26. Acs, Z.J.; Song, A.K.; Szerb, L.; Audretsch, D.B.; Komlosi, E. The evolution of the global digital platform economy: 1971–2021. Small Bus. Econ. 2021, 57, 1629–1659. [Google Scholar] [CrossRef]
  27. Drobyazko, S. Introduction of E-Commerce at Enterprises as a Driver of Digital Economy. In E3S Web of Conferences; EDP Sciences: Les Ulis, France, 2020; Volume 211, p. 04012. [Google Scholar] [CrossRef]
  28. Malenkov, Y.; Kapustina, I.; Shishkin, V.V.; Shishkin, V.I. Theoretical aspects of strategic sustainability of a trading enterprise under digitally transforming economy. IOP Conf. Ser. Mater. Sci. Eng. 2019, 497, 012128. [Google Scholar] [CrossRef]
  29. Boev, A.G. The contents and peculiarities of the process of institutional transformation of industrial complexes in a digital economy. Russ. J. Ind. Econ. 2020, 13, 18–28. [Google Scholar] [CrossRef]
  30. Li, X.; Liu, J.; Ni, P. The Impact of the digital economy on CO2 emissions: A theoretical and empirical analysis. Sustainability 2021, 13, 7267. [Google Scholar] [CrossRef]
  31. Li, Z.; Li, N.; Wen, H. Digital economy and environmental quality: Evidence from 217 cities in China. Sustainability 2021, 13, 8058. [Google Scholar] [CrossRef]
  32. Van Laar, E.; Van Deursen, A.J.A.M.; Van Dijk, J.A.G.M.; De Haan, J. The relation between 21st-century skills and digital skills: A systematic literature review. Comput. Hum. Behav. 2017, 72, 577–588. [Google Scholar] [CrossRef]
  33. Guo, H.; Liu, J.; Qiu, Y.; Menenti, M.; Chen, F.; Uhlir, P.F.; Zhang, L.; van Genderen, J.; Liang, D.; Natarajan, I.; et al. The Digital Belt and Road program in support of regional sustainability. Int. J. Digit. Earth 2018, 11, 657–669. [Google Scholar] [CrossRef]
  34. Visser, R. The effect of the internet on the margins of trade. Inf. Econ. Policy 2019, 46, 41–54. [Google Scholar] [CrossRef]
  35. Liang, H.; Zhang, Y. Digital Trade: The Innovation Network of Belt and Road. In The Theoretical System of Belt and Road Initiative; Springer: Berlin/Heidelberg, Germany, 2019; pp. 111–115. [Google Scholar] [CrossRef]
  36. Avirutha, A.A. ASEAN in digital economy: Opportunities and challenges. J. ASEAN PLUS Stud. 2021, 2, 17–25. [Google Scholar]
  37. Shodiev, T.; Turayey, B.; Shodiyev, K. ICT and economic growth nexus: Case of central Asian countries. Procedia Soc. Sci. Humanit. 2021, 1, 155–167. [Google Scholar] [CrossRef]
  38. Jarwal, D. An analysis of sustainability of digital economy in select member countries of Asian Development Bank. Vidyawarta Spec. Issue 2019, 22–25. [Google Scholar] [CrossRef]
  39. Lavrinenko, O.; Ignatjeva, S.; Ohotina, A.; Rybalkin, O.; Lazdans, D. The role of green economy in sustainable development (case study: The EU states). Entrep. Sustain. Issues 2019, 6, 1113–1126. [Google Scholar] [CrossRef] [PubMed]
  40. Chung, Y.H.; Färe, R.; Grosskopf, S. Productivity and undesirable outputs: A directional distance function approach. J. Environ. Manag. 1997, 51, 229–240. [Google Scholar] [CrossRef]
  41. Tone, K. A slacks-based measure of efficiency in data envelopment analysis. Eur. J. Oper. Res. 2001, 130, 498–509. [Google Scholar] [CrossRef]
  42. Fukuyama, H.; Weber, W.L. A directional slacks-based measure of technical inefficiency. Soc.-Econ. Plan. Sci. 2009, 43, 274–287. [Google Scholar] [CrossRef]
  43. Song, M.; Du, J.; Tan, K.H. Impact of fiscal decentralization on green total factor productivity. Int. J. Prod. Econ. 2018, 205, 359–367. [Google Scholar] [CrossRef]
  44. Zhong, Y.; Sun, B. Research on relationship between FDI and Green Total Factor Productivity Based on Fixed Effects Model—China’s Manufacturing Data. In Proceedings of the 2020 Management Science Informatization and Economic Innovation Development Conference (MSIEID), Guangzhou, China, 18–20 December 2020; pp. 34–37. [Google Scholar] [CrossRef]
  45. Ding, L.; Wu, M.; Jiao, Z.; Nie, Y. The positive role of trade openness in industrial green total factor productivity—Provincial evidence from China. Environ. Sci. Pollut. Res. 2022, 29, 6538–6551. [Google Scholar] [CrossRef]
  46. Chen, C.; Lan, Q.; Gao, M.; Sun, Y. Green Total Factor Productivity Growth and Its Determinants in China’s Industrial Economy. Sustainability 2018, 10, 1052. [Google Scholar] [CrossRef]
  47. Li, Y.; Chen, Y. Development of an SBM-ML model for the measurement of green total factor productivity: The case of pearl river delta urban agglomeration. Renew. Sustain. Energy Rev. 2021, 145, 111131. [Google Scholar] [CrossRef]
  48. Zhang, Y.; Qiao, Y. Research on the effect of different types of environmental regulations on green total factor productivity in manufacturing industry—An empirical analysis based on DEA-Malmquist index method and spatial error model. Ecol. Econ. 2022, 5, 177–182. (In Chinese) [Google Scholar]
  49. Zhao, Y.; Zhang, Z. Distribution of Spatial and Temporal Heterogeneity of Green Total-Factor Productivity in the Chinese Manufacturing Industry, and the Influencing Factors. Sustainability 2023, 15, 2919. [Google Scholar] [CrossRef]
  50. Zhao, M.; Liu, F.; Sun, W.; Tao, X. The Relationship between Environmental Regulation and Green Total Factor Productivity in China: An Empirical Study Based on the Panel Data of 177 Cities. Int. J. Environ. Res. Public Health 2020, 17, 5287. [Google Scholar] [CrossRef]
  51. Fan, M.; Yang, P.; Li, Q. Impact of environmental regulation on green total factor productivity: A new perspective of green technological innovation. Environ. Sci. Pollut. Res. 2022, 29, 53785–53800. [Google Scholar] [CrossRef]
  52. Huang, X.; Han, X.; Ge, P. Spatio-temporal evolution and influence mechanism of green total factor productivity in Belt and Road countries. Econ. Manag. 2017, 9, 6–19. (In Chinese) [Google Scholar] [CrossRef]
  53. Zhao, T.; Zhang, Z.; Liang, S.K. Digital economy, entrepreneurial activity and high-quality development—Empirical evidence from Chinese cities. Manag. World 2020, 10, 65–76. (In Chinese) [Google Scholar] [CrossRef]
  54. Jiao, M. Research on the Impact of Digital Economy on the Trade Position of High-End Manufac-Turing Industry. Master’s Thesis, Jiangsu University, Zhenjiang, China, 2020. Available online: https://kns-cnki-net.ez.zust.edu.cn/KCMS/detail/detail.aspx?dbname=CMFD202101&filename=1020759428.nh (accessed on 31 December 2022). (In Chinese).
  55. Li, T.; Han, D.; Ding, Y.; Shi, Z. How Does the Development of the Internet Affect Green Total Factor Productivity? Evidence From China. IEEE Access 2020, 8, 216477–216490. [Google Scholar] [CrossRef]
  56. Liu, Y.; Yang, Y.; Li, H.; Zhong, K. Digital economy development, industrial structure upgrading and green total factor productivity: Empirical evidence from China’s cities. Int. J. Environ. Res. Public Health 2022, 19, 2414. [Google Scholar] [CrossRef] [PubMed]
  57. Tian, Y.; Feng, C. The internal-structural effects of different types of environmental regulations on China’s green total-factor productivity. Energy Econ. 2022, 113, 106246. [Google Scholar] [CrossRef]
  58. Jin, W.; Gao, S.; Pan, S. Research on the impact mechanism of environmental regulation on green total factor productivity from the perspective of innovative human capital. Environ. Sci. Pollut. Res. 2023, 30, 352–370. [Google Scholar] [CrossRef]
  59. Lu, L.; Liu, Z.; Mohsin, M.; Zhang, C. Renewable energy, industrial upgradation, and import-export quality: Green finance and CO2 emission reduction nexus. Environ. Sci. Pollut. Res. 2023, 30, 13327–13341. [Google Scholar] [CrossRef]
  60. Yu, Y.; Yamaguchi, K.; Kittner, N. How do imports and exports affect green productivity? New evidence from partially linear functional-coefficient models. J. Environ. Manag. 2022, 308, 114422. [Google Scholar] [CrossRef] [PubMed]
  61. Su, J.; Su, K.; Wang, S. Does the digital economy promote industrial structural upgrading?—A test of mediating effects based on heterogeneous technological innovation. Sustainability 2021, 13, 10105. [Google Scholar] [CrossRef]
  62. Wei, L.; Hou, Y. Research on the impact of China’s digital economy on urban green development. J. Quant. Technol. Econ. 2022, 39, 60–79. [Google Scholar] [CrossRef]
Figure 1. The GTFP1 of the manufacturing industry and the GTFP2 of the whole industry from 2000 to 2022.
Sustainability 15 12841 g001
Figure 2. Trends in China’s digital economy from 2000 to 2022.
Sustainability 15 12841 g002
Figure 3. Manufacturing GTFP and the digitization in Chinese provinces.
Sustainability 15 12841 g003
Figure 4. Level of greening and digitization in 20 Asian countries along the Belt and Road.
Sustainability 15 12841 g004
Table 1. GTFP measurements for the Chinese manufacturing industry.
CategoryVariablesDescription
SInputsCapital factor inputsManufacturing fixed-asset investment
Labor factor inputsNumber of manufacturing employees by region
Energy factor inputsEstimated using the share of manufacturing sales output in the total industrial output of each region and the final industrial energy consumption.
Desired outputManufacturing sales value
Undesired outputManufacturing pollution emissions
Table 2. GTFP measurements for China by province.
CategoryVariablesDescription
InputsCapital factor inputsFixed-asset investment
Labor factor inputsNumber of employees by province
Energy factor inputsEnergy consumption by province
Desired outputGDP
Undesired outputsFour indicators, i.e., total industrial CO2 emissions, industrial SO2 emissions, industrial wastewater emissions, and general industrial waste, are used to build a comprehensive index of environmental pollution.
Table 3. The GTFP measurement system for the 20 Asian countries.
Type of IndicatorSelection of IndicatorIndicator Unit
Input typeCapital stock of the host countryUSD
Number of people in the workforce in the host countryper person
Desired outputGDP of the host countryUSD
Non-desired outputsCO2 emissions of the host countrykiloton
Table 4. Comprehensive development index for the digital economy in China.
Primary IndicatorsSecondary IndicatorsTertiary IndicatorsIndicator Attributes
Digital economy composite development indexInternet penetration rateInternet users per 100 people+
Number of internet-related employeesProportion of employees in computer services and software+
Internet-related outputsTotal telecom services per capita+
Number of mobile internet usersNumber of cell phone subscribers per 100 people+
Digital financial inclusion developmentChina digital inclusive finance index+
Table 5. Indicators and meanings of the digital economic level of the twenty other Asian countries.
First-Level IndicatorsSecondary IndicatorsTertiary IndicatorsIndicator Attribute
The level of development of the digital economies in countries along the Belt and Road in AsiaInformational infrastructureFixed telephone subscriptions (per 100 people)+
Fixed broadband subscriptions (per 100 people)+
Secure internet servers (per million people)+
Enrollment in higher education (% of total)+
Information technology outward competitivenessInformation and communication technology (ICT) product exports (% of total product exports)+
High-tech exports (as a percentage of manufactured exports)+
Share of exports (goods and services as a percentage of GDP)+
Table 6. Descriptive statistical analysis of each variable in Model (1) and Model (2).
VariableObsMeanStd. Dev.MinMax
GTFP13601.0020.2690.3101.925
GTFP23601.4320.3601.0133.628
de3600.2560.200−0.1220.895
is3600.2480.1640.07700.999
gov3600.001320.00403−0.01260.0639
en3600.0009930.00130−0.005470.00737
ino36043,37168,929228527,390
sca36083447484300.639,398
ed3600.01880.005520.007440.0389
tc3600.20847670.33−0.7456780.855014
Table 7. Descriptive statistical analysis of the variables in Model (3).
VariableObsMeanStd. Dev.MinMax
year22020143.16920092019
country22010.505.779120
GTFP32200.9780.09090.2811.286
de2200.2050.2200.009830.962
is22015.755.3713.88530.93
gov22026.479.4409.66051.19
en22055.6912.1019.0787.04
Table 8. Unit root test for each variable in Model (1).
IndicatorsLLCFisherADFHadri
GTFP−10.1822 *** (0.0000)20.4110 *** (0.0000)−3.3805 (0.9996)
de−0.5618 (0.2871)−2.5892 (0.9952)13.6611 *** (0.0000)
is−7.9787 *** (0.0000)8.6716 *** (0.0000)6.0772 *** (0.0000)
gov−4.3109 *** (0.0000)13.2759 *** (0.0000)15.7378 *** (0.0000)
en−3.5441 *** (0.0002)11.4044 *** (0.0000)15.2590 *** (0.0000)
ino−4.1721 *** (0.0000)−1.9335 (0.9734)15.7252 *** (0.0000)
sca−9.5329 *** (0.0000)12.5293 *** (0.0000)15.8806 *** (0.0000)
ed−7.5700 *** (0.0000)0.3405 (0.3667)19.2869 *** (0.0000)
Note: p values are in parentheses. *** p < 0.01.
Table 9. Comparative analysis of the regression results.
Model (1)Model (2)Model (3)
VARIABLES(1) GTFP1(2) GTFP1(3) GTFP2(4) GTFP2(5) GTFP3(6) GTFP3
de1.423 **1.900 ***4.522 *3.572 **−0.267−0.396 *
(0.619)(0.559)(2.341)(1.701)(0.180)(0.224)
is −0.132 −0.000828 −0.570 ***
(0.419) (0.423) (0.122)
gov −1.044 13.10 *** 0.068
(1.490) (3.332) (0.102)
en 18.15 * −2.817 −0.00003
(10.25) (13.00) (0.002)
ln(ino) 0.00612 −0.130 *** 0.241
(0.0515) (0.0383) (0.0288)
ln(sca) −0.189 *** −0.124 * 0.537 ***
(0.0482) (0.0713) (0.120)
Constant1.056 ***2.573 ***1.612 ***3.639 ***−0.0134−0.388
(0.0456)(0.503)(0.142)(0.549)(0.0496)(0.515)
Observations354354360360220220
Note: robust standard errors are given in parentheses. *** p < 0.01, ** p < 0.05, * p < 0.1.
Table 10. Lagging behind of the digital economy (period 2).
Model (1)Model (2)Model (3)
VARIABLESGTFP1GTFP2GTFP3
L2.de3.038 ***5.146 ***0.0276 *
(0.851)(0.514)(0.289)
Control variablesYESYESYES
Constant2.712 ***3.668 ***0.0731 ***
(0.672)(0.378)(0.622)
Observations300300200
Note: robust standard errors are given in parentheses. *** p < 0.01, * p < 0.1.
Table 11. Estimation results of the 2SLS method.
One-Step(1)Two-Step(2)
VARIABLESdeVARIABLESGTFP
is0.019de0.385 *
(0.063) (0.220)
gov7.489 ***is−0.136
(1.560) (0.0902)
en−21.400gov0.203
(10.422) (2.269)
ino8.34 × 10−7 ***en6.073
(1.22 × 10⁻⁷) (10.33)
sca−0.121 ***ino−4.11 × 10⁻⁸
(0.021) (2.57 × 10⁻⁷)
iv0.075 ***sca−0.0388 **
(0.011) (0.0184)
Constant0.533 ***Constant1.261 ***
(0.123) (0.152)
Observations346Observations346
Note: robust standard errors are given in parentheses. *** p < 0.01, ** p < 0.05, * p < 0.1.
Table 12. Threshold effect test.
Threshold VariableNumber of ThresholdsF Valuep ValueBootstrapCritical Value
1%5%10%
ed13.98 **0.09003003.80034.47103.8003
tc17.46 **0.03003005.47116.50715.4711
Note: ** p < 0.05.
Table 13. Estimation results of the threshold model.
Threshold Variableedtc
0b._cat#c.de0.205−0.460
(0.173)(0.287)
1._cat#c.de0.475 ***0.293 ***
(0.146)(0.108)
Control variablesYESYES
Constant0.9751.147 ***
(1.819)(0.111)
Observations360360
R-squared0.0460.046
Number of provinces3030
Note: robust standard errors are given in parentheses. *** p < 0.01.
Disclaimer/Publisher’s Note: The statements, opinions and data contained in all publications are solely those of the individual author(s) and contributor(s) and not of MDPI and/or the editor(s). MDPI and/or the editor(s) disclaim responsibility for any injury to people or property resulting from any ideas, methods, instructions or products referred to in the content.

