1. Introduction
Sustainable transport in protected areas is currently a very burning and debated issue [
1,
2]. These areas are specific in terms of the necessity to protect their unique and representative biodiversity [
3], and at the same time, due to their uniqueness, they are often overcrowded with visitors [
4]. One of the solutions to sustainable transport in protected areas is generally to restructure or regulate it [
5]. Restructuring here refers primarily to efforts to motivate visitors to use alternative modes of transport instead of individual car transport. Another option is the construction and management of visitor parking areas in locations where individual car traffic does not disturb the character of the countryside and, at the same time, the desired visitor destinations remain accessible. Finally, this includes building new trails for non-motorized transport [
6]. By traffic regulation, we mean primarily setting pricing policies for parking and entry into protected areas or various forms of restrictions on access to protected areas. One possible form of regulation is to allow entry into the area only with prior permission [
7]. This form of regulation is particularly appropriate in protected areas where it is necessary to provide access for key stakeholders (businesses, property owners in the area, emergency services, suppliers, nature protection officers, etc.). The usual way of issuing such permits in the Czech Republic is currently still a paper form with the vehicle identifier, its owner, and the time of validity of the permit [
8]. However, we are currently experiencing a relatively large development of technologies for alternative means of vehicle detection and identification [
9,
10,
11]. A common solution is vehicle detection together with license plate recognition [
12,
13,
14,
15].
The presented article describes the evaluation of the telematic system, which was pilot tested in the environment of the Krkonoše National Park (KRNAP). The design of the system was based on three basic technologies that complemented each other and were carried out according to the recommended procedure of the European FRAME architecture [
16]. From a functional point of view, the system relies on an electronic data integration platform where information on all issued permits will be stored. At the same time, every vehicle with a permit will be equipped with a Bluetooth token that must be permanently carried in the vehicle. This token will be linked to the vehicle license plate. The checkpoints are designed to detect the license plate and/or the token, which subsequently will be verified that the detected vehicle is registered in the permit database in the integration platform. For locations with a lack of power supply and poor data connection, a camera with motion detection instead of license plate recognition technology was designed. In order to put the system into real operation, the whole system needs to be highly reliable [
17]. The aim of the described research was to test the hypothesis that the proposed system can be used for traffic management in protected areas. Another objective was to determine the limits of the proposed system’s use in terms of the need to provide an alternative power supply or to deal with very poor signal coverage for the transmission of measured data, which is characteristic of a protected area [
18].
2. Materials and Methods
The method used for testing the system was the experiment method [
19,
20], which tested and evaluated the pilot operation of the proposed telematics system in a real environment. The pilot test was followed by a system design based on a previous identification of needs and analysis of available technologies initiated by Krkonoše National Park Management [
21]. The pilot test was subsequently carried out with its support.
The basic function of the system is the ability to detect the passage of different types of vehicles by recognizing their license plates and/or detecting the Bluetooth token and then checking the legitimacy of their movement in each location thanks to access to an electronic database in the integration data platform. Furthermore, the system includes technological elements for data communication and online transmission of measured data. The technologies were selected according to the expected implementation environment. This resulted in two technology designs that were tested in different locations. These are the so-called fixed and mobile points.
A fixed point is characterized as a location that is in an area where electricity is available and where there is a good data connection. In protected areas, these are the main locations at the entrances to (exits from) these areas, usually close to amenities or with reduced protection priority. For the purposes of pilot testing, the field base “Karlštejn” of the KRNAP Management was chosen as a fixed point. The Karlštejn cottage is located close to the mountain road at a distance of less than 2 km from the village of Strážné, 600 m from the border of the entrance-restricted area, and at an altitude of less than 780 m above sea level (50.6774356 N, 15.6231311 E). The block diagram and an example of the installation are shown in
Figure 1.
The mobile point is designed for locations in areas with no access to electricity, so it can be placed almost anywhere, including in strictly protected areas. An alternative power supply is necessary; in the case of the test, a hydrogen cell in combination with a capacitive battery was used. There may be limited data connectivity at the site, but minimum availability is required. For the pilot testing, the location of the mobile point was chosen at the road in the direction of Zadní Rennerovky at the turn-off to Grohmanova bouda, approximately 7 km from the village of Strážné, at an altitude of 1250 m above sea level (50.6975280 N, 15.6599170 E). A block diagram and an example of the installation at the mobile point are shown in
Figure 2.
Bluetooth token detection technology (BLE scanner) has been tested at both fixed and mobile point locations. In the future, the tokens will be provided to drivers of vehicles with permission to enter protected areas. The license plate recognition camera technology was tested at the fixed point location only. In the location of the mobile point, the camera technology with motion detection with image recording, which is less energy intensive than the license plate recognition technology, was tested as another option.
At both points, the transfer of measured parameters in real-time to the integration data platform was also tested, allowing remote access to the data.
The experiment at both points of measurement consisted of two basic approaches to testing. The first is an analysis of the system based on data collected by online transmission from the measurement sites, where the quality and availability of data from selected months in 2022 were evaluated. The second method is on-site testing, i.e., through a multi-day traffic survey directly at the locations of the installed technologies in July 2022.
The overall evaluation of the pilot operation of the installed system and its applicability for traffic management in protected areas was carried out following the set partial research objectives. These objectives were as follows:
Verification of the reliability of license plate recognition;
Verification of the reliability of Bluetooth token detection;
Verification of the reliability of the camera with motion detection;
Verification of the reliability of the system as a whole;
Verification of the energy consumption of the technologies at the mobile point;
Determination of system limits and reflection of these limits into recommendations for further system installations.
2.1. Verification of the Reliability of License Plate Recognition
Verification of the reliability of license plate recognition was carried out by several tests.
The basis was a test of the reliability of license plate recognition by both cameras on fixed points under normal conditions in normal operation. The test was carried out continuously during the implementation of the on-site testing. The aim was to determine the proportion of vehicles that the fixed point cameras were able to recognize and display the information in the integration platform and vehicles that were not recognized by the system. For the purpose of the test, manual recording of license plates in both directions was used in combination with camera recording for the purpose of parallel recognition of license plates in the available software in order to eliminate the inaccuracies of the manual recording. For this purpose, the research team’s additional camera was used. The manual recording was then completely transcribed into an MS Excel spreadsheet. If the worker was unable to record a precise license plate number for operational reasons but at least recorded the information that the vehicle had passed, the license plate was subsequently traced on the record and added to the file. Those license plates that the worker managed to write down were also checked by means of the video recording. A final file was created in which no errors should occur at all, and this was then compared with the tested output generated from the integration platform.
Additionally, a test of the reliability of license plate recognition at different vehicle speeds in daylight was performed. The aim was to assess the effect of the speed of the recognized vehicle on the recognition results. The testing was repeated for speeds of 30 km/h, 40 km/h, 50 km/h, 60 km/h, and more with the assumption of safe driving. The tested object/vehicle, and therefore the license plate, remained the same. Two passenger vehicles and one four-wheeler (hereafter ATV = all-terrain vehicle) were used for the test. Other vehicle types of interest in terms of verifying the range of functions of the system are motorcycles, scooters, and snow cats. These vehicles, as well as the ATV, are rather complementary, and then only ATV is covered in the test. The main reason for this is the lack of sufficient samples of other mentioned types. The on-site analysis was carried out by manually recording the result of each measurement and by recording the time and information on whether the license plate was successfully detected or not.
2.2. Verification of the Reliability of Bluetooth Token Detection
Four types of tests were performed to verify the Bluetooth detection system’s quality. Tests were performed at both fixed and mobile points; in the
Section 3 are commented in detail results from fixed points. The objective of the tests was to determine the reliability of Bluetooth detection of a token placed in a passing vehicle. The dependence on the vehicle type, speed of travel, and the location of the token in the vehicle was tested.
The first test consisted of ATV passes at different speeds. A token was placed in the breast pocket of the driver. The speeds tested were 30, 40, and 50 km/h in both directions and the maximum possible speed while maintaining driving safety (i.e., 63 km/h and 67 km/h).
The second test consisted of passenger car passes at different speeds. A token was placed in the glove compartment, on the dashboard, and in the trunk. All token storage options were tested at speeds of 30, 40, and 50 km/h in both directions and at the maximum possible speed while maintaining driving safety (i.e., 60–80 km/h).
The third test consisted of driving two passenger cars behind each other and a token on the dashboard. The speeds of 30 and 40 km/h in both directions and two distances of mutual separation between the vehicles, normal separation, and minimum separation while maintaining driving safety were tested.
The last test consisted of driving two cars against each other and a token on the dashboard. The detection capability was tested in the case of two oncoming vehicles passing each other.
2.3. Verification of the Reliability of the Camera with Motion Detection
The camera with motion detection was installed only at the mobile point due to its lower energy consumption than the license plate recognition cameras commented above. The on-site test aimed to determine whether the motion detection camera could record the complete image of the vehicle at different driving speeds.
2.4. Verification of the Reliability of the System as a Whole
The reliability of the system in this context means the reliability of the operation of the camera with license plate recognition (fixed point) and token detection (fixed and mobile point). Reliability was evaluated using continuous online testing using data from the integration platform. Due to the absence of direct values reflecting the reliability of the system (e.g., device operational logs), the existence of at least one record on each measurement day was chosen as a basic assumption. This can be derived from the total number of detections on the measurement days, where one record was chosen as a sufficient margin relative to the daily number of records. For this reason, 1 day was set as the smallest time unit. The above procedure allows us to determine the number of days in which the detector or subsystem operated in terms of at least one event detection. The reliability of a detection subsystem is equal to the number of days that the subsystem was in operation relative to all days of measurement. This can be expressed as a percentage for better illustration.
2.5. Verification of the Energy Consumption of the Technologies
The power consumption was tested online at the mobile point, where the system was operating in isolated mode (without the possibility of an external power supply). For this reason, a hydrogen cell with an electrical power of about 10 W was installed together with a powerful LiPol battery with a capacity of 250 Ah. The average power consumption of the technology was 15 W. The power source was monitored in relation to the activated technological peripherals (the waveform of the power supply voltage drop; the value of the power supply voltage was transmitted to the integration platform and recorded from which it was possible to determine the function of the hydrogen cell).
2.6. Determination of System Limits and Reflection of These Limits into Recommendations for Further System Installations
The limits of the considered system were determined based on the evaluation of all the partial tests presented in the previous text of this chapter. Recommendations for further installations and use of the system were formulated, including recommendations for the individual tested technologies.
3. Results
In this section, all important results from the experimental testing can be found in a structure corresponding to the proposed partial objectives of the testing.
3.1. Verification of the Reliability of License Plate Recognition
This test was performed at the fixed point. The reliability of both cameras—camera A (direction from the mountains) and camera B (direction to the mountains)—was evaluated separately and then cumulatively for both cameras together. During the verification period, a verification manual recording of the license plates in both directions was performed in combination with the camera recording. The output of the verification survey was a complete list of license plates that passed through the measurement profile.
The evaluation can be seen in
Table 1—camera A evaluation in the left part of the table, camera B evaluation in the middle part, and summary evaluation in the right part. The evaluation shows that camera A correctly detects the license plate in almost 89% of the vehicle passes through the measurement profile. The reliability of correct number plate detection is slightly higher, namely 91%, if we consider only passing vehicles that the camera is able to detect due to its technical capabilities (i.e., the vehicle has a number plate placed in the camera’s frame). According to the evaluated data, camera B correctly detects the license plate in 87% of all vehicle passes. After excluding vehicles that the camera is not able to detect due to its technical capabilities, the reliability rises to 90%. A comparison of the reliability of the two cameras shows that camera A has a slightly higher reliability in correctly detecting license plates. This is influenced by the fact that camera A detects and recognizes the license plate two to three times each time the vehicle passes. Therefore, if one of the license plate recordings is incorrect, there are usually two alternative license plate recordings that are correct. On the other hand, camera B in the vast majority of cases, records and recognizes the license plate only once, so it does not provide an alternative in case of an incorrect recognition.
The reliability of license plate recognition at different speeds was tested with the test car and an ATV. In the passenger car case, it was found that the detection and recognition capability did not depend on the speed or direction of the vehicle. Camera A was able to detect the vehicle and correctly recognize the license plate in all cases, noting that it produced mostly three records with the detected license plate in each pass, and in some cases, one of these three records was incorrect. Camera B was able to detect the vehicle in all cases; however, it failed to recognize the license plate in one case. This was during a test run at 30 km/h, so no conclusions can be drawn about the dependence of the recognition on the vehicle speed. In the case of the ATV, it should be noted that the test ATV had the license plate in the usual ATV arrangement, i.e., only at the rear. It follows that, given the technical possibilities of the cameras installed, only one camera was able to detect the passage at one time. In the case of driving in the direction A to B, it was camera B. In the case of driving in the direction B to A, it was camera A. The testing showed that camera A was able to detect the passage of the ATV with high reliability, as well as correctly recognize the license plate. During the testing, camera A showed 100% reliability. On the other hand, Camera B was not able to detect any of the passages, hence not able to recognize the license plate correctly. This is probably due to the different distribution of characters on the ATV license plate (the specific distribution of ATV license plate characters can be seen in
Figure 3). The dependence on the driving speed was not shown for either camera A or camera B.
3.2. Verification of the Reliability of Bluetooth Token Detection
The reliability of token detection was verified using several tests at both fixed and mobile points. The results of fixed point tests are commented on in detail below.
The first test consisted of driving an ATV at different speeds with the token in the driver’s breast pocket. The token detection was always successful, so it can be concluded that the speed of passage does not affect the reliability of token detection, although the number of token detections during the test was shown to be dependent on the speed of passage. When passing at 30 km/h, the token was detected up to seven times, and when passing at the maximum speed “only” three times.
The second test was driving a passenger car at different speeds, token in the glove compartment, on the dashboard, and in the trunk. The result of the testing showed the same dependence of the number of captured records on the driving speed as in the ATV testing. It also showed a dependency on the way the token is placed in the vehicle, which is related to the specific design of the vehicle. Placing the token on the dashboard and in the trunk gave similar results; detection, in this case, was reliable. At a speed of 30 km/h, the token was detected six to eight times per pass and at a maximum speed three to four times, which is still sufficient. When the token was placed in the glove compartment, token detection was reliable at lower speeds; at speeds of 50 km/h and above, detection could no longer be considered reliable. It should be noted, however, that the test vehicle had a strong glove compartment design. In general, based on the test results, it can be recommended that the token should be placed in the vehicle in such a way that the vehicle structure cannot be an obstacle to its detection (Faraday cage). The recommendation is to place the token on the dashboard behind the windshield.
The third test was driving two passenger cars behind each other, the token on the dashboard (optimal location for detection). The result of the testing showed that the detection of the token of the first vehicle was reliable; the token was detected in all cases, and no dependency on the passing speed or the distance between vehicles was shown. The average number of token detections per pass was six, and the minimum number was three. The token detection of the second vehicle cannot be considered completely reliable according to the test results; in the case of a longer distance, the token was detected on average 1.5 times per pass. In the case of a shorter distance, it was 2.5 times. In the longer spacing, in one case, the token was not detected at all, which may be due to a random failure, and no conclusions can be drawn from this, given the small number of measurements. The dependence on the passage speed was not proven.
The last test was driving two cars against each other, with a token on the dashboard (optimal detection location). The test resulted in successful token detection in all cases.
3.3. Verification of the Camera with Motion Detection
In the evaluation of the reliability of the camera with motion detection, it was concluded that the detection capability itself is independent of the speed of passage. However, the ability to capture the vehicle in the image is dependent on the speed. In this sense, vehicles with lower speeds have higher detection reliability. As the speed increases, the ability of the camera to record the vehicle declines; at higher speeds, the vehicle may not be captured at all, as can be seen below in
Figure 4 for a speed of 40 km/h. Testing showed a limit speed of 30 km/h. It has been verified that it also depends on the direction of travel of the vehicle and the associated image area occupied by the vehicle on the camera. Specifically, it depends on the factor whether the vehicle is moving away from the camera or coming toward the camera. Higher reliability has been demonstrated for vehicles driving away from the camera.
3.4. Verification of the Reliability of the System as a Whole
The reliability of the system was assessed based on the available data from the integration platform during 2022.
The evaluation of the data from the fixed-point cameras with license plate recognition showed a total of 32,399 records. A display of these records by day for the entire period in which data were available is shown in
Figure 5 below.
From the point of view of the reliability of the detectors installed at the fixed point, or more precisely whole detection set, the days of 7 and 8 September are interesting, when only 66 vehicles were recorded on the first day, with an average daily value of 289 records. On the second day, no vehicles were recorded. This suggests that there was a prolonged loss of service on these days. The exact cause has not been traced, but the following possibilities are suggested: failure of the integration platform (or misconfiguration—the system was under continuous development), connectivity failure, or power failure. If we consider a resolution of one day, the failure occurred in two days out of 111 testing days, resulting in a high-reliability rate of 98.2% (at the given time resolution).
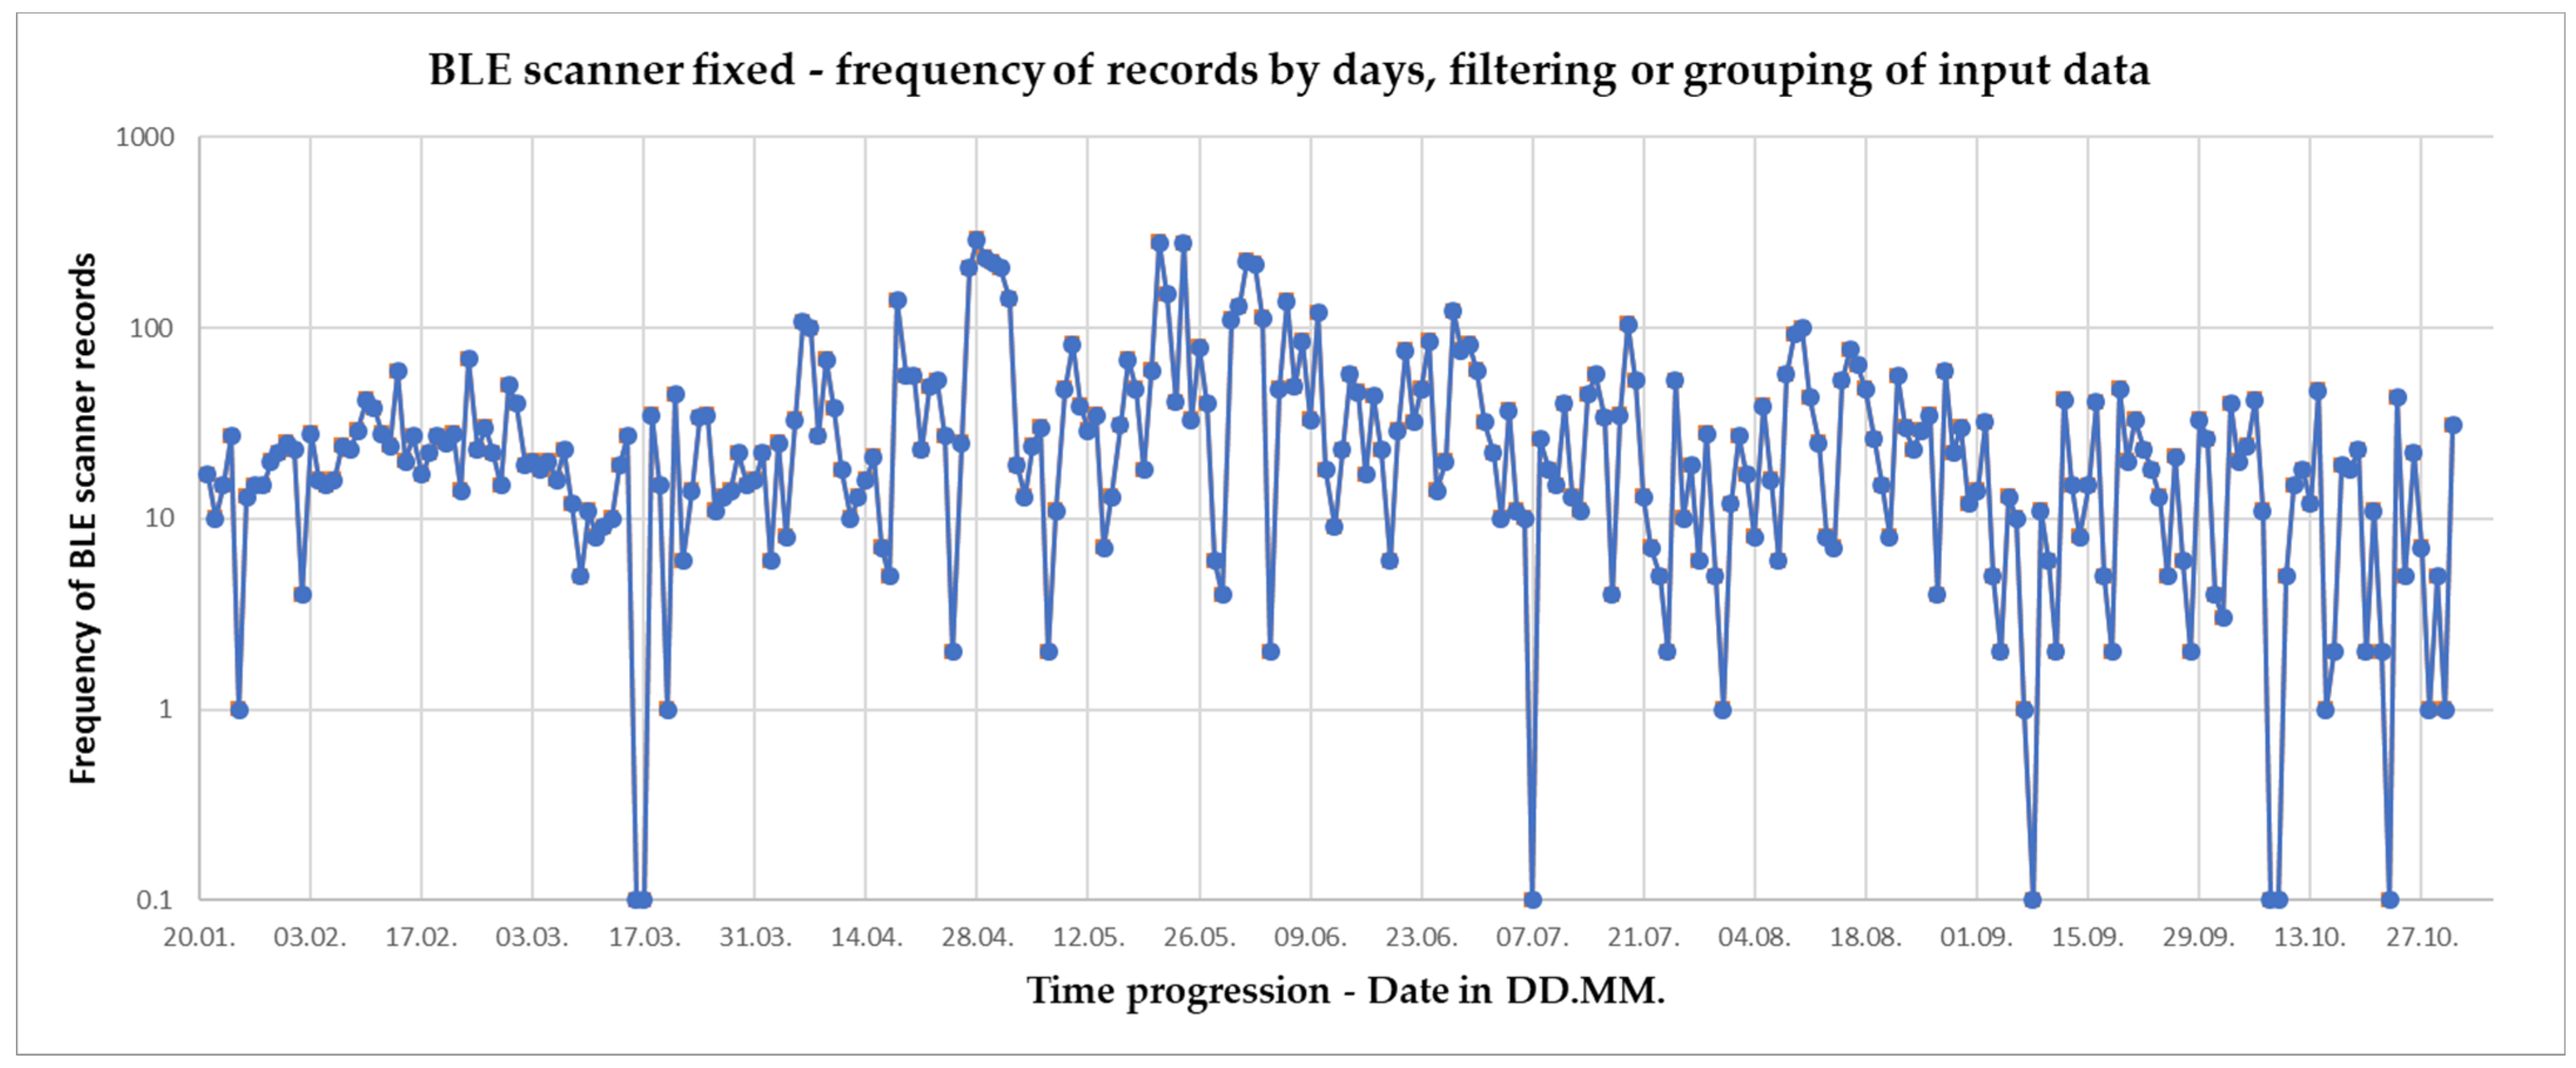
The evaluation of the data from the BLE scanner at the fixed point showed that a total of 10,050 records (after filtering—clustering—performed within the platform) were obtained from the integration platform over the entire measurement period. The filtering was used to reduce many times larger number of records (detection was performed with an interval of about 1 s, and if the token was close to the detector, it was continuously detected, resulting in a high number of records).
Figure 6 displays the records by day for the period under study when the data were available. Due to the dynamic nature of the data, a logarithmic scale was used.
From the point of view of the reliability of the BLE scanner at the fixed point, or more precisely of the whole detection set, the following days are interesting: 16–17 March, 7 July, 8 September, 8–9 October, and 23 October, when no token was detected for the whole day. On 25.1, 20.3, 31.7, 7.9, 15.10, and 28–30.10, only one token was recorded. This suggests that there was probably a prolonged service outage on these days. This was confirmed by the days 7 and 8 September, when the problem was also identified in the data from the cameras with license plate recognition (see above). Again, the possibilities are integration platform failure, connectivity failure, or power failure. The reliability rate, when including days with zero detected tokens (7 out of 277 measurement days), comes out to 97.5% (at a given temporal resolution). It should be noted that the median is based on only 22 detections/day, so the probability of zero detections on a given day is not negligible (some of the days listed above may indeed have had no token near the BLE scanner), so this is a rough estimate.
From the point of view of the reliability of the BLE scanner at the mobile point,
Figure 7 below contains a token detection graph—binary yes/no on each day according to the existence of at least one token record on that day.
The BLE scanner sent at least one token per day on a total of 64 days out of 109 in the period 10 June–26 September, giving overall reliability of the Bluetooth token detection subsystem of only around 58%. Apart from the theoretical possibility of zero token captures on a given day, the days with zero captures were due to a failure caused by insufficient supply voltage. The outage between 30 June and 18 July was caused by an inappropriate setting of the Bluetooth detection server, which switched off when it dropped below 11 V. In the period after 10 September, the outages were then caused by the disconnector function. For more details, see paragraph 3.5 below. Based on these findings, it can be assumed that the overall reliability of Bluetooth token detection will be high under the assumption of a reliable power supply.
3.5. Verification of the Energy Consumption of the Technologies
The energy consumption of the technology was tested at the mobile point. The biggest problems were with the power supply of the system operating in isolated mode. The power supply voltage waveform obtained from the integration platform is shown in the following
Figure 8. When compared with
Figure 7 in the previous paragraph, the correlation of voltage drop with token detection failures can be clearly seen.
The voltage data outage in the period after 10 September was caused by the function of the disconnector. The disconnector, in order to protect the power batteries, disconnected them when the voltage dropped below about 10.5 V. Prior to that date, the disconnector did not work properly or did not disconnect the batteries when the voltage dropped.
The general problems with the power supply were caused by initial complications with the operation of the hydrogen cell. If the cell was working, the system was able to function independently (without the need to recharge the batteries or refill the hydrogen) for over 4 weeks. On battery power alone, the system operated for approximately 1 week. If these batteries were not recharged in time, the system would stop working.
3.6. Determination of System Limits and Reflection of These Limits into Recommendations for Further System Installations
Based on the tests performed, the basic recommendation is that the tested system as a whole is suitable for installation and use in protected areas. At the same time, certain limitations must be considered. The main limitations relate to the power supply, where suitable alternatives need to be further tested and verified to provide year-round power to the technology at the mobile point. The situation is similar for data connectivity, which is particularly critical in terms of using the system to penalize unauthorized entries. This implies higher demands on the quality of measured and transmitted data, especially image records.
Recommendations for the sub-tested technologies are mainly related to their location in relation to the monitored communication. In the case of cameras (especially license plate recognition cameras), it is advisable to ensure an optimal angle of view. For BLE scanners, the overall distribution of road infrastructure within the detection range should be considered so that token detections occur only in the desired road section. An important prerequisite for successful token detection is the appropriate positioning of the token in the vehicle.
The limits and recommendations are discussed in more detail in the following discussion section of the paper.
4. Discussion
As part of the quality verification of the license plate recognition subsystem, it was determined that the installed fixed point cameras show high reliability of almost above 95% when using two cameras and 90% when using one camera. The reliability values are absolutely sufficient for systems of similar type, as also evidenced by publications focusing on tests by other authors [
22,
23,
24,
25]. In general, it is advisable to place the cameras with license plate detection as close as possible to the communication. It is worthwhile to use a design feature leading to an improvement of the reading cone as far as possible into the longitudinal axis of the communication, which can improve the image quality and, thus, the reliability of correct license plate recognition [
26,
27,
28,
29,
30]. Vehicles that were not recognized in normal traffic were usually influenced by some specific feature (e.g., a very dirty license plate, a tractor with a cart with a license plate in a non-standard location, a different license plate format), only in units of cases the standard license plate was not recognized. For ATVs, the detection reliability is significantly lower due to the different distribution of characters on the license plate and the different positions and slopes of the license plate on the ATV. In the test drives, one of the cameras showed 100% detection reliability, while the other camera did not detect ATVs at all, indicating a practical problem with the detection software that should be addressed depending on the target use in protected areas. The test drives showed that the effect of speed on correct license plate detection is minimal.
As part of the Bluetooth detection quality verification, token detection was shown to be highly reliable up to 50 km/h (with suitable placement of the token within the vehicle) at both fixed and mobile measurement points. The best location of the token in the vehicle was on the dashboard behind the windshield of the vehicle. The quality of detection is also dependent on the traffic infrastructure. If the detection point is located at a road crossing or if there are other roads near the detection point, the token may be inadvertently detected on a road where the measurement is not taking place due to the omnidirectional propagation of the radio signal. Testing has shown that when a vehicle with a token is driven on a nearby unmeasured road, the token can be detected up to a non-negligible distance. Therefore, the recommendation is to consider a suitable location for the detection point [
31,
32]. Testing also suggests the recommendation not to stop a vehicle with a token near a BLE scanner due to scanner flooding and the associated reduction in the reliability of detecting other tokens in vehicles. Unknown ID detection mode (e.g., mobile phones, smart watches, radios, etc.) was not tested.
As part of the quality verification of the camera with motion detection subsystem, it has been verified that the camera is able to detect a passing vehicle without depending on the speed of the vehicle. However, it is only able to reliably produce an image of a passing vehicle when driving at lower speeds—the testing resulted in a threshold speed of 30 km/h. Due to the fact that it does not allow vehicles to be uniquely identified (e.g., by recognizing the license plate), its use in the whole tested system, whose purpose is to regulate the entry of vehicles into protected areas based on a database of entry permits, is rather complementary. The camera with motion detection is designed to provide a framework for verifying the presence and number of passing vehicles at the mobile point.
Within the verification of the reliability of the system operation as a whole, it was found that the reliability rate of the operation of the set of two cameras with license plate recognition, communication network, and data integration platform is very high—98.2%. The reliability rate of operation of Bluetooth token detection from the testing comes out very high for the fixed point with power supply provided—97.5%. In contrast, the Bluetooth detection reliability rate for the mobile point was only 58%; this can be attributed to the low reliability of the power system used (hydrogen cell combined with a capacitive battery). Therefore, it seems essential to find a good and stable power supply for the mobile point. It can be assumed that with such a power supply, the reliability of the Bluetooth detection operation on the mobile and fixed point would reach similar values.
In terms of energy consumption, it was concluded that hydrogen-based fuel cell technology appears promising at first glance in terms of energy, as research has pointed out in other projects [
33]. The specific test case involved running for 4 weeks with one 50 L hydrogen bottle combined with a powerful 250 Ah LiPol battery. Unfortunately, the test operation showed that this is a sensitive and not yet sufficiently debugged and tested technology due to high failure rates and limits at low temperatures—in particular, condensation and freezing of water in the fuel cell case, as well as a decrease in battery capacity with temperature, incl. reaching the threshold temperature. Therefore, for these reasons, without additional measures, hydrogen-based fuel cell technology is not suitable for the year-round power supply of a mobile set in protected area conditions. No alternative power supply technology has been found that would provide an unattended solution to power the isolated system of the mobile set in the environment.
For using the system for traffic management in protected areas, a major data connectivity issue at the mobile point emerged from testing. If camera technology is used or transmission of images that are required as evidence of a violation (mere token detection is not sufficient), IoT cannot be used, but a broadband network (LTE or 5G) is required, which is a difficult problem to solve in remote locations in the protected area.
In the near future, the plan is to build more test points with a preference for electricity connections. The aim will be to test and verify the reliability of other available technologies on the market.


 ,
, 


