Article

Business IT Alignment Impact on Corporate Sustainability

Faculty of Economics and Business, University of Maribor, 2000 Maribor, Slovenia
*
Author to whom correspondence should be addressed.
Sustainability 2023, 15(16), 12519; https://doi.org/10.3390/su151612519
Submission received: 22 July 2023 / Revised: 9 August 2023 / Accepted: 16 August 2023 / Published: 17 August 2023

Abstract

:
Business–IT alignment (BITA) has become crucial for effective organisational management in today’s interconnected global economy. This article investigates the relationship between BITA and corporate sustainability, exploring how businesses can leverage BITA for sustainable growth and development. The study employs a case research approach in a multinational manufacturing organisation, utilising a mixed methods research (MMR) design. In the quantitative part of the research, the PLS-SEM technique was used to examine the influence of six BITA factors on employees’ self-perceived action competence for sustainability (SPACS). This study confirmed that all six BITA factors strongly influence all three SPACS factors. In the qualitative part of the research, semi-structured interviews were used to measure the BITA maturity level of the organisation and the influence of BITA factors on corporate sustainability. Based on quantitative and qualitative research results, it can be confirmed that BITA strongly influences corporate sustainability. Results also confirm that there is no universal approach to BITA and its influence on corporate sustainability. Organisations must focus on all factors of BITA equally to achieve better levels of BITA and ensure its influence on corporate sustainability.

1. Introduction

As the lines between technology and business blur in our increasingly interconnected global economy, business–IT alignment (BITA) has become crucial to effective organisational management. BITA, which refers to the alignment between an organisation’s business objectives and its IT infrastructure, is no longer a matter of mere convenience. Authors Chan and Reich [1], Aversano et al. [2], Silvius et al. [3], Luftman et al. [4], and Yang [5] pointed out that today it is a critical success factor in enterprises’ strategic operations and competitive advantage. Jonathan et al. [6] further exposed that effective alignment between business and IT also improves the value derived from digital transformation projects and helps organisations to achieve long-term sustainability. Tal Ben-Zvi and Luftman [7] argue that mature alignment is needed if companies want IT to change the business. Mature alignment is correlated with organisational success and, as such, is important target of modern organisations, as noted by Panda [8]. The growing significance of IT in business can be attributed to several factors that have transformed how companies operate and compete in the modern business landscape, such as digital transformation, data-driven decision-making, operational efficiency, e-commerce, improved customer experience, innovation, remote work, flexibility, etc. Feroz et al. [9] exposed that technologies, such as artificial intelligence (AI), big data, internet of things (IoT), cloud computing, and mobile technologies, enable organisations to transform sustainability areas such as environmental sustainability in areas such as pollution control, waste management, sustainable production, etc.
However, achieving true BITA is far from straightforward, with many organisations facing many challenges and complexities. From rapidly evolving technology landscapes and shifting market demands to the persistent communication gaps between IT and business stakeholders, BITA demands a holistic, forward-thinking, and adaptable approach.
Chan and Reich [1] and Aversano et al. [2] exposed that even the best-planned strategies can fail due to poor communication, lack of alignment (e.g., when the business strategy has a goal other than the IT strategy), and lack of support at all company levels. Additionally, the organisation’s information systems (IS) often fail to align with the business objectives. Kyriazoglou [10,11] wrote that these factors drive organisation management to establish increasingly extensive and more effective business controls in various areas of the organisation, including enterprise management, risk management, administration, enterprise architecture, strategy, finance, IT, sales, and so on.
Luftman et al. [4] pointed out several persisting issues in the research on IT alignment. Firstly, many alignment models portray alignment as a stagnant relationship instead of examining the range and changes in actions that can be used to achieve alignment. Secondly, these models often lack robust theoretical underpinnings. Lastly, due to their static perspective, such models offer limited guidance on how organisations can enhance their alignment. Chan and Reich [1] emphasised that despite significant research on BITA, several challenges still relate to two areas. The first area is the alignment of IT strategy with business strategy as a continuous process that requires specific management capabilities in IT and involves specific actions and reactions, exhibiting patterns over a certain period. The second area focuses on the final state, emphasising BITA’s previous activities, measures, and outcomes. Breakthrough technologies in connection with digital transformation, as well as global influences such as sustainability and environmental issues, are important for organisations in the BITA field today.
In recent years, the concept of corporate sustainability has gained significant importance. On this basis, the following research question was proposed: “Does BITA influence corporate sustainability?”
Beyond being just a buzzword, corporate sustainability represents an organisation’s commitment to operating in socially responsible way, contributing to economic progress while upgrading the quality of life for its workers, their families, and the wider community. Ashrafi et al. [12] pointed out that corporate sustainability encompasses various activities aiming to reduce environmental impact, promote social justice, and ensure long-term economic viability. When strategically aligned with a business’s objectives, we think that IT can drive sustainable practices and values across the organisation. For instance, advanced IT solutions can track, analyse, and reduce an organisation’s carbon footprint, contributing to environmental sustainability goals. Digital tools can streamline business operations, reduce waste, and foster economic sustainability. Furthermore, IT can significantly improve transparency, promote ethical business practices, and contribute to social sustainability.
This article explores more profoundly the relationship between BITA and corporate sustainability. How these concepts intersect and how organisations can leverage IT alignment for sustainable growth and development have been studied. To fulfil the goal of this research, case research using mixed methods research (MMR) in a multinational manufacturing organisation was used.
In the subsequent part of the article, Section 2 will focus on BITA, whereby the bibliometric analysis of BITA was performed and its connection with corporate sustainability was explained to make the scope of BITA easier to understand. Section 3 will explain the case study approach using mixed methods research (MMR), including the research model and the research procedure. Section 4 presents quantitative and qualitative research results for a multinational manufacturing organisation. Following this, there is a section for discussion and the conclusion.

2. Materials and Methods

2.1. Business–IT Alignment

Business–IT alignment (BITA), also known as strategic alignment, is a process that ensures an organisation’s technology resources, capabilities, and investments are in harmony with its business strategies, goals, and needs [1]. Luftman and Brier [13] pointed out that BITA refers to the coordinated efforts undertaken by management to ensure that IT objectives align with the functional goals of various departments within organisations, such as marketing, finance, and production. BITA aims to align IT with the overall business objectives and vice versa.
Numerous studies have shown that organisations that achieve successful alignment between these areas tend to outperform counterparts that lack alignment [14,15,16]. Consequently, aligning IT strategy with business strategy has become one of the most significant challenges for IT professionals and executives [17]. The BITA concept is associated with several synonymous terms, such as ‘integration’ [18], ‘fit’ [19], ‘harmony’ [13], ‘fusion’ [20], and ‘linkage’ [21]. Regardless of the terminology used, literature has emphasised the significance of BITA for developing core competencies within an organisation [22,23].
Over thirty years of research on BITA highlight the practical value of aligning both strategies, as they directly impact an organisation’s performance. Earlier studies focussed on comparing the business plan and IT plan. Then, research was directed to examine the relationship between business strategy and IT strategy and the fit between business needs and the priorities of IT [1]. Some researchers argue that alignment may not always be desirable. They present various arguments, such as research being mechanistic and not representing the real world [24], the impossibility of alignment when the business strategy is undefined or in the process of definition [25], the lack of fit being a desired outcome as business operations must continuously adapt, and the need for IT to be an integral part of changing the approach to business rather than merely pursuing it [26]. Moreover, if alignment is too tight and the business environment suddenly changes, organisations can have problems adjusting to a new environment [24]. Other arguments found in the literature are that IT has to challenge businesses, not simply implement its vision; aligning an IT plan with a business plan can deliver a competitive advance, and the opposite can result in losses [26,27].
Sauer and Burn [28] caution that alignment can lead to problematic situations requiring careful management to prevent unnecessary IT and business costs. They identify three types of undesired results that can arise from strategic alignment: (i) misalignment, where an organisation tries to align IT with internally inconsistent business strategies; (ii) IT stagnation, which happens as part of a common, practically inevitable, cycle of innovation in IT; and (iii) globalisation, which poses unique challenges in terms of cultural and scale compatibility for alignment. If IT researchers deliver papers advocating for high alignment in these challenging and possibly problematic scenarios, they are not serving the best interests of practitioners.
Luftman and Brier [13] emphasise that several factors are crucial for a successful BITA. These factors include strong senior management support, effective prioritisation, fostering positive working relationships, building trust, promoting effective communication, and developing a comprehensive understanding of the business environment. The authors also exposed enablers and inhibitors of alignment and divided them into two groups based on control: (i) IT participation in strategy development and senior executive support are under the control of the business, while (ii) project priority, IT knowledge of business, and IT leadership are in the control of IT.
BITA factors can be categorised as background and foreground antecedents. Examples of background antecedents are common domain knowledge (between IT and business), IT project implementation success, communication between business and IT, and a connection between business and IT planning [1,29]. Factors such as strong leadership, the relationship between CEO and CIO, a formalised strategic business plan, and clearly defined business goals [25,30,31,32] are categorised as foreground antecedents. Communication is another important antecedent to alignment, often associated with understanding. Efficient communication plays a vital role in reaching alignment between business and IT. It is essential for fostering understanding, collaboration, and shared goals. Organisations should prioritise regular and pervasive communication, employing various channels and methods to facilitate effective communication between stakeholders involved in the alignment process [29,33,34].
In every organisation, individual business functions or units must collaborate and support the vision and business goals of the entire organisation. The IT department is no exception, as it provides services and products to internal customers. Davenport and Short [35] state that organisations aiming to optimise their operations should undergo business process redesign (BPR) by incorporating IT capabilities. The effects of this approach have been significant in most cases. Preferably, alignment should be present at all levels of the organisation: organisational, system [33,36], project [37], and individual level [38]. The absence of alignment can lead to challenges in implementing information solutions or platforms. Formal strategies are typically applied at higher levels of the organisation, while the execution occurs at lower levels. Alignment at lower levels of the organisation enables the translation of business goals into individual goals [29].
To address alignment comprehensively and accurately, ways to measure the level of alignment are needed. The literature on management information systems mentions various approaches to addressing alignment, such as typologies and taxonomies, alignment models, questionnaires, mathematical models, qualitative methods, etc. [1].
The first comprehensive alignment models emerged in the early 1990s. One of the early models is the MIT Model [39]. According to the MIT model, investments in IT are “rewarded” if the key elements of strategy, structure, technology, process management, individuals, and roles are aligned. Building upon the MIT model, Henderson and Venkatraman [40] developed the Strategic Alignment Model (SAM), the most used alignment model. The SAM model distinguishes four key domains: (i) business strategy, (ii) organisational processes and infrastructure, (iii) IT strategy, and (iv) processes and IT infrastructure. The SAM distinguishes between two IT perspectives: the external perspective, which refers to IT strategy, and the internal perspective, which refers to IT infrastructure and processes. This differentiation allows for a comprehensive understanding of the alignment between business strategy and IT by considering the strategic aspects of IT and its operational implementation within the organisation. The external perspective focuses on how IT strategy aligns with the overall business strategy. In contrast, the internal perspective examines the alignment between the organisation’s IT infrastructure and processes and the strategic goals and needs of the business.
Luftman [41,42,43] extended the SAM model and developed the Strategic Alignment Maturity Model (SAMM) and its associated measurement model. SAMM operationalises the conceptual framework of Henderson and Venkatraman [40]. The organisation’s current level of alignment maturity can be measured using the following six building blocks:
  • Communication: how IT and business staff understand each other and communicate.
  • Value measurement: how organisations measure their performance and the value of projects, evaluate projects, and improve internal projects and processes based on results.
  • Governance: whether projects are aligned and supporting business strategy, and whether IT projects have measurable outcomes.
  • Partnership: whether there is a true partnership based on mutual trust, and whether partners share risks and rewards.
  • Scope and architecture: IT is more than just business support, and IT helps the growth of business, profit, and competitive advantage.
  • Skills: skills have to be effective, and staff must understand business drivers and speak in business language.
Luftman and Kempaiah [44] assessed alignment capability in 197 organisations and concluded that no single solution exists for achieving BITA. They added that achieving mature alignment requires the balanced development of all six building blocks identified in the model. Each building block is crucial and should not be overlooked or neglected. Luftman’s further work included research on the influence of BITA on company performance and further enhancement of measurement instruments [4].

2.2. Bibliometric Analysis of BITA

Bibliometric analysis was performed to gain insight into research in the field of BITA. Bibliometric analysis is a quantitative method that has become popular in business research in recent years [45]. It evaluates and analyses scientific literature based on citations, publication dates, author affiliations, and/or keywords from scientific databases [46]. Numerous esteemed scientific databases are at researchers’ disposal. Some widely used ones encompass Scopus, Web of Science (WoS), PubMed, ERIC, IEEE Xplore, ScienceDirect, Directory of Open Access Journals (DOAJ), and JSTOR [47]. The biggest and most popular scientific databases for researchers are Scopus and WoS [47]. There is considerable overlap between the two databases. Singh et al. [48] highlighted that approximately 99.11% of the journals indexed in WoS are also indexed in Scopus and that the database includes more documents than WoS. Our decision to limit this paper to the Scopus database was motivated by its comprehensive coverage of journals indexed in the WoS database, as highlighted by Mongeon and Paul-Hus [49] and Singh et al. [48]
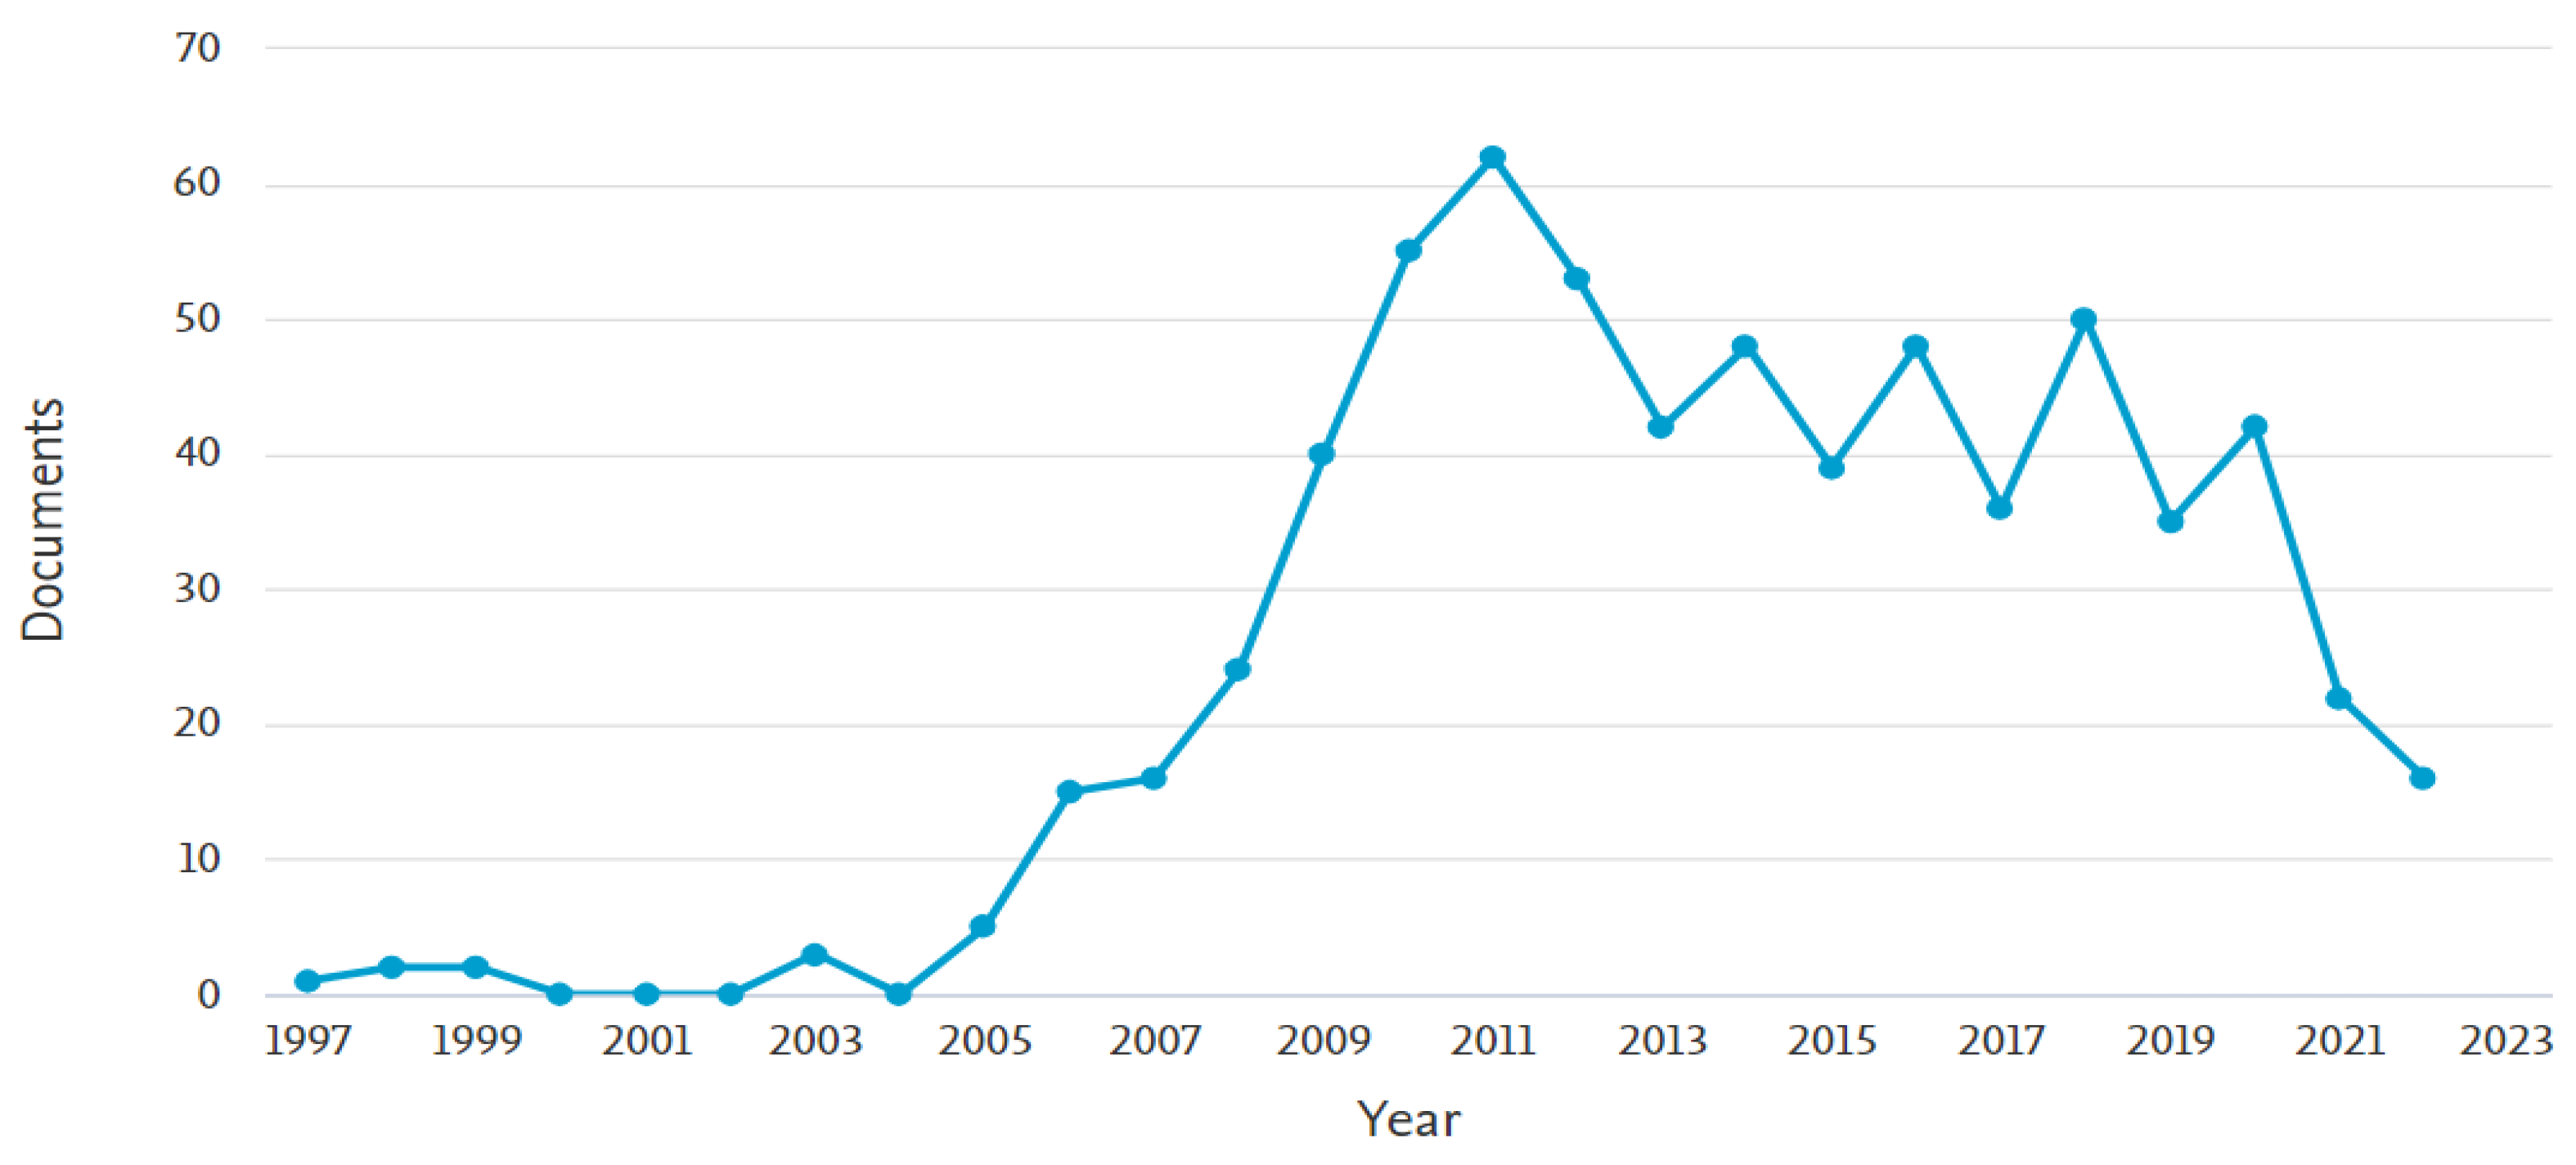
Our bibliometric analysis using the Scopus database was performed on 10 June 2023. Bibliometric analysis focussing on the keywords “business IT alignment” was conducted within the document title, abstract, and keyword fields. For our analysis, the documents published in 2023 were excluded from further analysis as it is the current year. However, eleven documents have already been published at the time of analysis. Our analysis was limited to document types, including conference papers, articles, book chapters, and books. Additionally, we focussed on subject areas encompassing computer science, business, management and accounting, decision sciences, engineering, mathematics, and social sciences. From a language point of view, three documents are in German, followed by Spanish with two documents, and Chinese and French with one document each. All other documents were in English, making it the most prevalent language. As a result of that, only documents in the English language were included in the analysis. After using the limited and excluded criteria mentioned above, 656 document results from 1997 to 2022 in the Scopus database appeared and were used for further bibliometric analysis (see Figure 1).
Before 1997, there were papers that semantically referred to business–IT alignment (see [21,25,26]), although not with the phrase “business IT alignment”. The first publication in the Scopus database with this keyword is a conference paper by Dantanarayana, Wickramage, and Jayaweera entitled “Framing Services Based on Value Activities in Healthcare” from 1997. The authors introduced a framework to assist healthcare designers in successfully developing service solutions [50]. The most cited article with 481 citations is “Achieving and Sustaining Business-IT Alignment” by Luftman and Brier from 1999 [13]. The article focuses on identifying the key factors that either facilitate or hinder the achievement of alignment between business and IT [13]. The second most cited publication, which is cited almost the same amount as the first one, with 471 citations, is a book titled “Enabling Flexibility in Process-Aware Information Systems: Challenges, Methods, Technologies” by authors Reichert and Weber from the year 2012 [51]. In their work, they highlight the growing importance of an organisation’s ability to quickly respond and adapt to changes in its environment as a key factor for success.
BITA’s interdisciplinary nature is evident in the diverse range of documents covered by scientific publications associated with the chosen keywords in the Scopus database. The subject areas represented in these papers demonstrate a broad spectrum of disciplines. Most of the papers fall within the field of computer science, accounting for 39.2% of the publications. This is followed by decision science (14.6%); business, management, and accounting (14.2%); engineering (12.2%); mathematics (10.8%); social sciences (4.9%); and other disciplines. The distribution of these publications across multiple subject areas illustrates the multidisciplinary nature of BITA research. It highlights the involvement of various fields in investigating and contributing to understanding BITA. This interdisciplinary approach allows for comprehensively exploring the subject, drawing insights from diverse perspectives and expertise.
Most publications were from Germany (106 documents, 16.16%), followed by the Netherlands with 96 documents (14.63%), the United States with 60 documents (9.15%), Australia with 47 documents (7.16%), Sweden with 46 documents (7.01%), Belgium with 43 documents (6.56%), and others such as Switzerland (37, 5.64%), the United Kingdom (27, 4.12%), China (26, 3.96%), France (24, 3.66%), and others. Furthermore, the perspective of affiliation of the first author is here analysed. Most are from Stockholm University (34) in Sweden, followed by the University of Twente (25) in the Netherlands, Utrecht University (16) in the Netherlands, University of Antwerp (15) in Belgium, Ecole Nationale Supérieure d’Informatique et d’Analyse des Systèmes (15) in Morocco, etc.
Fifty-two keywords appear in papers at least 15 times. Business IT alignment (BITA, 648) appears most often, followed by information systems (235), alignment (191), enterprise architecture (138), information technology (77), strategic alignment (70), industry (61), IT governance (58), information use (57), IT management (52), etc. However, the connections between the individual keywords cannot be seen, and therefore bibliometric mapping was carried out as explained in the following.
Bibliometric mapping is a technique used to generate visual representations that provide insights into the structure of scientific documents within a particular research area. These maps aim to present a comprehensive overview of the field by depicting its various subfields and their interconnections. By utilising bibliometric mapping, researchers can better understand the size and scope of the field, as well as the relationships and connections between different research areas [52]. Visualisation of similarity (VOS) is a mapping technique widely used in bibliometric analyses to create bibliometric maps. It allows researchers to visualise the similarity between entities, such as publications, authors, or keywords, based on bibliometric indicators. By applying the VOS procedure, researchers can uncover patterns, clusters, and connections within their bibliographic data, providing valuable insights into the structure and relationships of the analysed research field [53].
The VOSviewer program from van Eck and Waltman [54] was used, which has a good visualisation and can load and export information from many sources. Furthermore, the VOSviewer program stands out for its advanced visualisation features, which facilitate the creation of visually appealing and informative bibliometric maps. The program enables researchers to explore and depict the similarities and relationships between entities, such as publications, authors, or keywords, based on various bibliometric indicators.
Van Eck and Waltman [52,55,56] suggest following a five-step procedure. The first step involves identifying noun phrases within the corpus of documents. The next step is to select the most appropriate ones for the mapping process. This selection is based on criteria such as relevance, significance, and frequency of occurrence in the documents. In the third step, the selected noun phrases are mapped and grouped based on their semantic similarity or relatedness. Various techniques, such as co-occurrence analysis, term co-occurrence networks, or topic modelling, can be employed to establish connections and relationships between the concepts. The fourth step is to visualise the results. Visualisation techniques such as network diagrams, heat maps, or cluster plots are often used to visually represent the relationships between the concepts. The goal is to create a clear and intuitive representation of the term map. The final step involves analysing and interpreting the grouping results. This step helps researchers to gain insights into the underlying patterns, themes, or domains present in the corpus.
The citation information and keywords from the Scopus database were exported and imported into the VOSviewer program. At first, 89 keywords appeared. When limited to the keywords that appeared at least five times, thirty keywords met the threshold, arranged in the following three clusters:
  • The first cluster includes keywords that highlight the importance of aligning IT strategies, architectures, and processes with overall business objectives to optimise organisational performance, including the keywords: agile, ArchiMate, BPM, business model, business process model, case study, enterprise architecture, enterprise ontology, information technology, and SOA.
  • The second cluster includes keywords that highlight the importance of aligning IT governance and processes with strategic goals, measuring alignment through metrics and frameworks, and ensuring that IT requirements and software development practices support strategic objectives, including the keywords: balanced scorecard, business process, Cobit, enterprise governance, goal modelling, metric, requirement engineering, SAM, SAMM, and strategic alignment.
  • The third cluster includes keywords that highlight the importance of aligning IT capabilities, strategies, and investments with business requirements and objectives to maximise the value of IT for the organisation, including the keywords: business capability, business modelling, business value of IT, digital transformation, enterprise architecture management, enterprise modelling, IT management, IT strategy, and structural equation modelling.
The next step investigates how the keywords appear over time. From Figure 2, it can be seen that from the early years up until 2012 researchers conducted research in various areas related to BITA, such as goal modelling, requirement engineering, balanced scorecard, business process, and service-oriented architecture (SOA).
However, starting in 2012, the research focus shifted to include keywords associated with new themes and concepts. After 2012, researchers began exploring the connection between BITA and keywords such as business process management (BPM), IT strategy, enterprise ontology, case study, Cobit, strategic alignment, SAM (Strategic Alignment Model), SAMM (Strategic Alignment Maturity Model), IT management, IT, enterprise architecture, enterprise governance, and ArchiMate. More recently, BITA has been associated with emerging keywords such as business process model (BPM), business model, business capability, business modelling, enterprise architecture management, enterprise modelling, agile, structural equation modelling (SEM), and digital transformation. These keywords reflect the current trends and areas of interest within the field of BITA, highlighting the intersection between business processes, models, capabilities, and the broader context of digital transformation.
From Figure 1 and Figure 2, it can be seen that researchers have been researching the field of BITA since 1997. From 2005 to 2011, the number of publications in BITA increased sharply, reaching 65 publications in 2011. This can be attributed to several factors. During this period, BITA’s significance gained recognition in academia and industry. Organisations began realising the potential benefits of aligning their IT strategies with business objectives to drive efficiency, innovation, and competitiveness. Secondly, the field of BITA has evolved considerably, with foundational frameworks, theories, and methodologies being established. Researchers had access to a more solid knowledge base, facilitating further exploration and advancements in the field. This increased understanding, and the maturity of the field likely led to a surge in research activities. The period from 2005 to 2011 witnessed significant advancements in IT, such as the rise of cloud computing, mobile technologies, and social media. These technological developments presented new challenges and opportunities for achieving BITA. Researchers were motivated to investigate how these emerging technologies could effectively align with business strategies, increasing publications. From 2011 until today, the number of publications on BITA has fluctuated. As the understanding of BITA improved, researchers and practitioners may have shifted their focus towards implementing and operationalising alignment strategies within organisations rather than solely publishing academic papers. New research areas, such as digital transformation, big data analytics, artificial intelligence (AI), etc., have interested researchers. For BITA research to flourish, new emerging technologies must mature and become interesting. Therefore, we can speculate that the number of publications in the BITA field will increase again in the coming years. From the bibliometric analysis, it can be concluded that there is a lot of research in BITA, but not in connection with sustainability, since it did not appear in the bibliometric mapping.

2.3. BITA’s Impact on Sustainability

A critical issue facing our world today is the simultaneous need to preserve our planet’s resources and address the socioeconomic needs of a rapidly expanding population. This significant global challenge was initially articulated as sustainable development by the World Commission on Environment and Development [57] and has further been emphasised in the United Nations Global Agenda known as Agenda 2030 [58]. The Agenda 2030 includes 17 sustainable development goals (SDG) with specific targets and indicators [59,60,61,62]. These goals cover many areas: poverty eradication, education, health, gender equality, clean energy, sustainable cities, climate action, and biodiversity conservation. These goals, among other things, impact the operations of organisations.
Sustainability is the principle of meeting the present generation’s needs without compromising the ability of future generations to meet their needs. It involves balancing environmental, social, and economic considerations to ensure long-term well-being and resilience. In environmental terms, sustainability entails preserving and conserving natural resources, minimising pollution and waste, and protecting ecosystems and biodiversity. It promotes practices that promote the efficient use of resources and the reduction of negative environmental impacts. From a social perspective, sustainability promotes social equity, justice, and inclusivity. It ensures access to basic needs such as food, clean water, healthcare, education, and shelter for all individuals, regardless of their background or location. It also emphasises the importance of safeguarding human rights, promoting fair labour practices, and fostering social cohesion. Economically, sustainability aims to foster economic development that is both financially viable and environmentally responsible. It involves promoting sustainable business practices, supporting green innovation and technologies, and fostering economic systems that promote long-term prosperity and shared benefits. Overall, sustainability recognises the interdependence of environmental, social, and economic systems and seeks solutions that balance these aspects to benefit current and future generations. It requires considering the long-term consequences of our actions and making choices that minimise harm, promote resilience, and ensure the well-being of both people and the planet.
BITA is one of the key trends supporting digital transformation and sustainability. It enhances the benefits gained from digital transformation and supports enduring organisational growth and sustainability [7]. When digital capabilities such as big data, AI, IoT, and cloud computing are utilised, customer experience can be revolutionised through customer engagement [63], and innovative business models can be developed to enhance the competitive advantage of companies [64]. Additionally, the current trend of automation and data exchange using the latest technology is often referred to as the “Fourth Industrial Revolution”, which includes components such as cyber-physical systems—computer-based algorithms that are tightly integrated with physical processes, IoT—the interconnection of devices, machines and sensors, cloud computing—offering a scalable and flexible computational architecture—big data and analytics, AI, and machine learning [65].
The above technologies can be used to help companies increase business performance and reduce negative impacts on the environment. For example, Nike adopted various digital technologies, including machine learning and 3D printing, to optimise its design and production processes. Through these means, Nike has reduced waste in shoe production and created more sustainable products. Their “Move to Zero” campaign emphasises that sustainability and digital transformation play a significant role in achieving their targets [66]. Another example is Siemens, which utilises digital solutions to maximise the efficiency of its products. They use digital twins (virtual replicas of physical assets) to monitor and improve the performance of their devices. This approach allows Siemens to design energy-efficient products and minimise resource waste, contributing to corporate sustainability and helping their clients achieve sustainability goals [67]. The third example is Schneider Electric, which has been integrating IoT, AI, and other digital technologies into its energy management and industrial automation solutions. By leveraging these technologies, Schneider Electric can offer products and services that optimise energy use, reduce carbon emissions, and promote sustainable energy management in homes, buildings, data centres, infrastructure, and industries [68].
The fusion of digital technologies and processes aims for long-term environmental, social, and economic sustainability by optimising energy and resource usage and providing digital responses to environmental, social, and economic challenges. By merging digital advancements with sustainability principles, we can foster a more just, adaptable, and environmentally sound world [69].
Environmental and sustainability education (ESE) has been recognised as a valuable instrument for learning and teaching others how to address and promote sustainable development [62,70,71]. The concept of ESE revolves around empowering young people with the knowledge, skills, and attitudes necessary to tackle complex sustainability issues [62,72]. By nurturing their action competence, ESE aims to equip individuals to transform the world into a more sustainable place in the long run [73]. ESE is closely linked to the concept of sustainable action competence, which refers to the ability of individuals to understand and effectively act upon complex sustainability challenges. It goes beyond knowledge acquisition and includes the skills, values, and attitudes necessary for individuals to take meaningful action towards sustainability. It encompasses the ability to critically analyse sustainability challenges, identify appropriate solutions, and take effective action to address them. In the context of ESE, action competence aims to empower learners to become active agents of change in their communities and beyond. It provides opportunities for students to engage in real-world problem-solving, critical thinking, and decision-making related to sustainability issues. By developing action competence, learners gain the confidence and motivation to address sustainability challenges through practical initiatives, activism, policy advocacy, and community engagement.
Researchers define action competence as an educational approach [74] or an educational outcome within groups or individuals [75,76,
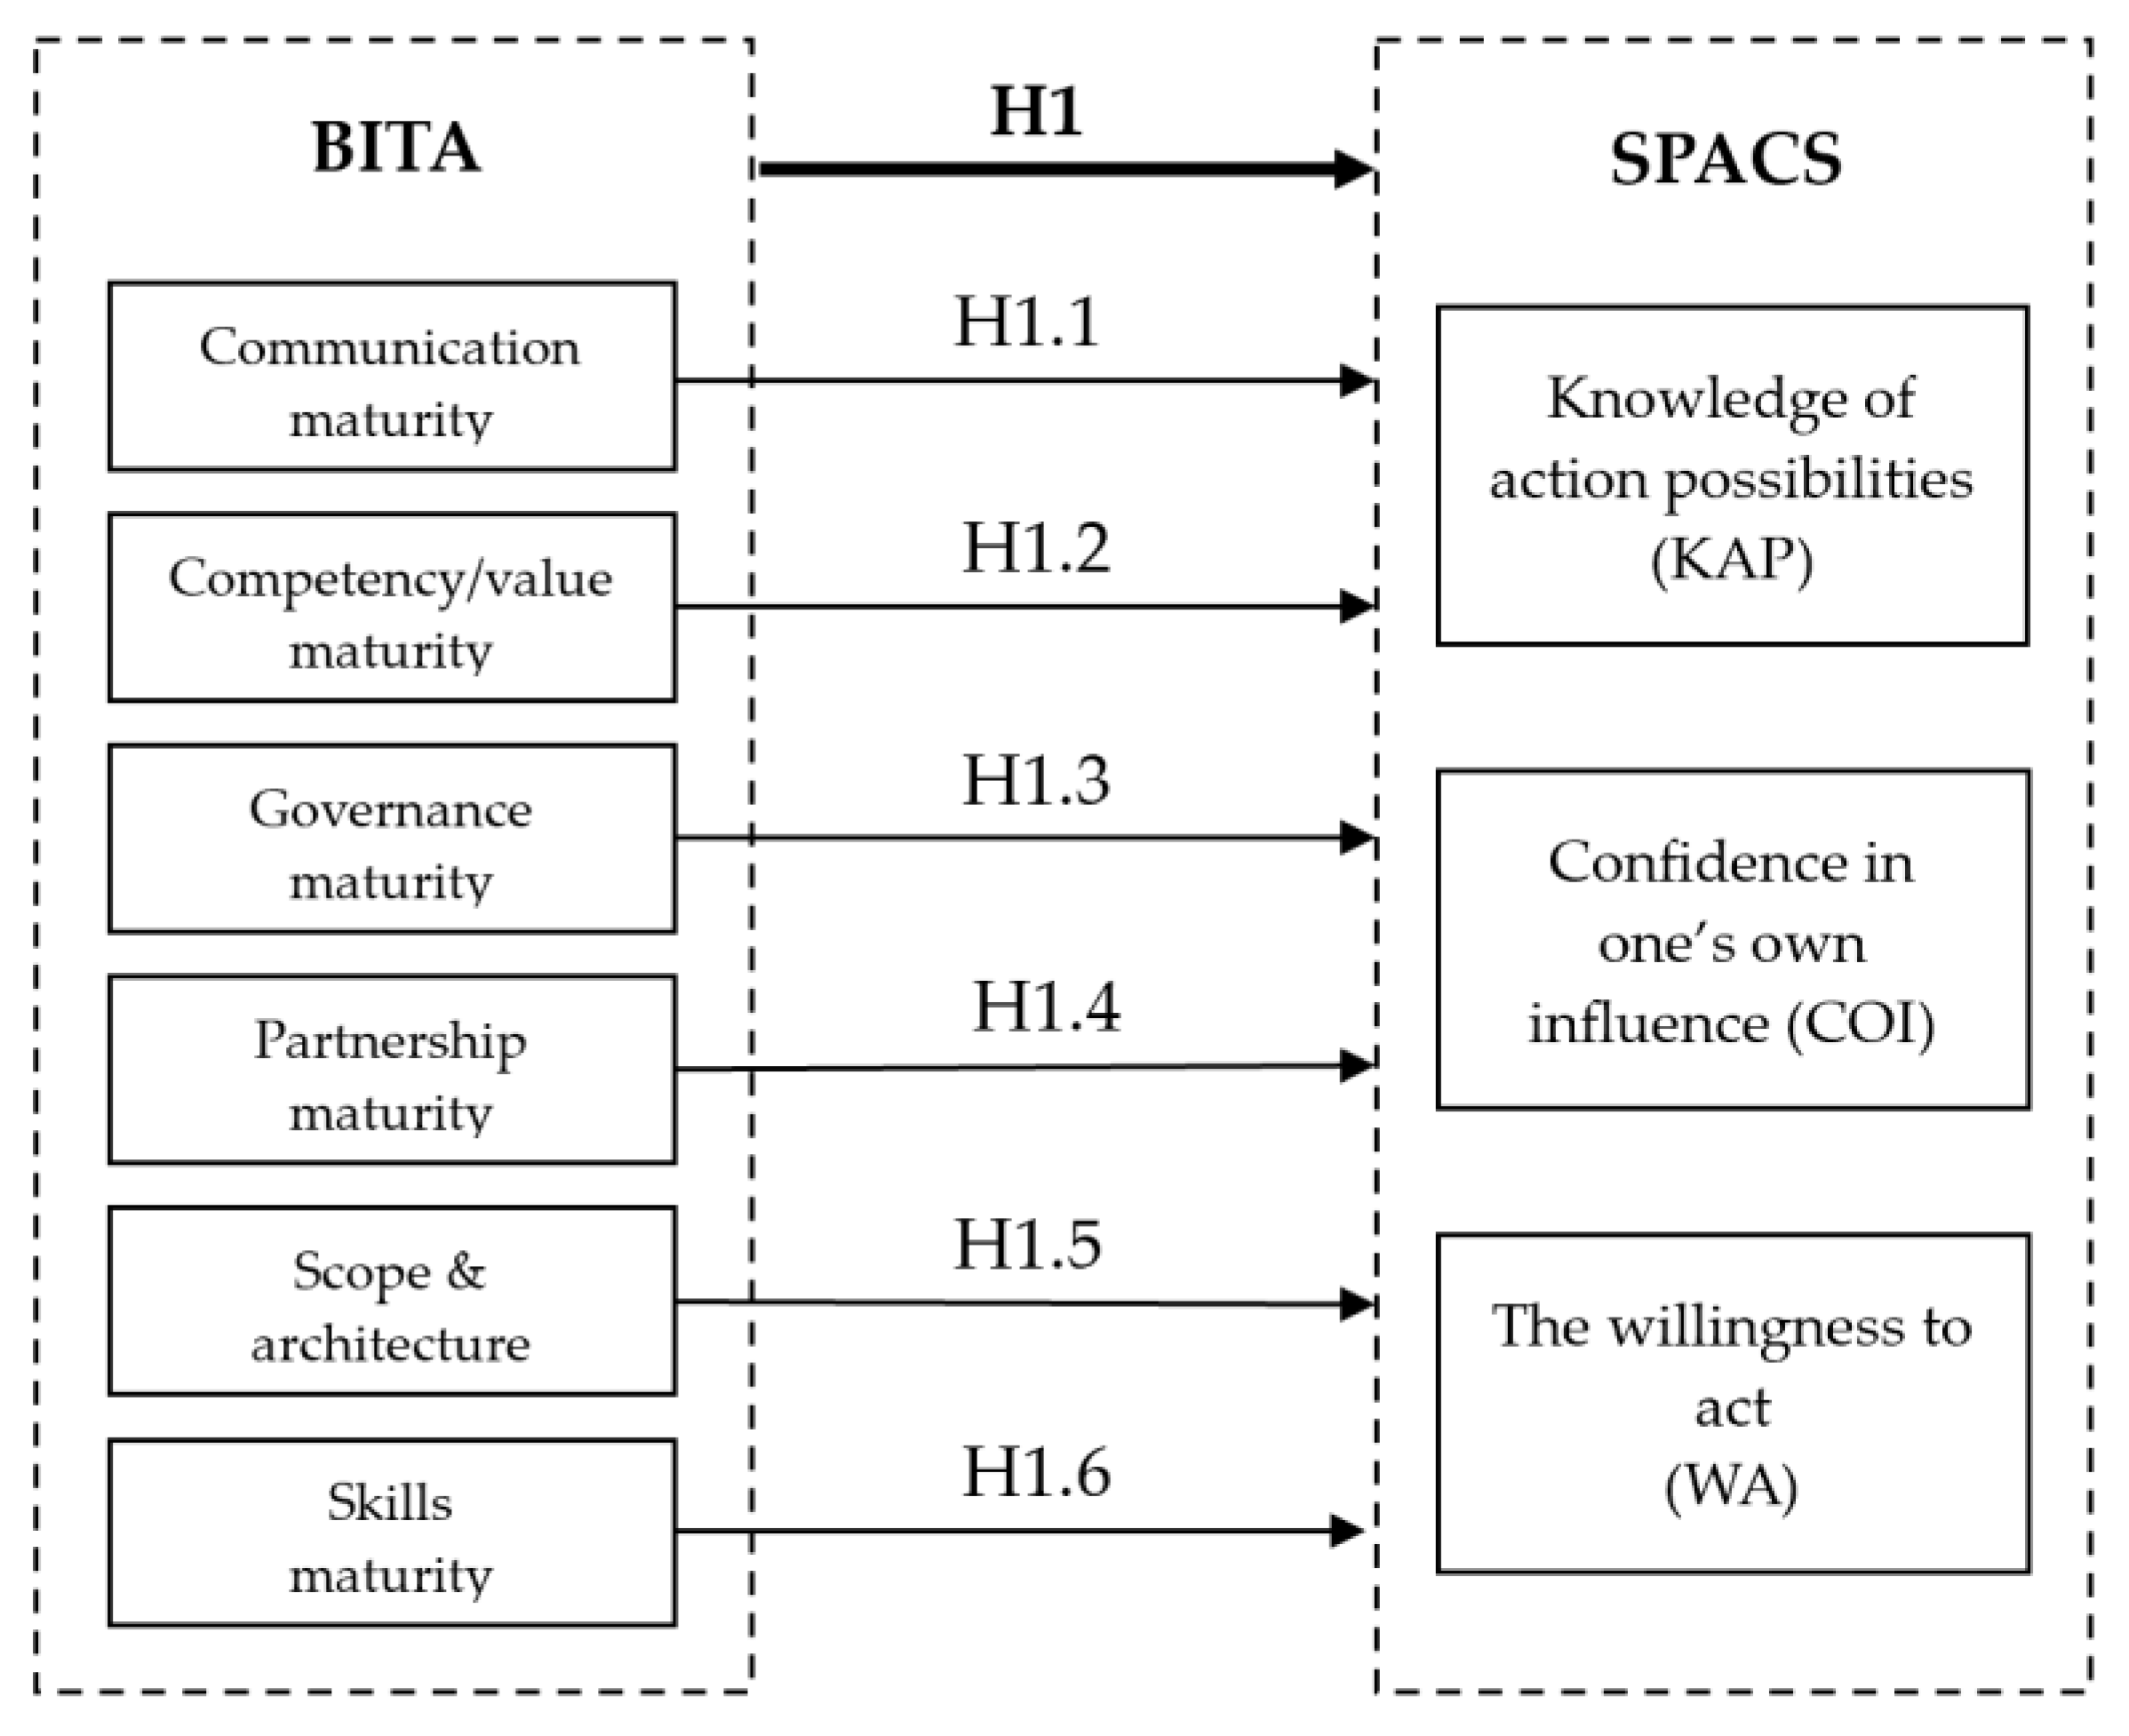
77]. The concept of action competence was defined by Jensen and Schnack [78] and Breiting and Mogensen [79], involving three subconstructs: knowledge of action possibilities (KAP), confidence in one’s influence (COI), and willingness to act (WA). The theory of action competence, involving three subconstructs, aligns with the environmental theory of the reasonable person model (RPM) proposed by Kaplan and Kaplan [80,81]. RPM is about informational needs among individuals, such as the need to build mental models, the need to be effective, and the need for meaningful actions [81]. Olsson et al. [59] highlighted the concept of self-perceived action competence of sustainability (SPACS) to promote three key groups of connected outputs: knowledge of action possibilities (KAP), confidence in one’s own influence (COI), and willingness to act (WA) developed by Jensen and Schnack [78] and Breiting and Mogensen [79]. The SPACS model research considers action competence a latent capacity within groups and individuals.
Although we did not find any relevant research on a direct connection between BITA and sustainability in the Scopus database (11 papers in the Scopus database on 15 June 2023, by keywords “Business IT alignment” AND “Sustainability”), we found research papers on the impact of BITA, measured by six criteria of the SAMM model, on organisational culture (for example, [82]). Other articles highlight the importance of the link between organisational culture and corporate sustainability (for example, [83]). The authors did not use the same measuring instruments in their research, but their results suggest that there is probably also a direct connection between BITA and corporate sustainability.
Corporate sustainability refers to integrating social, environmental, and economic considerations into an organisation’s business operations and strategies. It involves proactively managing an organisation’s impacts on society and the environment while maintaining long-term profitability and creating value for stakeholders, as noted by Ashrafi et al. [12] They also pointed out that it goes beyond short-term financial goals and encompasses a broader perspective of responsibility towards the well-being of people, the planet, and future generations. It involves considering business decisions and practices’ social, environmental, and economic dimensions. Organisations typically demonstrate their dedication to corporate sustainability by adopting corporate sustainability standards (CSS), which consist of policies and measures designed to meet or surpass minimum regulatory requirements [84].
Based on the above literature review, it is evident that the study of sustainability is a complex problem. Our focus on corporate sustainability will be narrow in our research, examining it from two distinct perspectives: the organisational perspective and the employees’ perspective within a specific organisation, as a case study.

3. Research Approach

3.1. Case Research Using Mixed Methods

The case research method is valuable when there is a need to broadly understand a problem, result, or phenomenon from its own perspective, usually concerning individuals, groups, or organisations [85]. It explores complex phenomena, considering their related factors and finding the main elements that cause them [86,87]. Case research explains, describes, or investigates phenomena or events that occur naturally in everyday situations [87]. It can be conducted using quantitative or qualitative methods, including various data collection techniques such as document analysis, observations, interviews, etc. [85,86] When a case research approach is used, it enables us to better understand differences in methods or the reasons for choosing one strategy over another. This can improve existing theories and increases progress [88]. There are three primary styles of case research: collective, instrumental, and intrinsic [89]. In collective case research, numerous studies are investigated simultaneously or equivalently to comprehensively understand a particular phenomenon or problem. An instrumental method of case research enables a broader insight into a problem or phenomenon than is to be gained from specific research. On the other hand, intrinsic case research investigates a single phenomenon wherein the scholar identifies the unique characteristics that separate that phenomenon from others.
Furthermore, researchers can use different case research tactics depending on the researcher’s epistemic stance, namely the interpretive, critical, and positivist tactics [85]. In interpretive tactics, the focus is on theory building. It includes knowledge of processes/context/meanings to be understood from multiple perspectives and, on this basis, it involves the search for recognition of personal and collective social meanings. In contrast, critical tactics involve exploring individual beliefs and considering the wider social and political environment. On the other hand, positivist tactics are oriented toward the principles of natural science.
In our case research, the influence of BITA on corporate sustainability is examined, focussing on its manifestation in management decisions and employees’ work. Data on corporate sustainability is collected using quantitative methods, enabling an assessment of BITA’s impact on sustainability indicators. Concurrently, qualitative methods such as interviews, focus groups, and document analysis offer deeper insights into BITA’s role in shaping management decisions and employees’ tasks. Due to this, a mixed method research (MMR) approach is used.
MMR combines quantitative and qualitative research methods in the same research inquiry [90]. Integrating quantitative and qualitative data can dramatically enhance the value of MMR [91,92]. Johnson et al. [93] examined 19 definitions of MMR and proposed that MMR represents a unique approach that combines both quantitative and qualitative research methods. It has been pointed out that MMR represents a third paradigm in research in addition to the qualitative and quantitative research paradigms. It recognises the importance of the traditional quantitative value of research as well as the qualitative value of research. It also offers a strong choice as a third paradigm that will often provide the most informative, complete, balanced, and useful research results [90,93]. MMR allows researchers to gain a more comprehensive and in-depth understanding of a research topic or phenomenon. By combining quantitative and qualitative approaches, researchers can gain a wider range of data, perspectives, and insights, leading to a more comprehensive understanding of complex research questions. MMR is well suited to address research gaps that cannot be adequately explored using a single method. Some research questions require quantitative data to examine patterns and trends and qualitative data to capture context, meanings, and individual experiences. By integrating both concepts, researchers can increase the reliability and validity of their results, thereby increasing confidence in research results and providing a way to bridge these gaps and create a more comprehensive understanding of the research topic [90,92,94].
The utilisation of this approach has witnessed a significant rise in popularity in recent years, as evidenced by the Scopus database (see Figure 3). The number of publications on MMR demonstrates this trend, with 567 publications in 2019, 707 publications in 2020, 690 publications in 2021, and 755 publications in 2022 (Scopus database on 25 June 2023). Based on 6092 published documents between 1977 and 2022, there has been a notable increase in the last ten years. Furthermore, as of 25 June 2023, there have already been 380 published documents in 2023 alone. When examining the distribution of MMR publications in various fields, it is evident that social sciences (19.9%, 2148 documents), medicine (19.8%, 2137 documents), and computer science (9.9%, 1070) stand out as the most prevalent subjects. These three subject areas account for almost 50% of published documents, followed by nursing (5.3%, 575); psychology (5.3%, 568); business, management, and accounting (4.4%, 478); and others.

3.2. Research Model

Based on the literature review, the case research approach will answer the research question, “Does BITA influence corporate sustainability?” It can be argued that there will be a direct impact relationship between BITA factors and corporate sustainability and between BITA and employees’ positive attitudes towards corporate sustainability orientation. Since the research will explore two perspectives, the organisation’s and the employees’ perspectives, mixed methods research (MMR) is used.
The first perspective of our research focuses on the employees for whom a quantitative analysis was performed, wherein the impact of six BITA factors on perceived corporate sustainability was researched. From the sustainability literature analysis in Section 2.3, it can be seen that some researchers (e.g., refs. [62,70,71]) have highlighted the importance of environmental and sustainability education (ESE) for young people, which will help to transform the world over a more extended period in a more sustainable environment [73]. Within this framework, the concept of action competences for sustainable development was formed, which has become a way to describe the anticipated learning result of ESE and can also be used for other groups of people [59] such as, in our case, for employees. To measure employees’ self-perceived corporate sustainability, the factor of self-perceived ability to act for sustainability (SPACS), proposed by Olsson et al. [59], was adjusted. In Figure 4, the research model of quantitative research is presented, where six factors of BITA influence self-perceived action competence for sustainability (SPACS).
The following hypothesis is made:
H1. 
Second-order factor BITA influences second-order factor self-perceived action competence for sustainability (SPACS).
In addition to examining the relationship between the BITA factor and the SPACS factor, our research also aims to investigate the specific first-order factors of BITA that influence the second-order factor SPACS. By analysing the individual factors of BITA, we can gain a deeper understanding of how they contribute to the overall construct of SPACS. Therefore, the following sub-hypotheses are made:
H1.1. 
The communication maturity factor through the second-order factor BITA influences SPACS.
H1.2. 
The competency/value maturity factor through the second-order factor BITA influences SPACS.
H1.3. 
The governance maturity factor through the second-order factor BITA influences SPACS.
H1.4. 
The partnership maturity factor through the second-order factor BITA influences SPACS.
H1.5. 
The scope and the architecture maturity factor through the second-order factor BITA influences SPACS.
H1.6. 
The skills maturity factor through the second-order factor BITA influences SPACS.
The second perspective of our research is focussed on the organisation and investigates the impact of operations and strategies facilitated by BITA on corporate sustainability. We believe BITA is important in fostering a sustainable orientation within organisations. Organisations can optimise resource utilisation, drive innovation, improve stakeholder engagement, and enhance corporate sustainability performance by aligning IT strategies, systems, and processes with sustainability objectives. Our research thesis for qualitative research is, “BITA maturity factors influence on corporate sustainability”. This will be explored through a semi-structured interview of two members of management, further explained in the Section 3.3.
This research was performed in a manufacturing company with manufacturing locations in Slovenia and the rest of Europe. They have an impressive history spanning over seven decades and have established global brands delivering state-of-the-art, innovative products worldwide. The company employs many IT practices and technologies, allowing us to explore different BITA methods. They use state-of-the-art, enterprise-level technology solutions that smaller companies cannot access. Corporate culture and formal processes are also well established in the company. Conducting research on a large company also allows us to see how BITA alignment works at scale. The company has cared for the environment as a top of the priority in its development strategy, and the entire life cycle of their products follows environmental protection policies. They also follow principles regarding fair and equal treatment of employees, ethical and fair operations, and have a responsible attitude towards the social environment. Such a company was seen as the ideal candidate for our research.

3.3. Research Procedure

Based on the case research theory presented in Section 3.1, our case research uses the instrumental case research approach to investigate the impact of BITA on corporate sustainability and interpretive tactics because we aim to contribute to theoretical work in this area. The MMR approach is employed to explore organisational and employee perspectives. As discussed in Section 3.1, this approach combines quantitative and qualitative methods to understand the research topic comprehensively. MMR can gather rich insights from multiple viewpoints, allowing for a more holistic and nuanced research problem analysis. In our study, the guidelines proposed by Venkatesh et al. [90,94] for implementing MMR in the field of IS were followed. These guidelines consist of two sets of steps: general guidelines (first four steps) and validation (last two steps). Following these guidelines ensures a systematic and rigorous approach to incorporating qualitative and quantitative methods into our research design.
Step 1 refers to deciding on whether MMR is an appropriate approach for the research. Venkatesh et al. [90,94] point out that researchers at the first stage of study should precisely consider their research question (i.e., rhetorical style, format, question, aims, hypotheses, level of integration; a dependent or independent correlation of questions to other questions, etc.), purpose (complementarity, completeness, developmental, expansion, corroboration/confirmation, compensation, and/or diversity), research perspectives (substantive theory stance, alternative paradigm stance, or aparadigmatic stance), and contexts. They added that researchers should only use MMR when they expect to comprehensively describe a phenomenon for which existing research is inadequate, fragmented, and/or ambiguous.
In our research, a rhetorical style was adopted to assess the level of integration in addressing our research question. Independent quantitative and qualitative research approaches were employed to comprehensively understand the phenomena under investigation. An online questionnaire was used for the quantitative analysis, while for the qualitative analysis semi-structured interviews, a presentation of the company, and publicly available information were used. These data collection methods were implemented separately but simultaneously, allowing us to gather insights from multiple perspectives and enrich our analysis. The purposes of our MMR research are, therefore:
  • Completeness: the quantitative and qualitative data provided rich explanations of findings from the analysis;
  • Compensation: the qualitative analysis compensated for the small sample size in the quantitative analysis;
  • Diversity: quantitative and qualitative research was conducted to compare perceptions of a phenomenon of interest by two different types of participants.
A single research paradigm, substantive theory, was used where traditional or emerging concepts could be connected or embedded within substantive theories [95]. This research paradigm was chosen because of the dynamic nature of BITA and corporate sustainability, and the need to develop new theoretical perspectives within the research field.
In the second step, it is necessary to develop a primary research design strategy for a research plan with MMR, where the researcher has to choose design investigation strategies (exploratory or confirmatory investigations), phases of research (mixed methods mono-strand designs and mixed methods multistrand designs), mixing strategies (fully or partial mixed methods), time orientation (sequential or concurrent design), and priority of methodological approach (equivalent or dominant–less status design) [90,94]. See Venkatesh et al. [90,94] guidelines for an in-depth explanation of all variations in MMR properties.
Our research used a confirmatory investigation because it tested a theory in a single phase, which Teddlie and Tashakkori [95,96] call mixed methods mono-strand design. They defined a phase or a strand as including three steps: (i) conceptualisation (i.e., theoretical foundations, purpose, and research methods); (ii) experiential (i.e., data collection and analysis); and (iii) inferential (i.e., interpretation and data usage). Since our research includes only one single phase (strand) of the conceptualisation-experiential-inferential process, consisting of qualitative and quantitative components, mixed methods mono-strand designs are discussed. As for the time orientation, concurrent design was used. In concurrent design, researchers have to simultaneously collect and analyse quantitative and qualitative data and then merge them for a complete understanding of the phenomena. This approach was chosen based on the inherent characteristics of changes and the potential influence of time on its outcomes. Since quantitative and qualitative components were equally important, equivalent status design as a priority of the methodological approach was used.
For the quantitative part, an online questionnaire was prepared that the company’s mid-level managers and key users filled out. The questionnaire comprises three parts: items about perceived BITA, items about employees’ self-perceived ability to act for sustainability (SPACS), and demographic data. In the first part of the questionnaire, the statements related to the perceived BITA, wherein the instrument used by Chen [97] and Yang [5] was utilised. Their measuring instrument consists of 23 items measured on a scale from one (completely disagree) to five (completely agree). The questionnaire is available in the appendix of the doctoral thesis by Yang [5]. The authors’ instrument is mainly constructed from previous literature and, additionally, consulting academic experts from research fields and theoretically confirming their work. Statistically, reliability was tested and confirmed (Cronbach’s alpha of each variable was more than standard 0.7). In the second part of the questionnaire are the statements related to the SPACS proposed by Olsson et al. [59], where the instrument for employees was adjusted. This part consists of 12 items measured on the five-point Likert scale from one (completely disagree) to five (completely agree). The original questionnaire is available in the appendix of the paper by Olsson et al. [59] To ensure that the questionnaire covers all aspects of the action competence for sustainability, the content validity of the items and scales were discussed in an expert group consisting of researchers with extensive experience in the ESE research field from Sweden and Belgium. The instrument was also statistically confirmed (Cronbach’s alphas for SPACS, KAP, COI, and WTA are more than 0.8). The adjustment for our research consisted in removing one item from corresponding sub-constructs that was related to the school context as suggested by the authors, leaving enough items to build each latent variable. In the final part of the questionnaire, demographic data such as gender, age, level of education, position within the organisation, etc., were collected. Following ethical guidelines, the purpose of the study was explained to the organisation’s management and also in the info sheet (informed consent) as part of the questionnaire. Respondents’ identity was kept confidential using the anonymous mode in the online survey tool LimeSurvey so that individual respondents could not be identified (confidentiality and anonymity were established), and we only collected data essential for the research.
In the qualitative analysis, a semi-structured interview was used with two members of management: a board member of the company (also responsible for IT and digital transformation) and the senior IT manager (the liaison between business and IT domains). The last version of SAM’s six-dimension measurement instrument by Luftman et al. [4] was used for the semi-interview (for the BITA part). The questionnaire assesses the current level of maturity of the organisation’s strategic alignment by measuring responses to items related to IT and business organisations through thirty-nine independent items as follows: the effectiveness of IT and business communications (six items), measuring the competency and value of IT (eight items), IT management decisions (seven points), partnerships between IT and business functions (six items), IT infrastructure scope and architecture (five items), and human resource skills (seven elements). For each item, managers were asked to choose the answer that best reflects their view on the effectiveness of their organisation’s management strategies and decisions. If they were unsure of how to respond to the item without resorting to speculation, or if the inquiry was irrelevant to their organisation, they were instructed to check the ‘N/A or I don’t know’ box. Managers chose answers by themselves, and the interviewer only provided additional context if needed. Additional context for the company was recorded for every answer. The questionnaire is available in the appendix of the research article by Luftman et al. [4] For the corporate sustainability part, based on the literature, the following questions were prepared:
  • What approaches and measures does the company implement in the field of corporate sustainability?
  • Do you think that BITA factors have an influence on corporate sustainability practices?
  • Which factors (if any) influence sustainability practices most and why?
The third step involves developing a strategy for collecting and analysing data with MMR, which includes a sampling design strategy (basic, sequential, concurrent, and multiple sample design), a data collection strategy, and a data analysis strategy.
A basic mixed methods sampling strategy, involving stratified purposive sampling, was used. This technique initially allowed us to divide groups of interest into strata and then select a small number of cases to study intensively in each stratum. Section 4 explains data collection and analysis strategies in more detail.
The fourth step includes meta-inferences from MMR. Meta-inferences depend on the quality of data analysis in the qualitative and quantitative components of the study. They are theoretical statements, narratives or stories that emerge from integrating findings from the quantitative and qualitative strands of the MMR [90,94]. Venkatesh et al. [90] pointed out that IS researchers should independently debate the validity of their model, analysis, and results within quantitative and qualitative research contexts before discussing validation for the mixed methods meta-inferences. The fourth step is presented in more detail in Section 5.
The fifth and sixth steps refer to the validation of the MMR. For the fifth step, the quality of meta-inferences was assessed; for the sixth step, the potential threats and remedies were highlighted. These two steps are addressed in Section 6. A methodological diagram with the MMR steps included in our research is presented in Figure 5.
Although the MMR approach offers valuable insights, it also comes with limitations. Implementing MMR demands more time, resources, and expertise compared to single-method studies, which can limit its applicability. Merging qualitative and quantitative data introduces complexities, especially if the data sets clash. Biases are another concern. In qualitative research, the subjective nature of interpretation can introduce bias. In quantitative research, biases may arise if the sample is not representative or if survey questions are misleading or vague [90,94].
The research at the company was performed between 29 May 2023 and 21 June 2023 with the first contact at the company. After additional inquiry about the research (by mail and via telephone calls), the company selected the responsible person/contact. The prepared digital version of the quantitative survey in Lime Survey was sent to the company on 29 May 2023. The company distributed the questionnaire to the selected participants and set the deadline for the responses to 16 June 2023. After receiving 20 answers, the company sent a reminder to participants and extended the deadline for one week. The last answer was received on 20 June 2023.
A meeting with the management was arranged on 21 June 2023 for the interview for the qualitative part of the research. Subsequently, data familiarisation and manual coding were conducted, followed by analysis where both inductive (emerging from the data) and deductive (based on pre-existing theory and research on the company’s documentation) reasoning were employed (see Section 4.2). This was followed by interpreting the results obtained.
Alongside the qualitative analysis, quantitative analysis was also conducted. Over the next two weeks, data cleaning and descriptive analysis were carried out (see Section 4.1.1) and followed by data analysis in the SmartPLS program. For the first step, the measurement model was assessed (see Section 4.1.2) and for the second step, the structural model was assessed using the bootstrap method (see Section 4.1.3).
This was followed by interpreting the results from both quantitative (see Section 5.1) and qualitative (see Section 5.2) analyses as well as the combined results as envisaged by MMR (see Section 5.3) to get the complete picture of our research question.

4. Research Study Results

4.1. Quantitative Analysis

Structural equation modelling (SEM) is a multivariate statistical analysis technique used to analyse structural relationships. It combines factor analysis and multiple regression analysis, testing complex relationships among observed and latent variables. SEM aims to explore relationships between one or more independent variables and one or more dependent variables [98]. The most used SEM techniques are covariance-based and component-based. Covariance-based SEM (SEM-CB), also known as “traditional SEM”, is used when the research objective is theory testing, the sample size is large, and the data distribution is normal. In comparison, component-based SEM is used when the research objective is prediction or theory development. The most commonly used component-based SEM technique is partial least squares (PLS) [98,99]. The aim of our research is theory development, so structural equation modelling partial least squares (SEM-PLS) was chosen for quantitative analysis.
The SEM-PLS is a path-modelling SEM technique based on the analysis of variance. The key advantages of SEM-PLS are robustness, particularly where the data may violate the assumptions of traditional SEM methods. It can handle small sample sizes, non-normal data distributions, and variables with non-linear relationships more effectively than other techniques. It allows for the inclusion of both formative and reflective measurement models, which is particularly useful in social sciences and other fields where latent constructs may have multiple indicators with varying levels of influence. SEM-PLS employs an iterative process, allowing researchers to refine their models based on the results obtained [99,100,101]. Furthermore, research models incorporate second-order factors designed to exert a causal influence on multiple first-order factors and standard factors with measured indicators [102]. As a result, second-order factors are not directly associated with any specific measurement items. SEM-PLS systematically conceptualises higher-order factors using manifest variables [103]. SEM-PLS has become an accepted technique for model analysis. At first, the measurement model is estimated and then the structural model, where relationships between variables are examined [100].
The empirical data was used in two stages with the SEM-PLS technique using the Smart PLS 4 software [104]. The guidelines of Sarstedt et al. [100], Garson [101], and Hair et al. [105] for the SEM-PLS technique were followed. The first phase examines the psychometric properties of all measurement scales (Section 4.1.2), while the second phase focuses on hypothesis testing and analysis (Section 4.1.3).
In the research, two second-order factors, namely BITA and SPACS, are used. The manipulation of higher-order factors has allowed researchers to spread the application of PLS path modelling to more complex and advanced models. The Type I second-order factors, which are the reflective-reflective higher-order constructs, are used. Researchers today most regularly employ Type I in SEM [106]. In a reflective model, the construct is considered the cause and the indicators of its manifestations. Thus, the construct determines its indicators and each indicator, being a manifestation of the construct, can be removed if its coefficient is not statistically significant. The most popular techniques for assessing Type I higher-order models have repeated indicators or a disjointed two-stage approach [106,107]. A disjointed two-stage approach was used in our research. The first stage is a model assessment of the reflective measurement models for the lower-order constructs, where reliability and validity were assessed. In the second stage, the latent variable scores of the lower-order constructs from stage one were used to create and estimate the stage two model. The values of low-order constructs to second-order constructs were located and added as new variables to the data set. The assessment of stage two begins by focussing on the reflective measurement model of the higher-order component with reliability and validity. In the hypothesis testing and analysis phase, statistically significant path coefficients were calculated using the bootstrapping technique (the five thousand subsamples were included). Bootstrapping is a resampling technique used for hypothesis testing and deriving robust estimates of standard errors and confidence intervals of the path coefficients. The major advantage of bootstrapping is that it does not rely on the assumption of normality. Hence, it can be used with small sample sizes and non-normally distributed data, making it very applicable in various research contexts [99,101,105].

4.1.1. Descriptive Statistics

For estimating the minimum sample size in PLS-SEM, the “10-times rule” method is widely used [108,109]. According to this rule, the sample size should be equal to ten times the largest number of formative indicators used to measure a single construct, or the sample size should be equal to ten times the largest number of structural paths directed at a particular construct in the structural model [105].
As can be seen from the research model (see Figure 4), only one relationship between the second-order factor BITA and the second-order factor SPACS was investigated. The second-order factor BITA is represented by six reflective latent variables (first-order constructs): communication maturity, competency/value maturity, governance maturity, partnership maturity, scope and architecture maturity, and skills maturity. The second-order factor, SPACS, is represented by three reflective latent variables (first-order constructs): knowledge of action possibilities (KAP), confidence in one’s own influence (COI), and the willingness to act (WA). The research model includes only relative indicators and only one relationship; according to the “10-times rule”, at least ten answers are needed.
Our online questionnaire was distributed to 35 mid-level managers and key users selected by the company following our guidelines and discussion with the person responsible for the research inside the company. All the items of factors were measured on a five-point Likert scale, ranging from ‘1—strongly disagree’ to ‘5—strongly agree’; the scale was adopted from relevant prior research and adapted to relate to the context of the BITA and SPACS in the context of employees. In addition, demographic data were collected.
Twenty-six (26, 74.29%) questionnaires were returned, which could be included in further analysis. Most respondents were male (76.9% or 20 out of 26), with females making up a smaller proportion (23.1% or 6 out of 26). The age distribution of respondents seems fairly balanced, with similar representation from the 30–39, 40–49, and 50–59 age groups (each making up 26.9% or 7 out of 26 respondents). There was lower representation from the 20–29 age group (19.2% or 5 out of 26). The distribution of roles among the respondents leans slightly towards managers (57.7% or 15 out of 26) compared to key users (42.3% or 11 out of 26). Overall, the sample consists predominantly of men, fairly evenly spread across the age groups from 30 to 59, and with a slight leaning towards managers. The younger age group (20–29) is slightly underrepresented in the sample. The final version of the research is presented below. Detailed results and analyses can be obtained from the authors.
Table 1 shows the descriptive statistics for the reflective indicators of the first-order factors, namely their mean values, median, minimum value, maximum value, and standard deviation. Almost all factors are measured by several indicators except for factors of competency and governance, which are represented by two indicators. The mean scores for all indicators are close to or above four, suggesting that the respondents rate all the factors positively on a five-point scale. Median scores are mostly four across all the indicators, suggesting that the data are mostly symmetrical and respondents’ ratings tend to be high. The minimum scores are two or above, and the maximum scores are five for all the indicators, indicating that extremely negative responses are not present in the data. Standard deviations are generally low, typically below one, suggesting that responses do not deviate significantly from the mean, indicating a level of agreement among respondents for most indicators. All indicators have high loadings (mostly above 0.7), suggesting that they contribute significantly to their respective latent variables. This is a good sign of the model’s construct validity (explained in the Section 4.1.2). Respondents rate all factors positively from descriptive data, and all indicators are closely related to their respective factors. This suggests that the factors have been measured effectively, and the latent constructs are well represented by their indicators. However, further analyses must be conducted in the Section 4.1.2 and Section 4.1.3 for a complete interpretation.

4.1.2. Measurement Model

In our research model, there are two second-order factors. BITA is a second-order factor based on six first-order factors. SPACS is also a second-order factor based on three first-order factors. Both second-order factors are measured as reflective-reflective higher-order factors in this study. The factor loadings, reliability, and validity were assessed similarly to first-order factors to establish the second-order construct validity.
The measurement model is evaluated, where it is necessary to check reliability (internal consistency reliability and indicator reliability) and validity (convergent and discriminant validity) for first-order factors (stage 1) and second-order factors (stage 2). Internal consistency reliability is checked with Cronbach’s alpha (α) and composite reliability (CR), wherein the values must be higher than 0.7. Indicator reliability is checked with the help of indicator loadings, which must be signed and exceed 0.70. Convergent validity is tested using the average variance extracted (AVE) for each construct and should exceed 0.50 [110]. Discriminant validity is checked with three measures. Firstly, the square root of AVE for each construct should exceed the bivariate correlations between that construct and all other constructs [110]. Secondly, an indicator’s loadings should be higher than all its cross-loadings. Thirdly, HTMT (the hetero-trait-monotrait ratio) value should not exceed 0.90 [111], while Garson [101] set the threshold at 1.0.
First, the reliability and validity of first-order factors (stage 1) were checked. Reliability was assessed by indicator reliability and internal consistency reliability (CR). Indicator reliability was checked with the help of indicator loadings (see the last column in Table 1). All of the indicator loading values have been exceeded by the value of 0.70, so consistency reliability can be proceeded with.
Table 2 shows that all first-order factors’ Cronbach’s alpha values and composite reliability (CR) values exceed 0.70, ensuring consistency reliability. Convergent validity was tested using the AVE. All AVE values from Table 2 exceed 0.50, ensuring convergent validity, so we can continue with discriminant validity.
Discriminant validity is checked with the indicator’s loadings, Fornell–Larcker rule, and HTMT ratio. All indicator loadings in our model were higher than all of their cross-loadings (see column Indicator Loadings in Table 1). Table 3 shows the HTMT values, where all values are below one. In the lower part of Table 3, the Fornell–Larcker criterion values are shown, where the square root of AVE (bold italic numbers on the diagonal) for each construct exceeds the bivariate correlations between that construct and all other constructs. All three measures provide discriminant validity.
This is followed by evaluating the measurement model for second-order factors (stage 2). At the second stage, the latent variable (LV) scores of the first-order constructs from stage one were used to create and estimate the stage two model. Table 4 shows the outer loadings of LV scores; the Cronbach alphas and composite reliability (CR) values are higher than 0.70, ensuring the second stage’s indicator and internal consistency reliability.
In Table 4, outer loadings measure the strength of contribution that each first-order factor (BITA or SPACS) provides to the associated second-order factor. A higher loading signifies a more robust relationship. Regarding the second-order factor BITA, the first-order factor governance exhibits the highest loading of 0.866, indicating the strongest relationship. This is closely followed by factor partnership with a loading of 0.864 and factor communication with a loading of 0.827. The factor skills has a loading of 0.824, while the factor competency presents a loading of 0.774. The factor scope and architecture demonstrates the weakest relationship, with the lowest loading of 0.656. For the second-order factor SPACS, the first-order factor COI manifests a notably strong relationship, indicated by its high loading of 0.947. This is followed by WA, demonstrating a solid relationship, with a loading of 0.897. While still significant, the factor KAP has a slightly less robust connection, evidenced by its loading of 0.805.
Table 5 presents the values of the HTMT ratio and the Fornell–Larcker criterion for stage 2. All values are lower than required, so the discriminant validity of the second stage is ensured; therefore, the evaluation of the structural model follows.

4.1.3. Structural Model

In the hypothesis testing and analysis phase, statistically significant path coefficients were calculated using the bootstrapping method (the five thousand subsamples were included). The path coefficient (β) shows that the connection between two factors is strong if the path coefficient (β) is more than 0.1. The t-statistic value presents whether the independent variable has a statistically significant impact on the dependent variable in the research model. Critical t-values for a two-tailed test are 1.65 (significance level = 10%), 1.96 (significance level = 5%), and 2.58 (significance level = 1%) [112].
Table 6 and Figure 6 show that the second-order factor BITA significantly strongly affects the second-order factor SPACS (β = 0.686; p < 0.001). Thus, H1 is confirmed. Moreover, all first-order factors, which explain the second-order factor BITA, through factor BITA statistically significantly impact on the second-order factor SPACS. All sub-hypotheses H1.1 to H1.6 are confirmed.
In addition to the path’s coefficients’ statistical significance (relevance) for the structural model, the assessment of the measure is also the coefficient of determination (R2). Garson [101] emphasised that checking the R2 is necessary, representing the model’s predictive ability. Its values range between 0 and 1, where a higher value means a better predictive ability of the model with cut-off values of 0.19 representing weak, 0.33 representing moderate and 0.67 representing a significant explanatory power of the model [113]. Our model’s coefficient of determination (R2) is 0.471, which illustrates that factor BITA explains 47.1% variance in the factor SPACS and shows moderate predictive ability.
The effect size f2 signifies the change in R2 when the exogenous variable is removed from the model. An effect size with a cut-off value of 0.02 is small, 0.15 is medium, and 0.35 is a large effect size [113]. From Table 4 and Table 6, it can be seen that all first-order factor f2 values exceeded the threshold value of 0.35, which means that removing any of the first-order constructs (see Table 6) or a latent variable of the first-order factor (see Table 4) from step two from our research model will have a large effect size on the research model. It can also be seen from Table 6 that the second-order factor BITA strongly influences the second-order factor SPACS (f2 = 0.890).
Standardised root mean square residual (SRMS) is a fit measure in SmartPLS, defined as the change between the observed correlation and the model-implied correlation matrix. It enables the estimation of the average size of discrepancies between observed and expected correlations as an absolute measure of the criterion (model). An SRMR value of less than 0.10 is considered a good fit [114]. For our research model, the SRMR is 0.091, representing a good fit.

4.2. Qualitative Analysis

Our second research perspective focusses on the company and investigates the impact of operations and strategies facilitated by BITA on corporate sustainability (explained in Section 3.2). This perspective aims to produce more interpretative results regarding how the maturity of BITA factors impacts corporate sustainability. Since the maturity of BITA factor assessment is based on the questionnaire of Luftman et al. [4], and the corporate sustainability part is based on open questions from the theory (explained in more detail below), semi-structured interviews (SSI) were used.
Semi-structured interviews (SSI) are the most common qualitative research method used in mixed method designs [115]. An interview is a method of data collection that involves conversational communication, where the researcher (interviewer) asks questions, and the interviewee (respondent) provides answers [116]. The advantages of interviews lie in their targeted approach, focussing directly on the case study topic, and their potential to offer valuable insights by revealing perceived causal inferences. However, interviews have certain weaknesses, including potential biases resulting from poor question structure, answer bias, inaccuracies due to limited recollection, and reflexiveness, as interviewees may tend to provide responses that align with the interviewer’s expectations [117]. Interviews can take on either highly structured and formalised formats or entirely unstructured forms resembling informal conversations. A structured interview is a formalised questioning approach considering the questions’ content, sequence, and formulation [118]. It involves asking specific questions with standardised content in a predetermined order and establishing measures for assessing answers and rules for incorporating further questions when necessary. Responses are typically recorded in real time, and a closing note is made directly after the conversation [119]. Moreover, during interviews, the interviewer has to be aware of non-verbal communication (e.g., facial expressions, tone of voice, behaviour, etc.) as these cues significantly complement verbal responses.
Our research was performed by the SSI method and investigation of publicly available information through the company website and environmental reports. The structure of the interview was sent to the company in advance. They selected two participants for the interview following our guidelines and discussion with the person responsible for the research in the company. These were a board member of the company responsible for IT and digital transformation, and the senior IT manager, the liaison between business and IT domains.
The questionnaire was based on research by Luftman et al. [4], composed of 39 independent items for explaining six dimensions of BITA, where managers were asked to choose the answer that best described their view on the BITA (described in Section 3.3). This part of the questionnaire was used: (i) to assess the BITA maturity level of the company as seen by managers and (ii) to produce a further explanation for each dimension of the BITA where necessary. For every answer to BITA items, additional explanation was captured using questions like: “Please specify how you implement measures in your company/context”, “How do you think the measure could be further improved to achieve better alignment?”, “Do you think that measure has an impact on corporate sustainability?”, etc.
Based on qualitative research, the BITA maturity level of the company was measured at 3.3 on a scale from 1 to 5 (further discussed in Section 5.2). At level three, the organisation has clear procedures to align business and IT strategies, which are consistently followed. There is proactive management of BITA, with regular communication and collaboration between business and IT leaders. On the other hand, organisations at level four have established BITA processes and actively manage and improve these processes based on defined metrics. Business and IT strategies are closely linked, and the organisation can quickly adapt its IT capabilities to meet changing business needs. The result of 3.3 is mostly consistent with BITA’s level three maturity level. However, when further investigating all six factors of BITA and answers from the management, it can be seen that the company already implements some procedures of the maturity level four of BITA. This is consistent with management’s opinion that they already have a well-established system that can be further improved. Further explanation of the dimensions of the BITA is as follows.
The measured value of BITA maturity of the communications dimension was 3.8. Knowledge of the IT environment and the possibilities of IT for business is good and encouraged. The same goes for knowing the business perspective from the IT side. They have implemented formal processes for knowledge transfer, which is mostly used in the onboarding process. The budget for training is defined, and employees undergo training required by their positions or projects they work on. The company has implemented key users (mostly for business information systems) employed in the IT department. A train the trainer concept is also used for knowledge transfer. Liaison between IT and business is defined, and there is a protocol for reporting and coordination with top corporate management.
The measured value of BITA maturity of the competency/value dimension was 3.5. The company uses standard metrics such as ROI and the ABC method to measure projects’ technical and financial efficiency (IT and non-IT projects). A formal process for corrective actions based on results is in place. They use the same processes for investments and development projects. In their opinion, the process could be improved, for example, with better acceptance criteria defined in advance. Service level agreement (SLA) is defined in IT guidelines and IT policies at the corporation level. Benchmarking is usually performed before starting a large IT project or in the case of disruptions/changes. The company has a department for continuous improvement processes implemented on the corporation level. Management thinks that IT is a valuable partner to the business and has a measurable impact on the strategic targets of the corporation.
The measured value of BITA maturity of the IT governance dimension was 3.2. Formal strategic planning is in place at the department level and at the corporate level. IT management is included in strategic planning (content, costs, headcount). The IT department is sometimes seen as a cost, investment, or profit centre. If they must choose only one definition, they would choose the cost centre, which is was most common. IT investments are selected based on traditional financial criteria. They see IT projects and investments as process enablers. Priorities are decided with IT and business functions together. A formal steering committee for IT initiatives and projects exists with regular meetings. When management was asked what is, in their opinion, the ability of IT to react and change in response to business disruptions and changes, they answered two out of five (bad). In their opinion, that is due to the inertia of the big IT systems and their resources.
The measured maturity of the partnership dimension was 3.3. IT is seen as an asset, which is part of business processes. The relationship between business and IT is managed but not always in place. There is trust between business and IT, and it is seen as a long-term relationship. Risk and reward are shared between business and IT. IT projects and initiatives have business sponsors, usually at the top management level.
The maturity of the scope and architecture was 3.4. IT is seen as a process enabler. The company has a large IT system centrally managed on the corporation level. Standards for IT systems are defined and implemented at the corporation level. IT systems are integrated internally and on some level with external partners. Regarding flexibility, the IT system is seen as a system developed in line with business needs and business strategy.
The maturity of the skills dimension was 2.9. An innovative entrepreneurial environment is strongly encouraged at all levels of the company. A strong attitude towards innovation is part of the vision and values of the company. The company has a formal change-readiness program on an organisational level. Knowledge transfer between IT and business units is possible and encouraged at the department level. Social interaction between IT and business functions is in place, and trust and confidence are achieved. In the recruiting process, there is the same focus on technical and business knowledge. They do not have a formal program for attracting and retaining top talent.
The second part of the Interview is about corporate sustainability and the sustainable orientation of the company. Before the interview, available public information about the company’s approach to social, environmental, and governance approaches (ESG) was investigated through the company website and environmental reports. In the interview, every aspect of ESG and its implementation in the company were further discussed. The company has implemented policies and processes for environmental sustainability, social sustainability, and governance. They recognise the crucial role that each individual and the workplace environment play in the daily dynamics of their company. Fostering creativity, upgrading mutual relations, and staying ahead of new developments using non-aggressive management techniques have become key components of their corporate culture. They focus on education, maintaining an environment friendly to innovation and communication with employees. Moreover, employees have the opportunity to develop their careers in business units abroad. Regarding customers and users of their products, they focus on safe, environmentally friendly, high quality products with excellent after-sales service.
The organisation’s development strategy assigns the utmost importance to environmental conservation. The company’s environmental protection policy encompasses the entire product lifecycle, starting from its design, manufacturing and usage stages and ending with its disposal once it has served its purpose. By leveraging state-of-the-art technology, processes, and materials, the company consistently reduces the waste produced during manufacturing. It consumes energy and resources such as electricity, water, natural gas, and compressed air. The company’s commitment to finding contemporary technological solutions for its products has been met with enthusiasm and appreciation from its environmentally mindful clientele. The company’s primary goal is to manufacture products that use less electricity, water, and other resources.

5. Discussion

BITA refers to the coordinated efforts undertaken by management to ensure that IT objectives align with the functional goals of various departments within organisations, such as marketing, finance, and production. The goal is to align IT with the overall business objectives and vice versa. Luftman and Brier [13] emphasise that several factors are crucial for a successful BITA. These factors include strong senior management support, effective prioritisation, fostering positive working relationships, building trust, promoting effective communication, and developing a comprehensive understanding of the business environment. Due to the importance of sustainability in the global environment [57,58,62], companies have also adapted through corporate sustainability.
Our case research approach shows a relationship between BITA factors and SPACS, and the overall influence of BITA on corporate sustainability. MMR was used within the case research approach, which offers the chance to develop new theoretical views by merging the strengths of quantitative and qualitative methods, thus enabling rich understandings by exceeding the boundaries associated with either method [94]. It allows researchers to provide more robust conclusions than with a single method, thus generating more diverse and complementary perspectives [90]. This type of research makes sense when there is a connection of contingencies concerning its research questions. MMR will likely provide better findings and results [93].
In the following we present, per MMR step four (see Section 3.3), first the meta-inferences for the quantitative analysis (Section 5.1) and the qualitative analysis (Section 5.2) followed by combined, so-called MMR analysis meta-inferences (Section 5.3).

5.1. Quantitative Analysis Discussion

Our quantitative analysis investigated the impact of the second-order factor, BITA, on the second-order factor, SPACS. Our study utilised Type I second-order factors (reflective-reflective) and was focussed on a single structural path from BITA to SPACS. The 10-times rule [105,108,120] determined the minimum required sample size, a principle commonly employed in the IS field when using PLS-SEM. This rule postulates that the sample size should at least be tenfold the maximum number of structural paths aimed at a specific construct within the structural model. The minimum sample size, according to the 10-times rule, is 10. Another method is the inverse square root rule, which recommends that the sample size be equal to or larger than the square of the number of structural model paths [120]. Given that our model only contains a single path, the square of one result is one, indicating that our current sample size of 26 is not only adequate but more than meets the requirement. In addition to these two methods, there are alternative methods to calculate the minimum necessary sample size, such as Monte Carlo simulation, the minimum R2 method, gamma-exponential, etc. [120] These methods are generally preferred for complex models involving numerous paths, indicators, and latent variables.
The second-order factor, BITA, is characterised by six reflective latent variables or first-order constructs delineated by Chen [97] and Yang [5]. The mean value for the communication maturity factor stands at 3.625, which suggests a maturity level between three and four. The competency/value maturity factor presents a mean value of 4.058, corresponding to a maturity level of four. The governance maturity factor exhibits a mean value of 3.904, aligning almost entirely with a fourth level of maturity. The partnership maturity factor carries a mean value of 4.039, reflecting a maturity level of four. The mean value for the scope and architecture maturity factor is 3.442, which suggests a maturity level between three and four. Lastly, the skills maturity factor has a mean value of 3.808, indicative of a maturity level closely approximating four. According to the respondents’ self-assessments, there may still be room for improvement in all BITA first-order factors, primarily for the factor scope and architecture maturity, followed by communication maturity, skills maturity, governance maturity, partnership maturity, and competency maturity.
SPACS, a second-order factor proposed by Olsson et al. [59], is an aggregate construct that incorporates three reflective first-order factors: knowledge of action possibilities (KAP) with a mean value of 4.077, confidence in one’s own influence (COI) with a mean value of 4.019, and willingness to act (WA) with a mean value of 4.163. Each of these first-order factors uniquely contributes to the collective construct of SPACS, with the magnitude of their contributions differing as indicated by the respective β-values. Β-values gauge the intensity of the relationship between a predictor (independent) variable and the outcome (dependent) variable. Our data indicate that each first-order factor shares a robust relationship with the second-order factor SPACS. The factor COI emerges as the most substantial contributor, exhibiting a β-value of 0.947. This denotes a particularly potent positive relationship, implying that as COI ascends, the SPACS value rises (t = 54.574, p < 0.001). The second most prominent contributor is the factor WA, with a beta value of 0.897. This value indicates a significant positive relationship (t = 22.703, p < 0.001). The factor KAP holds a beta value of 0.805 (t = 9.928, p < 0.001), reflecting a potent positive relationship with SPACS, although this is not as strong as the previous two factors. All three factors, COI, WA, and KAP, significantly shape the SPACS value. These factors present potential focus areas for designing interventions or strategies to enhance SPACS.
The second-order factor BITA exhibits a strong significant statistical influence on the second-order factor SPACS (β = 0.686; p < 0.001), suggesting that BITA is a potent predictor of second-order factor SPACS, confirming hypothesis H1. Moreover, all first-order factors of BITA, indirectly through second-order factors of BITA, significantly influence SPACS, confirming all sub-hypotheses H1.1 to H1.6. The importance of a first-order factor is often evaluated based on the magnitude of its β-value, with higher β-values indicating a stronger influence on the second-order factor. The first-order factor governance maturity very strongly influences the second-order factor BITA (β = 0.866, p < 0.001). However, partnership maturity has a very close β-value of 0.864, showing a nearly equivalent influence on BITA. They are followed by the other first-order factors with very strong statistical effects of communication maturity (β = 0.827, p < 0.001), skills maturity (β = 0.824, p < 0.001), and with a strong effect of competency maturity (β = 0.774, p < 0.001), and scope and architecture maturity (β = 0.656, p < 0.001). According to this measurement, they also have substantial β-values but are slightly less impactful than governance and partnership maturity factors. Each of the six first-order factors plays a significant role in shaping the influence of the second-order construct BITA on the second-order construct SPACS. In summary, governance maturity is the most important first-order factor influencing the second-order factor BITA, with partnership maturity being a very close second. These two factors might be key areas to focus on when considering ways to influence BITA and, in turn, SPACS.
Our research model demonstrates considerable predictive capabilities, as evidenced by the R2 value 0.471, which indicates that the model explains 47.1% of the variance in the second-order factor SPACS, pointing to a moderately strong level of prediction. Furthermore, the f2-values for all first-order factors surpass the established threshold of 0.35. This reveals that the exclusion of any first-order factor would result in a substantial impact on the overall model. In other words, each first-order factor plays a crucial role in our research model’s predictive power and explanatory capacity.
From the quantitative results, it can be concluded that BITA strongly statistically significantly influences employees’ SPACS in terms of knowledge of action possibilities (KAP), confidence in one’s own influence (CAI), and willingness to act (WA). The most important factor is COI, where can proper IT systems and digital tools provide employees with feedback mechanisms to understand the impact of their actions. For example, a platform that tracks and visualises the reduction in carbon footprint due to an employee’s actions can enhance the individual’s confidence in their influence on sustainability. Communication platforms can facilitate the recognition of sustainable behaviours, further boosting employees’ confidence, etc. For the factor WA, IT alignment can foster a culture of sustainability by promoting engagement, collaboration, and recognition. Digital tools like intranet platforms, social networks, or collaboration tools can be used to share success stories, recognise efforts, and build a community around sustainability goals. This can foster employees’ sense of belonging and commitment, increasing their willingness to act. Moreover, digital gamification strategies can make sustainability initiatives more engaging and personally rewarding for employees, thus enhancing their motivation to participate. The least important factor, but still a very important one, is KAP. When business goals are well aligned with IT strategies, it often results in a transparent and efficient information flow within the organisation. Effective data management systems and knowledge-sharing platforms can ensure that employees are well informed about how they can contribute to sustainability. For example, a knowledge management system can disseminate information about recycling programs, energy-saving practices, or the company’s sustainability initiatives; learning platforms can offer courses and training on sustainability practices, thus increasing employees’ understanding of possible actions, etc.

5.2. Qualitative Analysis Discussion

In the qualitative part of the research, the organisation’s BITA maturity level was measured using Luftman’s instrument [4]. The BITA maturity level of the organisation is at level 3.3 on a scale from 1 to 5, where the scale is defined as follows: Level 1 (ad-hoc process); Level 2 (committed process); Level 3 (established focussed process); Level 4 (improved/managed process); Level 5 (optimized process). The maturity levels are defined for all six criteria of Luftman’s model, as seen in Table 7.
Maturity level 3.3 aligns with management’s opinion that they already have a well-established system that can be further improved. According to Luftman and Kempaiah [44], achieving mature alignment requires the balanced development of all six building blocks identified in his model. Each building block is crucial and should not be overlooked or neglected. They also established that most companies worldwide are at a level three BITA maturity level at the time of research.
Being an international corporation with established corporate rules and processes and a large and complex IT system on all levels of the organisation (strategic, tactical, and operational), BITA can offer significant potential for enhancing corporate sustainability.
According to interviews and discussions with management, the following areas can be exposed:
  • BITA can help organisations increase efficiency by automating routine processes, optimising operations, using resources better, reducing waste and allowing businesses to scale up their operations without corresponding increases in resource use, boosting sustainability.
  • Improving the decision-making process enables advanced data analytics capabilities. By harnessing these capabilities, businesses can derive insights that inform their decision-making processes, including sustainability-related processes. For example, a company might use analytics to identify the most carbon-intensive aspects of its supply chain and then take targeted action to reduce those emissions.
  • Regarding the facilitation of sustainability reporting, IT can help collect, analyse, and report sustainability-related data. This transparency is crucial for shareholders and stakeholders, who are increasingly concerned about businesses’ environmental and social impacts.
  • Regarding promoting innovation, it becomes easier to innovate in ways that promote sustainability when business and IT strategies are aligned. For example, an organisation might develop new products or services that meet customer needs while reducing environmental impacts.
  • IT can be used to identify and manage sustainability risks. For example, it can help a company track and respond to climate risks in its operations or supply chain. This risk mitigation is crucial for long-term sustainability.
  • IT can support remote work setups that reduce carbon emissions by eliminating the need for employee commuting and reducing the demand for an office.
  • Regarding energy efficiency, IT can help in monitoring and managing energy use within a company, ensuring that operations are as energy efficient as possible.
The research thesis “BITA maturity factors influence corporate sustainability” can be confirmed based on quantitative results.

5.3. MMR Discussion

MMR analysis of inference was followed. Based on the results of MMR, it can be concluded that:
  • BITA factors strongly influence all three factors (knowledge of action possibilities, confidence in one’s influence, willingness to act) of perceived action competence for sustainability SPACS. All BITA factors significantly influence SPACS factors, so there must be equal focus on all factors. Based on this result, it can be concluded that employees will likely be willing to support companies’ sustainability initiatives.
  • The maturity level of BITA factors, as seen by management (communication as the most important factor, followed by competency and partnership) and employees (partnership as the most important factor, followed by competency and governance) is different. This can be due to different views on the same issues or the fact that employees perceive factors differently from top management, which has a better overview of all operations in the organisation on a corporate level (further discussed in the next paragraph).
  • BITA is connected to corporate sustainability initiatives because better-aligned IT systems offer better overall support for all processes in the company, including processes that can help improve corporate sustainability.
Despite not employing the same measurement instrument to gauge the maturity level of BITA factors, the maturity level of individual factors can be measured on both scales. These measurements take into account employee perceptions and inferences made from the company’s perspective. From Figure 7, it can be seen on the spider web that both employees and the company assessed the maturity level of individual BITA factors between 3 and 4, except for the factor skills maturity, where the company believes it to be 2.86, while employees believe it is at level 3.81. This is the largest divergence in the ratings (the difference is 0.95). Next is factor partnership maturity, where employees are assigned a level of 4.04, while the company is assigned a level of 3.33 (the difference is 0.71), followed by factor governance maturity, where employees are assigned a level of 3.90 and the company 3.29 (the difference is 0.62), then factor competency maturity, where employees are assigned a level of 4.06 and the company 3.50 (the difference is 0.56). Then comes factor communication maturity, where the company rated at 3.83 while employees at 3.65 (the difference is 0.21). This is the only factor for which the company rated the level higher than the employees. In comparison, both assessed the factor scope and architecture maturity at precisely 3.4 to one decimal place (the difference is 0.04).
Figure 7 shows that employees rated the BITA level higher, with an average value of 3.81, compared to the company, which rated it at 3.37. From the data, it can be concluded that there seems to be a perception gap between the employees and the company regarding the maturity level of BITA factors. The differences in their ratings could be attributed to different perspectives, experiences, or understanding of what each factor involves. It would be beneficial for the organisation to align these perceptions and work on areas where the maturity level is perceived as lower, such as factor skills. Moreover, the company might benefit from understanding why employees perceive certain aspects, like factors of partnership maturity and competency maturity, to be higher than it does. A continuous dialogue and feedback process could help bridge these gaps and enhance the overall BITA maturity level.

6. Conclusions

Important efforts are taking place around the world today in the field of sustainability [58,62]. Sustainability also significantly impacts organisations, so organisations must align their business and IT strategies (i.e., BITA) with sustainable initiatives. We believe that BITA can help to enable companies to integrate sustainability into their core operations, increase efficiency, and make data-driven decisions, leading to improved environmental performance and long-term sustainability.
A well-aligned business IT strategy can foster an environment wherein employees are knowledgeable about, confident in, and willing to take sustainability actions. However, the organisation must ensure that the IT tools are user-friendly and that the initiatives are communicated effectively to maximise employee engagement in sustainable initiatives.

6.1. Contributions to Theory

Digital technologies are revolutionizing the measurement and management of environmental-sustainability-related matters. However, the optimum implementation and use of digital technologies supporting corporate sustainability remains a challenge. BITA enables organisations to support company processes better. We discovered that a direct relationship between BITA and corporate sustainability exists from the perspectives of the employees and the company.
From bibliometric analyses, we found out that the research focus of BITA-related topics is shifting towards emerging IT technologies, such as blockchain and green computing, which are also enablers of digital transformation, allowing companies to build new sustainable business models to support sustainable initiatives.

6.2. Contributions to Practice

Organisations still face challenges in leveraging BITA’s benefits proactively and fully for sustainability. One of the most significant issues is employee resistance to change. Implementing new IT systems or processes often requires employees to learn new skills and change their work routines, which can lead to resistance [121]. The complexity of IT systems and the fast pace of technological change can make alignment difficult. Organisations must continuously adapt their strategies and processes to leverage the benefits of the evolving digital transformation of technology, which can be challenging and resource intensive. On the other hand, the cost of implementing and maintaining advanced IT systems can be high, which can strain an organisation’s financial resources and impact its sustainability.
Based on the results of this study, it can be confirmed there is no universal approach to BITA and its influence on corporate sustainability. Organisations must focus on all factors of BITA equally, which aligns with the literature by Luftman and Kempaiah [44], to achieve better levels of BITA alignment. Suppose the focus is on the influence of the BITA on corporate sustainability. In that case, some implications can still be revealed, such as:
  • Focus on strategic planning because integrating IT into overall business strategy ensures that technology investments align with sustainability objectives.
  • Promote collaboration to achieve effective alignment. Managers must promote cross-functional collaboration, which can also positively affect sustainability objectives.
  • Invest in IT capabilities that support sustainability.
  • Managers should prioritize employee training and education to enhance employees’ understanding of the intersection between IT, business, and sustainability.
  • Given the rapid pace of technological change, managers must be skilled in change management. Implementing new technologies can cause disruption, and managers must guide their teams through this change, ensuring that employees understand how these technologies contribute to sustainability.
  • Finally, managers can leverage IT to engage stakeholders (including employees, customers, investors, and regulators) on sustainability issues.
Digital platforms can provide transparency about the company’s sustainability efforts and create opportunities for feedback and dialogue.

6.3. Limitations and Future Research Directions

Some limitations were encountered during the research. Some of them are presented below. The research was performed in a large multinational company operating in one industry sector. It is important to note that researching large organisations comes with challenges. For instance, it is not easy to access the necessary data or get approval for the research, and the complexity of the corporate structure could make the research more challenging. Moreover, research findings might not be directly applicable to smaller organisations. The SPACS construct proposed by Olsson et al. [59] was adjusted to be used in companies based on the argumentation by the author that although the construct was prepared and used in a school context, it can also be used in different contexts such as organisations (SEM-PLS analysis was performed to validate the construct in our context). Another factor influencing the result could be the sector in which the organisation operates and the organisational culture of the organisation.
For further research, we suggest doing a cross-sector comparative study to examine the influence of the company sector on the results. Another approach could be research on organisational culture and its impact on BITA, and organisational culture’s impact on corporate sustainability. Since IT can also have a significant impact on the environment, there could be future research on the influence of BITA and its impact on sustainability if the company uses green IT, which refers to the study and practice of designing, manufacturing, using, and disposing of computers, servers, and related subsystems efficiently and effectively with minimal impact on the environment. Companies with outsourced IT could also be researched, as that approach requires a different BITA approach and raises new challenges, such as effective risk and cost management of outsourcing using different approaches [122,123].

Author Contributions

Conceptualisation, U.Z., P.T. and S.B.; methodology, U.Z. and S.B.; software, U.Z.; validation, U.Z., P.T. and S.B.; formal analysis, U.Z.; investigation, U.Z.; resources, U.Z.; data curation, P.T.; writing—original draft preparation, U.Z. and S.B.; writing—review and editing, U.Z., P.T. and S.B.; visualisation, U.Z.; supervision, P.T. and S.B.; project administration, P.T.; funding acquisition, P.T. and S.B. All authors have read and agreed to the published version of the manuscript.

Funding

Authors acknowledge the financial support from the Slovenian Research Agency (research core funding No. P5–0023, ‘Entrepreneurship for Innovative Society’).

Institutional Review Board Statement

Not applicable.

Informed Consent Statement

Not applicable.

Data Availability Statement

Not applicable.

Conflicts of Interest

The authors declare no conflict of interest.

References

  1. Chan, Y.C.; Reich, H.B. IT alignment: What have we learned? J. Inf. Technol. 2007, 22, 297–315. [Google Scholar] [CrossRef]
  2. Aversano, L.; Grasso, C.; Tortorella, M. A Literature Review of Business/IT Alignment Strategies. Procedia Technol. 2012, 5, 462–474. [Google Scholar] [CrossRef]
  3. Silvius, A.J.; Waal, B.D.; Smit, J. Business and IT Alignment; Answers and Remaining Questions. In Proceedings of the Pacific Asia Conference on Information Systems, Hyderabad, India, 10–12 July 2009; Available online: https://aisel.aisnet.org/pacis2009/44 (accessed on 12 March 2022).
  4. Luftman, J.; Lyytinen, K.; Zvi, T. Enhancing the measurement of information technology (IT) business alignment and its influence on company performance. J. Inf. Technol. 2017, 32, 26–46. [Google Scholar] [CrossRef]
  5. Yang, B. Business-IT Alignment from Operational Level: Empirical Evidence from the Bank of Qingdao, China. Ph.D. Theses, ISCTE, Lisbona, Portugal, 2020. [Google Scholar]
  6. Jonathan, G.M.; Rusu, L.; Van Grembergen, W. Business-IT Alignment and Digital Transformation: Setting A Research Agenda. In Proceedings of the 29th International Conference on Information Systems Development, Valencia, Spain, 8–10 September 2021; Association for Information Systems (AIS): Atlanta, GA, USA, 2021. [Google Scholar]
  7. Ben-Zvi, T.; Luftman, J. Post-Pandemic IT: Digital Transformation and Sustainability. Sustainability 2022, 14, 15275. [Google Scholar] [CrossRef]
  8. Panda, S. Strategic IT-business alignment capability and organizational performance: Roles of organizational agility and environmental factors. J. Asia Bus. Stud. 2022, 16, 25–52. [Google Scholar] [CrossRef]
  9. Feroz, A.K.; Zo, H.; Chiravuri, A. Digital Transformation and Environmental Sustainability: A Review and Research Agenda. Sustainability 2021, 13, 1530. [Google Scholar] [CrossRef]
  10. Kyriazoglou, J. IT-Business Alignment: Part I, Effectively Aligning IT Systems to Your Business Operations; Bookboon: London, UK, 2012. [Google Scholar]
  11. Kyriazoglou, J. IT-Business Alignment: Part II, Effectively Aligning IT Systems to Your Business Operations; Bookboon: London, UK, 2012. [Google Scholar]
  12. Ashrafi, M.; Acciaro, M.; Walker, T.R.; Magnan, G.M.; Adams, M. Corporate sustainability in Canadian and US maritime ports. J. Clean. Prod. 2019, 220, 386–397. [Google Scholar] [CrossRef]
  13. Luftman, J.; Brier, T. Achieving and Sustaining Business–IT Alignment. Calif. Manag. Rev. 1999, 42, 109–122. [Google Scholar] [CrossRef]
  14. Chan, Y.E.; Huff, S.L.; Barclay, D.W.; Copeland, D.G. Business Strategic Orientation, Information Systems Strategic Orientation, and Strategic Alignment. Inf. Syst. Res. 1997, 8, 125–150. [Google Scholar] [CrossRef]
  15. Irani, Z. Information Systems Evaluation: Navigating through the problem domain. Inf. Manag. 2002, 40, 11–24. [Google Scholar] [CrossRef]
  16. Kearns, G.S.; Lederer, A.L. The impact of industry contextual factors on IT focus and the use of IT for competitive advantage. Inf. Manag. 2004, 41, 899–919. [Google Scholar] [CrossRef]
  17. Luftman, J. Key issues for IT executives. MIS Q. Exec. 2005, 4, 269–285. Available online: https://aisel.aisnet.org/misqe/vol5/iss2/5 (accessed on 10 January 2023).
  18. Broadbent, M.; Weill, P.; Neo, B.S. Strategic context and patterns of IT infrastructure capability. J. Strateg. Inf. Syst. 1999, 8, 157–187. [Google Scholar] [CrossRef]
  19. Venkatraman, N.; Henderson, J.C.; Oldach, S. Continuous Strategic Alignment: Exploiting information technology capabilities for competitive success. Eur. Manag. J. 1993, 11, 139–149. [Google Scholar] [CrossRef]
  20. Smaczny, T. Is an Alignment between Business and Information Technology the Appropriate Paradigm to Manage IT in Today’s Organisations? Manag. Decis. 2001, 39, 797–802. [Google Scholar] [CrossRef]
  21. Henderson, J.C.; Venkatraman, N. Strategic Alignment: Leveraging Information Technology for Transforming Organizations. IBM Syst. J. 1993, 32, 4–16. [Google Scholar] [CrossRef]
  22. Sledgianowski, D.; Luftman, J.N.; Reilly, R.R. Development and Validation of an Instrument to Measure Maturity of IT Business Strategic Alignment Mechanisms. In Innovative Technologies for Information Resources Management; Khosrow-Pour, M., Ed.; IGI Global: Hershey, PA, USA, 2008; pp. 229–245. [Google Scholar] [CrossRef]
  23. Versendaal, J.; van den Akker, M.; Xing, X.; de Bevere, B. Procurement maturity and IT-alignment models: Overview and a case study. Electron. Mark. 2013, 23, 295–306. [Google Scholar] [CrossRef]
  24. Ciborra, C.U. De Profundis? Deconstructing the Concept of Strategic Alignment. Scand. J. Inf. Syst. 1997, 9, 57–82. Available online: http://aisel.aisnet.org/sjis/vol9/iss1/2 (accessed on 15 January 2023).
  25. Vitale, M.R.; Ives, B.; Beath, C.M. Linking information technology and corporate strategy: An organizational view. In Proceedings of the Seventh International Conference on Information Systems, San Diego, CA, USA, 15–17 December 1986; pp. 265–276. [Google Scholar]
  26. Chan, Y.E.; Huff, S.L. Investigating Information Systems Strategic Alignment. In Proceedings of the Fourteenth International Conference on Information Systems, Orlando, FL, USA; 1993; pp. 345–363. Available online: https://core.ac.uk/download/pdf/301364213.pdf (accessed on 26 March 2023).
  27. Kearns, G.S.; Lederer, A.L. The Effect of Strategic Alignment on the use of IS-Based Resources for Competitive Advantage. J. Strateg. Inf. Syst. 2000, 9, 265–293. [Google Scholar] [CrossRef]
  28. Sauer, C.; Burn, J.M. The Pathology of Strategic Management. In Steps to the Future, 1st ed.; Sauer, C., Yetton, P.W., Eds.; Jossey-Bass: San Francisco, CA, USA, 1997; pp. 89–112. [Google Scholar]
  29. Reich, B.H.; Benbasat, I. Factors that Influence the Social Dimension of Alignment between Business and Information Technology Objectives. MIS Q. 2000, 24, 81–113. [Google Scholar] [CrossRef]
  30. Baker, E.H. Leading Alignment. CIO Insight 2004, 1, 19–20. [Google Scholar]
  31. Feeny, D.F.; Edwards, B.R.; Simpson, K.M. Understanding the CEO/CIO Relationship. MIS Q. 1992, 16, 435–448. [Google Scholar] [CrossRef]
  32. Lederer, A.L.; Mendelow, A.L. Coordination of Information Systems Plans with Business Plans. J. Manag. Inf. Syst. 1989, 6, 5–19. Available online: https://www.jstor.org/stable/41432894 (accessed on 2 March 2023). [CrossRef]
  33. Campbell, B. Alignment: Resolving ambiguity within bounded choices. In Proceedings of the Pacific Asia Conference on Information Systems, PACIS 2005, Bangkok, Thailand, 7–10 July 2005; pp. 1–14. [Google Scholar]
  34. Sledgianowski, D.; Luftman, J. IT-Business Strategic Alignment Maturity: A Case Study. J. Cases Inf. Technol. 2005, 7, 102–120. [Google Scholar] [CrossRef]
  35. Davenport, T.H.; Short, J.E. The New Industrial Engineering: Information Technology and Business Process Redesign. Sloan Manag. Rev. 1990, 31, 11–27. [Google Scholar]
  36. Floyd, S.W.; Woolridge, B. Path Analysis of the Relationship between Competitive Strategy, Information Technology, and Financial Performance. J. Manag. Inf. Syst. 1990, 7, 47–64. Available online: http://www.jstor.org/stable/40397935 (accessed on 2 March 2023). [CrossRef]
  37. Jenkin, T.A.; Chan, Y.E. Is Project Alignment—A Process Perspective. J. Inf. Technol. 2010, 25, 35–55. [Google Scholar] [CrossRef]
  38. Tan, F.B.; Gallupe, B. Aligning Business and Information Systems Thinking: A cognitive approach. IEEE Trans. Eng. Manag. 2006, 53, 223–237. [Google Scholar] [CrossRef]
  39. Scott Morton, M.S. The Corporation of the 1990s: Information Technology and Organizational Transformation; Oxford Press: London, UK, 1991. [Google Scholar]
  40. Henderson, J.C.; Venkatraman, N. Strategic Alignment: A model for organizational transformation through information technology. In Useem, Transforming Organizations, 1st ed.; Kocham, V.T.A., Ed.; Oxford University Press: New York, NY, USA, 1992; pp. 97–117. [Google Scholar]
  41. Luftman, J.A.; Papp, R.; Brier, T. Enablers and Inhibitors of Business–IT Alignment. Commun. Assoc. Inf. Syst. 1999, 1, 11. [Google Scholar] [CrossRef]
  42. Luftman, J. Assessing Business-IT Alignment Maturity. Commun. Assoc. Inf. Syst. 2000, 4, 1–50. [Google Scholar] [CrossRef]
  43. Luftman, J. Competing in the Information Age; Oxford University Press: New York, NY, USA, 2003. [Google Scholar]
  44. Luftman, J.; Kempaiah, R. An Update on Business-IT Alignment: “A Line” Has Been Drawn. MIS Q. Exec. 2008, 6, 5. Available online: https://aisel.aisnet.org/misqe/vol6/iss3/5 (accessed on 12 September 2022).
  45. Donthu, N.; Kumar, S.; Pandey, N.; Gupta, P. Forty years of the International Journal of Information Management: A bibliometric analysis. Int. J. Inf. Manag. 2021, 57, 102307. [Google Scholar] [CrossRef]
  46. Donthu, N.; Kumar, S.; Mukherjee, D.; Pandey, N.; Lim, W.M. How to conduct a bibliometric analysis: An overview and guidelines. J. Bus. Res. 2021, 133, 285–296. [Google Scholar] [CrossRef]
  47. Paperpile. The Top List of Academic Research Databases. Available online: https://paperpile.com/g/academic-research-databases/ (accessed on 2 August 2023).
  48. Singh, V.K.; Singh, P.; Karmakar, M.; Leta, J.; Mayr, P. The journal coverage of Web of Science, Scopus and Dimensions: A comparative analysis. Scientometrics 2021, 126, 5113–5142. [Google Scholar] [CrossRef]
  49. Mongeon, P.; Paul-Hus, A. The journal coverage of Web of Science and Scopus: A comparative analysis. Scientometrics 2016, 106, 213–228. [Google Scholar] [CrossRef]
  50. Dantanarayana, G.; Wickramage, C.; Jayaweera, P. Framing services based on value activities in healthcare. In Proceedings of the 2014 14th International Conference on Advances in ICT for Emerging Regions (ICTer), Colombo, Sri Lanka, 10–13 December 2014; pp. 124–127. [Google Scholar] [CrossRef]
  51. Reichert, M.; Weber, B. Enabling Flexibility in Process-Aware Information Systems: Challenges, Methods, Technologies; Springer: Berlin/Heidelberg, Germany, 2012. [Google Scholar] [CrossRef]
  52. Van Eck, N.J. Methodological Advances in Bibliometric Mapping of Science. 2011. Available online: http://repub.eur.nl/pub/26509/EPS2011247LIS9789058922915.pdf (accessed on 10 March 2020).
  53. Moral-Munoz, J.A.; Herrera-Viedma, E.; Espejo, A.S.; Cobo, M.J. Software tools for conducting bibliometric analysis in science: An up-to-date review. Prof. Inf. 2020, 29, e290103. [Google Scholar] [CrossRef]
  54. Van Eck, N.J.; Waltman, L. VOSviewer v. 1.16.19; Centre for Science and Technology Studies, Leiden University: Leiden, The Netherlands, 2023; Available online: https://www.vosviewer.com (accessed on 20 March 2023).
  55. Van Eck, N.J.; Waltman, L. Measuring Scholarly Impact: Methods and Practice; Springer: Berlin/Heidelberg, Germany, 2014; pp. 285–320. [Google Scholar]
  56. Van Eck, N.J.; Waltman, L. VOSviewer Manual for VOSviewer Version 1.6.19; Univeristeit Leiden: Leiden, The Netherlands, 2023. [Google Scholar]
  57. WCED. Our Common Future. The United Nations World Commission on Environment and Development; Oxford University Press: Oxford, UK, 1987.
  58. UN. Transforming Our World: The 2030 Agenda for Sustainable Development. Available online: http://www.un.org/en/ga/70/resolutions.shtml (accessed on 15 June 2023).
  59. Olsson, D.; Gericke, N.; Sass, W.; Boeve-de Pauw, J. Self-perceived action competence for sustainability: The theoretical grounding and empirical validation of a novel research instrument. Environ. Educ. Res. 2020, 26, 742–760. [Google Scholar] [CrossRef]
  60. Le Blanc, D. Towards Integration at Last? The Sustainable Development Goals as a Network of Targets. Sustain. Dev. 2015, 23, 176–187. [Google Scholar] [CrossRef]
  61. Vladimirova, K.; Le Blanc, D. Exploring Links Between Education and Sustainable Development Goals Through the Lens of UN Flagship Reports. Sustain. Dev. 2016, 24, 254–271. [Google Scholar] [CrossRef]
  62. UNESCO. Education for Sustainable Development Goals: Learning Objectives; UNESCO: Paris, France, 2017. [Google Scholar]
  63. Mihardjo, L.; Sasmoko, S.; Alamsjah, F. The influence of digital customer experience and electronic word of mouth on brand 445 image and supply chain sustainable performance. Uncertain Supply Chain. Manag. 2019, 7, 691–702. [Google Scholar] [CrossRef]
  64. Westerman, G.; Calméjane, C.; Bonnet, D.; Ferraris, P.; McAfee, A. Digital transformation: A roadmap for billion-dollar organizations. MIT Cent. Digit. Bus. Capgemini Consult. 2011, 1, 1–68. Available online: https://www.capgemini.com/wp-content/uploads/2017/07/Digital_Transformation__A_Road-Map_for_Billion-Dollar_Organizations.pdf (accessed on 5 May 2023).
  65. Frank, A.G.; Dalenogare, L.S.; Ayala, N.F. Industry 4.0 technologies: Implementation patterns in manufacturing companies. Int. J. Prod. Econ. 2019, 210, 15–26. [Google Scholar] [CrossRef]
  66. NIKE. What to Know about Nike’s Stance on Tackling Climate Change. 2019. Available online: https://about.nike.com/en/newsroom/releases/nike-move-to-zero-climate-change-initiative (accessed on 5 July 2023).
  67. Hartman, S. Using a Comprehensive Digital Twin to Optimize Sustainability. 2022. Available online: https://blogs.sw.siemens.com/xcelerator/2022/10/17/using-a-comprehensive-digital-twin-to-optimize-sustainability/ (accessed on 5 July 2023).
  68. Schneider Electric. 2022 Sustainable Development Report. Available online: https://www.se.com/ww/en/assets/564/document/396659/2022-sustainability-report.pdf (accessed on 4 July 2023).
  69. Gensch, C.O.; Prakash, S. Is Digitalisation a Driver for Sustainability? In Sustainability in a Digital World, CSR, Sustainability, Ethics & Governance; Osburg, T., Lohrmann, C., Eds.; Springer: Berlin/Heidelberg, Germany, 2017. [Google Scholar]
  70. Scott, W. Environmental Education Research: 30 Years on From Tbilisi. Environ. Educ. Res. 2009, 15, 155–164. [Google Scholar] [CrossRef]
  71. Leicht, A.; Heiss, J.; Byun, W.J. Issues and Trends in Education for Sustainable Development; UNESCO Publishing: Paris, France, 2018. [Google Scholar]
  72. Mogensen, F.; Schnack, K. The Action Competence Approach and the ‘New’ Discourse of Education for Sustainable Development, Competence and Quality Criteria. Environ. Educ. Res. 2010, 16, 59–74. [Google Scholar] [CrossRef]
  73. Lotz-Sisitka, H.; Wals, A.E.; Kronlid, D.; McGarry, D. Transformative, Transgressive Social Learning: Rethinking Higher Education Pedagogy in Times of Systemic Global Dysfunction. Curr. Opin. Environ. Sustain. 2015, 16, 73–80. [Google Scholar] [CrossRef]
  74. Ellis, G.; Weekes, T. Making Sustainability ‘Real’: Using Group-Enquiry to Promote Education for Sustainable Development. Environ. Educ. Res. 2008, 14, 482–500. [Google Scholar] [CrossRef]
  75. Chawla, L.; Flanders Cushing, D. Education for Strategic Environmental Behavior. Environ. Educ. Res. 2007, 13, 437–452. [Google Scholar] [CrossRef]
  76. Clark, C.R. Collective Action Competence: An Asset to Campus Sustainability. Int. J. Sustain. High. Educ. 2016, 17, 559–578. [Google Scholar] [CrossRef]
  77. Bonazzi Piasentin, F.; Roberts, L. What Elements in a Sustainability Course Contribute to Paradigm Change and Action Competence? A study at Lincoln University, New Zealand. Environ. Educ. Res. 2018, 24, 694–715. [Google Scholar] [CrossRef]
  78. Jensen, B.B.; Schnack, K. The Action Competence Approach in Environmental Education. Environ. Educ. Res. 1997, 3, 163–178. [Google Scholar] [CrossRef]
  79. Breiting, S.; Mogensen, F. Action Competence and Environmental Education. Camb. J. Educ. 1999, 29, 349–353. [Google Scholar] [CrossRef]
  80. Kaplan, R.; Kaplan, S. Adolescents and the Natural Environment: A Time Out. In Children and Nature. Psychological, Sociocultural, and Evolutionary Investigations; Kahn, P.H., Kellert, S.R., Eds.; MIT Press: Boston, MA, USA, 2002; pp. 227–257. [Google Scholar]
  81. Kaplan, S.; Kaplan, R. Creating a larger role for environmental psychology: The Reasonable Person Model as an integrative framework. J. Environ. Psychol. 2009, 29, 329–339. [Google Scholar] [CrossRef]
  82. El-Mekawy, M.S.A.; Rusu, L.; Perjons, E. The Impact of Business-IT Alignment on Organizational Culture. In Proceedings of the 18th Pacific Asia Conference on Information Systems (PACIS 2014), Chengdu, China, 24–28 June 2014. [Google Scholar]
  83. Linnenluecke, M.K.; Griffith, A. Corporate sustainability and organizational culture. J. World Bus. 2010, 45, 357–366. [Google Scholar] [CrossRef]
  84. Grimm, J.H.; Hofstetter, J.S.; Sarkis, J. Exploring sub-suppliers’ compliance with corporate sustainability standards. J. Clean. Prod. 2016, 112, 1971–1984. [Google Scholar] [CrossRef]
  85. Crowe, S.; Cresswell, K.; Robertson, A.; Huby, G.; Avery, A.; Sheikh, A. The case study approach. BMC Med. Res. Methodol. 2011, 11, 100. [Google Scholar] [CrossRef]
  86. George, A.L.; Bennett, A. Case Studies and Theory Development in the Social Sciences; MIT Press: Cambridge, MA, USA; London, UK, 2005. [Google Scholar]
  87. Yin, R.K. Case Study Research, Design and Method; Sage Publications Ltd.: London, UK, 2009. [Google Scholar]
  88. Pearson, P.; Steven, A.; Howe, A.; Sheikh, A.; Ashcroft, D.; Smith, P. The Patient Safety Education Study Group. Learning about patient safety: Organisational context and culture in the education of healthcare professionals. J. Health Serv. Res. Policy 2010, 15, 4–10. [Google Scholar] [CrossRef]
  89. Stake, R.E. The Art of Case Study Research; Sage Publications Ltd.: London, UK, 1995. [Google Scholar]
  90. Venkatesh, V.; Brown, S.A.; Bala, H. Bridging the Qualitative-Quantitative Divide: Guidelines for Conducting Mixed Methods Research in Information Systems. MIS Q. 2013, 37, 21–54. Available online: http://www.jstor.org/stable/43825936 (accessed on 15 May 2022). [CrossRef]
  91. Bryman, A. Integrating Quantitative and Qualitative Research: How Is It Done? Qual. Inq. 2006, 6, 97–113. [Google Scholar] [CrossRef]
  92. Fetters, M.F.; Curry, L.A.; Creswell, J.W. Achieving Integration in Mixed Methods Designs—Principles and Practices. Health Serv. Res. 2013, 48, 2134–2156. [Google Scholar] [CrossRef] [PubMed]
  93. Johnson, R.B.; Onwuegbuzie, A.J.; Turner, L.A. Toward a Definition of Mixed Methods Research. J. Mix. Methods Res. 2007, 1, 112–133. [Google Scholar] [CrossRef]
  94. Venkatesh, V.; Brown, S.A.; Sullivan, Y.W. Guidelines for Conducting Mixed-methods Research: An Extension and Illustration. J. Assoc. Inf. Syst. 2016, 17, 435–495. [Google Scholar] [CrossRef]
  95. Teddlie, C.; Tashakkori, A. Major Issues and Controversies in the Use of Mixed Methods in the Social and Behavioral Sciences. In Handbook of Mixed Methods in Social and Behavioral Research; Tashakkori, A., Teddlie, C., Eds.; Sage Publications: Thousand Oaks, CA, USA, 2003; pp. 3–50. [Google Scholar]
  96. Teddlie, C.; Tashakkori, A. The Foundations of Mixed Methods Research: Integrating Quantitative and Qualitative Techniques in the Social and Behavioral Sciences; Sage: Thousand Oaks, CA, USA, 2009. [Google Scholar]
  97. Chen, L. Business-IT Alignment Maturity of Companies in China. Inf. Manag. 2010, 47, 9–16. [Google Scholar] [CrossRef]
  98. Tabachnick, G.B.; Fidell, L.S. Using Multivariate Statistics; Pearson: Boston, MA, USA, 2013. [Google Scholar]
  99. Henseler, J.; Hubona, G.; Ray, P.A. Using PLS path modelling in new technology research: Updated guidelines. Ind. Manag. Data Syst. 2016, 116, 2–20. [Google Scholar] [CrossRef]
  100. Sarstedt, M.; Ringle, C.M.; Hair, J.F. Partial Least Squares Structural Equation Modeling. In Handbook of Market Research; Homburg, C., Klarmann, M., Vomberg, A.E., Eds.; Springer: Cham, Switzerland, 2021. [Google Scholar] [CrossRef]
  101. Garson, G.D. Partial Least Squares: Regression and Structural Equation Models; Statistical Associates Publishers: Asheboro, NC, USA, 2016. [Google Scholar]
  102. Chin, W.W. Issues and opinion on structural equation modelling. MIS Q. 1998, 22, 7–16. Available online: https://www.jstor.org/stable/249674 (accessed on 2 April 2015).
  103. Wold, H. Soft Modeling: The Basic Design and Some Extensions, Systems under Indirect Observations; Elsevier: Amsterdam, The Netherlands, 1982; pp. 1–52. [Google Scholar]
  104. Ringle, C.M.; Wende, S.; Becker, J.-M. SmartPLS 4. SmartPLS GmbH: Oststeinbek. 2022. Available online: http://www.smartpls.com (accessed on 5 February 2023).
  105. Hair, J.F.; Risher, J.J.; Sarstedt, M.; Ringle, C.M. When to use and how to report the results of PLS-SEM. Eur. Bus. Rev. 2019, 31, 2–24. [Google Scholar] [CrossRef]
  106. Crocetta, C.; Antonucci, L.; Cataldo, R.; Galasso, R.; Grassia, M.G.; Lauro, C.N. Higher-Order PLS-PM Approach for Different Types of Constructs. Soc. Indic. Res. 2021, 154, 725–754. [Google Scholar] [CrossRef]
  107. Sarstedt, M.; Hair, J.F., Jr.; Cheah, J.H.; Becker, J.M.; Ringle, C.M. How to specify, estimate, and validate higher-order constructs in PLS-SEM. Australas. Mark. J. 2019, 27, 197–211. [Google Scholar] [CrossRef]
  108. Hair, J.F.; Ringle, C.M.; Sarstedt, M. PLS-SEM: Indeed a silver bullet. J. Mark. Theory Pract. 2011, 19, 139–152. [Google Scholar] [CrossRef]
  109. Peng, D.X.; Lai, F. Using partial least squares in operations management research: A practical guideline and summary of past research. J. Oper. Manag. 2012, 30, 467–480. [Google Scholar] [CrossRef]
  110. Fornell, C.; Larcker, D.F. Evaluating structural equation models with unobservable variables and measurements errors. J. Mark. Res. 1981, 18, 39–50. [Google Scholar] [CrossRef]
  111. Henseler, J.; Ringle, C.M.; Sarstedt, M. A new criterion for assessing discriminant validity in variance-based structural equation modeling. J. Acad. Mark. Sci. 2015, 43, 115–135. [Google Scholar] [CrossRef]
  112. Hair, J.F., Jr.; Hult, G.T.M.; Ringle, C.M.; Sarstedt, M. A Primer on Partial Least Squares Structural Equation Modelling (PLS-SEM); Sage Publications: Thousand Oaks, CA, USA, 2014. [Google Scholar]
  113. Cohen, J. Statistical Power Analysis for the Behavioral Sciences, 2nd ed.; Routledge: New York, NY, USA, 1988. [Google Scholar]
  114. Hu, L.-T.; Bentler, P.M. Fit Indices in Covariance Structure Modeling: Sensitivity to Underparameterized Model Misspecification. Psychol. Methods 1998, 3, 424–453. [Google Scholar] [CrossRef]
  115. McIntosh, M.J.; Morse, J.M. Situating and Constructing Diversity in Semi-Structured Interviews. Glob. Qual. Nurs. Res. 2015, 2, 1–12. [Google Scholar] [CrossRef] [PubMed]
  116. Holstein, J.A.; Gubrium, J.F. Context: Working it up, down and across. In Qualitative Research Practice; Seale, C., Silverman, D., Gubrium, J.F., Gobo, G., Eds.; SAGE Publications Ltd.: London, UK, 2003; pp. 297–311. [Google Scholar]
  117. Baškarada, S. Qualitative Case Study Guidelines. Qual. Rep. 2014, 19, 1–25. Available online: https://ssrn.com/abstract=2559424 (accessed on 10 December 2022). [CrossRef]
  118. Campion, M.A.; Pursell, E.D.; Brown, B.K. Structured interviewing: Raising the psychometric properties of the employment interview. Pers. Psychol. 1988, 41, 25–42. [Google Scholar] [CrossRef]
  119. Pettersen, N.; Durivage, A. The Structured Interview: Enhancing Staff Selection; PUQ: Quebec, QC, Canada, 2008. [Google Scholar]
  120. Kock, N.; Hadaya, P. Minimum sample size estimation in PLS-SEM: The inverse square root and gamma-exponential methods. Inf. Syst. J. 2018, 28, 227–261. [Google Scholar] [CrossRef]
  121. Lundblad, J.P. A Review and Critique of Rogers’ Diffusion of Innovation Theory as it Applies to Organizations. Organ. Dev. J. 2003, 21, 50–64. [Google Scholar]
  122. Lu, F.; Hu, Y.; Bi, H.; Huang, M.; Zhao, M. An Auction Approach for Cost and Schedule Management of IT Outsourcing Project. Asia-Pac. J. Oper. 2018, 35, 1850034. [Google Scholar] [CrossRef]
  123. Lu, F.; Yan, T.; Bi, H.; Feng, M.; Wang, S.; Huang, M. A bilevel whale optimization algorithm for risk management scheduling of information technology projects considering outsourcing. Knowl.-Based Syst. 2022, 235, 107600. [Google Scholar] [CrossRef]
Figure 1. The timeline of issued documents on the Scopus database, 10 June 2023, with the keywords “business IT alignment”.
Sustainability 15 12519 g001
Figure 2. Timeline-component-based bibliometric mapping, based on the Scopus database, 10 June 2023, keywords “business IT alignment”. (Source: authors’ research, based on Scopus data).
Sustainability 15 12519 g002
Figure 3. The timeline of published documents on the Scopus database, 25 June 2023, with the keywords “mixed methods research”.
Sustainability 15 12519 g003
Figure 4. A conceptual research model for quantitative research.
Sustainability 15 12519 g004
Figure 5. A methodological diagram of the MMR approach.
Sustainability 15 12519 g005
Figure 6. Structural model results.
Sustainability 15 12519 g006
Figure 7. Spider web presentation of BITA factors by employees and organisation.
Sustainability 15 12519 g007
Table 1. Descriptive statistics and outer loadings of indicators.
FactorsIndicatorsMeanMedianMinMaxStandard DeviationIndicator Loadings
01_CommunicationG06Q01_SQ0073.5774251.0440.893
G06Q01_SQ0083.6544250.9980.726
G06Q01_SQ0094.0004250.8320.759
G06Q01_SQ0113.2694151.0210.822
02_CompentencyG06Q01_SQ0124.1544250.6620.900
G06Q01_SQ0133.9624350.5870.894
03_GovernanceG06Q01_SQ0153.9624250.7590.856
G06Q01_SQ0183.8464250.8180.902
04_ParnershipG06Q01_SQ0194.1924350.6210.934
G06Q01_SQ0203.8854250.8000.932
05_Scope&ArchitectureG06Q01_SQ0233.6154250.9640.920
G06Q01_SQ0253.2693250.9010.944
06_SkillsG06Q01_SQ0283.8854250.7510.931
G06Q01_SQ0293.7314150.8570.929
07_KAPG05Q01_SQ0204.0384250.8540.957
G05Q01_SQ0214.1544250.8630.950
G05Q01_SQ0224.0384250.8540.993
08_COIG05Q01_SQ0233.8854250.9740.942
G05Q01_SQ0244.1154250.6980.873
G05Q01_SQ0253.9624250.7590.891
G05Q01_SQ0264.1154250.8470.750
09_WAG05Q01_SQ0274.2694350.5920.824
G05Q01_SQ0284.2314350.5760.889
G05Q01_SQ0294.0774250.8280.897
G05Q01_SQ0304.0774350.6150.904
Table 2. First-order construct reliability and validity.
FactorsCronbach’s αCRAVER2
01_Communication0.8140.8780.6440.731
02_Competency0.7570.8920.8050.559
03_Governance0.7080.8720.7730.730
04_Partnership0.8510.9310.8700.729
05_Scope_Architecture0.8500.9300.8690.441
06_Skills0.8430.9270.8640.687
07_KAP0.9650.9770.9350.686
08_Confidence0.8870.9230.7510.872
09_WA0.9010.9310.7730.800
Legend: Cronbach’s α—Cronbach’s alpha; CR—composite reliability; AVE—average variance extracted; R2—coefficient of determination.
Table 3. Discriminant validity of first-order factors.
HTMT
Factors010203040506070809
01_Communication
02_Competency0.624
03_Governance0.8670.894
04_Partnership0.7250.7670.849
05_Scope_Architecture0.6500.4820.5150.597
06_Skills0.7320.6590.9300.8380.480
07_KAP0.4960.3160.2450.5090.3800.298
08_COI0.7100.7480.8220.7520.5440.6530.735
09_WA0.6320.6320.7650.5720.2990.3970.6150.868
Fornell–Larcker Criterion
Factors010203040506070809
01_Communication0.803
02_Competency0.5030.897
03_Governance0.6620.6570.879
04_Partnership0.6180.6160.6670.933
05_Scope_Architecture0.5530.3920.4230.5130.932
06_Skills0.6210.5270.7210.7090.4080.930
07_KAP0.4420.2680.2010.4600.3450.2670.967
08_COI0.6080.6100.6510.6610.4810.5690.6810.867
09_WA0.5310.5220.6070.5040.2680.3460.5760.7750.879
Legend: numbers in bold italics represent the square root of AVE.
Table 4. Factor loadings, reliability, AVE, t-values, and f-values for the latent variable (second-order factors).
LV ScoresOuter Loadingst-ValuesCronbach’s αCRAVER2f-Values
01_Communication ⟵ BITA0.82713.2220.8890.9160.648 2.724
02_Competency ⟵ BITA0.7747.6021.267
03_Governance ⟵ BITA0.86613.3272.699
04_Partnership ⟵ BITA0.86416.0652.692
05_Scope_Architecture ⟵ BITA0.6564.4880.788
06_Skills ⟵ BITA0.8246.1322.193
07_KAP ⟵ SPACS0.8059.9280.8630.9150.7830.4712.180
08_COI ⟵ SPACS0.94754.5736.824
09_WA ⟵ SPACS0.89722.7033.991
Legend: PS—perceived sustainability; Cronbach’s α—Cronbach’s alpha; CR—composite reliability; AVE—average variance extracted; R2—coefficient of determination. All p-values are significance level 1% (p < 0.001).
Table 5. Discriminant validity of second-order factors.
HTMT
BITASPACS
BITA
SPACS0.744
Fornell–Larcker Criterion
BITASPACS
BITA0.805
SPACS0.6860.885
Legend: numbers in bold italics represent the square root of AVE.
Table 6. t-values and f-values of dependent variables.
RelationshipsβMSTDEVt-Valuesp-Valuesf-Values
Relationships Between First-Order and Second-Order Factors
H1.1: BITA ⟶ Communication0.8550.8670.03921.9870.0002.724
H1.2: BITA ⟶ Competency0.7480.7370.1057.1180.0001.267
H1.3: BITA ⟶ Governance0.8540.8550.05715.0610.0002.699
H1.4: BITA ⟶ Partnership0.8540.8580.05715.0720.0002.692
H1.5: BITA ⟶ Scope & Architect.0.6640.6710.1265.2530.0000.788
H1.6: BITA ⟶ Skills0.8290.8090.0968.6310.0002.193
SPACS ⟶ KAP0.8280.8370.05415.3050.0002.180
SPACS ⟶ COI0.9340.9380.02438.4780.0006.824
SPACS ⟶ WA0.8940.9000.04320.6320.0003.991
Relationship Between Second-Order Factors
H1: BITA ⟶ SPACS0.6860.7100.0858.0280.0000.890
Legend: PS—perceived sustainability; M—sample mean; STDEV—standard deviation.
Table 7. BITA maturity levels.
Maturity LevelCommunicationCompetency/ValueGovernancePartnershipScope and ArchitectureSkills
Level 1Business/IT lack of understandingSome technical measurementsNo formal process, cost centre, reactive prioritiesConflict; IT a cost of doing businessTraditional (e.g., acting, email)IT takes the risk, little reward; technical training
Level 2Limited business/IT understandingFunctional cost efficiencyTactical at the functional level, occasionally responsiveIT emerging as an asset; process enablerTransaction (e.g., ESS, DSS)Differs across functional organisations
Level 3Good understanding; emerging relaxedSome cost effectiveness; dashboard establishedRelevant processes across the organisationIT is seen as an asset, process driverIntegrated across the organisationEmerging value service provider
Level 4Bonding unifiedCost-effective; some partner value; dashboard managedManaged across the organisationIT enables/drives business strategyIntegrated with partnersShared risk and rewards
Level 5Informal, pervasiveExtended to external partnersIntegrated across the organisation and partnersIT-business co-adaptiveEvolve with partnersEducation/careers/rewards across the organisation
Note: adapted from Luftman [42].
Disclaimer/Publisher’s Note: The statements, opinions and data contained in all publications are solely those of the individual author(s) and contributor(s) and not of MDPI and/or the editor(s). MDPI and/or the editor(s) disclaim responsibility for any injury to people or property resulting from any ideas, methods, instructions or products referred to in the content.

