

Deformation Characteristics of Rubber Waste Powder–Clay Mixtures


Abstract
:1. Introduction
2. Materials and Methods
2.1. Materials
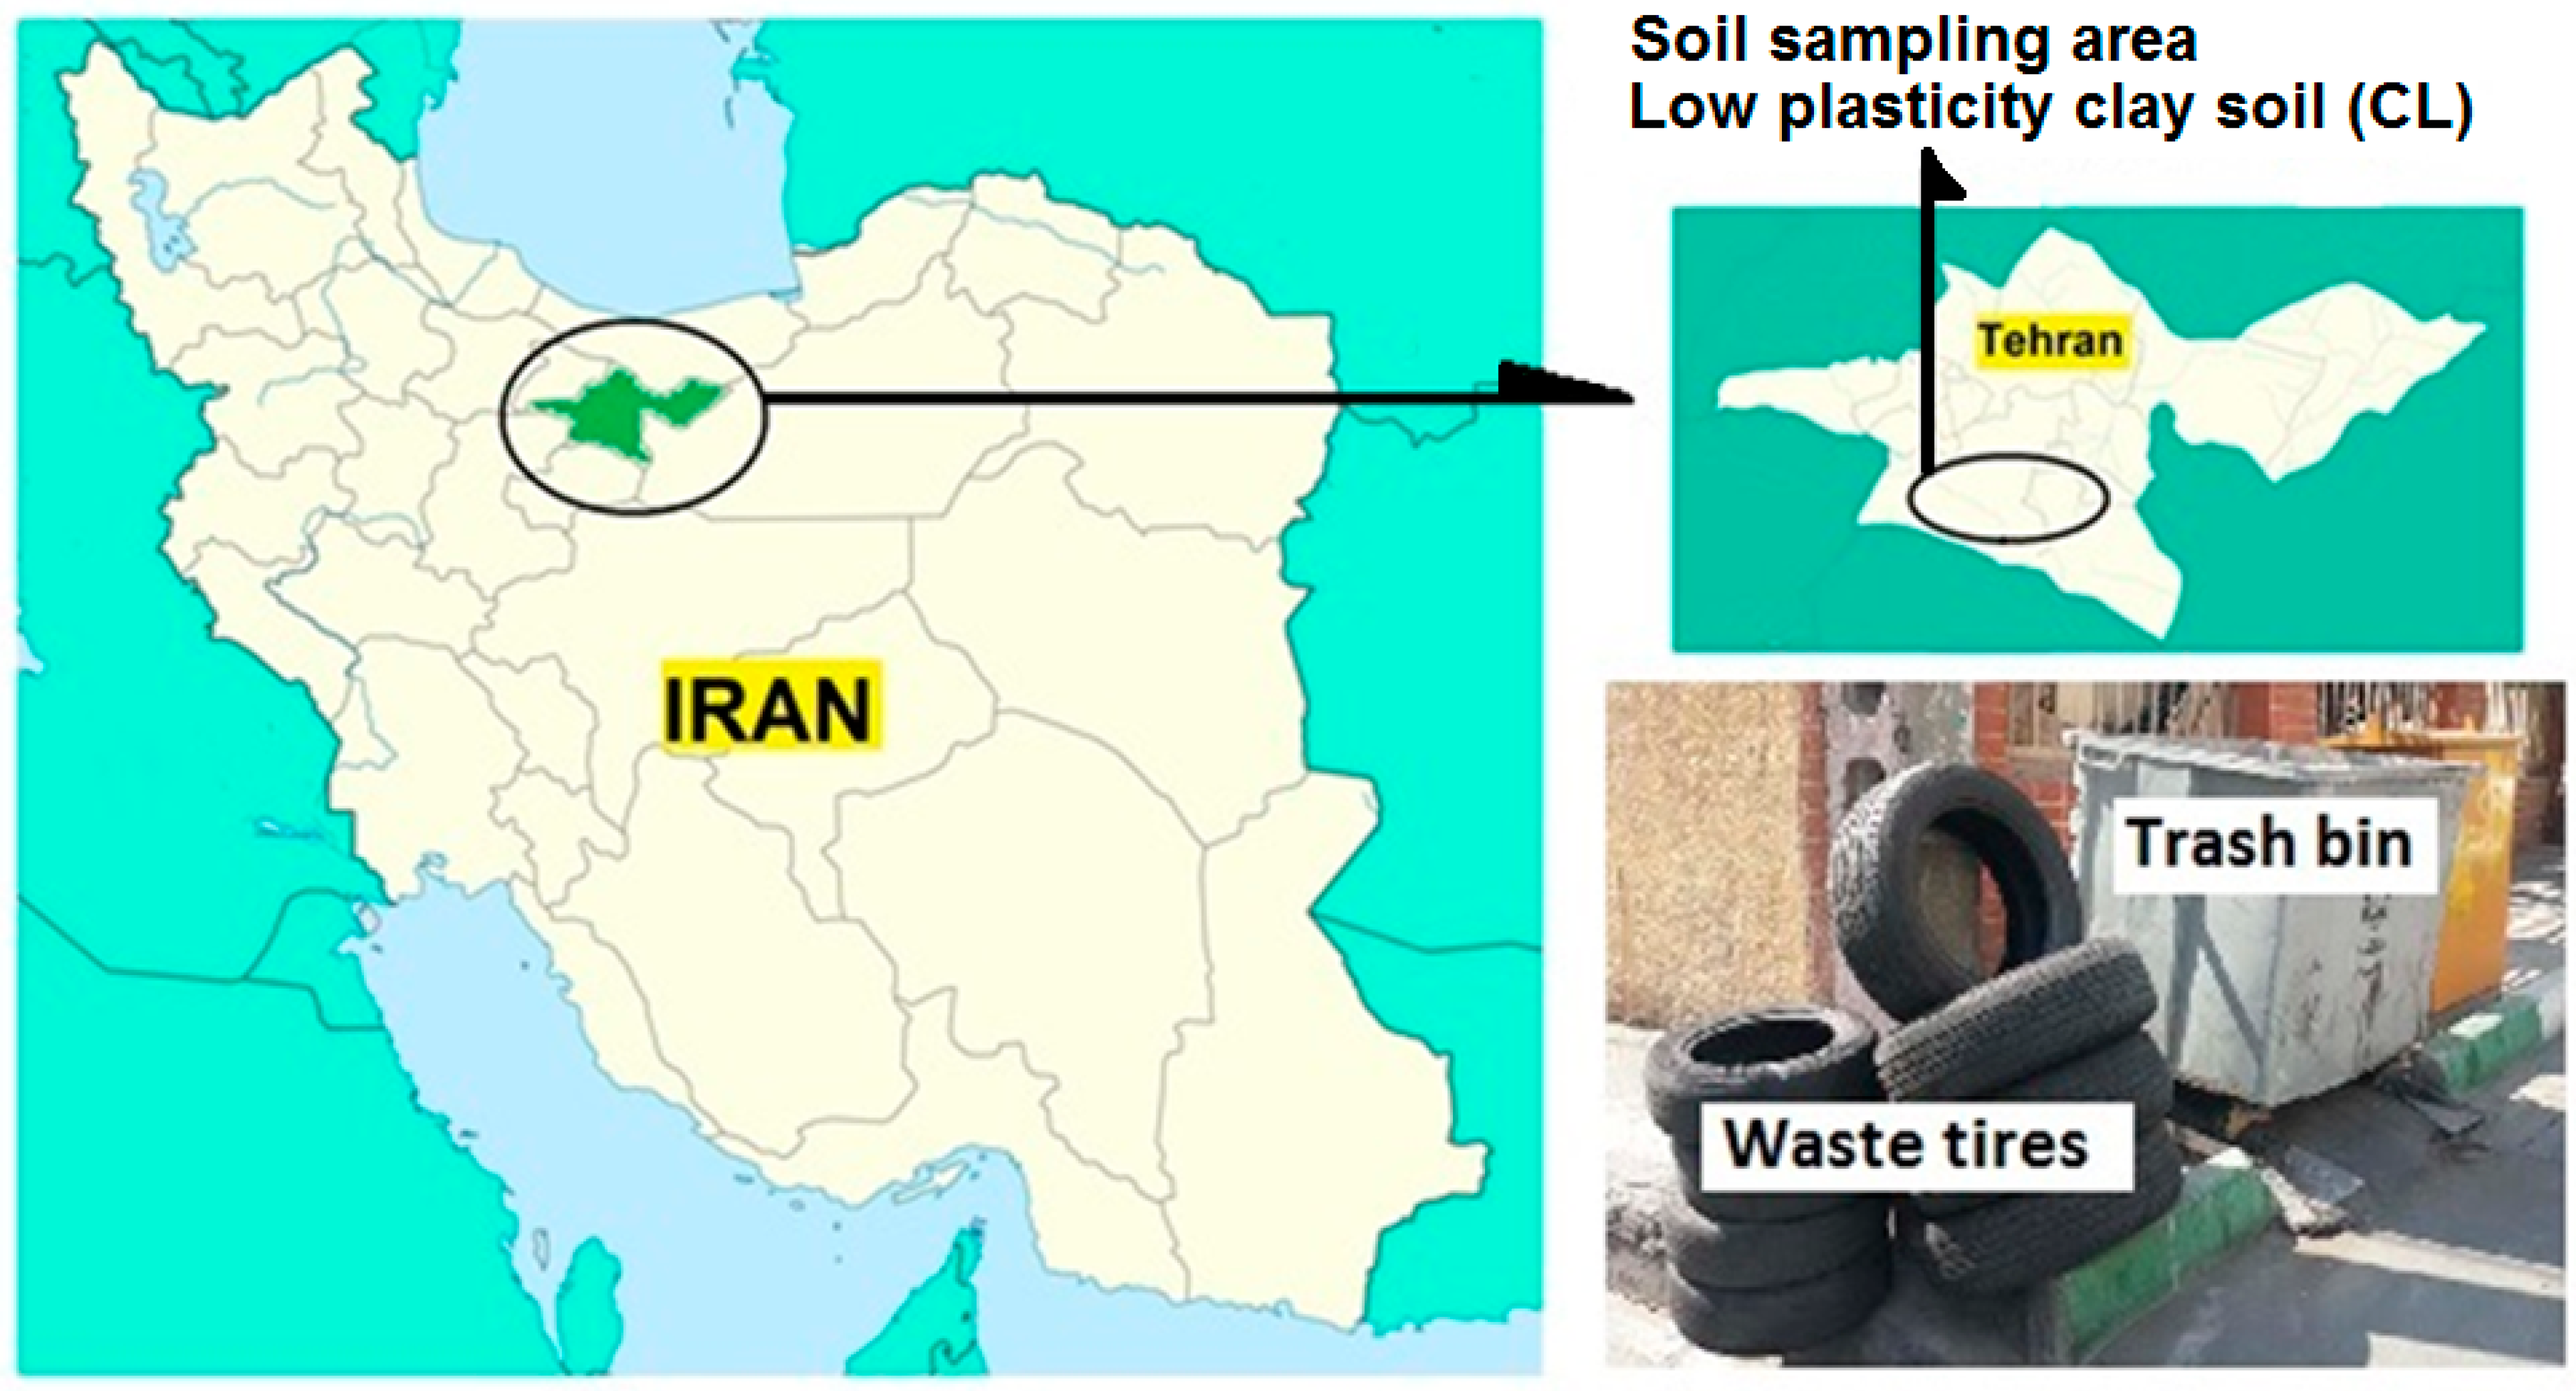
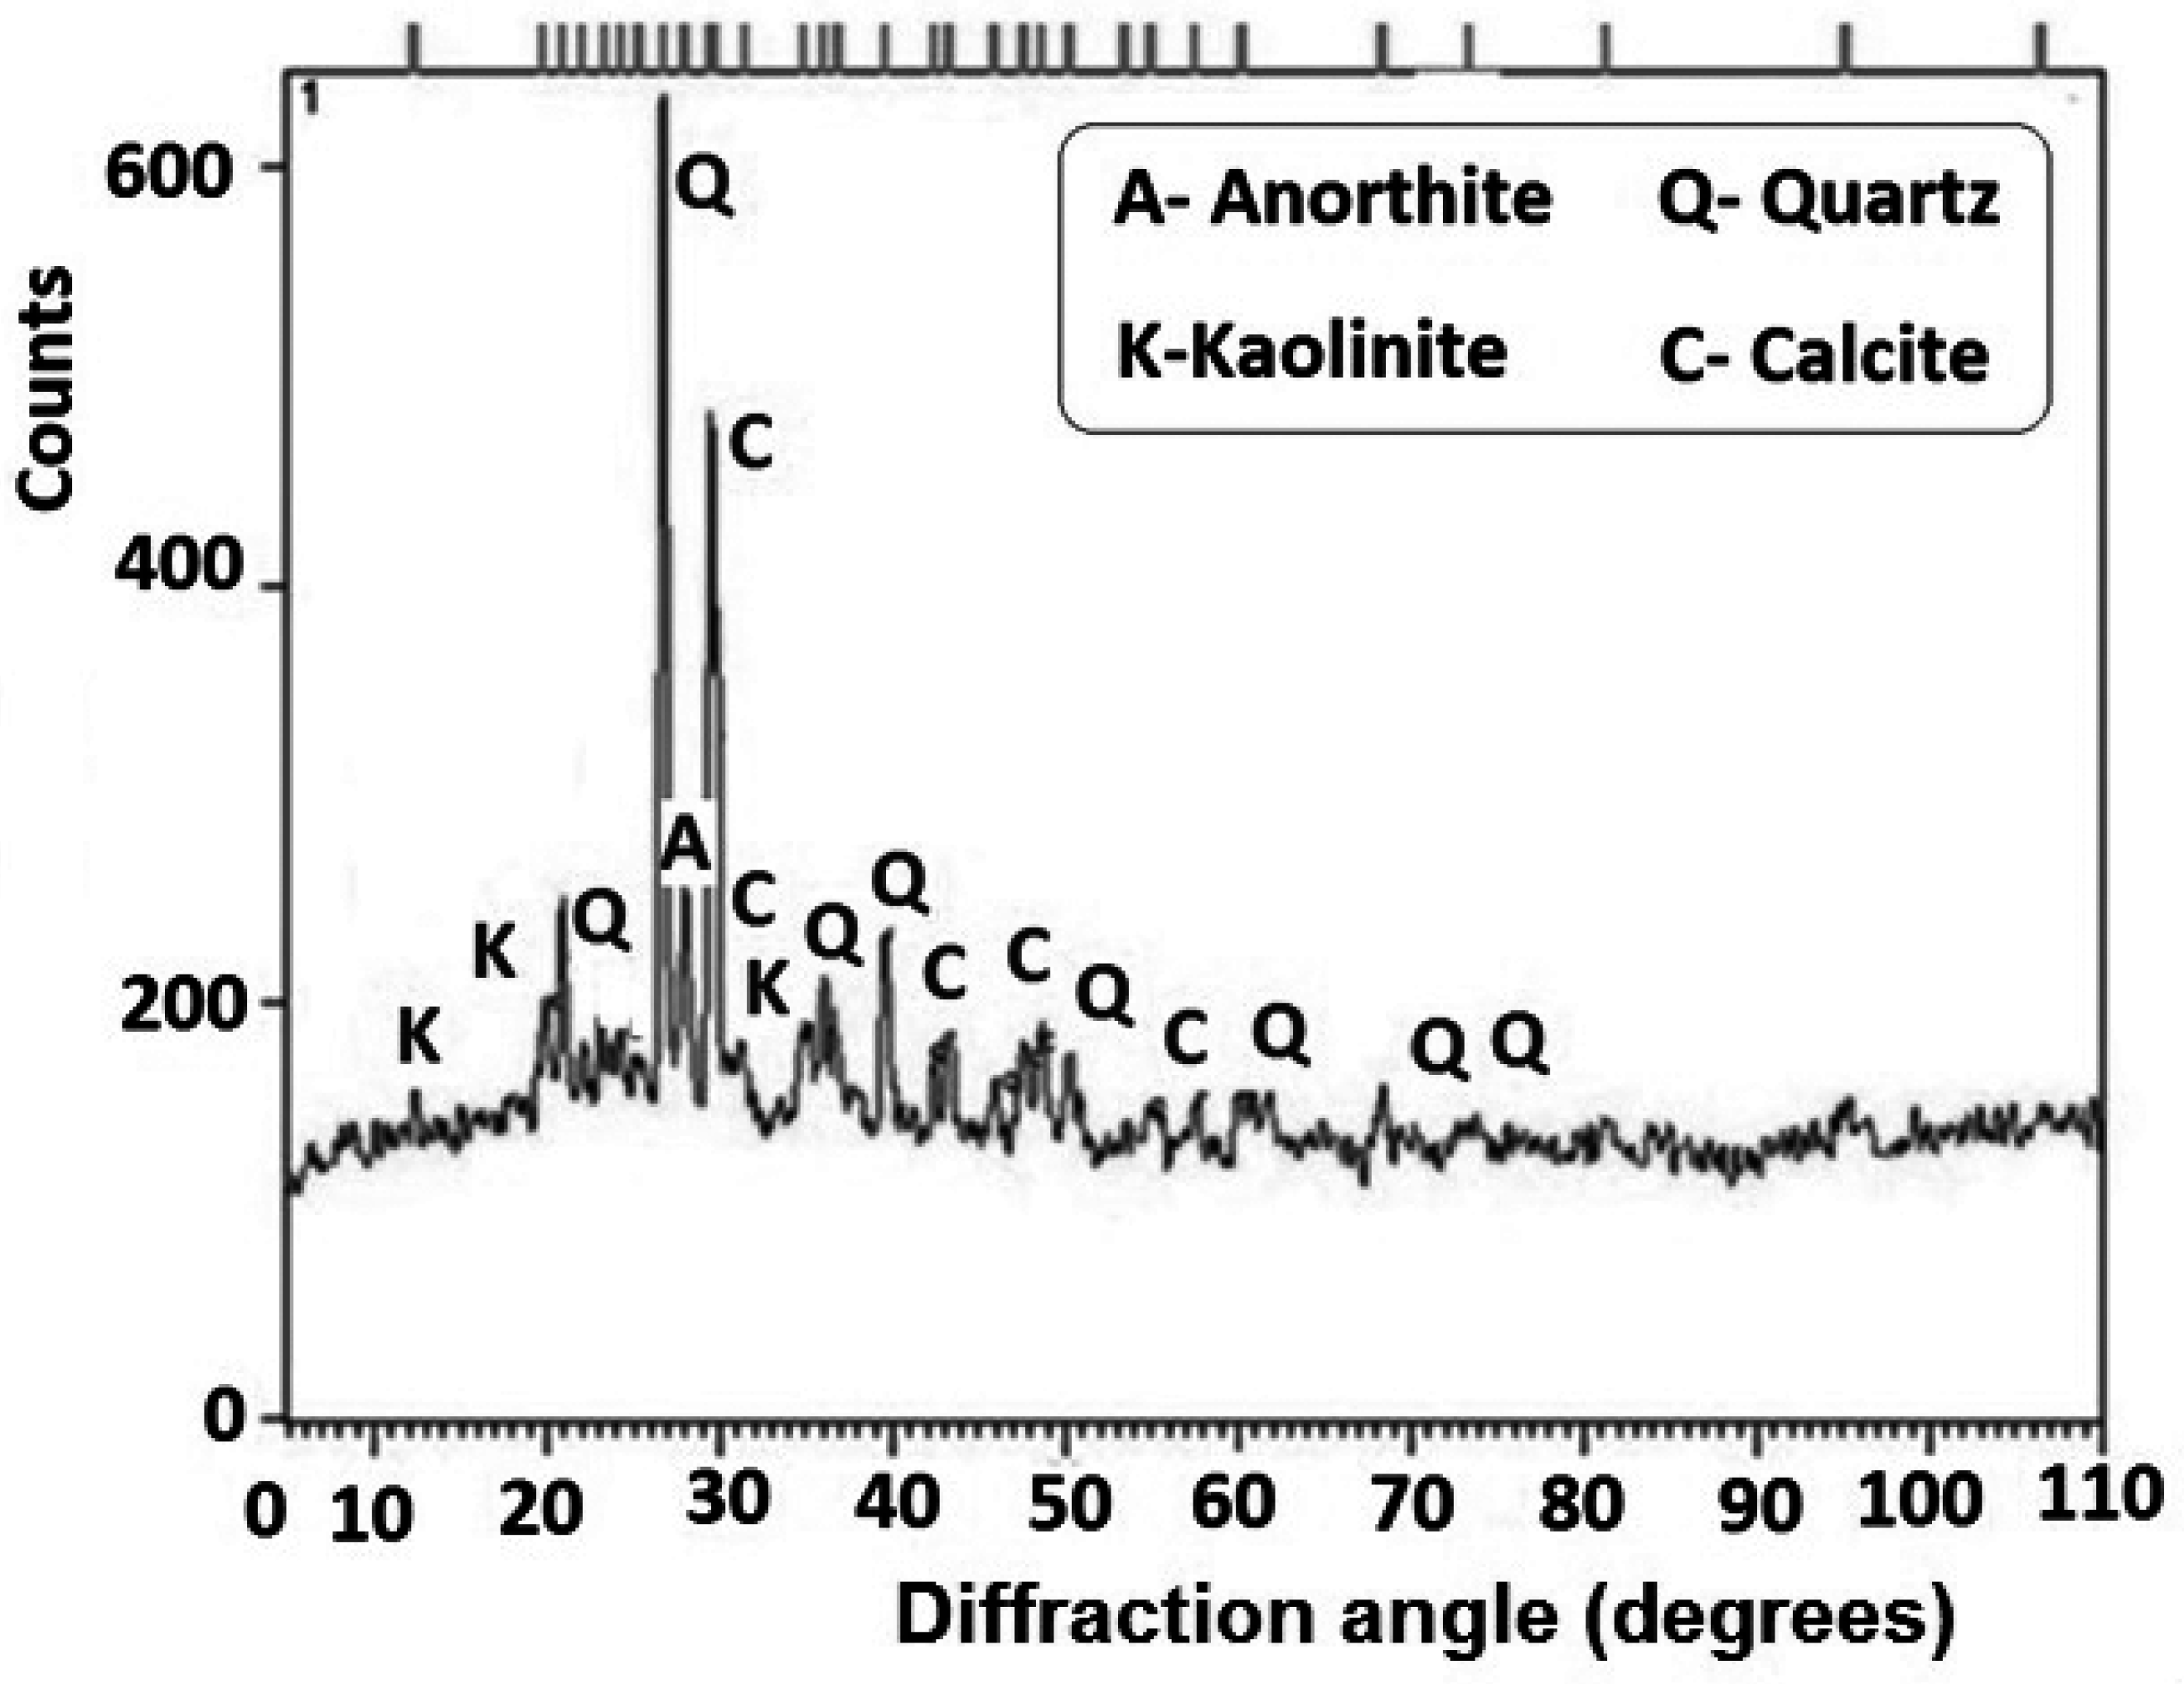
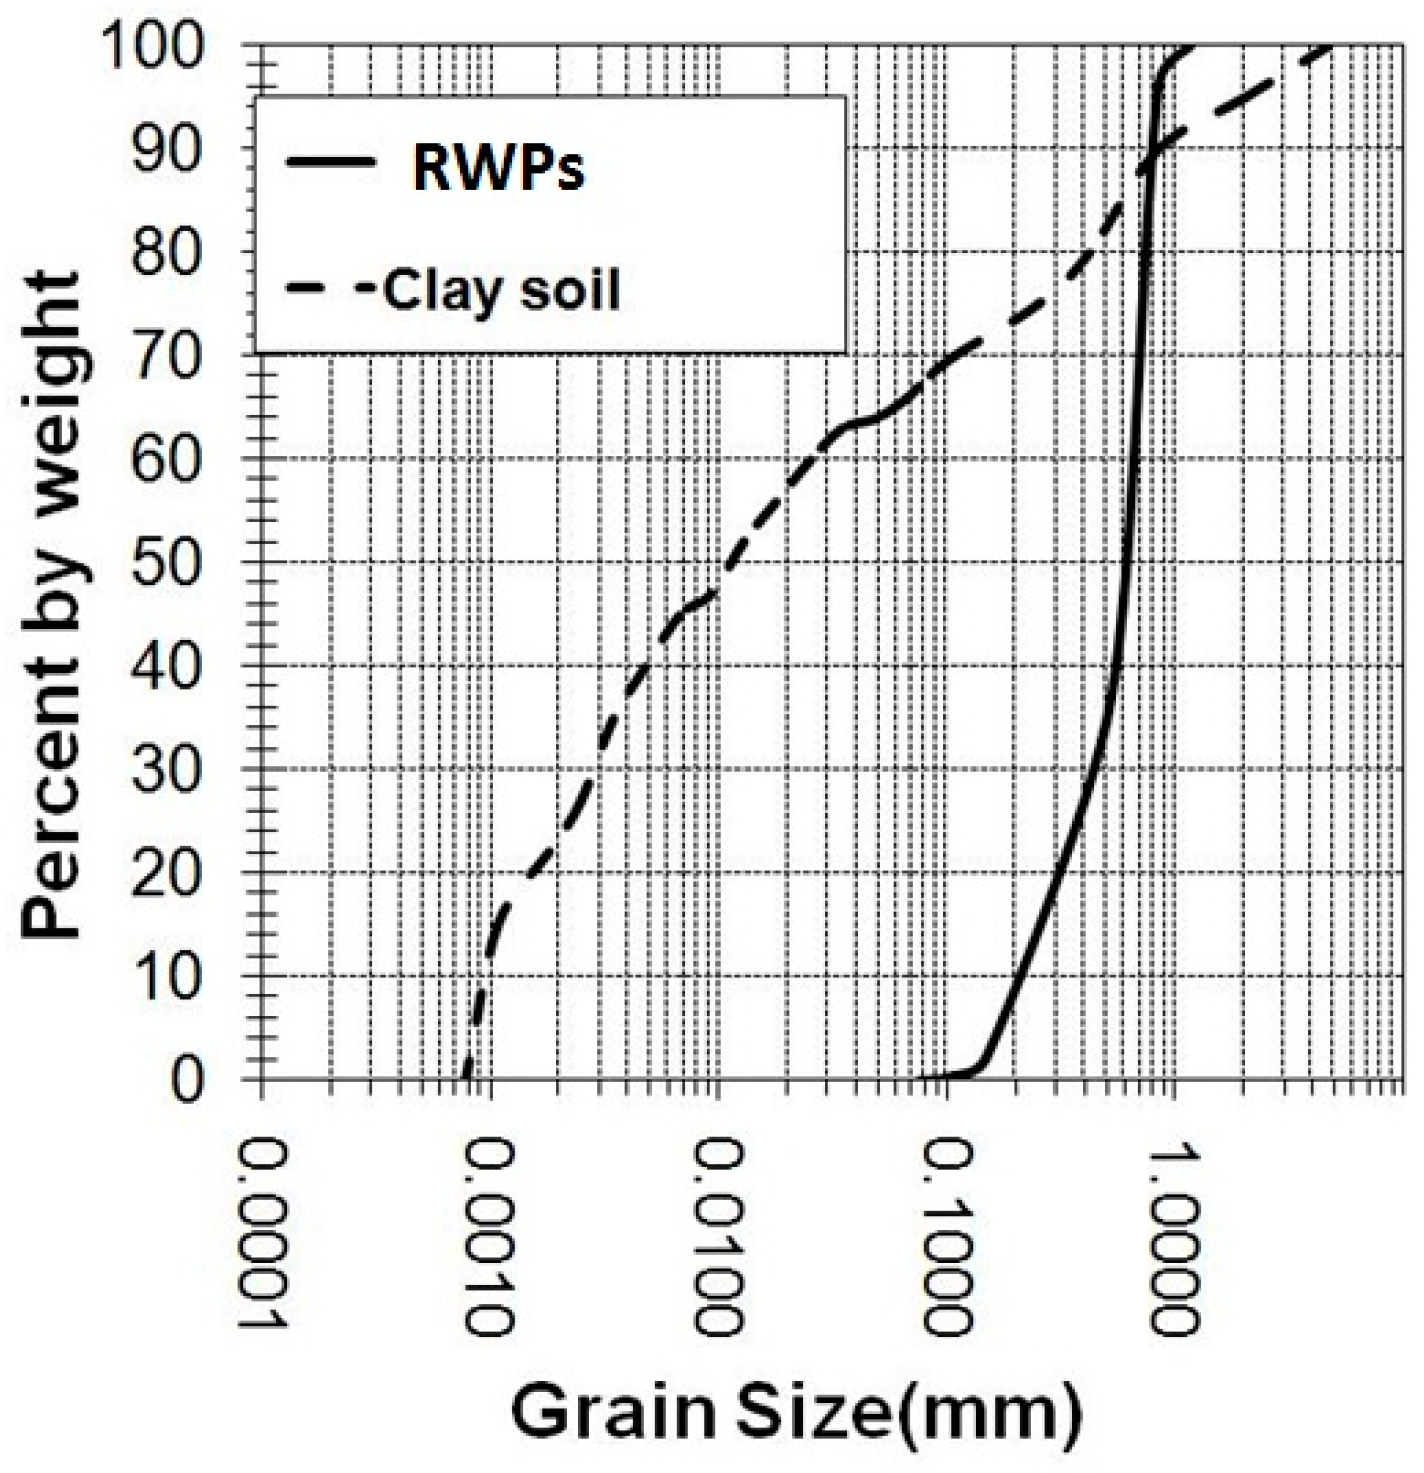
2.1.1. Tehran Clay (CS)

| Geotechnical Properties of CS | ||
| Properties | ASTM Standard | Values |
| Specific gravity | D 854 [38] | 2.65 |
| Liquid limit (%) | D 4318 [39] | 34 |
| Plastic limit (%) | D 4318 [39] | 14 |
| Plasticity index (%) | D 4318 [39] | 20 |
| Soil type (USCS) | D 2487 [37] | CL |
| Maximum dry unit weight (kN/m3) | D698 [40] | 16.3 |
| Optimum moisture content (%) | D698 [40] | 18.5 |
| Fine percent (%) | D422 [36] | 65% |
| Chemical Composition of CS | ||
| Chemical Components | Percentage (%) | Test Type |
| SiO2 | 55 | XRF |
| Al2O3 | 10.5 | |
| Fe2O3 | 8 | |
| CaO | 18.6 | |
| MgO | 5.4 | |
| L.O.I (loss of ignition) | 2.5 | |
| Chemical Composition of RWPs | ||
| Components | Percentage (%) | Test Type |
| Carbone | 86.8 | XRF |
| Oxygen | 9.3 | |
| Zink | 1.95 | |
| Sulfur | 1.4 | |
| Magnesium | 0.23 | |
| Aluminum | 0.12 | |
| Silicon | 0.2 | |
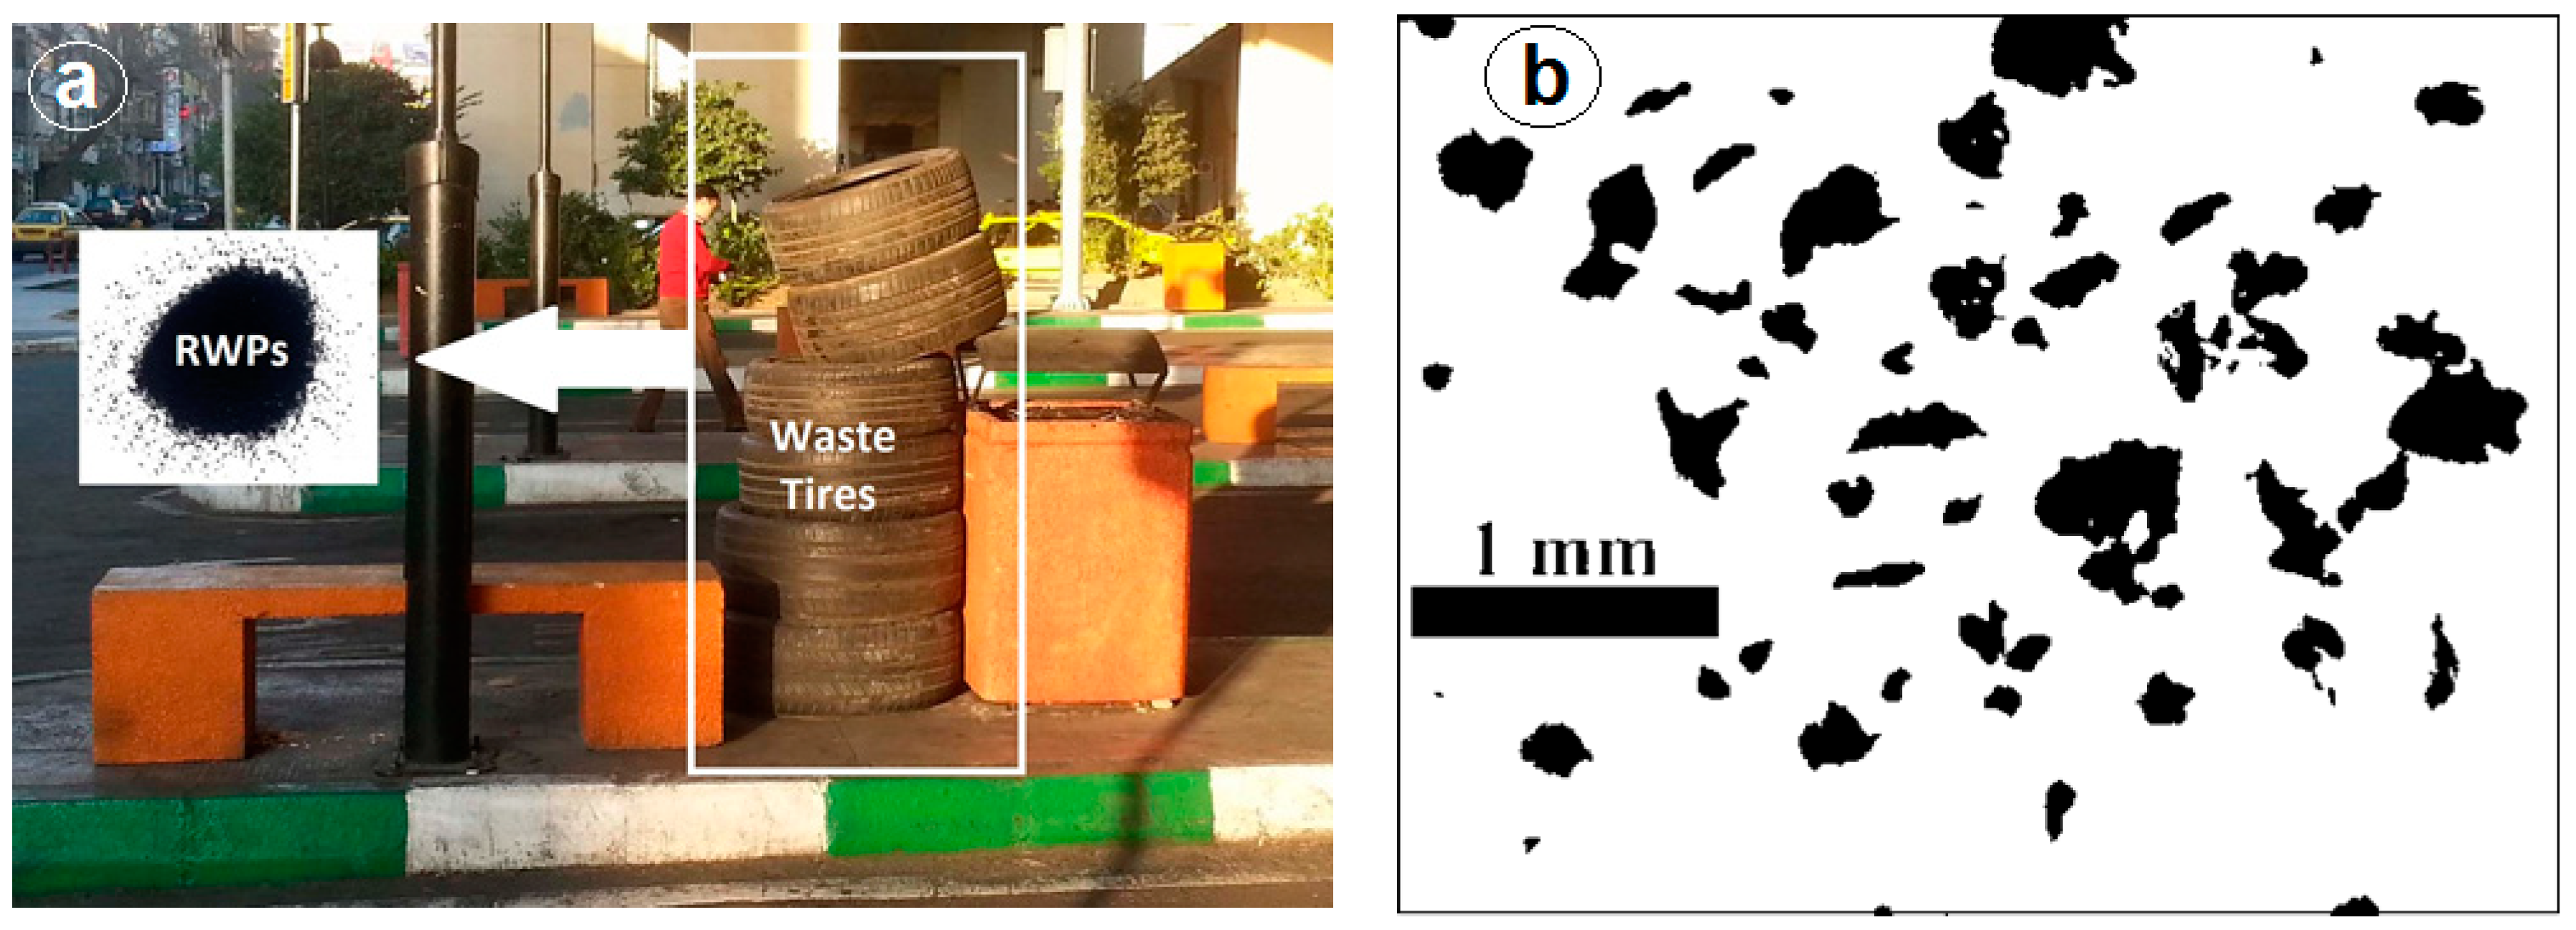
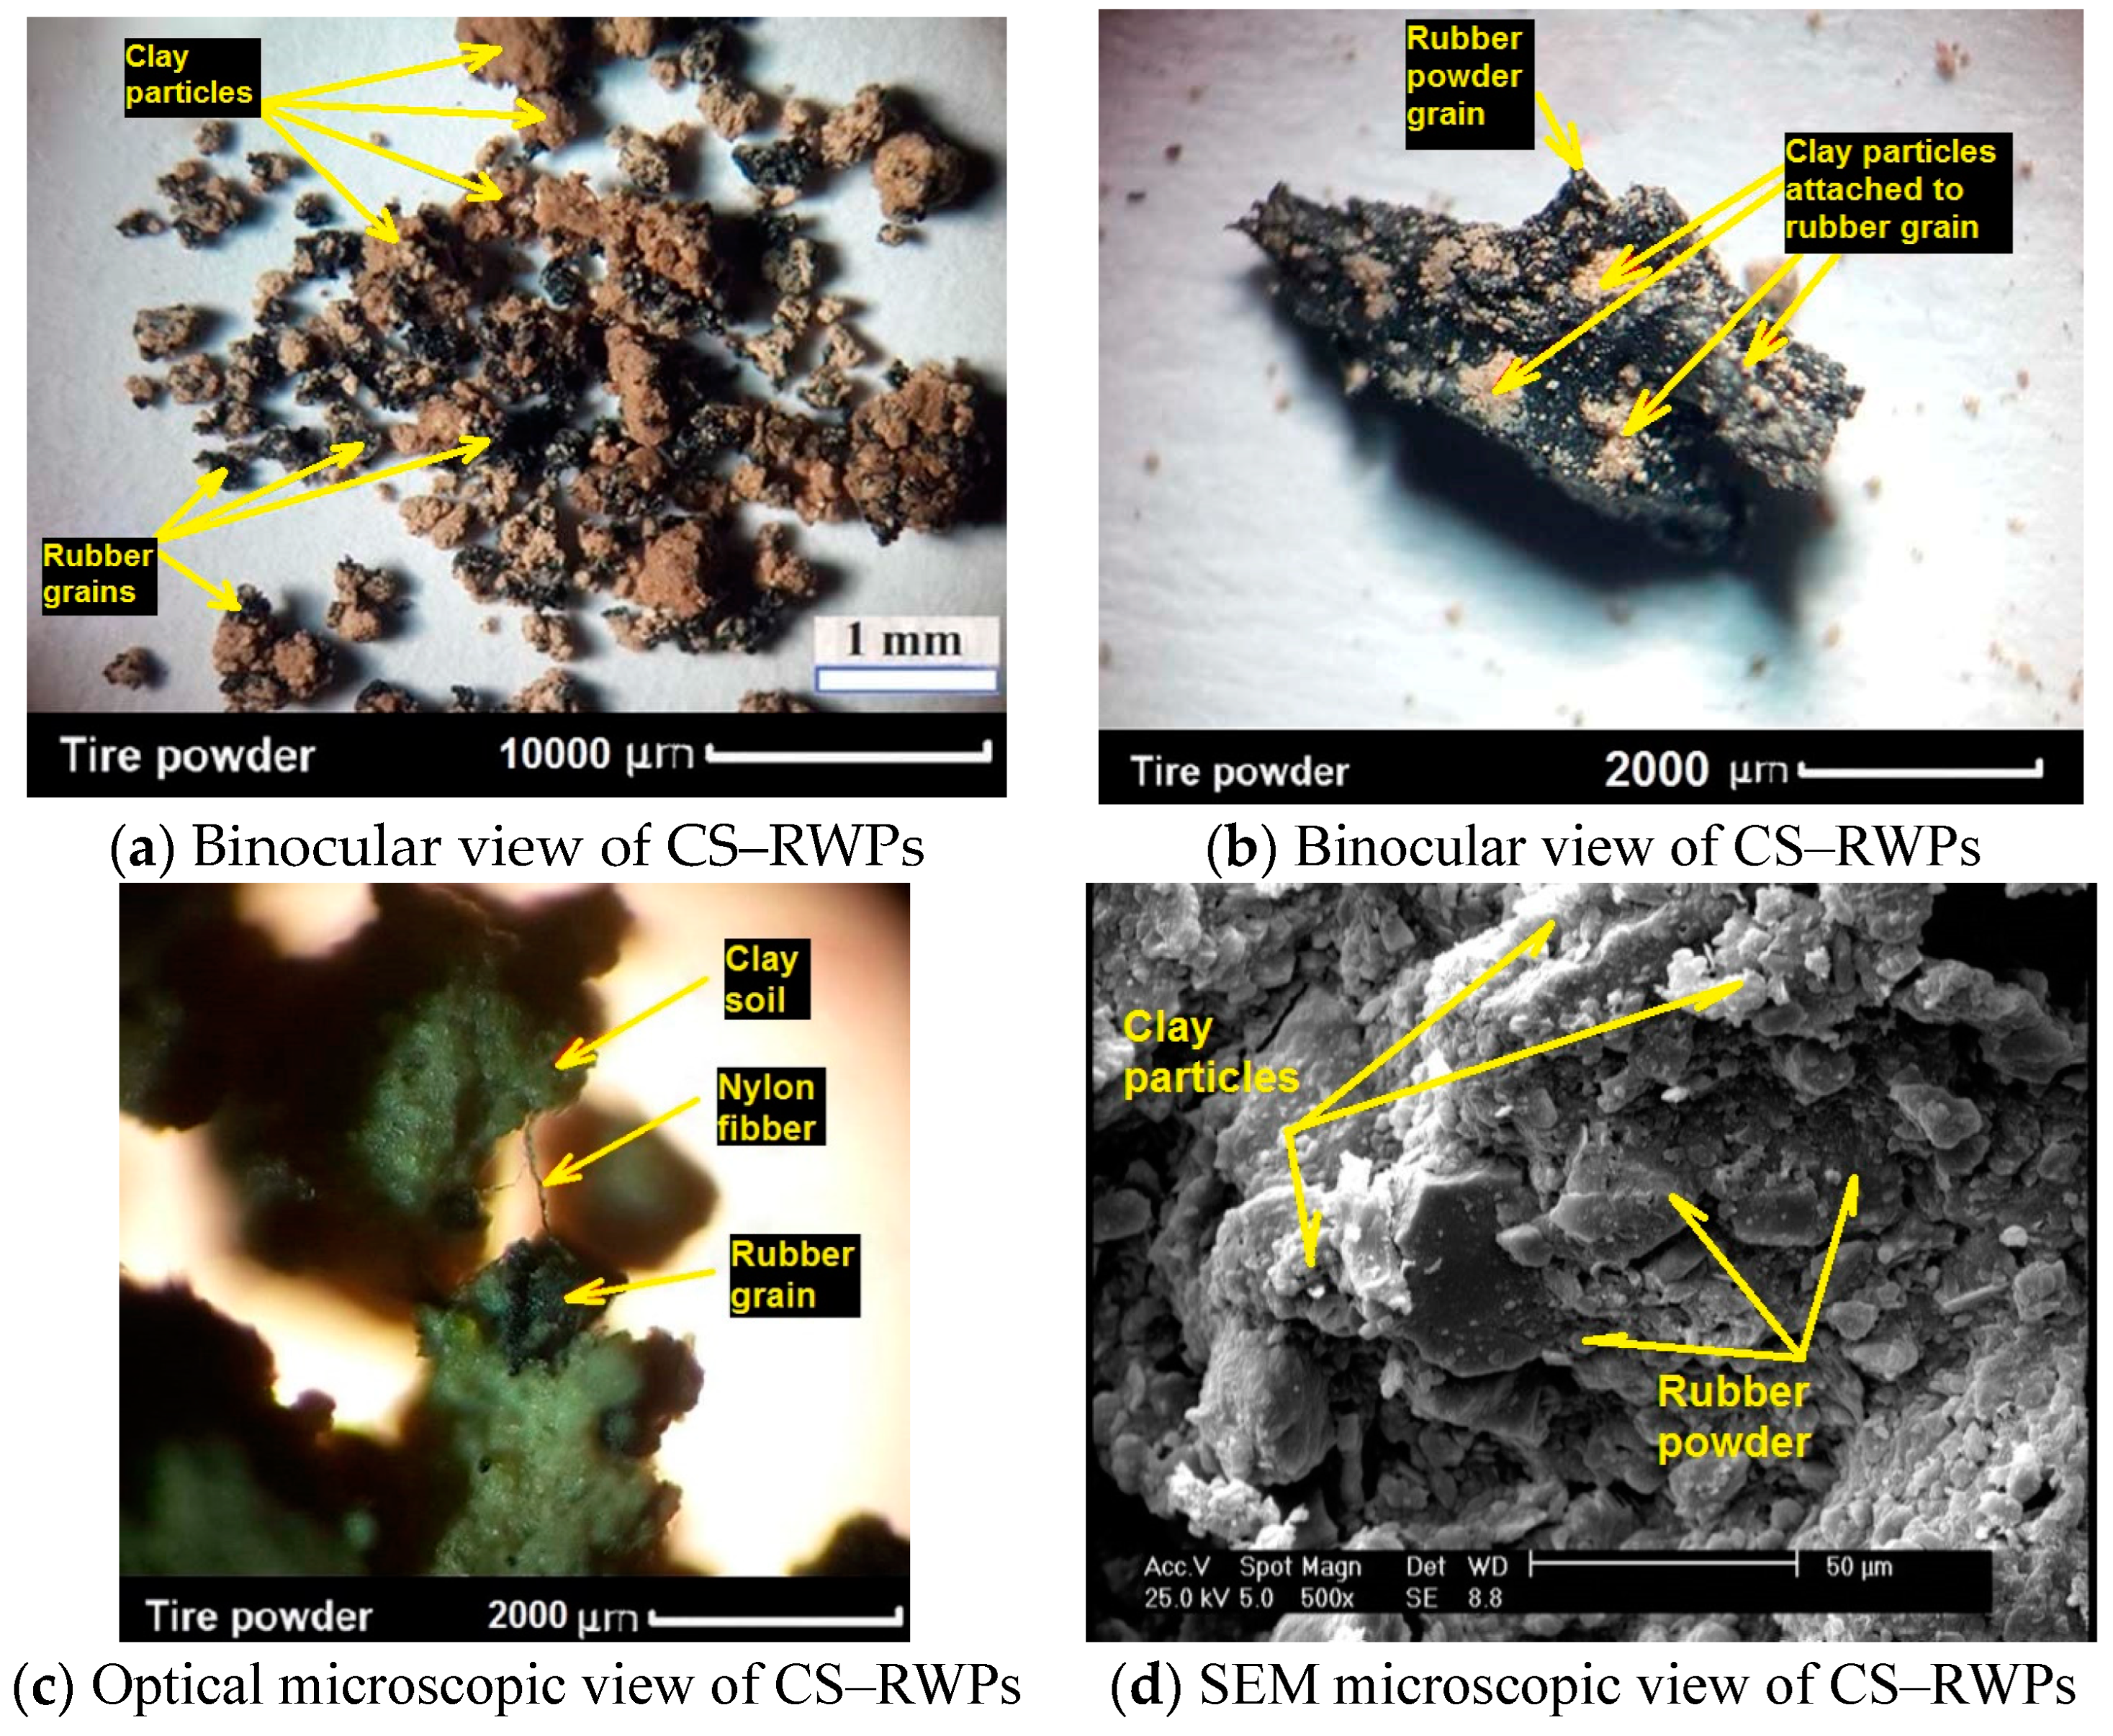
2.1.2. RWPs
2.1.3. CS–RWP Mixture Preparation
2.2. Laboratory Study
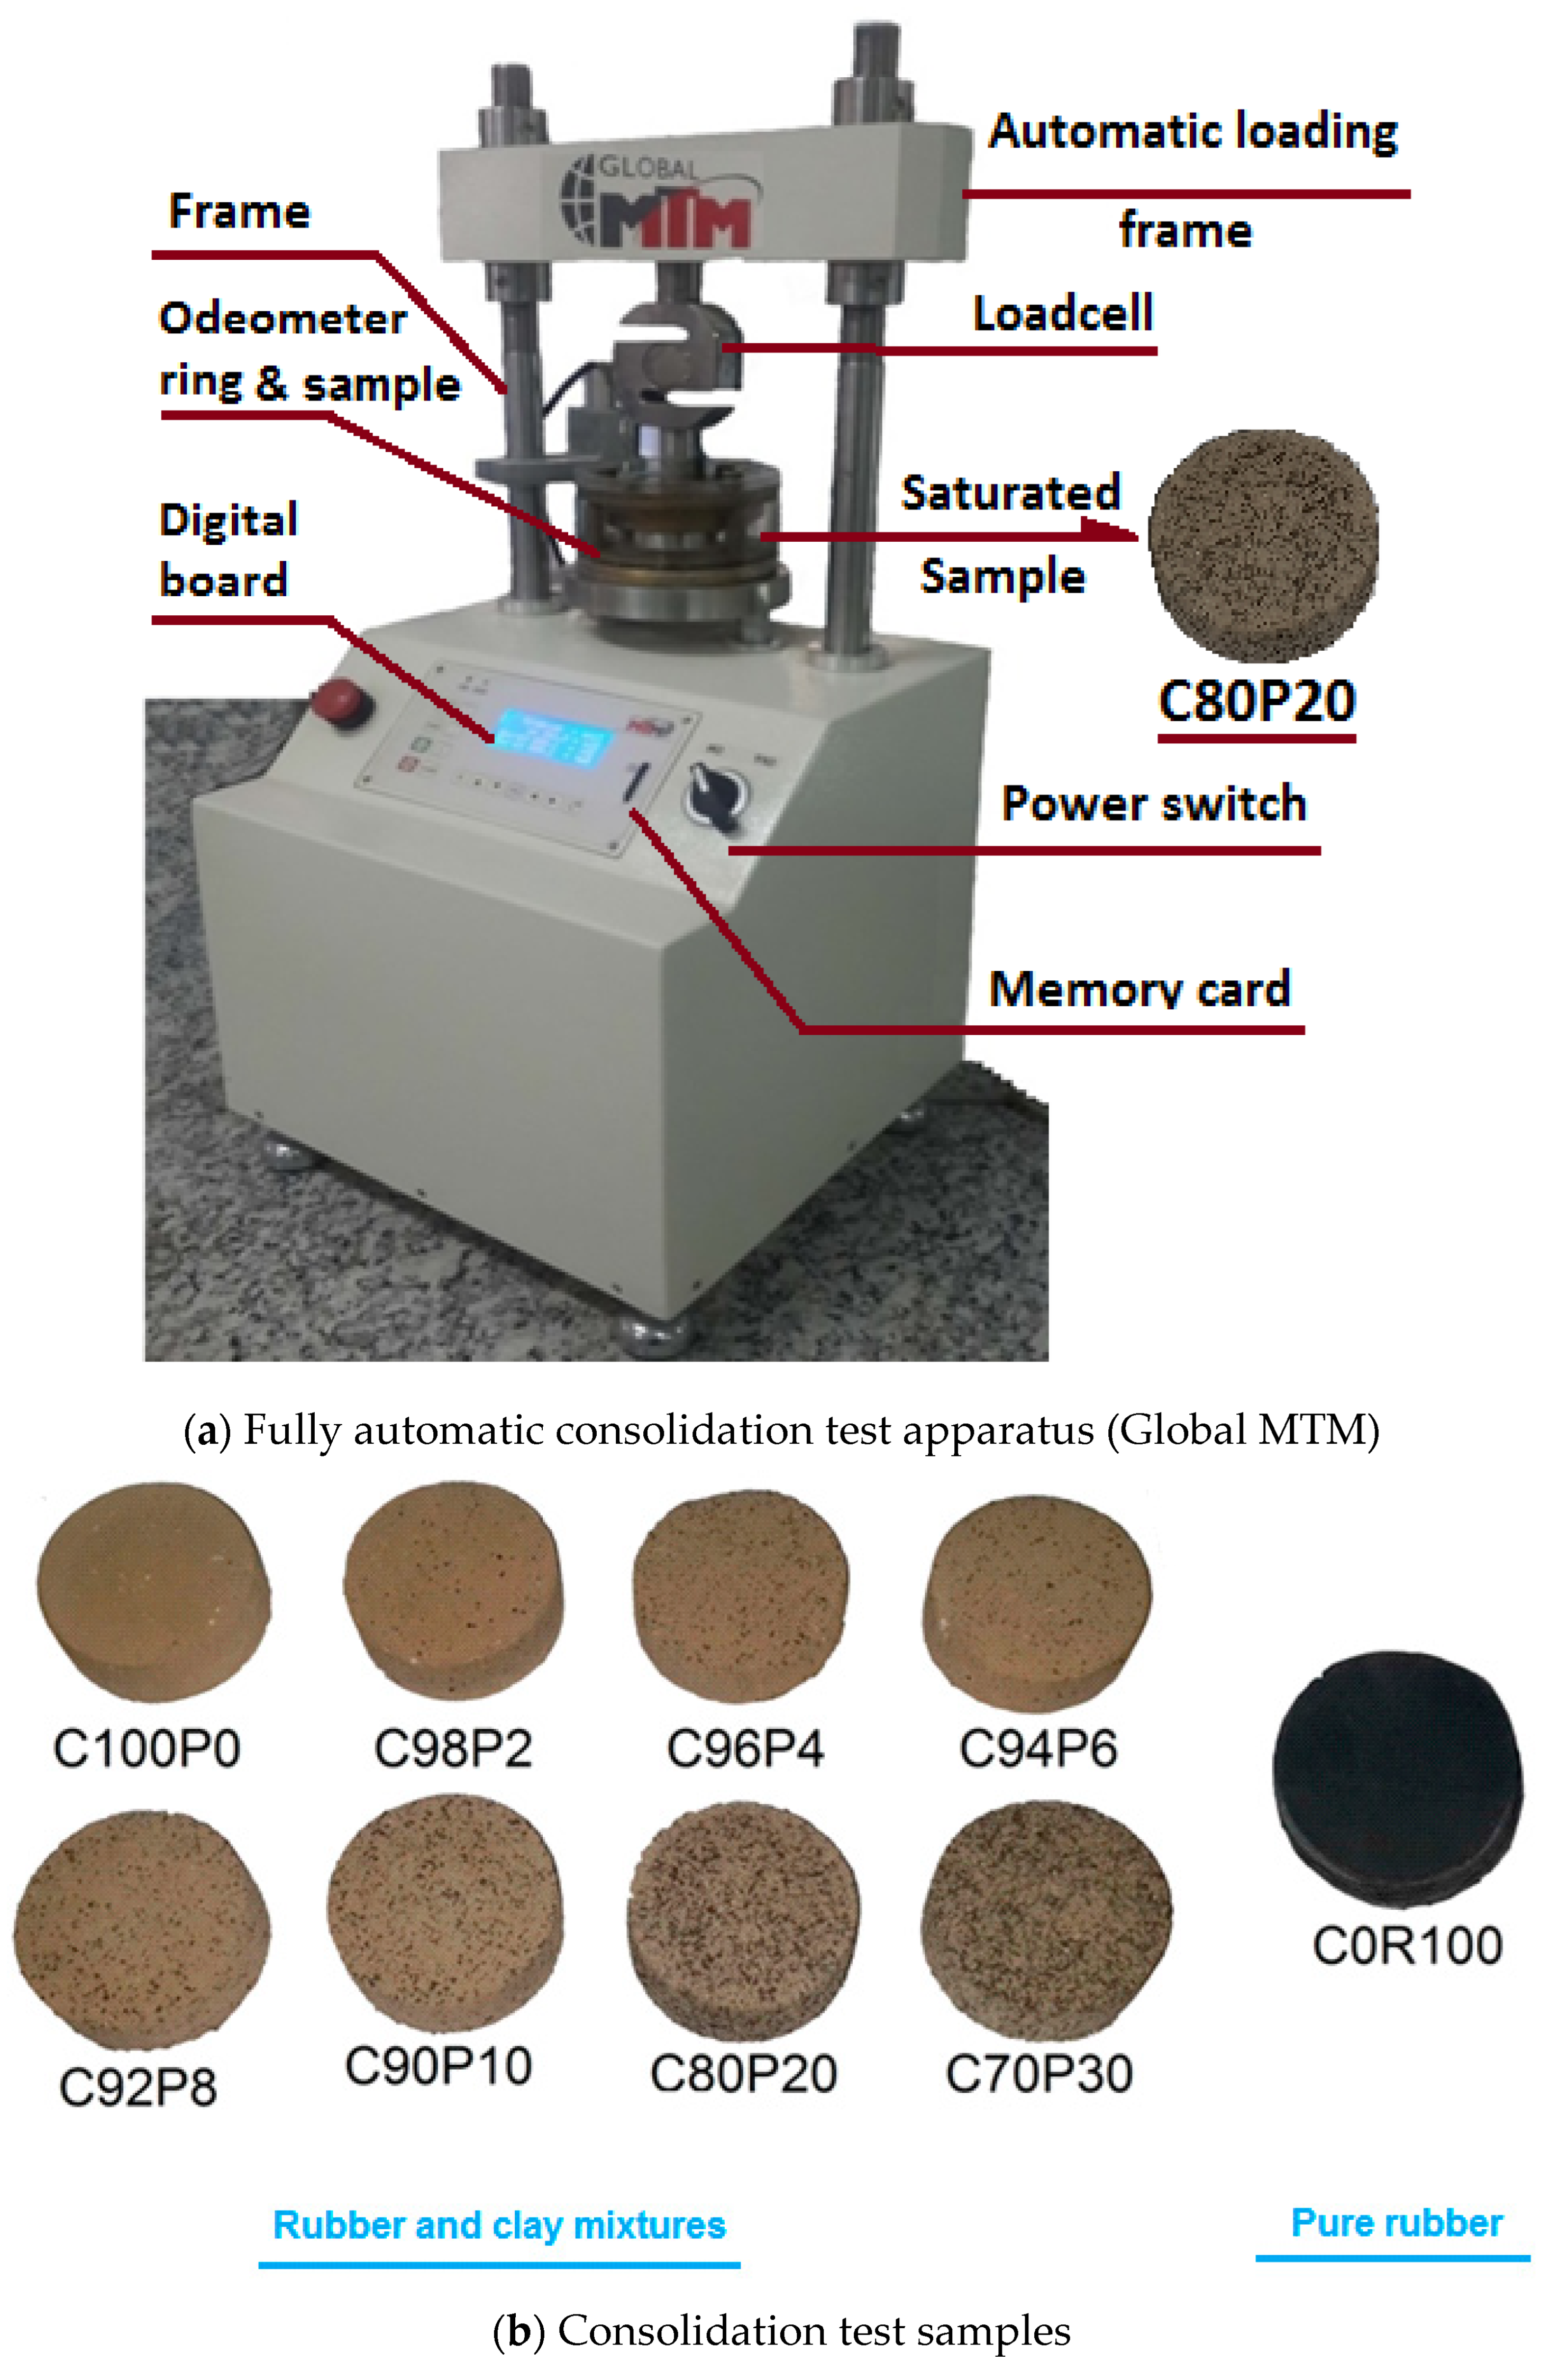
2.2.1. Consolidation Test
2.2.2. Unconfined Compressive Strength (UCS)
2.2.3. Compaction Test
3. Results and Analysis
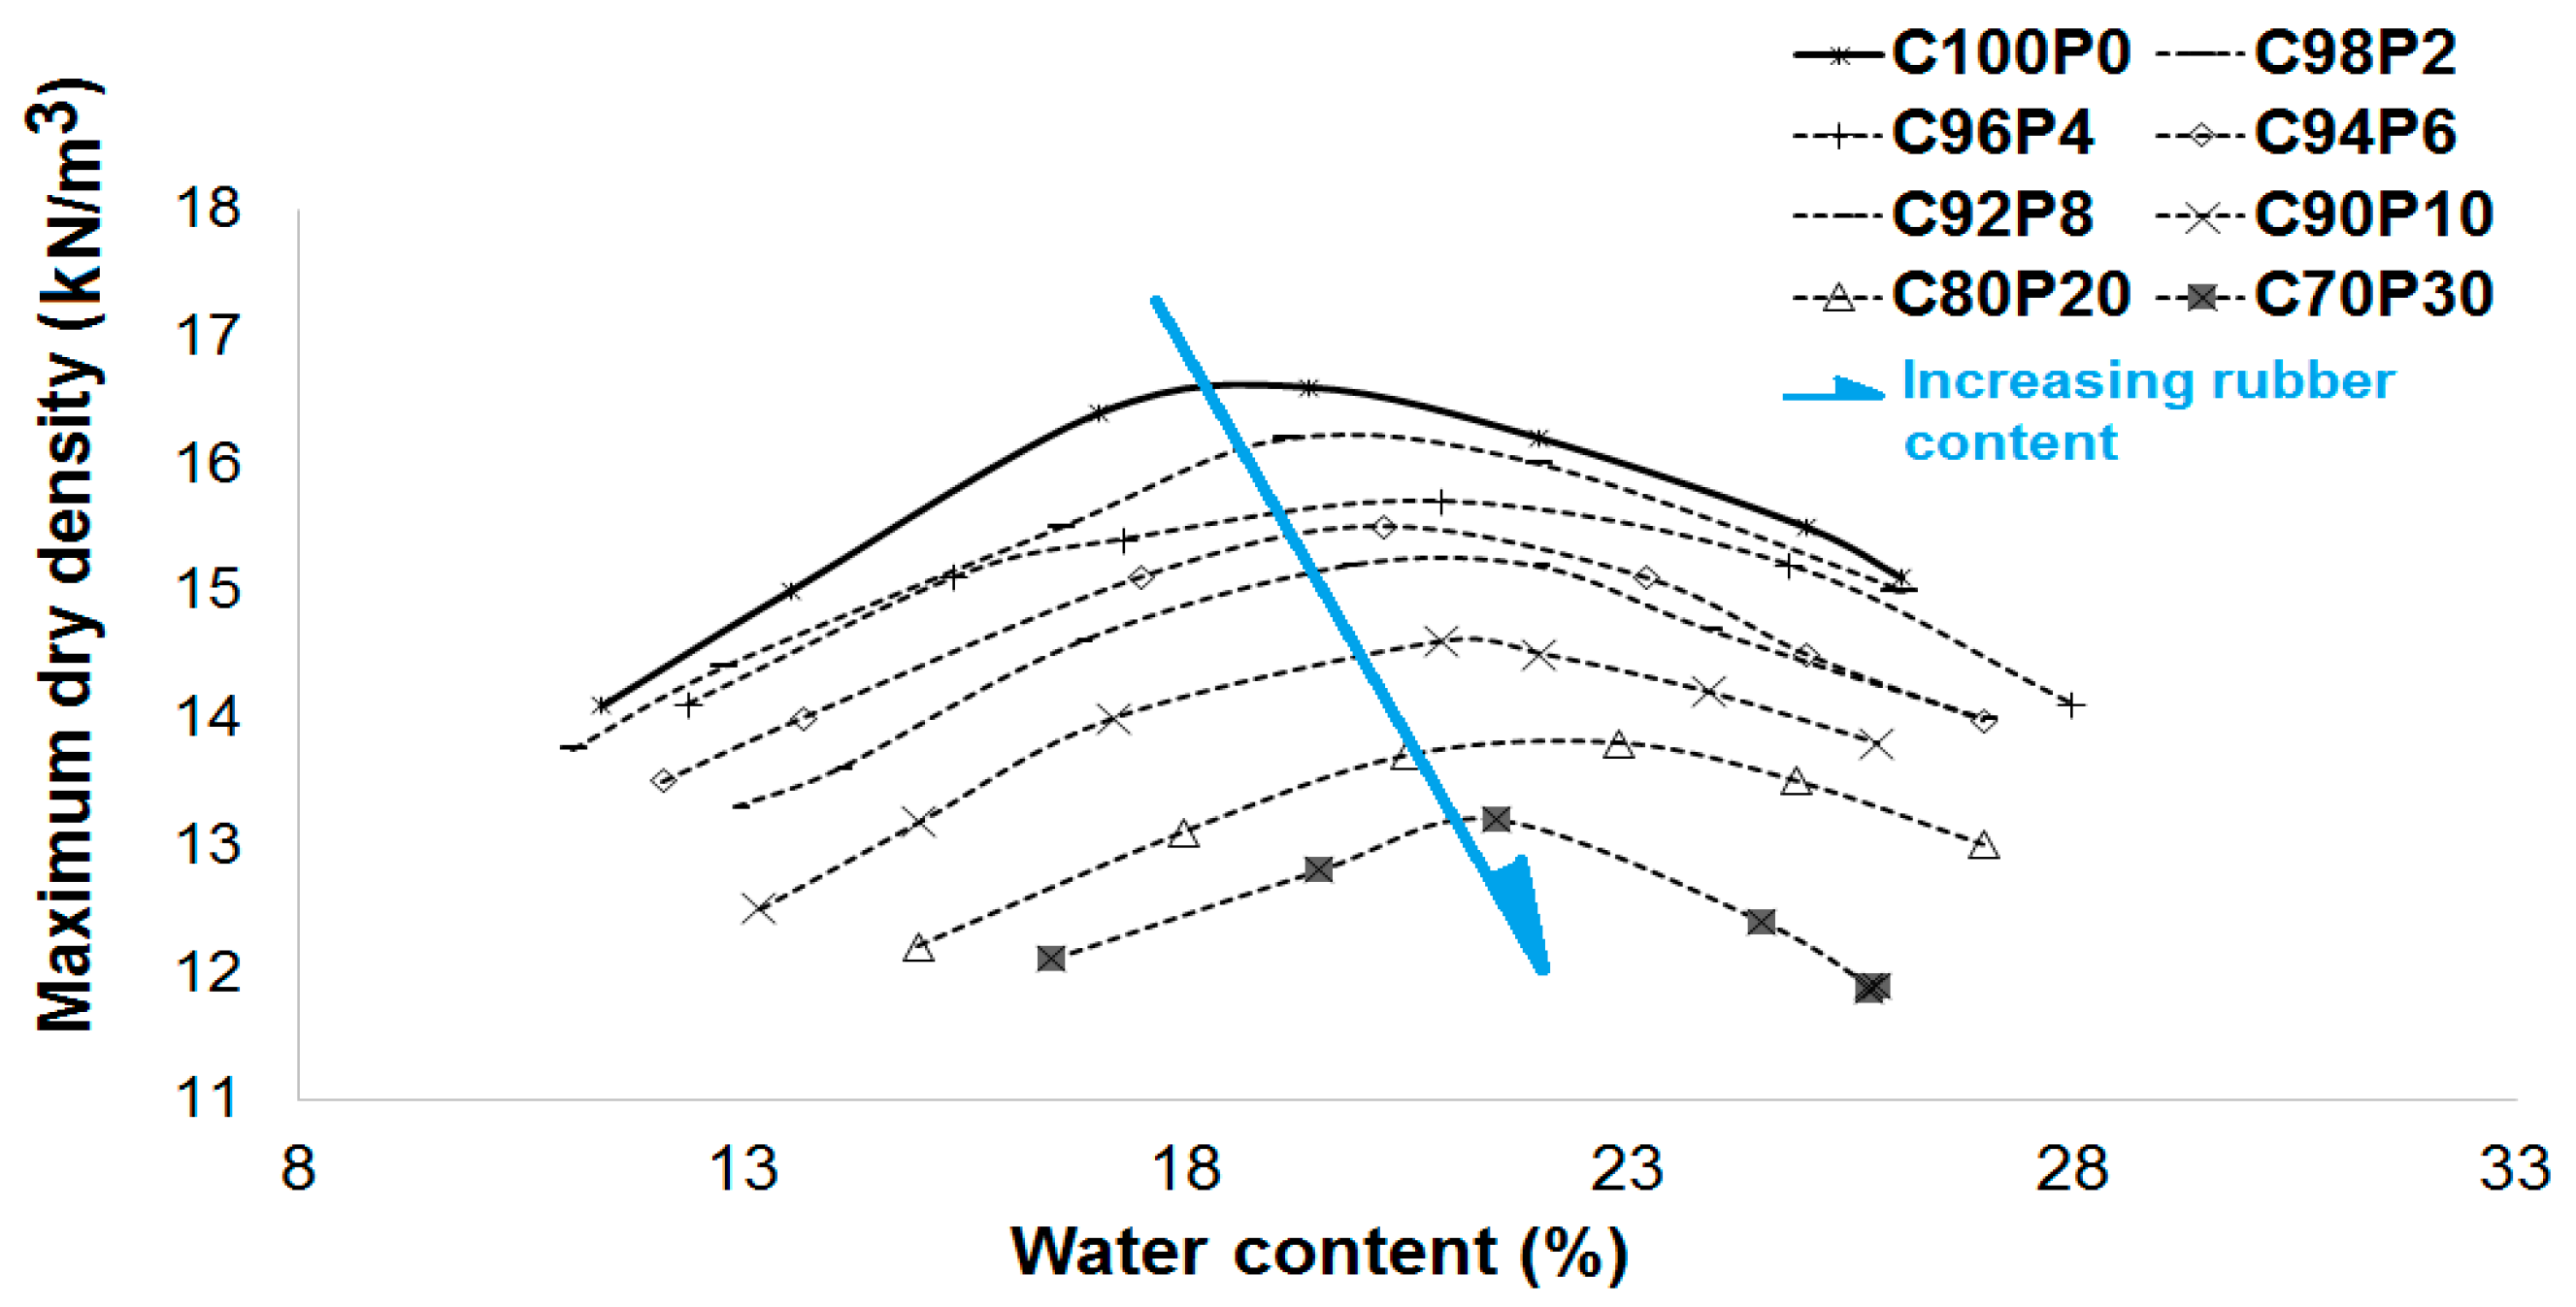
3.1. RWPs Effect on MDD and OMC
3.2. RWP Effect on Stiffness
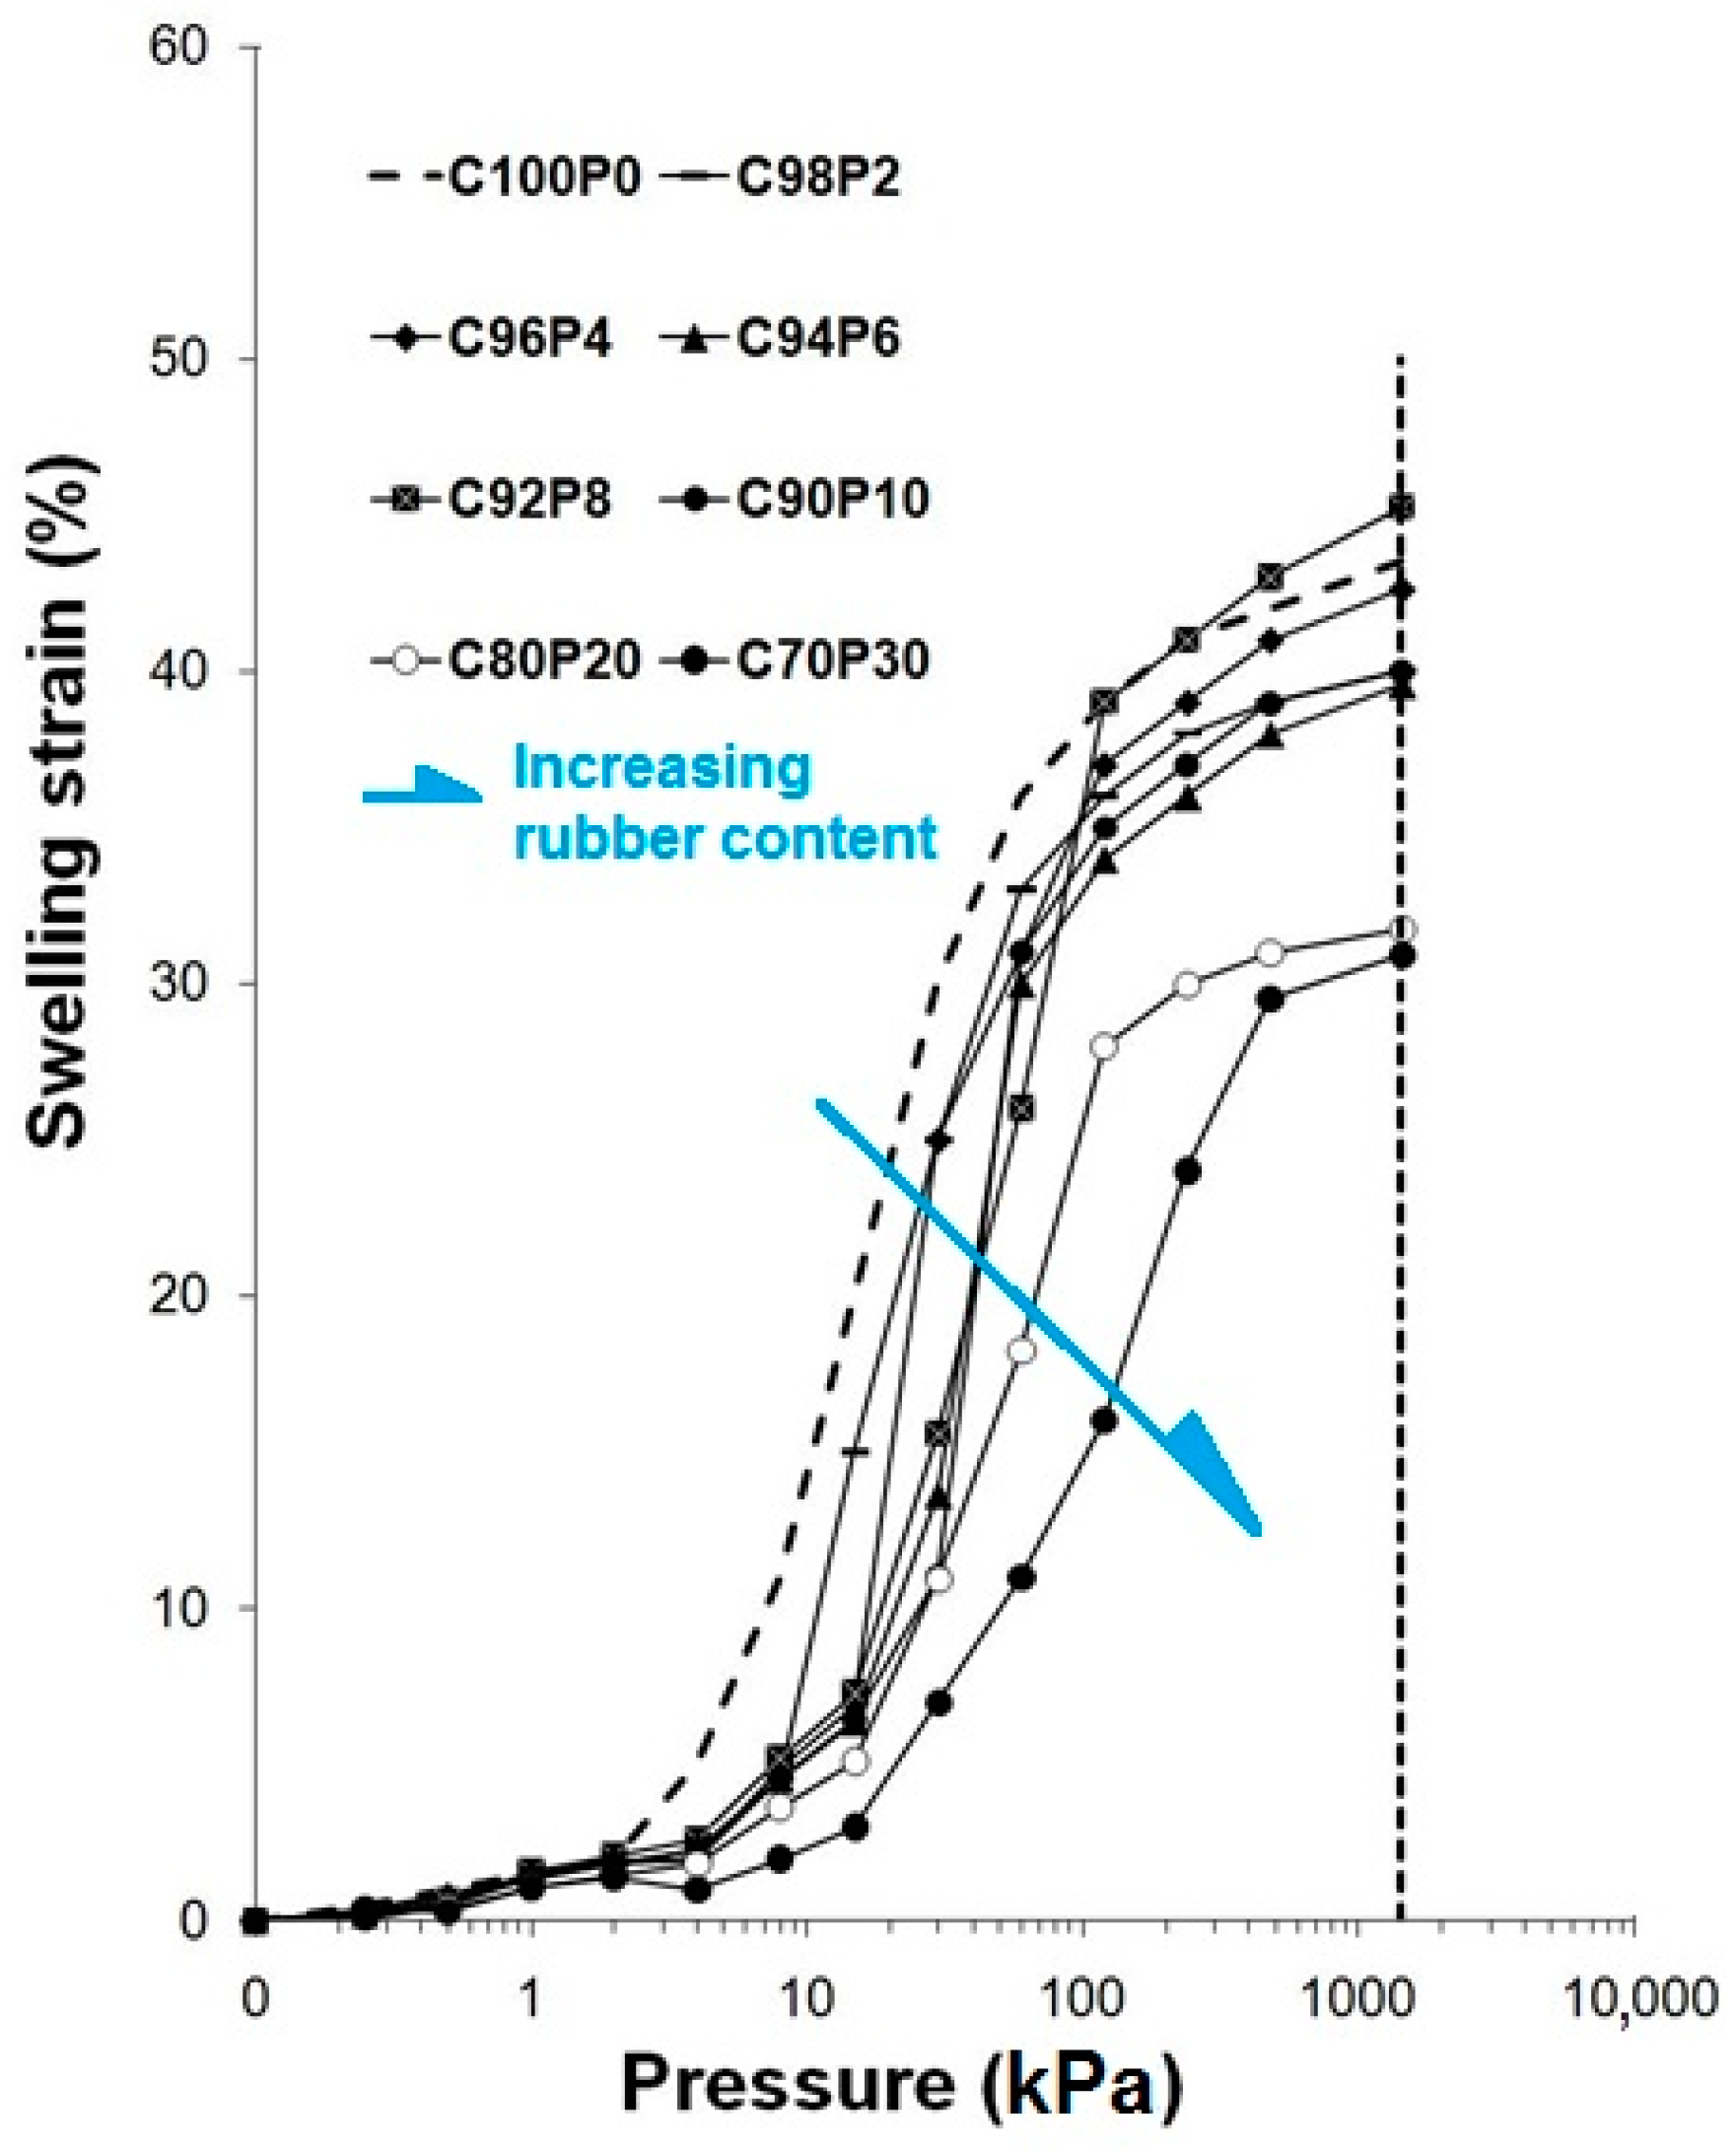
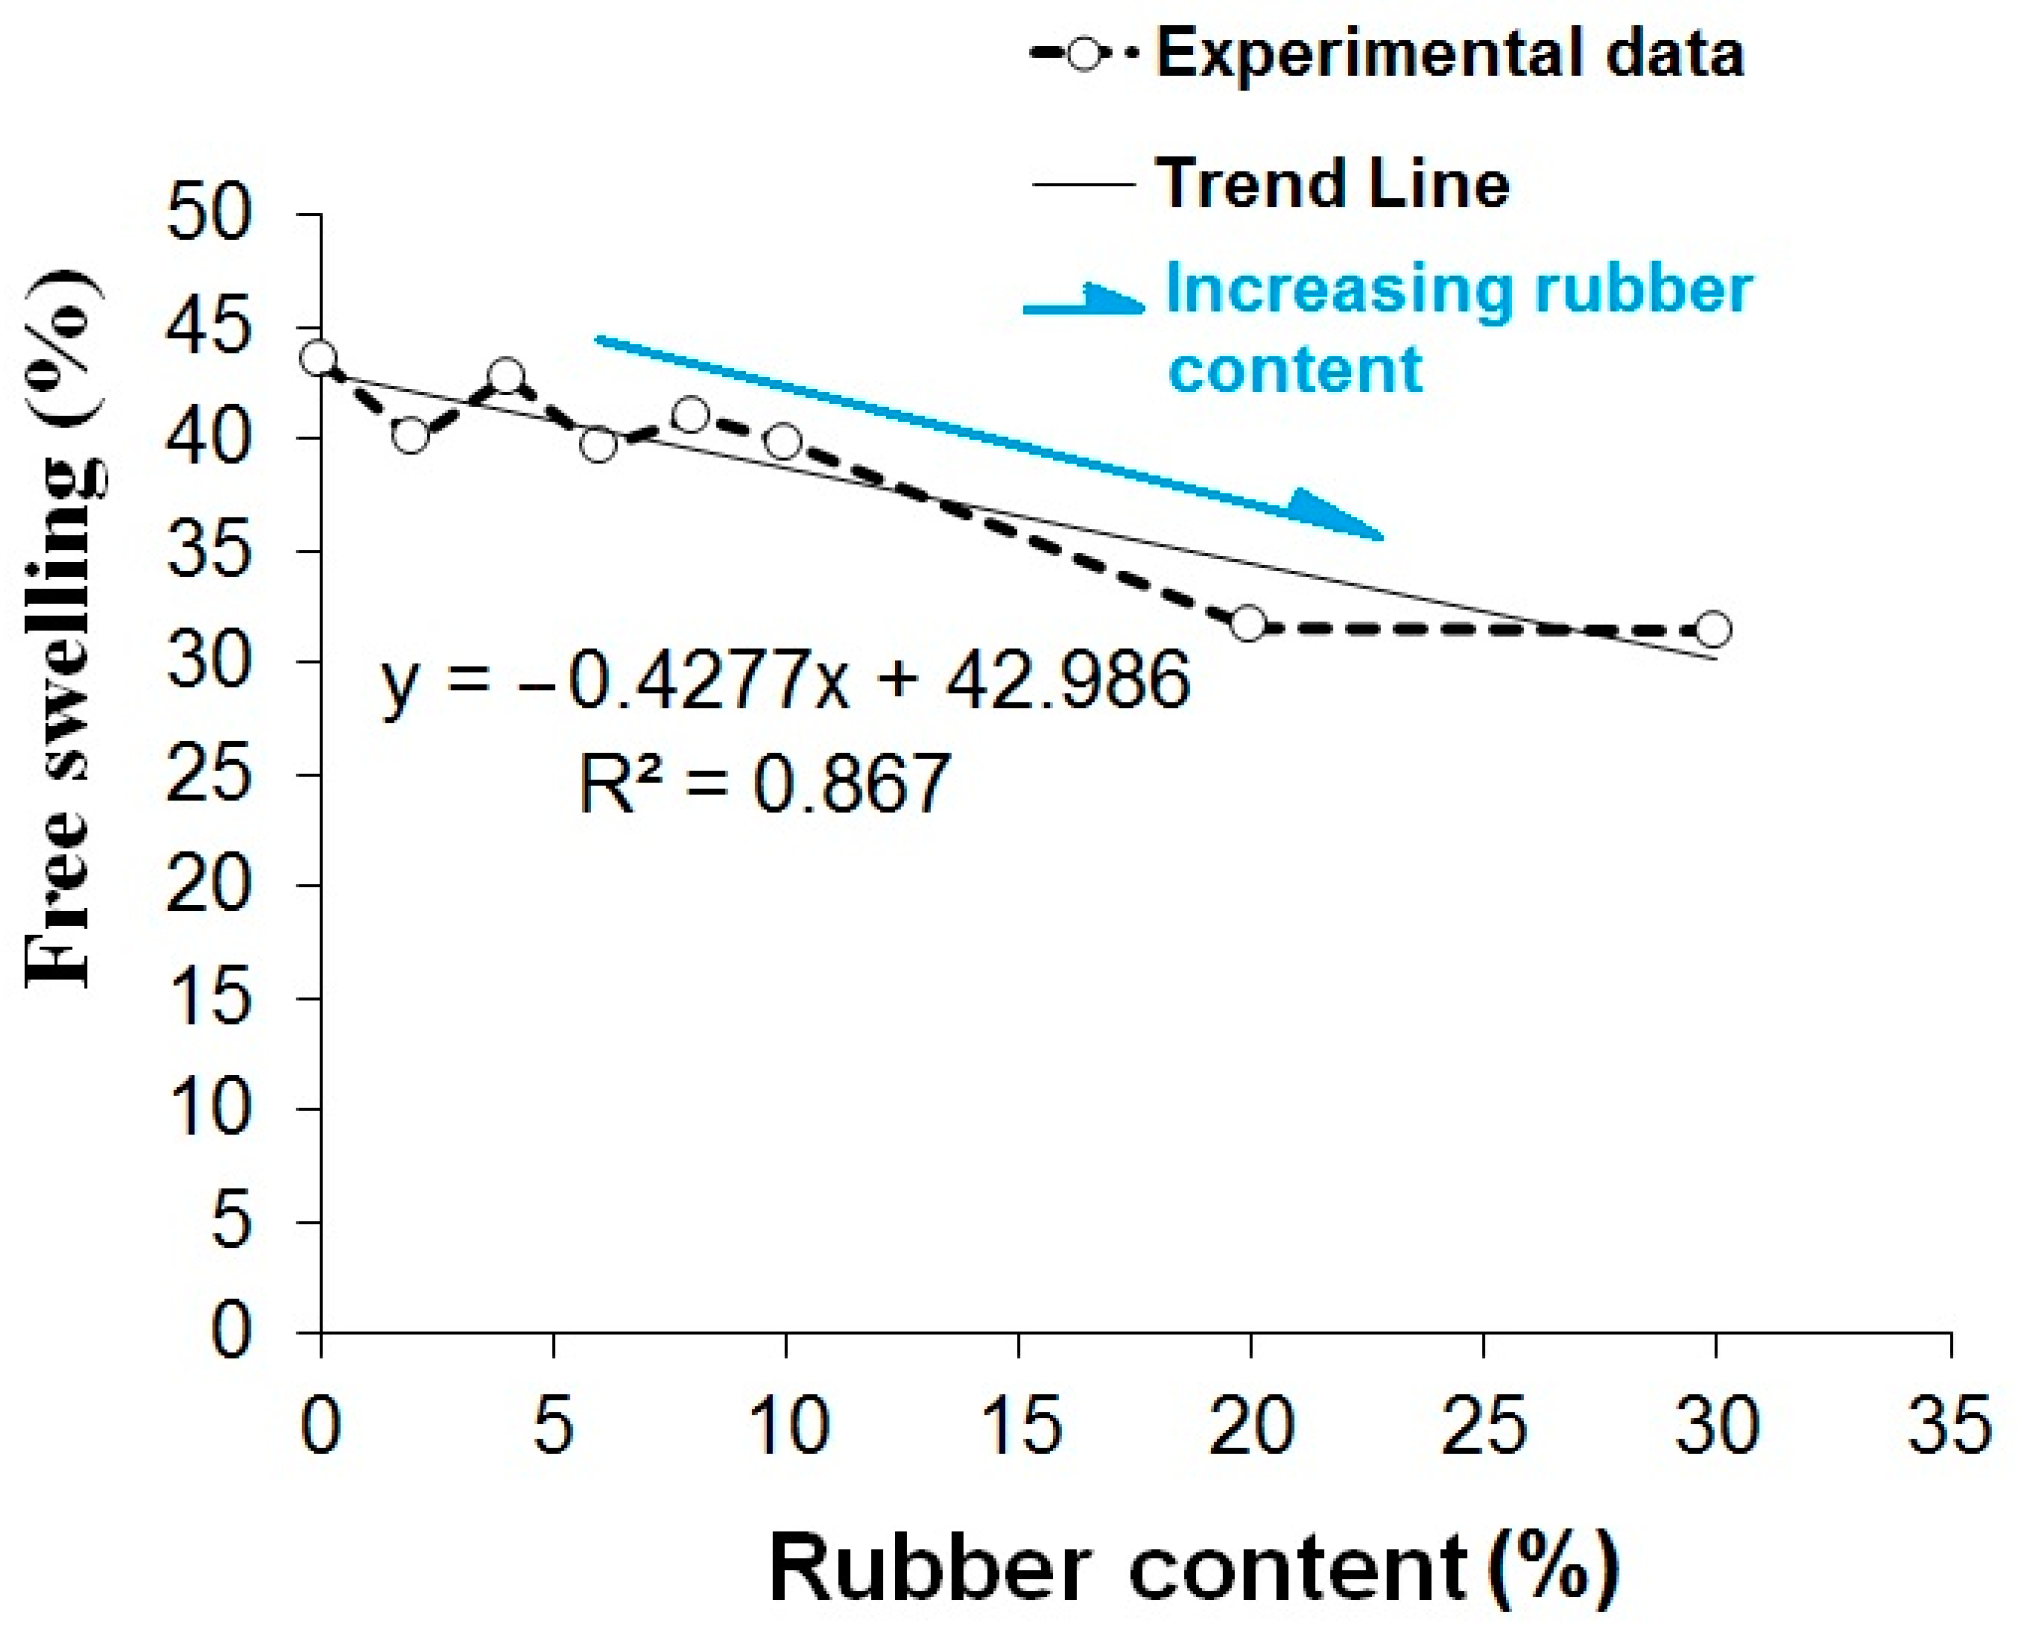
3.2.1. Swelling Potential
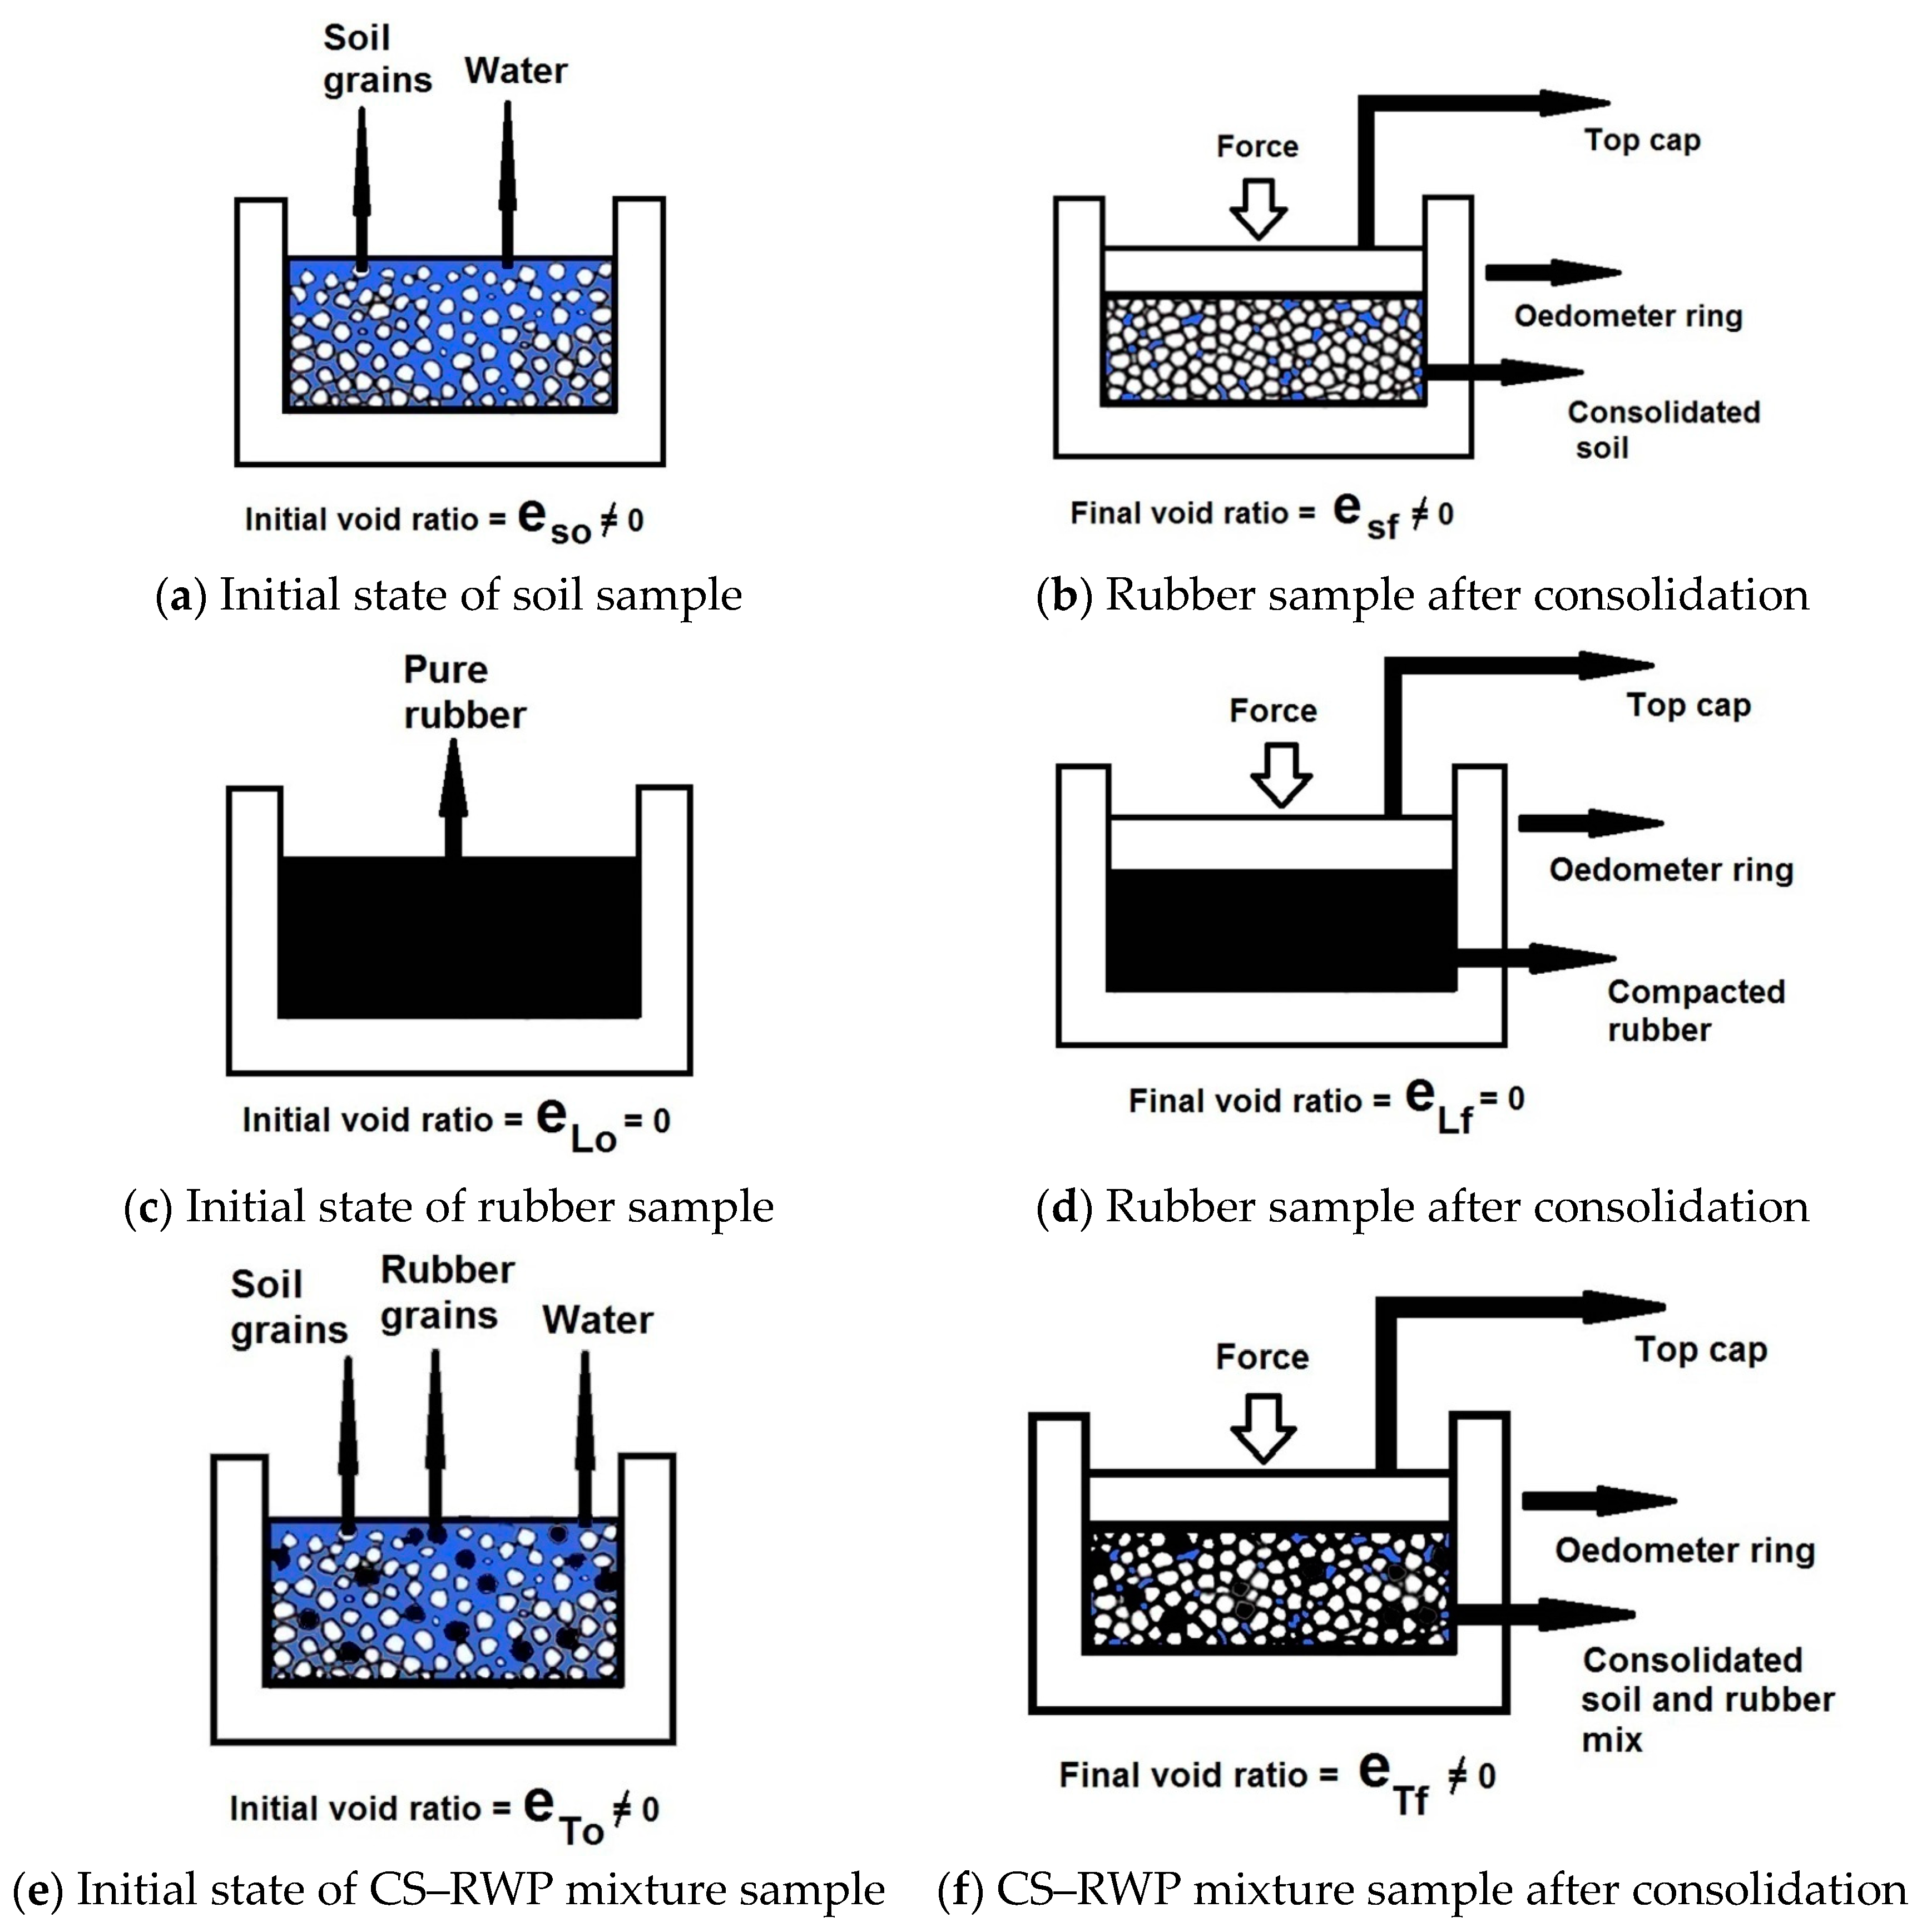
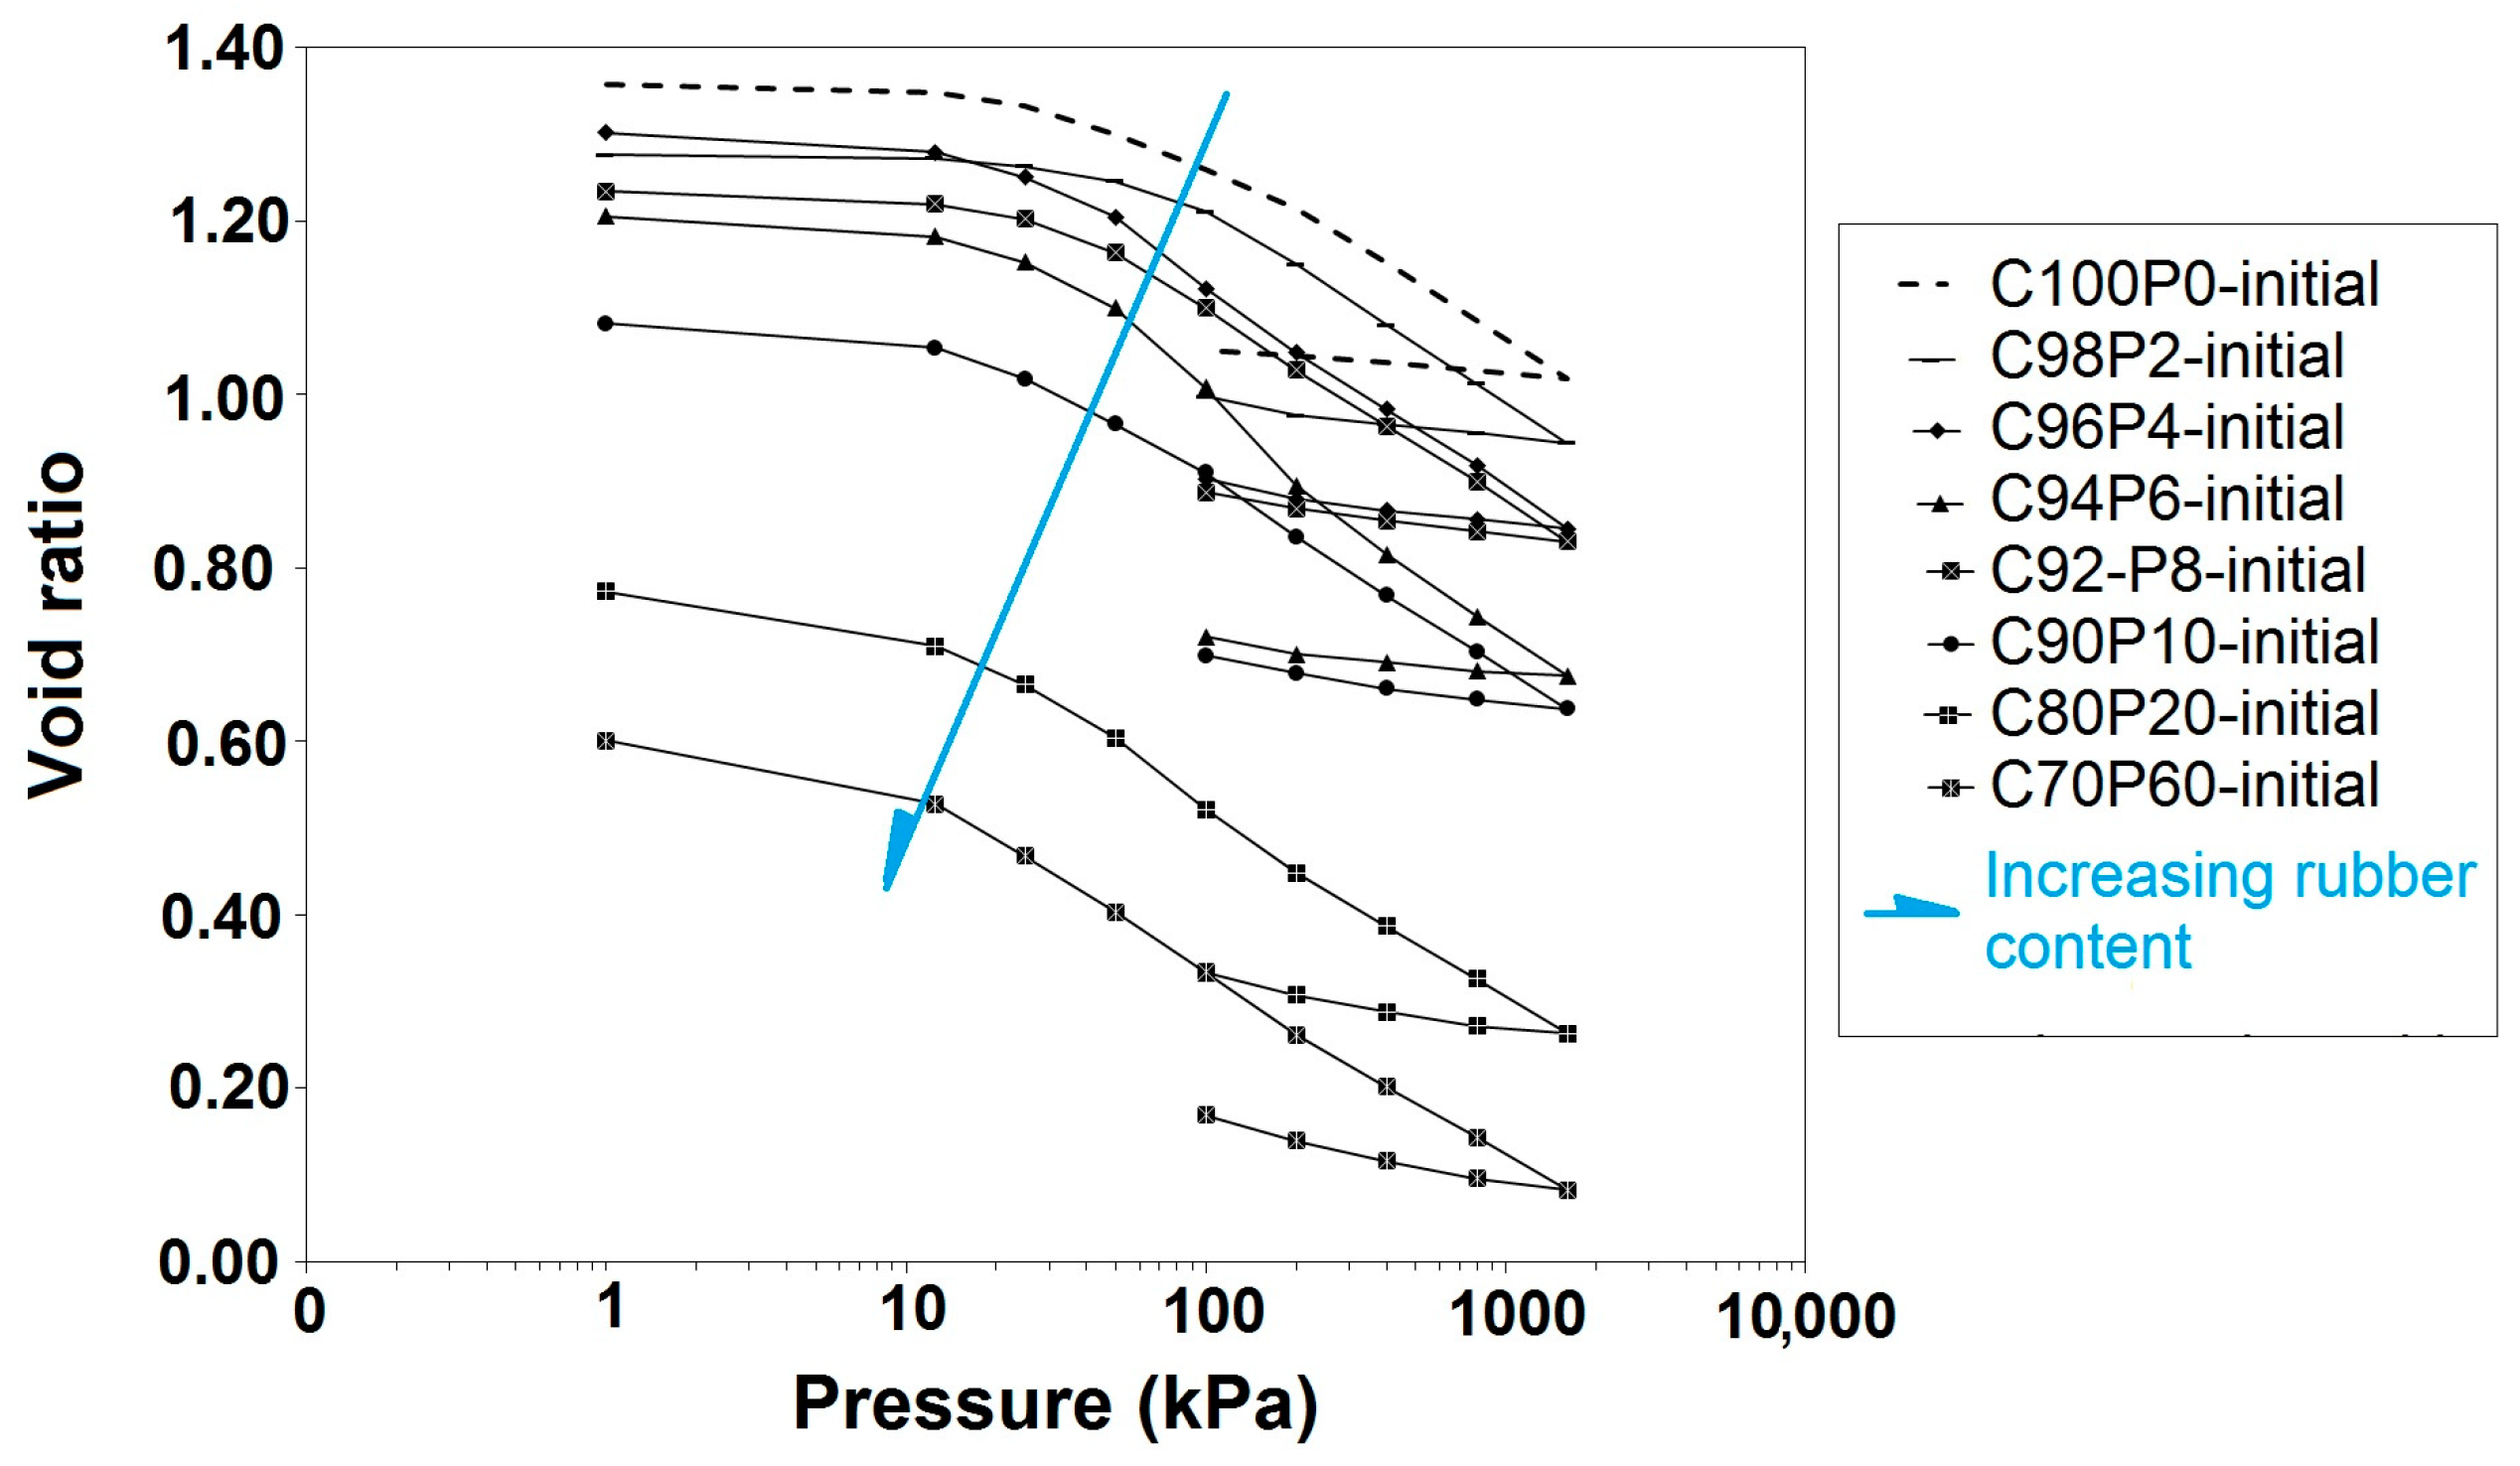
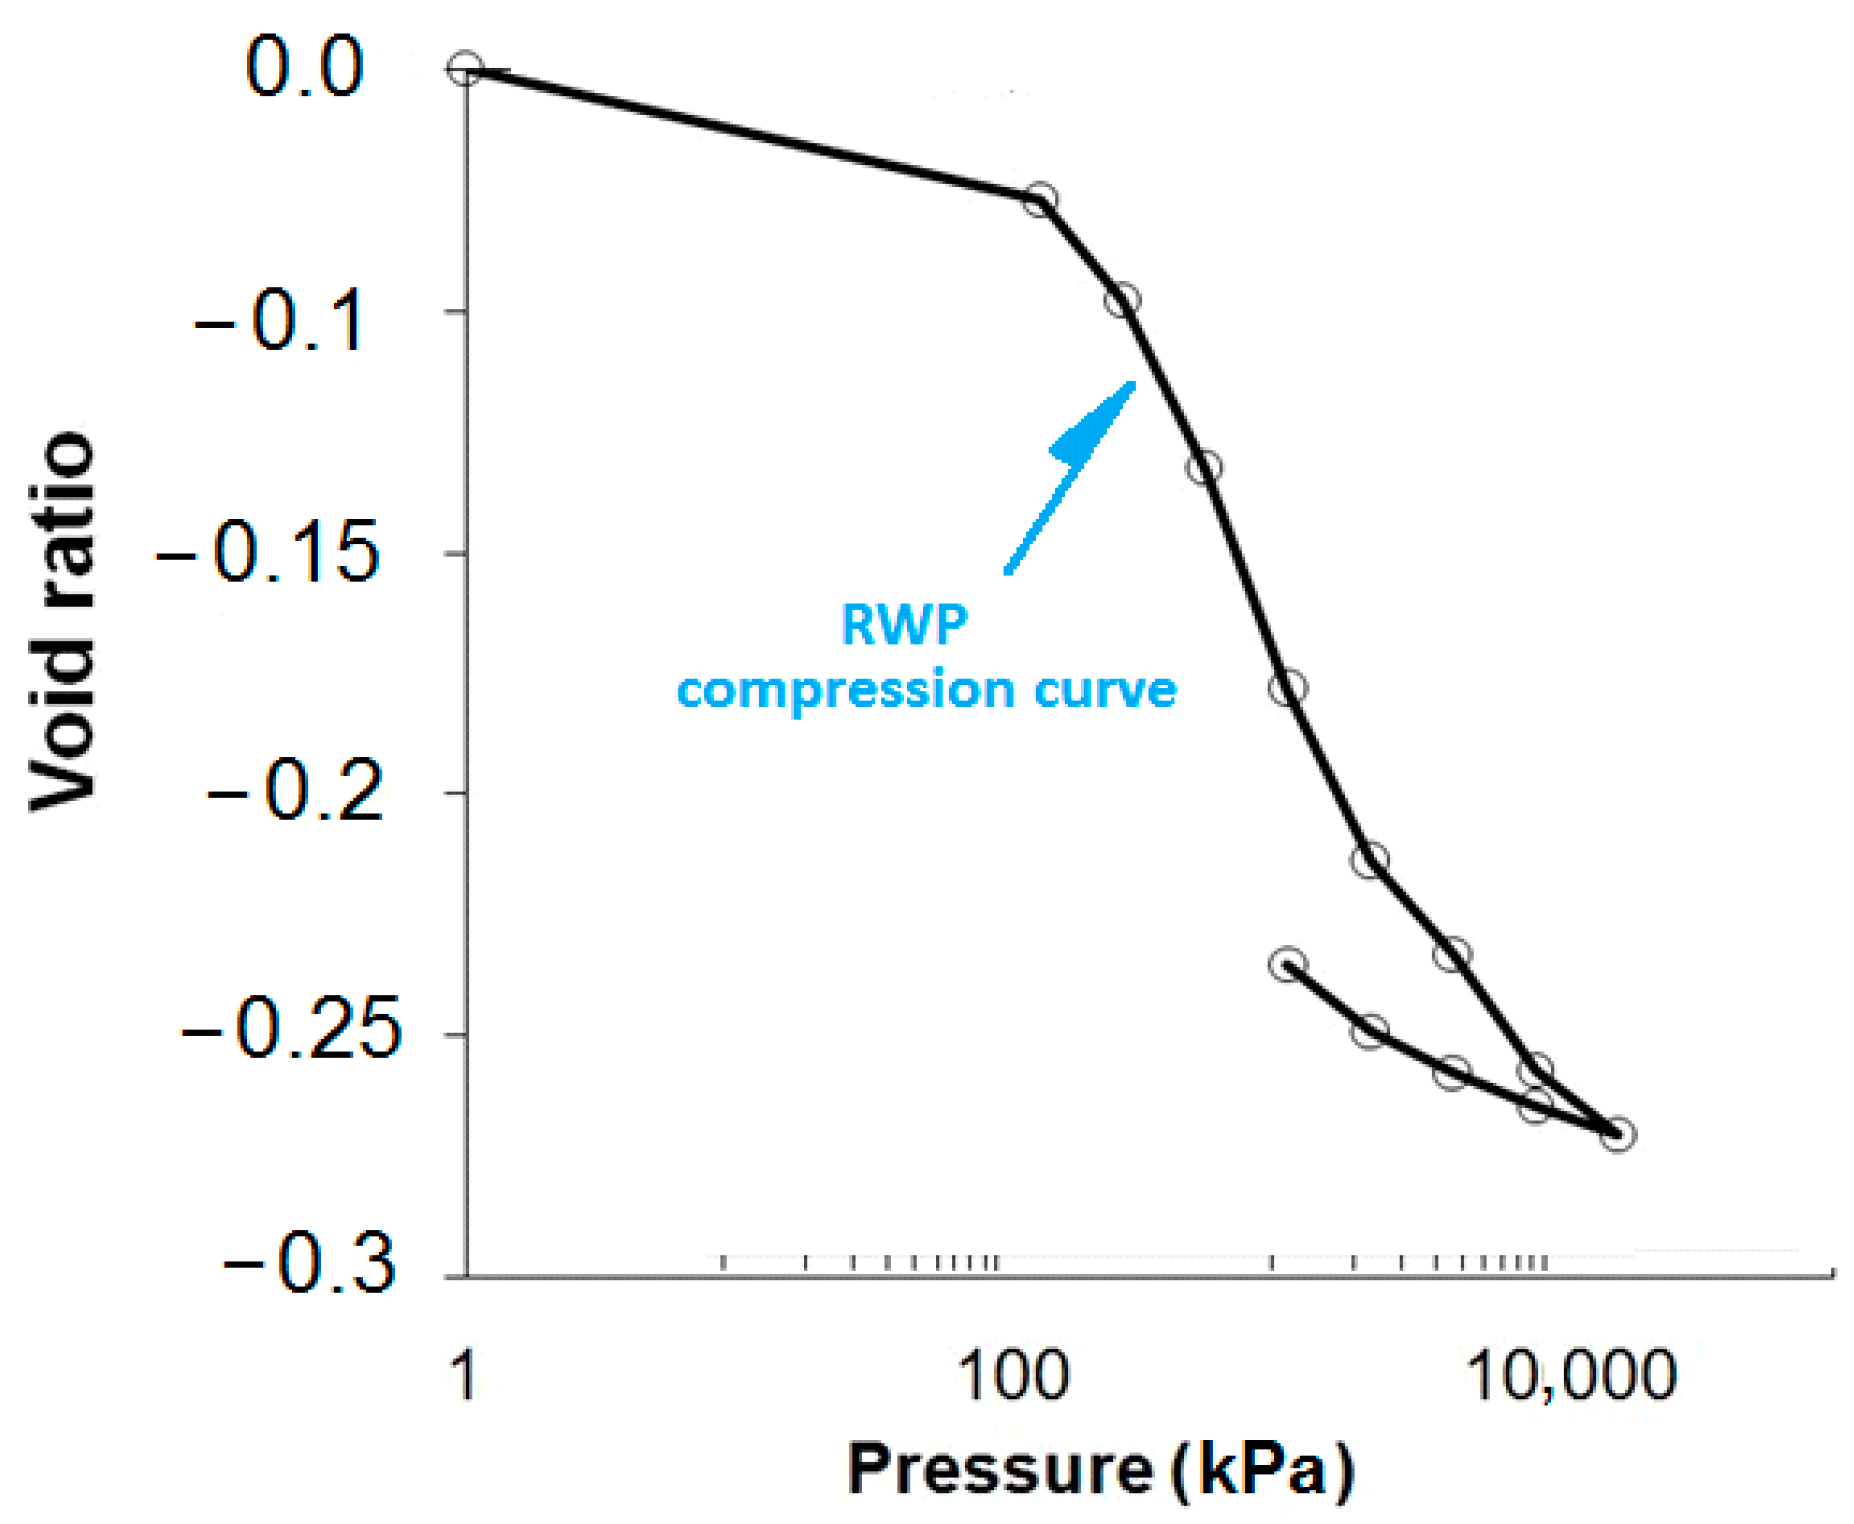
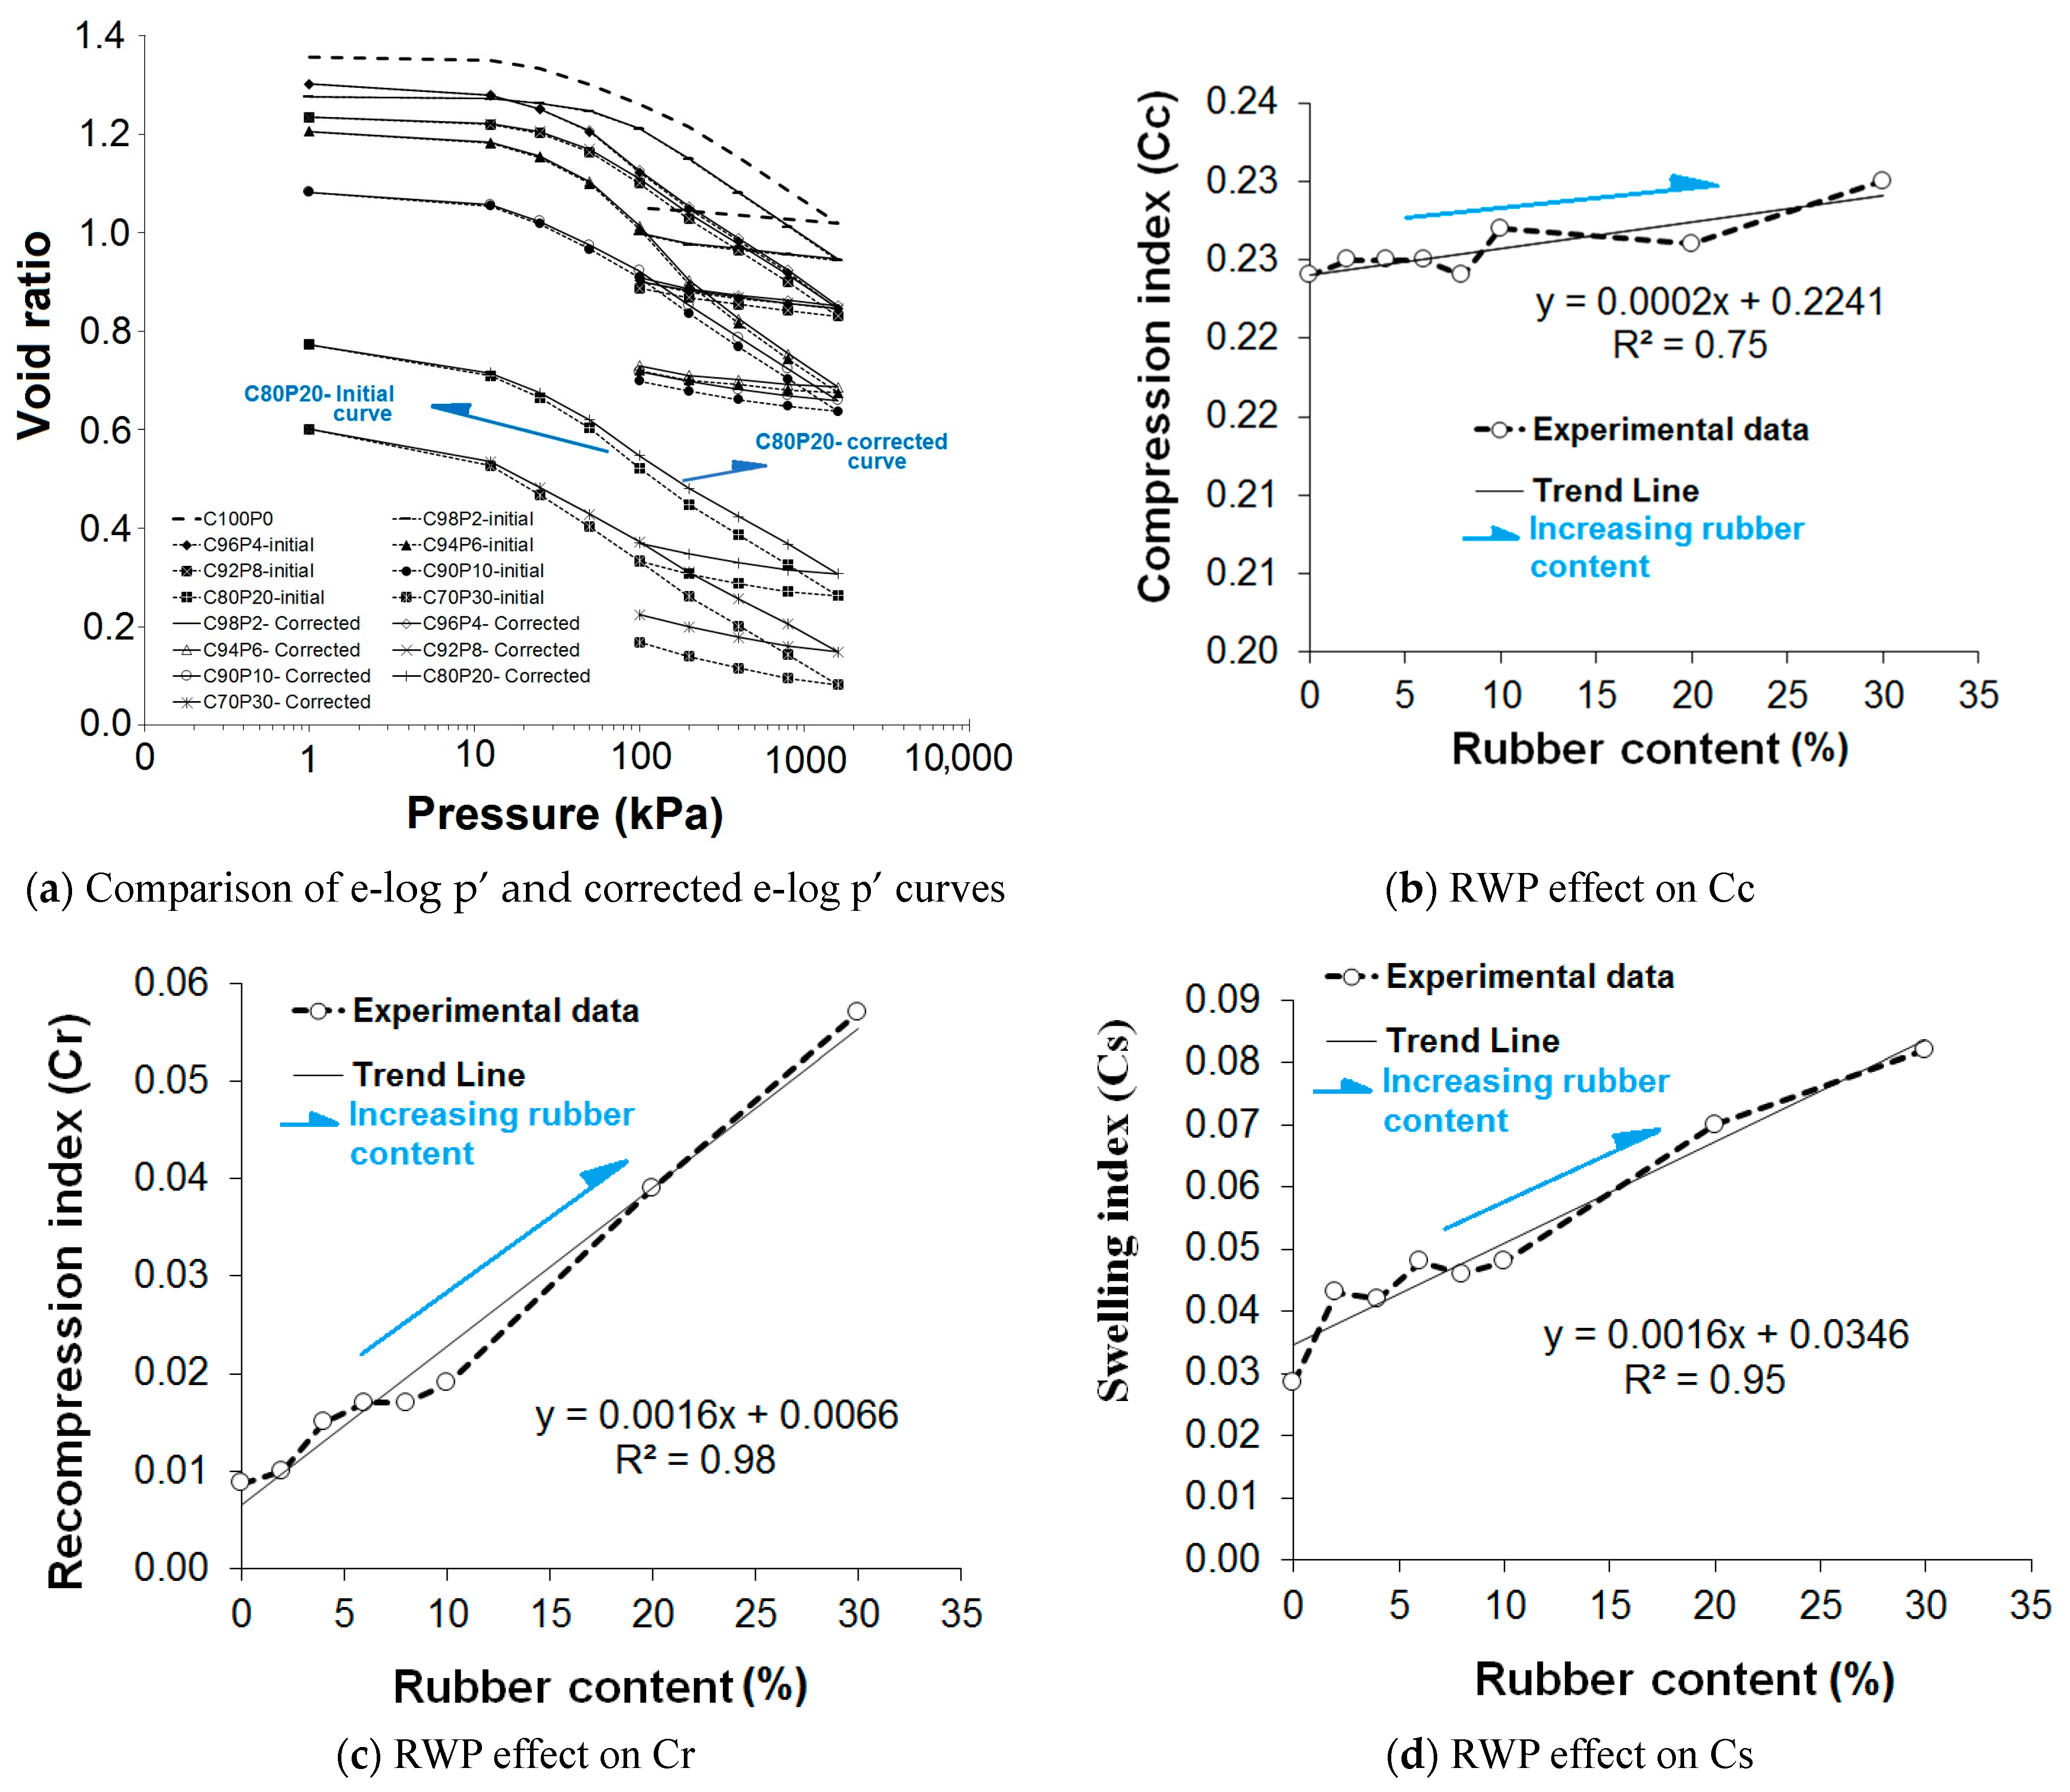
3.2.2. E-Log P’ Curves
3.2.3. Compression, Swelling, and Recompression Indices
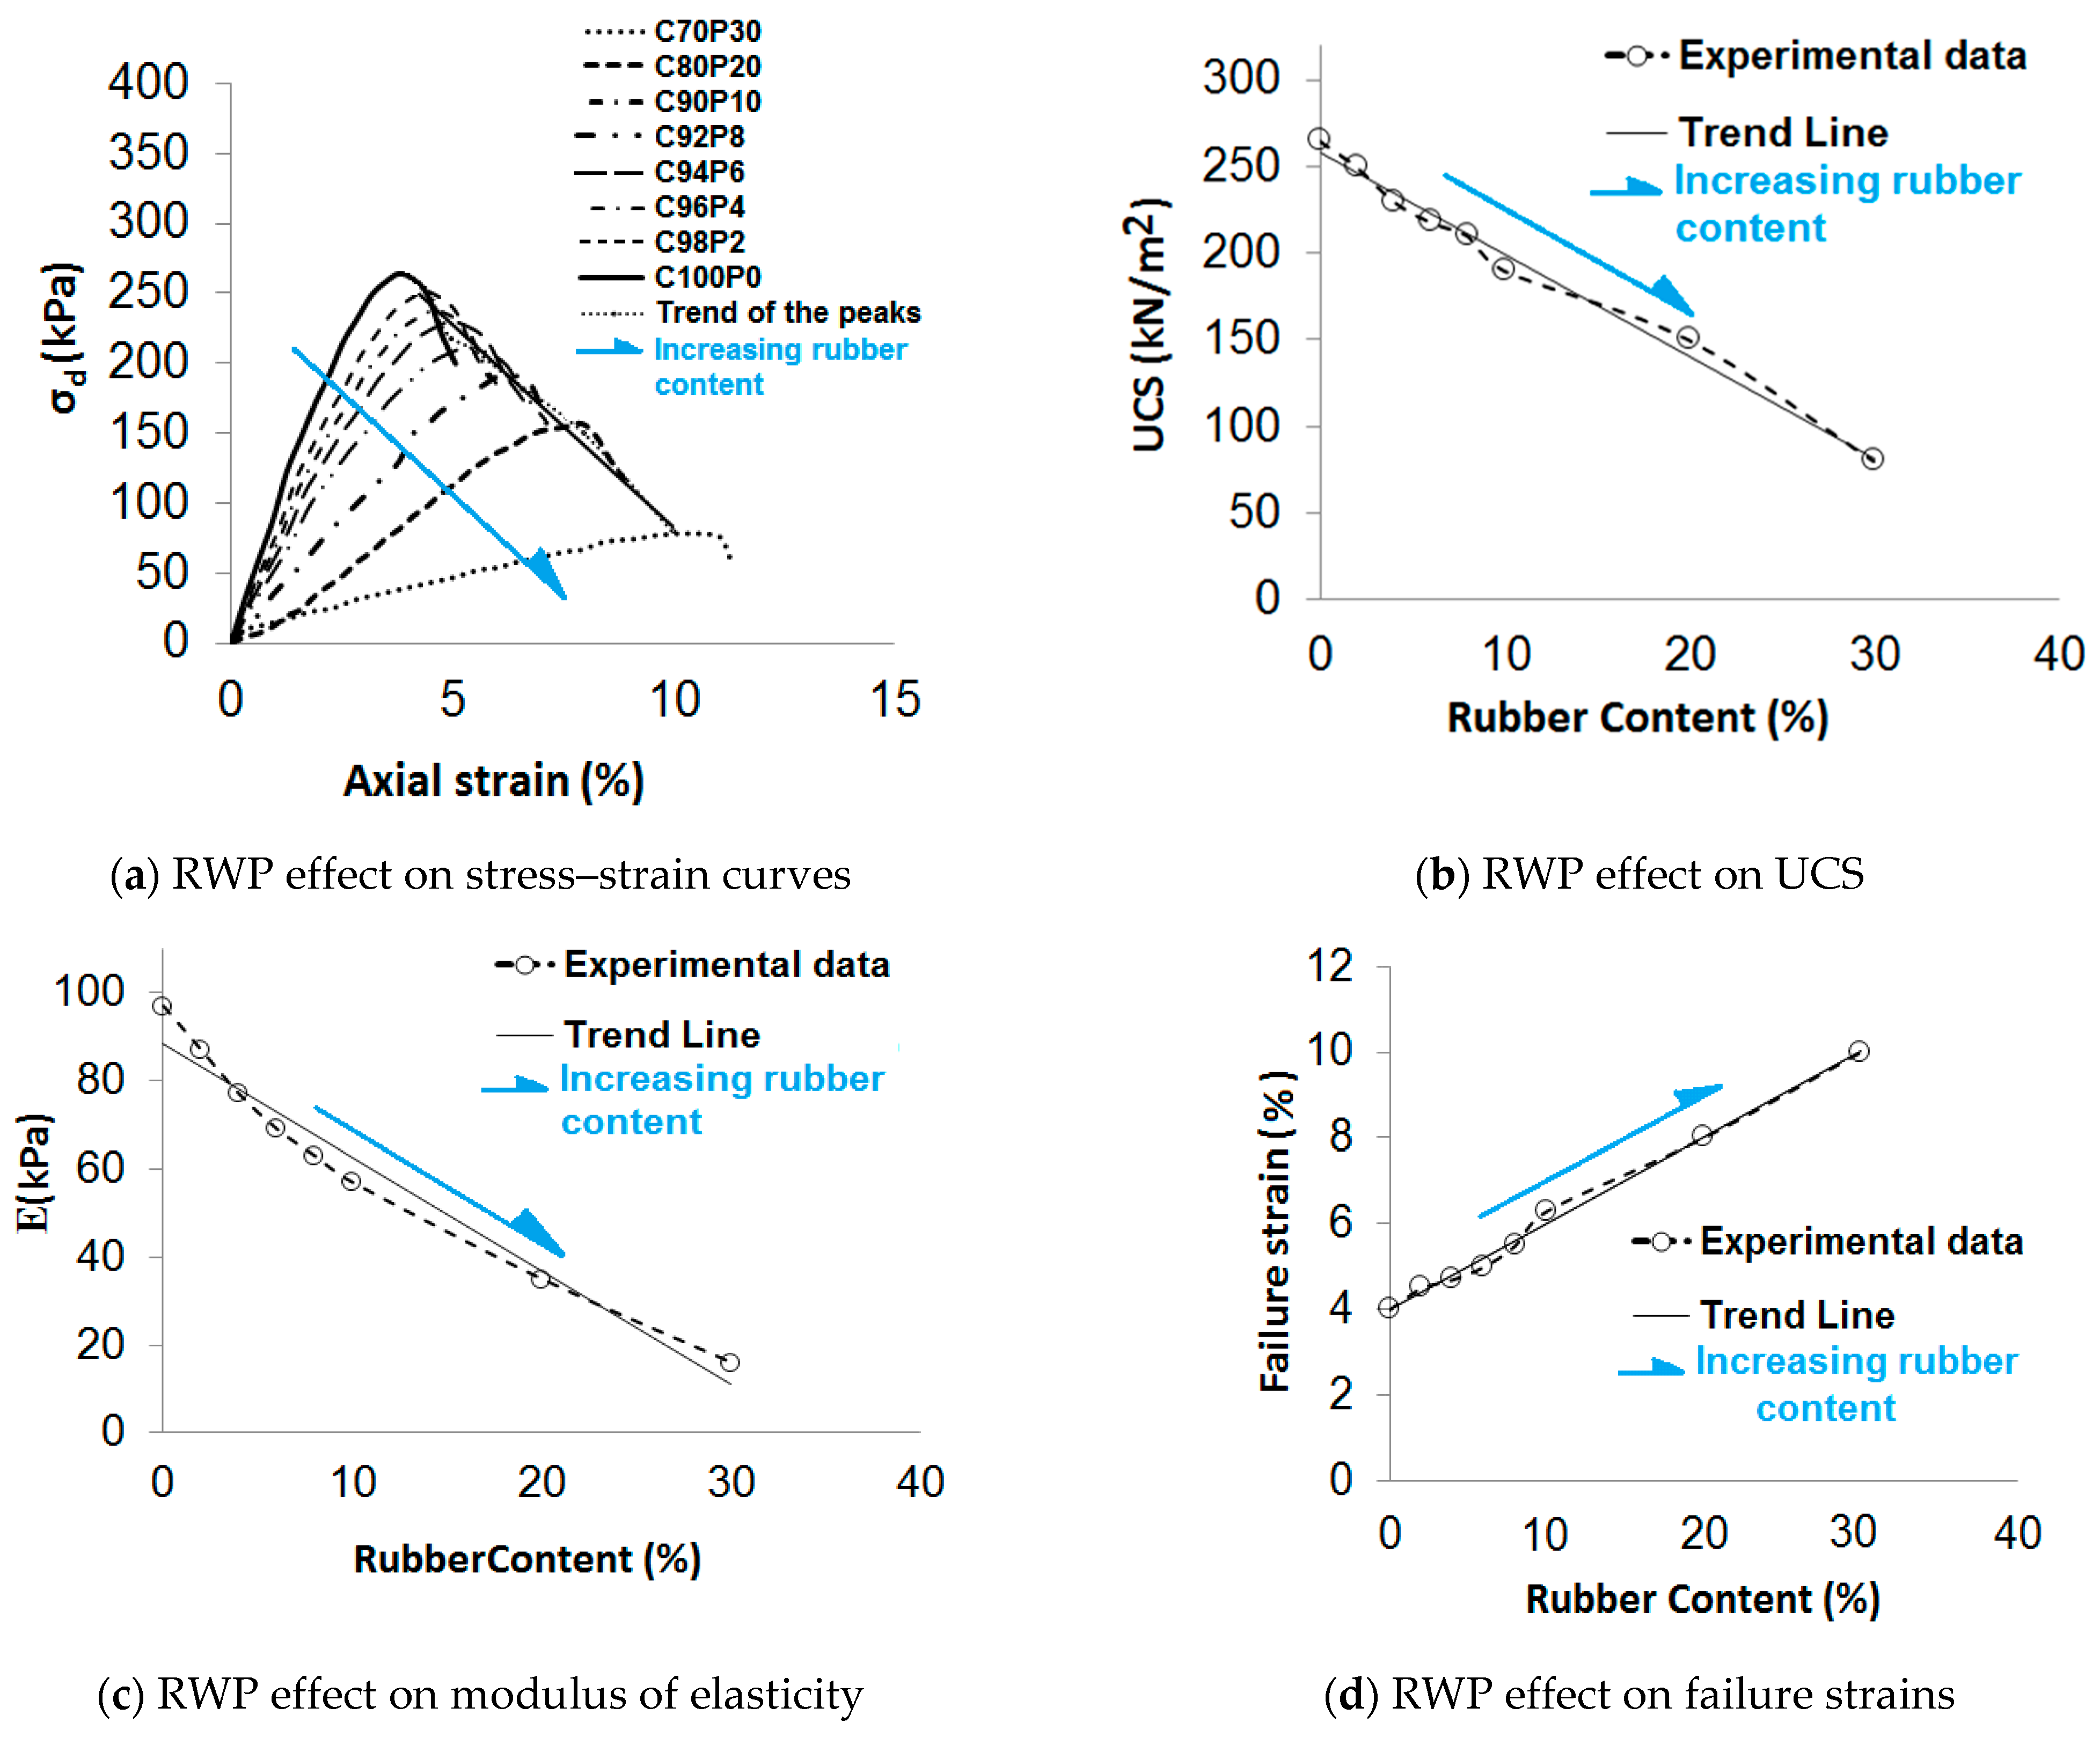
3.3. RWP Effect on UCS
4. Conclusions
- Modified e-log p’ Curves: Modified e-log p’ curves were presented for the clay–rubber mixtures, considering the elasticity of the rubber powder and its influence on the void ratio (e) of the mixture. An equation was proposed to calculate the void ratio for the clay–rubber mixture, and the initial and modified e-log p’ curves were plotted;
- Swelling Potential and free swelling: The swelling potential of specimens containing rubber powder was lower than that of the natural clay, indicating a reduction in the swelling strain of the mixture. Free swelling also decreased with an increase in rubber content. For rubber contents above 20%, free swelling remained almost constant;
- Consolidation Parameters: The consolidation parameters Cc, Cs, and Cr increased with the rise in rubber content. The lowest values of Cs, Cc, and Cr were observed for specimens with lower rubber content, equal to 0.043, 0.01, and 0.225, respectively;
- Optimum Moisture Content and Maximum Dry Density: The optimum moisture content (OMC) increased while the maximum dry density (MDD) decreased with increasing rubber content. For rubber contents of 2% and 30%, the MDD and OMC were 16.3 kN/m3, 19.1%, and 13.2 kN/m3, 21%, respectively;
- Uniaxial Test Results: The uniaxial test revealed that lower rubber content provided the highest strength and modulus of elasticity, as well as the lowest soil settlement. Failure strains increased with higher rubber content, indicating the need for higher rubber content when greater flexibility in the mixture is required;
- Overall Impact of Rubber Content: Increasing the rubber content caused changes in soil parameters, such as increased failure strains and OMC and decreased free swelling, compression index, recompression index, swelling index, UCS, modulus of elasticity, and MDD.
Author Contributions
Funding
Institutional Review Board Statement
Informed Consent Statement
Data Availability Statement
Conflicts of Interest
Abbreviations
| Initial void ratio of the soil | |
| Initial void ratio of the soil and rubber mix | |
| Void ratio of the soil in stage ‘i’ | |
| Void ratio of pure rubber in stage ‘i’ | |
| Corrected void ratio in rubber and clay mix in stage ‘i’ | |
| Change of void ratio in stage ‘i’ | |
| Specific gravity of the soil | |
| Specific gravity of the soil and rubber mix | |
| Weight of the soil | |
| Weight of the soil and rubber mix | |
| Volume of the voids in soil sample in stage ‘i’ | |
| Volume of the grains in soil sample in stage ‘i’ | |
| Volume of the voids in rubber sample in stage ‘i’ | |
| Volume of the rubber grains in rubber sample in stage ‘i’ | |
| Void ratio of the soil and rubber mix in stage ‘i’ | |
| Percent of rubber in soil-rubber mix | |
| H | Initial height of the soil |
| Initial height of the grains | |
| Initial height of the soil and rubber mix | |
| Initial height of the soil and rubber mix grains |
References
- McCartney, J.S.; Ghaaowd, I.; Fox, P.J.; Sanders, M.J.; Thielmann, S.S.; Sander, A.C. Shearing behavior of tire-derived aggregate with large particle size. II: Cyclic simple shear. J. Geotech. Geoenvironmental Eng. 2017, 143, 04017078. [Google Scholar] [CrossRef] [Green Version]
- Foose, G.J.; Benson, C.H.; Bosscher, P.J. Sand reinforced with shredded waste tires. J. Geotech. Eng. 1996, 122, 760–767. [Google Scholar] [CrossRef]
- Al-Tabbaa, A.; Aravinthan, T. Natural clay-shredded tire mixtures as landfill barrier materials. Waste Manag. 1998, 18, 9–16. [Google Scholar] [CrossRef]
- Cao, W. Study on properties of recycled tire rubber modified asphalt mixtures usingdry process. Constr. Build. Mater. 2007, 21, 1011–1015. [Google Scholar] [CrossRef]
- Yadav, J.S. Feasibility study on utilisation of clay–waste tyre rubber mix as construction material. Proc. Inst. Civ. Eng.-Constr. Mater. 2020, 176, 49–61. [Google Scholar] [CrossRef]
- Ghasemzadeh, Z.; Sadeghieh, A.; Shishebori, D. A stochastic multi-objective closed-loop global supply chain concerning waste management: A case study of the tire industry. Environ. Dev. Sustain. 2020, 23, 5794–5821. [Google Scholar] [CrossRef]
- Cui, M.J.; Zheng, J.J.; Dahal, B.K.; Lai, H.J.; Huang, Z.F.; Wu, C.C. Effect of waste rubber particles on the shear behaviour of bio-cemented calcareous sand. Acta Geotech. 2021, 16, 1429–1439. [Google Scholar] [CrossRef]
- Saberian, M.; Mehrinejad Khotbehsara, M.; Jahandari, S.; Vali, R.; Li, J. Experimental and phenomenological study of the effects of adding shredded tire chips on geotechnical properties of peat. Int. J. Geotech. Eng. 2018, 12, 347–356. [Google Scholar] [CrossRef]
- Akbarimehr, D.; Fakharian, K. Dynamic shear modulus and damping ratio of clay mixed with waste rubber using cyclic triaxial apparatus. Soil Dyn. Earthq. Eng. 2021, 140, 106435. [Google Scholar] [CrossRef]
- Akbarimehr, D.; Eslami, A.; Aflaki, E. Geotechnical behaviour of clay soil mixed with rubber waste. J. Clean. Prod. 2020, 271, 122632. [Google Scholar] [CrossRef]
- Jastrzębska, M.; Tokarz, K. Strength Characteristics of Clay–Rubber Waste Mixtures in Low-Frequency Cyclic Triaxial Tests. Minerals 2021, 11, 315. [Google Scholar] [CrossRef]
- Cai, Y.; Shi, B.; Ng, C.; Tang, C. Effect of polypropylene fibre and lime admixture on engineering properties of clayey soil. Eng. Geol. 2006, 87, 230–240. [Google Scholar] [CrossRef]
- Signes, C.H.; Garzón-Roca, J.; Fernández, P.M.; Torre, M.E.G.; Franco, R.I. Swelling potential reduction of Spanish argillaceous marlstone Facies Tap soil through the addition of crumb rubber particles from scrap tyres. Appl. Clay Sci. 2016, 132, 768–773. [Google Scholar] [CrossRef]
- Attom, M.F. The use of shredded waste tires to improve the geotechnical engineering properties of sands. Environ. Geol. 2006, 49, 497–503. [Google Scholar] [CrossRef]
- Cetin, H.; Fener, M.; Gunaydin, O. Geotechnical properties of tire cohesive clayey soil mixtures as a fill material. Eng. Geol. 2006, 88, 110–120. [Google Scholar] [CrossRef]
- Eslami, A.; Akbarimehr, D. Failure Analysis of Clay Soil-Rubber Waste Mixture as a Sustainable Construction Material. Constr. Build. Mater. 2021, 310, 125274. [Google Scholar] [CrossRef]
- Eslami, A.; Akbarimehr, D.; Aflaki, E.; Hajitaheriha, M.M. Geotechnical site characterization of the Lake Urmia super-soft sediments using laboratory and CPTu records. Mar. Georesources Geotechnol. 2020, 38, 1223–1234. [Google Scholar] [CrossRef]
- Hajitaheriha, M.M.; Akbarimehr, D.; Motlagh, A.H.; Damerchilou, H. Bearing capacity improvement of shallow foundations using a trench filled with granular materials and reinforced with geogrids. Arab. J. Geosci. 2021, 14, 1–14. [Google Scholar] [CrossRef]
- Xiao, Y.; Nan, B.; McCartney, J.S. Thermal Conductivity of Sand–Tire Shred Mixtures. J. Geotech. Geoenviron. Eng. 2019, 145, 06019012. [Google Scholar] [CrossRef] [Green Version]
- Zornberg, J.G.; Cabral, A.R.; Viratjandr, C. Behaviour of tire shred sand mixtures. Can. Geotech. J. 2004, 41, 227–241. [Google Scholar] [CrossRef]
- Rao, G.V.; Dutta, R. Compressibility and strength behaviour of sand–tyre chip mixtures. Geotech. Geol. Eng. 2006, 24, 711–724. [Google Scholar] [CrossRef]
- Neaz Sheikh, M.; Mashiri, M.; Vinod, J.; Tsang, H.H. Shear and compressibility behavior of sand–tire crumb mixtures. J. Mater. Civ. Eng. 2012, 25, 1366–1374. [Google Scholar] [CrossRef]
- Sharifi, M.; Meftahi, M.; Naeini, S.A. Influence of waste tire chips on steady state behavior of sand. J. Eng. Geol. 2019, 12, 189–212. [Google Scholar] [CrossRef]
- Tajdini, M.; Nabizadeh, A.; Taherkhani, H.; Zartaj, H. Effect of added waste rubber on the properties and failure mode of kaolinite clay. Int. J. Civ. Eng. 2017, 15, 949–958. [Google Scholar] [CrossRef]
- Akbarimehr, D.; Hosseini, S.M.M.M. Elasto-plastic characteristics of the clay soil mixed with rubber waste using cyclic triaxial test results. Arab. J. Geosci. 2022, 15, 1280. [Google Scholar] [CrossRef]
- Zhou, J.; Luo, L.H.; Yu, L.G.; Nangulama, H. Experimental study about the influence of cyclic load on the hydraulic conductivity of clay. Acta Geotech. 2020, 15, 3357–3370. [Google Scholar] [CrossRef]
- Wang, J.; Guo, Z.; Yuan, Q.; Zhang, P.; Fang, H. Effects of ages on the ITZ microstructure of crumb rubber concrete. Constr. Build. Mater. 2020, 254, 119329. [Google Scholar] [CrossRef]
- Ou, C.Y.; Lin, C.Y.; Chien, S.C. On the behavior of the cured electroosmotic chemical treated clay. Acta Geotech. 2020, 15, 2341–2354. [Google Scholar] [CrossRef]
- Kong, L.; Yao, Y.; Qi, J. Modeling the combined effect of time and temperature on normally consolidated and overconsolidated clays. Acta Geotech. 2020, 15, 2451–2471. [Google Scholar] [CrossRef]
- Han, J.; Yin, Z.Y.; Dano, C.; Hicher, P.Y. Cyclic and creep combination effects on the long-term undrained behavior of overconsolidated clay. Acta Geotech. 2021, 16, 1027–1041. [Google Scholar] [CrossRef]
- Trouzine, H.; Asroun, A.; Bekhiti, M. Effects of scrap tyre rubber fibre on swelling behaviour of two clayey soils in Algeria. Geosynth 2012, 19, 124–132. [Google Scholar] [CrossRef]
- Mukherjee, K.; Mishra, A.K. The impact of scrapped tyre chips on the mechanical properties of liner materials. Environ. Process 2017, 4, 219–233. [Google Scholar] [CrossRef]
- Akbarimehr, D.; Eslami, A.; Aflaki, E.; Imam, R. Using empirical correlations and artificial neural network to estimate compressibility of low plasticity clays. Arab. J. Geosci. 2020, 13, 1–11. [Google Scholar] [CrossRef]
- Akbarimehr, D.; Eslami, A.; Imam, R. Correlations between Compression Index and Index Properties of Undisturbed and Disturbed Tehran clay. Geotech. Geol. Eng. 2021, 39, 5387–5393. [Google Scholar] [CrossRef]
- Akbarimehr, D.; Eslami, A.; Aflaki, E.; Hajitaheriha, M.M. Investigating the effect of waste rubber in granular form on strength behavior of Tehran clay. Arab. J. Geosci. 2021, 14, 1–12. [Google Scholar] [CrossRef]
- ASTM D422; Standard Test Method for Particle-Size Analysis of Soils. ASTM International: West Conshohocken, PA, USA, 2007; Volume 63, pp. 1–8.
- ASTM D2487; Standard Practice for Classification of Soils for Engineering Purposes (Unified Soil Classification System). ASTM International: West Conshohocken, PA, USA, 2010.
- ASTM D854; Standard Test Methods for Specific Gravity of Soil Solids by Water Pycnometer. ASTM International: West Conshohocken, PA, USA, 2010.
- ASTM D4318; Standard Test Method for Liquid Limit Plastic Limit, and Plasticity Index of Soils. ASTM International: West Conshohocken, PA, USA, 2010.
- ASTM D698; Standard Test Methods for Laboratory Compaction Characteristics of Soil Using Standard Effort. ASTM International: West Conshohocken, PA, USA, 2007.
- ASTM D2166; Standard Test Method for Unconfined Compressive Strength of Cohesive Soil. ASTM International: West Conshohocken, PA, USA, 2016.
- ASTM D2435; Standard Test Method for One-Dimensional Consolidation Properties of Soils Using Incremental Loading. ASTM International: West Conshohocken, PA, USA, 2011.


| Reseach Topic | References | RWs Content (%) | RWs | Soil | RWs Size (mm) |
|---|---|---|---|---|---|
| Mechanical properties | [32] | 5, 10 & 15 | Chips * | CH | 4.75–2 |
| Construction material | [5] | 2.5, 5, 7.5 and 10% | Granulate and fiber | CL | 0.8–2 mm, fiber |
| Geotechnical properties | [10] | 0, 2, 4, 6, 8, 10, 20 & 30 | 4 forms of rubber | CL | Different size |
| Dynamic properties | [9] | <1 mm and 1–5 mm | Granular | Tehran Clay | 0, 2, 4, 6, 8, 10, 20 and 30% |
| Strength Characteristics | [11] | 5, 10 and 25% | Granular | Red clay & Kaolin | 0.1–1 mm and 1–5 mm |
| Failure analysis | [16] | 10, 20 and 30% | 4 forms of rubber | CL | Different size |
| Elaspo-plastic charactristics | [25] | Up to 30% | Granular | Tehran clay | <1 and 1–5 |
| Sample Number | Sample Type | Sample Code | Test |
|---|---|---|---|
| 1 | Pure clay soil | C100P0 | U.C.S, Com., Con. |
| 2 | Clay soil + 2% rubber powder | C98P2 | U.C.S, Com., Con. |
| 3 | Clay soil + 4% rubber powder | C96P4 | U.C.S, Com., Con. |
| 4 | Clay soil + 6% rubber powder | C94P6 | U.C.S, Com., Con. |
| 5 | Clay soil + 8% rubber powder | C92P8 | U.C.S, Com., Con. |
| 6 | Clay soil + 10% rubber powder | C90P10 | U.C.S, Com., Con. |
| 7 | Clay soil + 20% rubber powder | C80P20 | U.C.S, Com., Con. |
| 8 | Clay soil + 30% rubber powder | C70P30 | U.C.S, Com., Con. |
| 9 | 100% rubber | C0R100 | Con. |
| Test Types: | |||
| U.C.S.: | Unconfined compressive strength (ASTM D2166) [41] | Com.: | Standard compaction test (ASTM D698) [40] |
| Con.: | Consolidation test (ASTM D2435) [42] | ||
| Equations for calculation of void ratio for pure soil | No. |
| (1) | |
| (2) | |
| (3) | |
| Equations for calculation of void ratio for soil and rubber mix | No. |
| (4) | |
| (5) | |
| (New equation for soil and rubber mixture) | (6) |
Disclaimer/Publisher’s Note: The statements, opinions and data contained in all publications are solely those of the individual author(s) and contributor(s) and not of MDPI and/or the editor(s). MDPI and/or the editor(s) disclaim responsibility for any injury to people or property resulting from any ideas, methods, instructions or products referred to in the content. |
© 2023 by the authors. Licensee MDPI, Basel, Switzerland. This article is an open access article distributed under the terms and conditions of the Creative Commons Attribution (CC BY) license (https://creativecommons.org/licenses/by/4.0/).
Share and Cite
Akbarimehr, D.; Rahai, A.; Eslami, A.; Karakouzian, M. Deformation Characteristics of Rubber Waste Powder–Clay Mixtures. Sustainability 2023, 15, 12384. https://doi.org/10.3390/su151612384
Akbarimehr D, Rahai A, Eslami A, Karakouzian M. Deformation Characteristics of Rubber Waste Powder–Clay Mixtures. Sustainability. 2023; 15(16):12384. https://doi.org/10.3390/su151612384
Chicago/Turabian StyleAkbarimehr, Davood, Alireza Rahai, Abolfazl Eslami, and Moses Karakouzian. 2023. "Deformation Characteristics of Rubber Waste Powder–Clay Mixtures" Sustainability 15, no. 16: 12384. https://doi.org/10.3390/su151612384