Article

How Innovation Affects Users’ Emotional Responses: Implications for Product Success and Business Sustainability

by
María Alonso-García
1,2,*,
Daniel Moreno Nieto
3 and
Elena Cabrera Revuelta
3
1
Department of Graphic Expression, Design and Projects, Higher Technical School of Engineering, University of Malaga, 29071 Malaga, Spain
2
Research Group TEP189: Graphic Design and Engineering, University of Malaga, 29071 Malaga, Spain
3
Department of Mechanical Engineering and Industrial Design, University of Cádiz, 10 Avenue Puerto Real, 11510 Cadiz, Spain
*
Author to whom correspondence should be addressed.
Sustainability 2023, 15(16), 12231; https://doi.org/10.3390/su151612231
Submission received: 15 July 2023 / Revised: 1 August 2023 / Accepted: 6 August 2023 / Published: 10 August 2023
(This article belongs to the Special Issue Business, Innovation, and Economics Sustainability)

Abstract

:
The market is experiencing an expanding range of products, prompting manufacturing companies to differentiate themselves from competitors by moving away from conventional concepts. However, these innovations often fail to meet consumer expectations, leading to product failure, and consequently, an unsustainable evolution of the market and the business. This unsustainability requires designers to adapt innovations to align with consumer needs and desires. Understanding and validating these adaptations can be achieved by examining users’ emotional responses to innovative products. The objective of this study is to assess the influence of innovation in the development of new successful products, sales performance, and, therefore, business sustainability. This evaluation is based on the perceptions of potential consumers through the analysis of users’ emotional responses to various new product concepts at different design stages. A case study presents the evaluation of 48 new interactive lamp concepts categorized into relaxation, study, and leisure topics. The target audience for these concepts is consumers aged 18 to 24. The designs were developed by 12 teams of final-year industrial design students using insights from a prior psychographic study involving over 800 potential consumers. The findings highlight differences in users’ perceptions of innovative and traditional products across topics. These differences relate to users’ interest, intuitiveness, and desirability toward a product. Generally, traditional product concepts are perceived as more intuitive, but users show greater interest and desire for innovative concepts, with some variations among the analyzed topics. The business environment is encouraged to share these data with new product-development teams to achieve sustainable market and business growth.

1. Introduction

In the context of highly competitive markets, where consumers are faced with numerous product options, it is widely acknowledged that the added value of products can significantly impact consumer choices. This additional value can be achieved through innovation, enhancing competitiveness, and promoting sustainability in product design [1]. The term “innovation” encompasses a broad spectrum of meanings. Individual innovation is defined by Van de Ven [2] as involving the development and implementation of novel ideas by individuals who engage with others within a specific institutional context.
In terms of new product development (NPD), it is possible to differentiate between design and technological innovation. In both cases, the presence of innovation in a product is determined by the degree to which it deviates from previous designs in a given product category. In other words, the more a product resembles previous concepts from competitors, the less innovative it is [2]. In particular, design innovation focuses on the external appearance of the product and issues related to color, shape, proportion, and other aesthetic parameters [3,4,5]. Technological innovation, on the other hand, is focused on product technology and related functionalities [4,6,7].
However, this innovation, in practical terms, may not be what is desired by the potential consumer. Some of the most innovative products, despite appearing potentially successful, fail when they reach the market [8,9]. This may happen due to innovation influencing psychological responses, but also consumer behavior [10]. The connection between psychological responses and consumer behavior plays a vital role in Emotional Design (ED) [11], which serves as a powerful tool for establishing enduring relationships between users and products [12]. Emotional Design, as described by Norman, operates on three distinct levels [13]: visceral or appearance (VL), behavioral or related to product usability (BL), and reflective or related to its semantics and meaning (RL). By incorporating Emotional Design into these three levels, designers can craft products that evoke positive emotional responses, fostering stronger and lasting bonds between users and the products they engage with.
In this sense, and according to previous research, product design should be both unique and familiar. On one hand, it should stand out to attract consumers, but on the other hand, it should resemble its product category to be easily understood by them [1,14]. A novel product can capture the attention of potential consumers by differentiating itself from others on the market, thus stimulating their interest and curiosity [2]. As stated by [15], a consumer’s general inclination towards adopting innovations plays a positive moderating role in the relationship between innovative design and consumer purchase intention. The cognitive effort required by a user to understand innovative designs can be high [4], especially if the implanted innovative aspects are not easily classifiable in existing category schemes [1]. This difficulty can lead to unwanted “learning costs” for the consumer, leading to a negative impact on consumer response [4].
On this point, it is possible to relate, respectively, the psychological and behavioral responses to Levels 1 and 2 of ED. This paradigm helps to generate stronger and longer-lasting relationships between the user and the product [12]. It defines the context in which the emotions from interacting with the object will be perceived [16]. Therefore, the collaboration of potential users during the design process is essential for testing new products.
Industrial designers must take into account the needs of users to achieve successful and desirable products. Testing products throughout the design process can be an advantage to analyze user perception, and generating a successful and sustainable market, especially if it is conducted from the early stages [17,18]. Some researchers approach this evaluation from the final product, through techniques such as Kansai engineering [19] or the creation of semantic differentials [20], but also from specific methods that combine the measurement of different dimensions of the products. In this sense, the “FULE” method that analyzes Functionality, Usability, Appearance, and Evaluation is remarkable as a design methodology for user-centered products [21]. There are also methods for tracing theory in person–product interaction [21], which relates some person–product interactions to positive emotions [22]. However, most of these studies are conducted during the final design phase, instead of earlier phases. As mentioned above, the earlier this information is received, the better the product design or development can be addressed. The different studies that have been analyzed here focus on validating designs; however, these studies do not contemplate how innovation influences the success and commercialization of new products. The present research assesses how product innovation influences user perception of the product. To achieve this, the emotional response of potential consumers toward 48 original concepts of interactive lamps, designed with varying levels of innovation, is examined. This emotional response is analyzed in the early stages of the design process, based on the three levels of Emotional Design established by Norman [13].
For this reason, this introduction section (1) is followed by a theoretical framework on ED (2), which presents the theoretical foundation of Emotional Design, exploring its key concepts and principles. After this, the methodology used for the development of this research and specific case study (3) and the results obtained (4) are presented. Finally, the results obtained are discussed (5) in accordance with the current state of the art, concluding with the main contributions and limitations of the study (6).

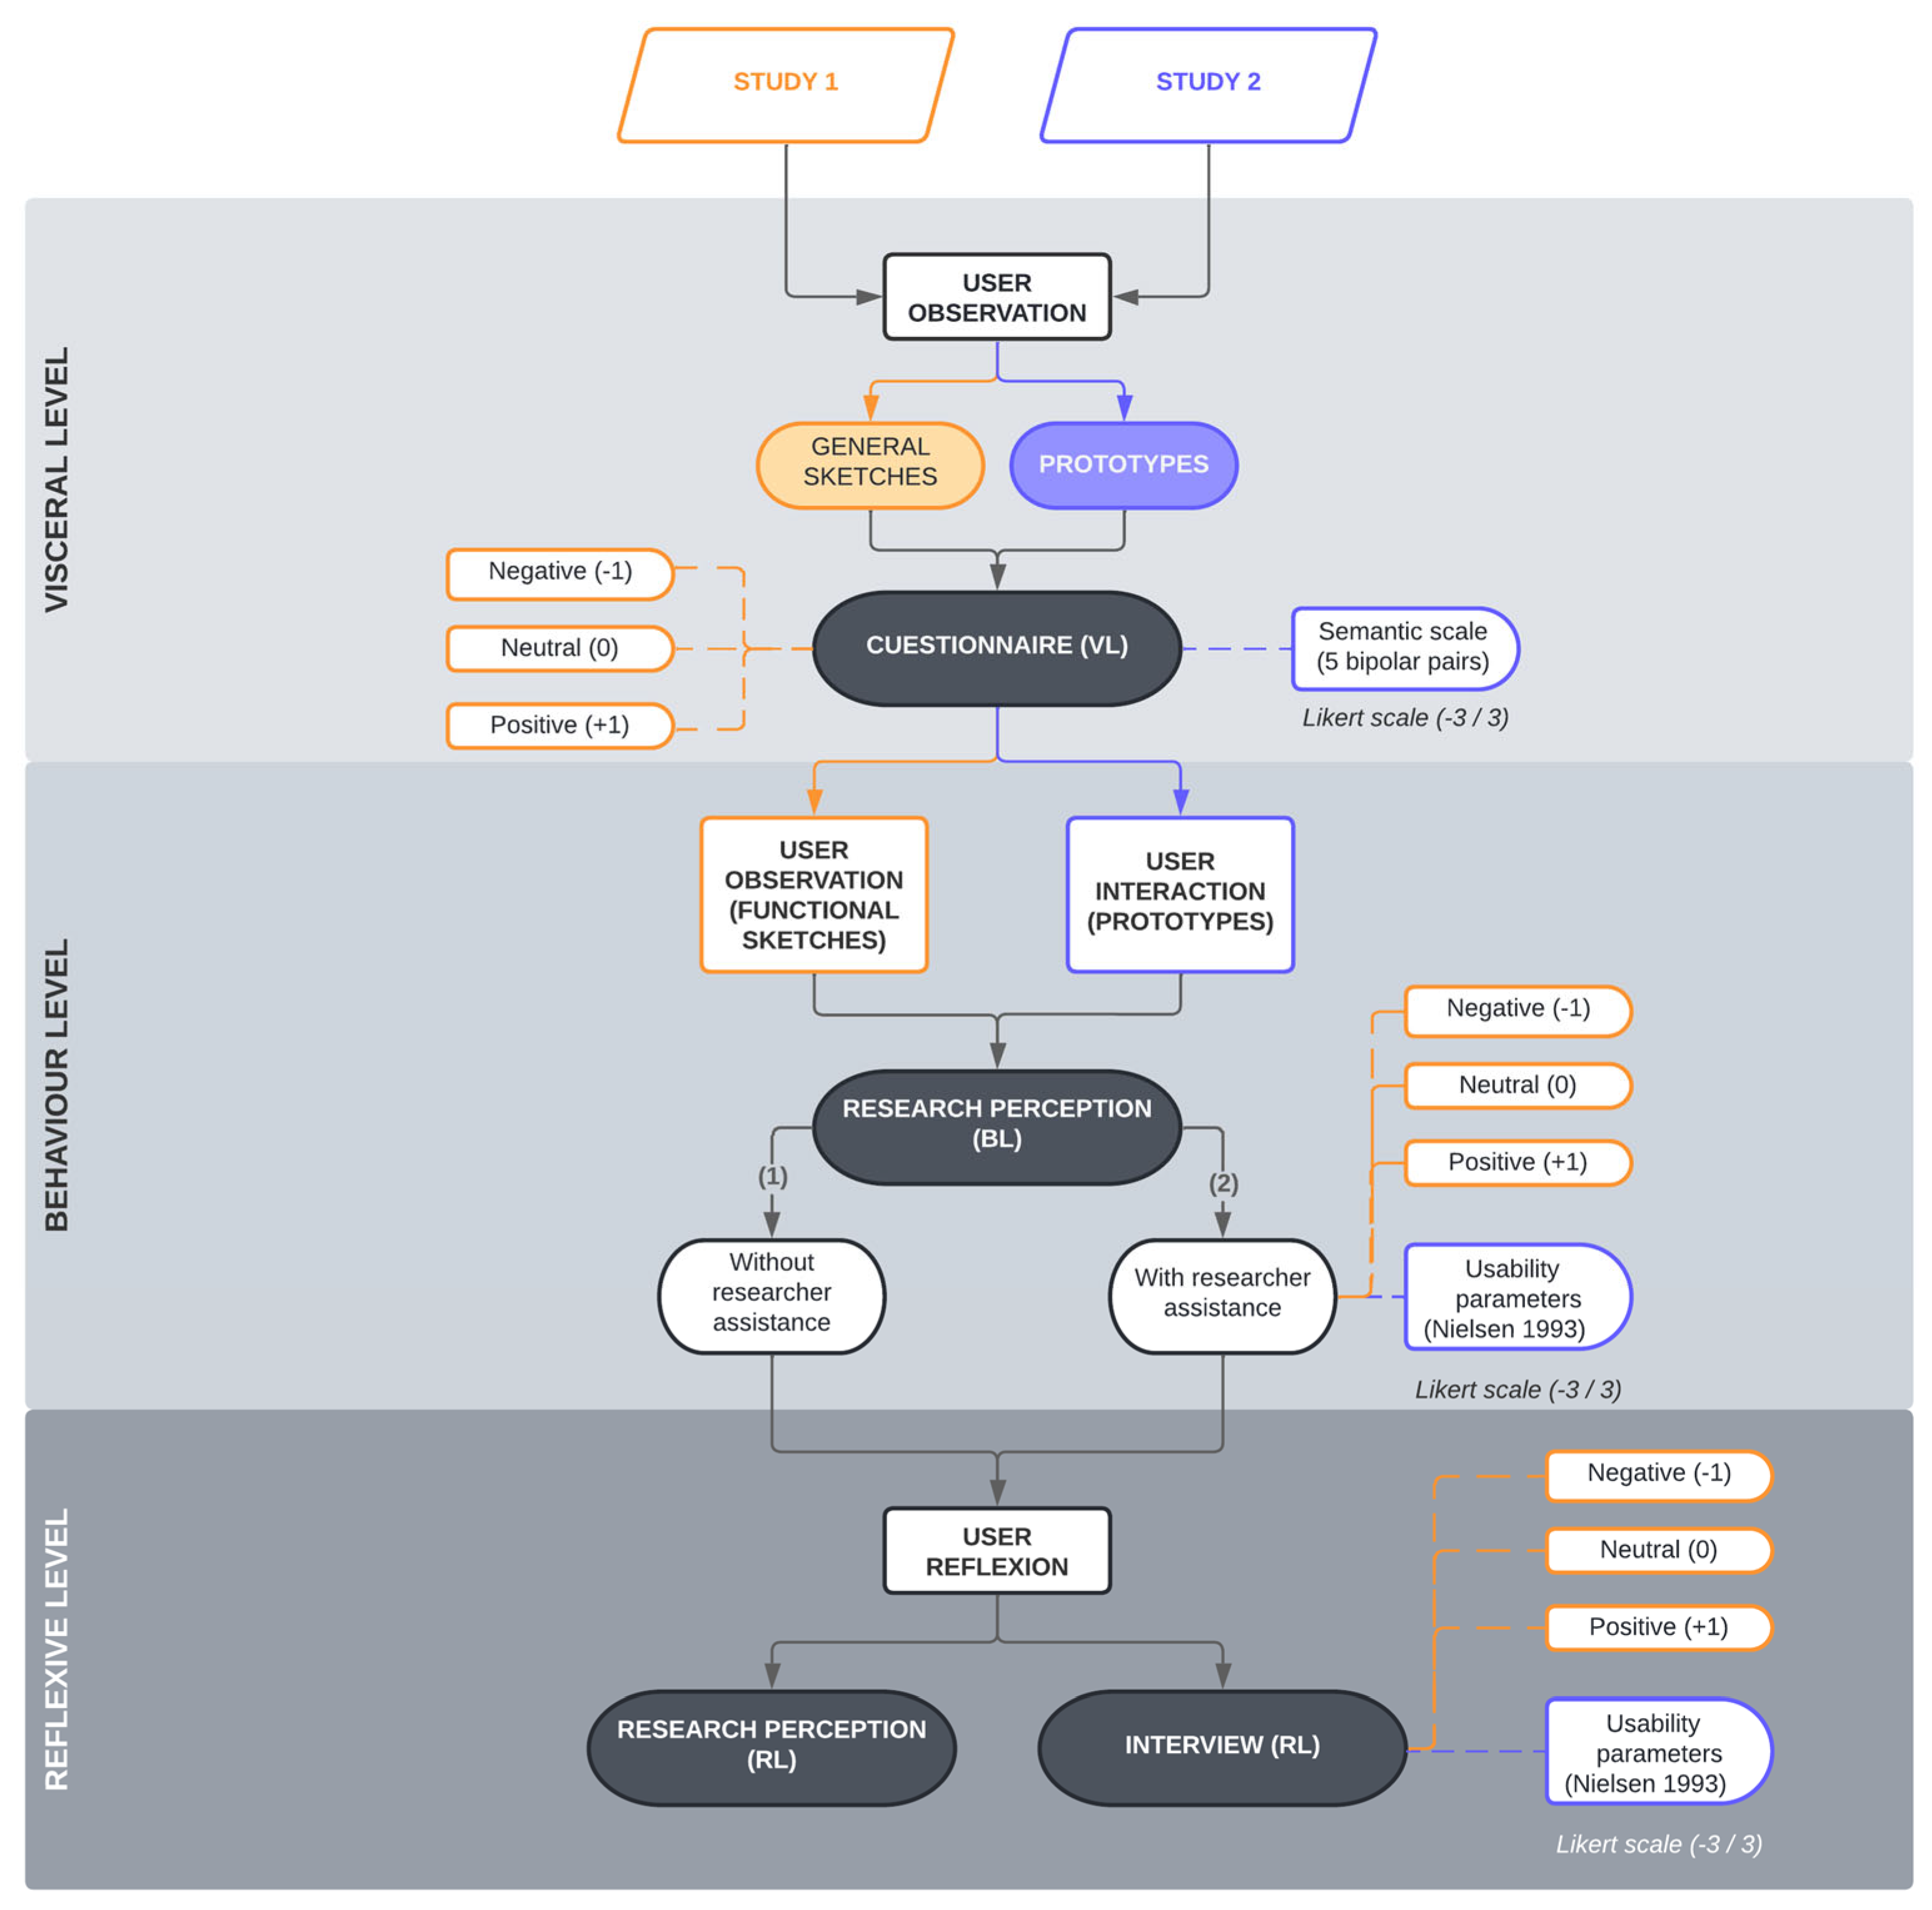
2. The Emotional Design—Considerations and Levels

According to previous research, ED is a tool that fosters strong and enduring user–product relationships [11,12]. This tool categorizes user response to a product into three levels [11]: the visceral level (VL), the behavioral level (BL), and the reflective level (RL). VL and BL are linked to the present, while RL extends over time, encompassing the past and future. It is essential to assess user response at different stages of exposure to the product. VL represents the initial emotional connection between the user and the product, so the responses should be measured immediately. BL relates to usability and captures user experience during product use, encompassing both positive and negative aspects [23]. Hence, this response should be measured during product use. Finally, RL is associated with the product’s semantics and meaning, encompassing the message and image it conveys to the user. This level gives rise to an emotional attachment that endures over time, differentiating the product from others in the market and making it challenging for the user to replace it. To evaluate RL, measurements should be taken after the product has been used.
Among the three different levels, BL is the only one related to questions of product functionality, while the other two correspond to user perception and psychology. The three levels are discussed separately below. Every combination of the responses from the user to the three levels defined by Norman [11] will generate an emotional response that could generate a pleasant or unpleasant experience that could create a satisfactory emotional relationship with the product or not.

2.1. The Visceral Level

At the first level, a first expectation about the product is created from a stimulus perceived by the user when exposed to the product. This first perception comes from the subconscious level [13]. As a result, the user is not able to control their emotions and responses directly through various emotional interactions [11,21].
The stimulus necessary to create this emotional response can be perceived through sight, smell, touch, taste, or hearing. However, the sense most commonly employed by other research is sight. Specifically, most studies use drawings or sketches to elicit positive emotional responses at this level [23,24]. This allows the product to be subjected to constant modifications quickly and economically [25]. Some research employs physical prototypes. However, users are asked for their first impression before being invited to interact with the product [26] so the sense employed is still that of sight. On the other hand, it is clear that this level is related to a surprise factor, so the study of surprising product features is crucial to design products that arouse attention and curiosity [27]. In this curiosity, there is a certain relationship with that perceived through innovation and differentiation of the concept of traditional products [28]. According to this research, the product’s ability to surprise not only depends on how much it differs from its predecessors. The emotions evoked by the same product can vary in different users [29]. In this context, it is important to highlight the distinction between the reaction of an individual person and that of the rest of a group, as well as to consider the role of time and the environment in which each case takes place. Each individual can have a unique and personalized response, influenced by their own characteristics, experiences, and perspectives. On the other hand, the collective behavior of a group can be influenced by social dynaamics, shared norms, and processes of mutual influence.
Furthermore, time and the environment also play a crucial role in how people respond to an event. Mood, circumstances, and environmental conditions can significantly impact individuals’ reactions and perceptions. Therefore, it is important to consider these factors when analyzing individual and group responses, as they can provide a more comprehensive and contextualized understanding of human behavior. Controlling or managing these emotions is a highly intricate task, given that they can differ significantly among users and may also change depending on the context, timing, or location of the interaction.

2.2. The Behavioral Level

The emotional impact at this level is closely related to how effortlessly the user can achieve their goal. If the product facilitates minimal attention, movements, or execution time, the response is likely to be positive. Conversely, if the action requires significant physical or intellectual effort, user experience may turn negative [29].
Hence, this level is typically evaluated using conventional usability parameters since it emphasizes the functional aspects of the product. [26,30,31,32]. These parameters are learning facility (LF), which shows how easy it is to perform the tasks the first time the product is used; effectiveness (EY), able to recognize if after a while the user still remembers how it works; memorization (M), aimed at evaluating the errors made when performing the task; efficiency (ES), which evaluates the time it takes the user to perform the tasks once the user knows how the product works; and satisfaction (S), which seeks to know how pleasant and easy is to use the product [33]. Furthermore, it is crucial to emphasize that needs that appear to be extremely obvious are categorized as “explicit” and can be easily identified by users, therefore enabling designers to transform them into products [34]. Nevertheless, there are needs classified as “implicit” that are not easily identifiable. These needs are fulfilled by users themselves through the immediate use of their senses and their creative problem-solving abilities [35]. This is related to the human mind, which is divided into conscious and non-conscious levels [36], linked, respectively, to explicit and implicit needs [34]. When using an umbrella, users consciously do so to protect themselves from the rain, driven by their thoughts and perceptions [37]. This conscious mechanism aligns with the intended purpose of the product [28]. Additionally, there are preconscious and unconscious levels of interaction. The preconscious level involves automatic responses triggered by external stimuli, allowing users to adjust the umbrella in response to, for example, a gust of wind. This adjustment is made in a “semi-conscious” manner, and user learning from this action can be analyzed afterward. Finally, once the user has finished using the umbrella, they unconsciously shake it to remove any remaining water. This unconscious level can only be assessed through observation and during the action [38], bringing to light violent motives, irrational wishes, immoral urges, selfish needs, shameful experiences, and fears. Such actions are not usually considered during the design process.
Due to the need to observe the user interacting with the product, most studies recommend employing physical prototypes to assess the emotional response of users at this level [39,40]. However, other studies use more economical visual methods, such as the FULE method [23], which employs pictures and sketches to analyze user perception through the visual characterization of medical devices, or Palacios et al., which employs virtual reality to analyze some usability–user perception parameters [41].

2.3. The Reflexive Level

At this level, long-term effects on emotions and user satisfaction with a particular product are observed [21]. Emotional attachment is determined by user disposition to perceive, reflect, and give meaning to a product, rather than the product itself. According to Norman [13,22,42], this personal satisfaction arises when user experience is compared with memories, leading to an emotional response and creating a strong emotional bond between the user and the product. This psychological construct is consciously generated and allows specific communication of information about user lifestyle. Various studies have connected past experiences to the meaning a product holds for an individual and their emotional response [12,22,31].
The relationship between sensory stimuli, memory, and the symbolic communication of a product has been explored since the 1980s by Krippendorff in product semantics [39,40,41] and later research further linked it to emotions [43]. This research demonstrated the connection between each user’s past experiences, the meaning they associate with each product, and how this relationship triggers an emotional response to the product.

3. Methodology

This research aims to provide a deeper understanding of how innovation can impact consumers’ perception and ultimately the success of a product in the market. To achieve this, we assessed 48 novel early concepts of interactive lamps in two separate studies. In the first study, users evaluated the concepts through sketches, while in the second study, 8 of these concepts were further evaluated using physical prototypes. These 48 new initial concepts were based on the design exercise of 48 volunteer students from recent years of the industrial design Degree at the University of Cadiz, who were grouped into 12 teams and tasked with designing interactive lamps for young people aged 18 to 24. The design of each lamp was based on the results of a previous psychographic study conducted by the researchers and corresponded to three different topics. Additionally, each concept had to be presented following the formal and temporal conditions established by the researchers. The researchers used the resulting products to analyze, through a case study, how innovation affects the emotional response that the user may have towards a product. To carry out this task, various hypotheses were formulated and contrasted through direct user feedback in the two mentioned studies. The following are (1) the research aim and described hypotheses, (2) the design process and its relationship to the research task, (3) the conducted psychographic study, (4) the resulting lamps, and (5) the procedure used for data collection and analysis.

3.1. Research Aims and Hypotheses
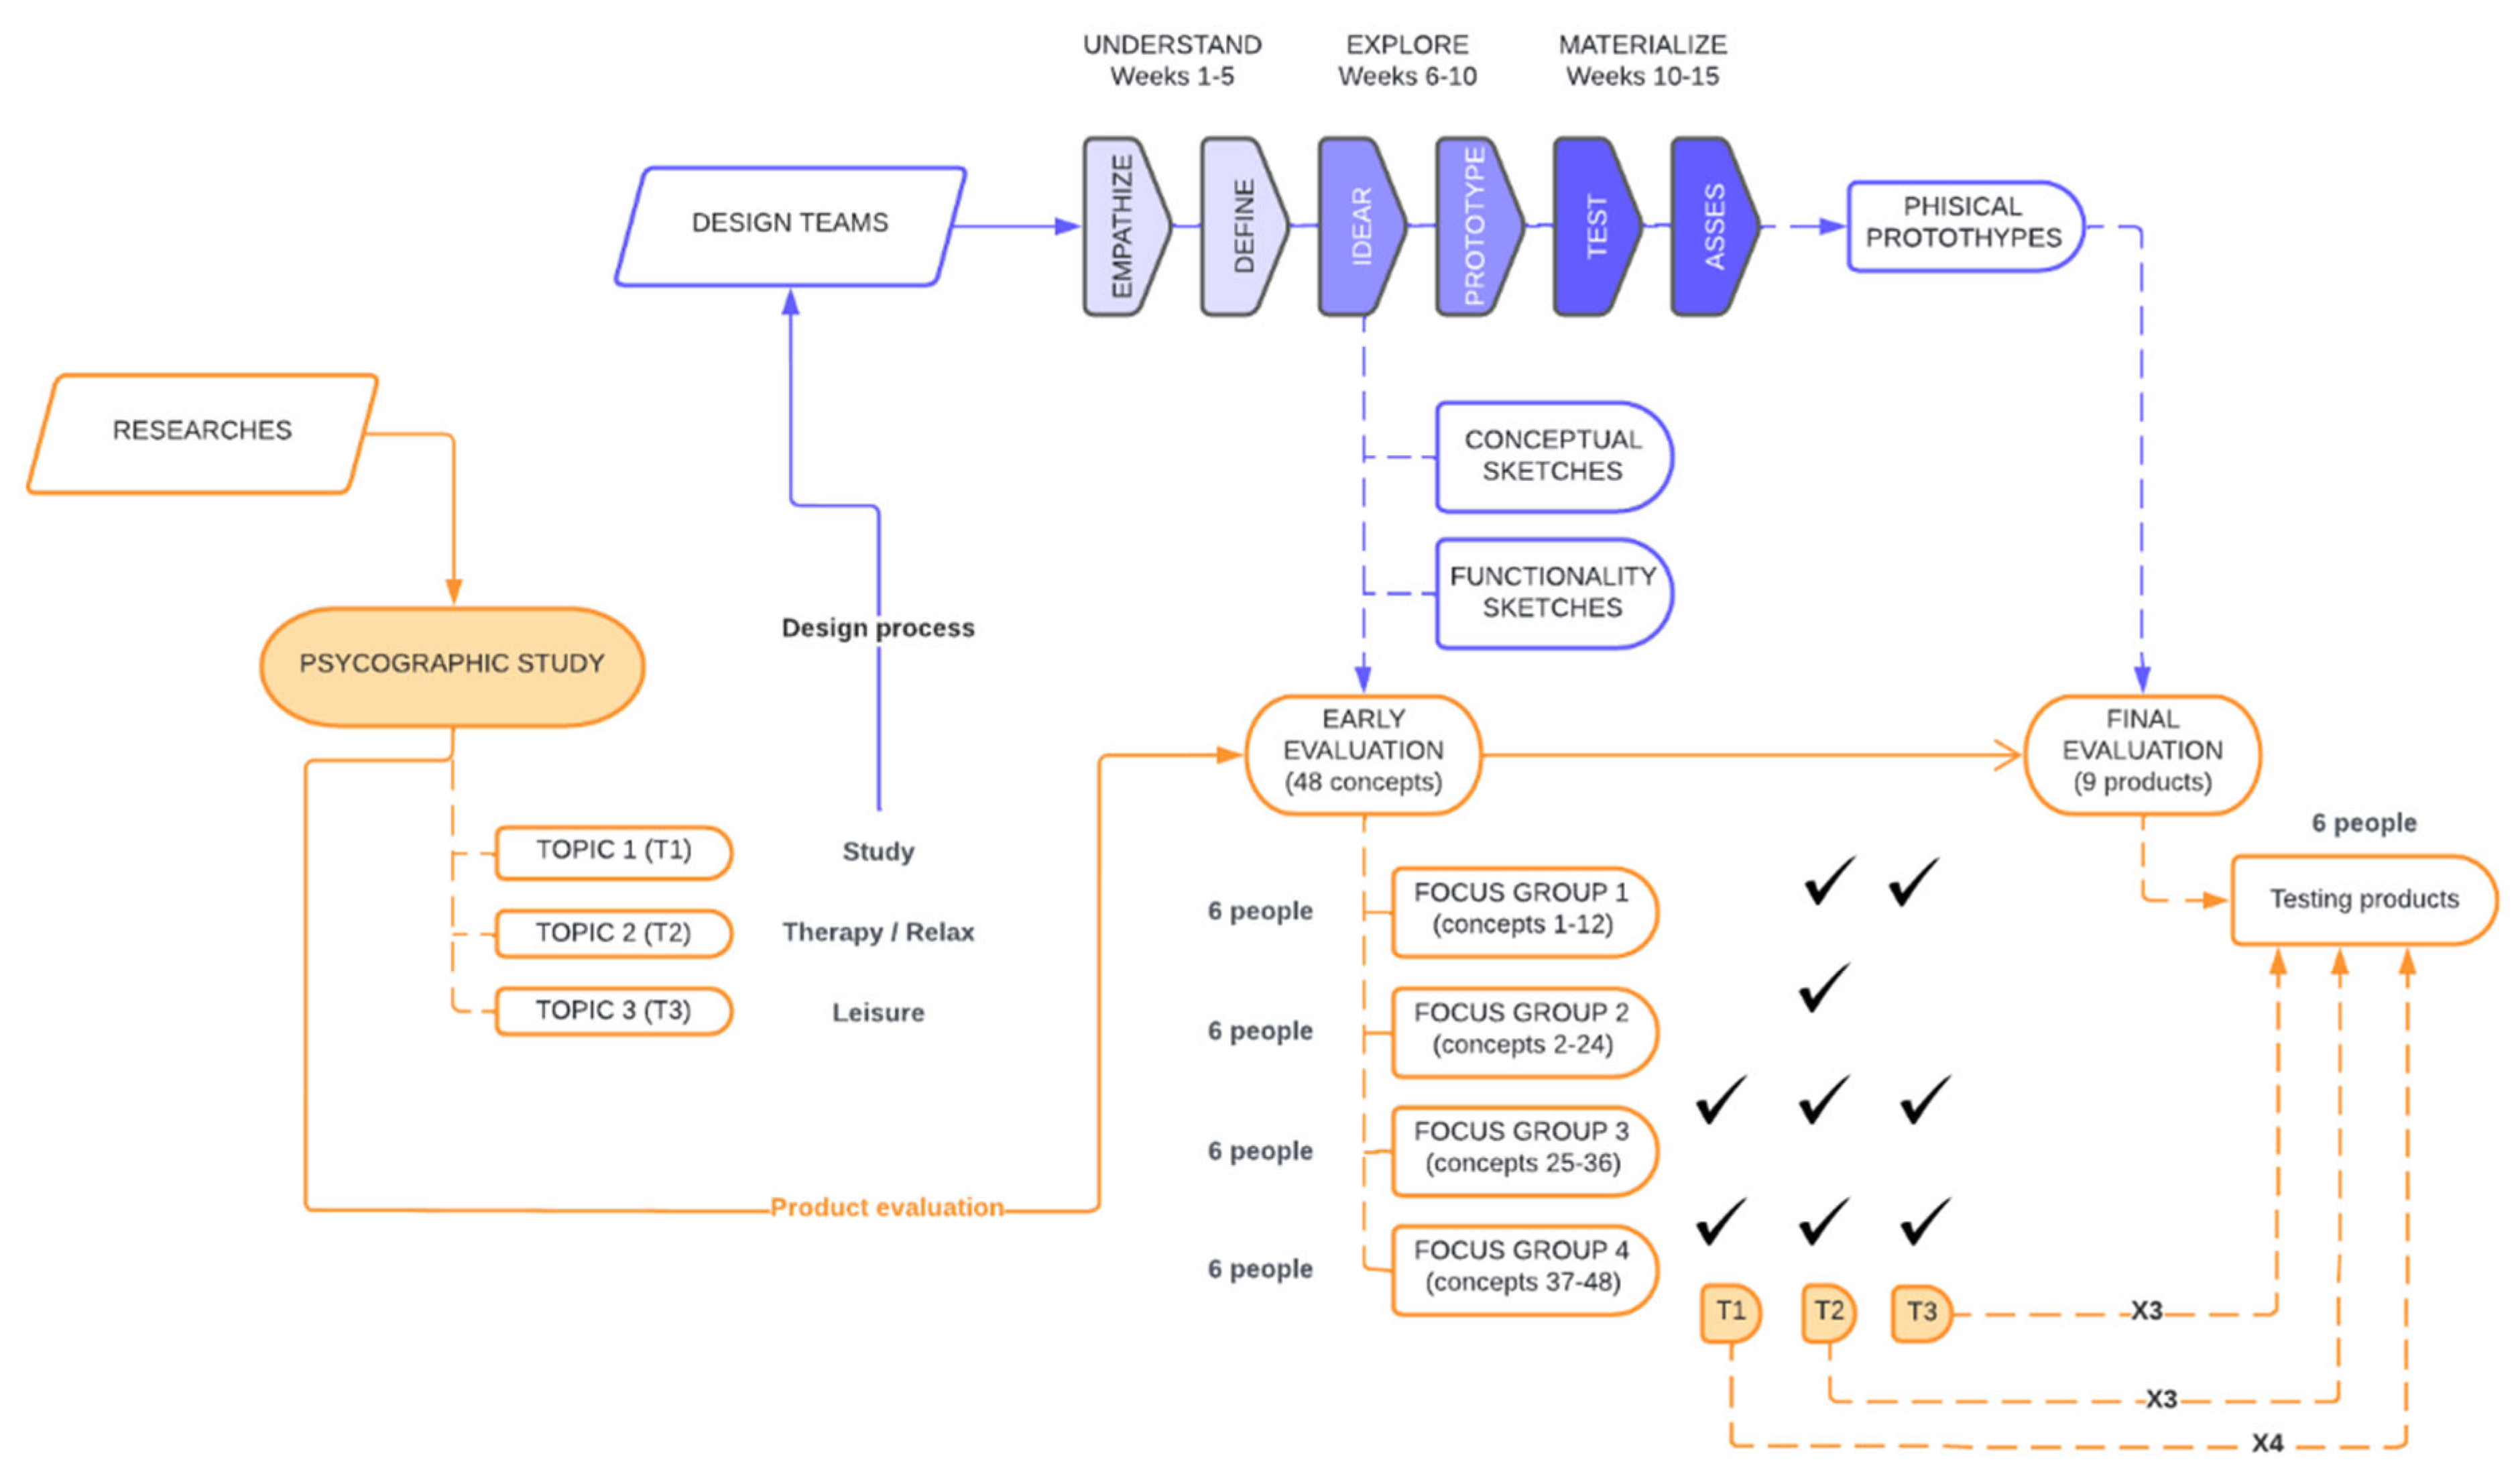
As mentioned earlier, due to the high competition in the market, industrial designers need to create products with added value that enhance their company’s competitiveness and sustainability [1]. This added value often relies on innovation [2], both in terms of aesthetics [3,4,5] and technology [4,6,7]. However, this innovation does not always meet the needs of the products and can sometimes lead to product failure [8,9].
Previous studies have indicated that this can happen because innovation influences the immediate emotional response and behavior of the user [10], factors closely related to Emotional Design (ED). Therefore, the main objective of this research is to analyze how a product’s level of innovation affects consumer perception, specifically focusing on the three levels of Emotional Design (VL, BL, and RL) established by Norman [13]. Hence, the formulated hypotheses, H1, H2, and H3, aim to determine whether the product’s innovation affects user emotional response at the visceral level, behavioral level, and reflective level, respectively.
Additionally, this research seeks to gain a deeper understanding of how innovation can impact consumers’ perceptions and ultimately influence the product’s success in the market. To achieve this, many researchers agree on the need to test and evaluate the consumer’s emotional response to the product [16,17]. However, there are discrepancies regarding when this evaluation should take place. Some researchers suggest that product testing should occur early in the design process to avoid wasting resources and materials [18,21], although it is often conducted in the later stages of design [19,20,22,23]. Various studies compare the results of testing products with users during both stages, even using different elements in each. Early evaluation allows for more cost-effective and quicker modification methods, such as sketches, photorealistic images, and virtual environments, compared to prototypes and already-manufactured products used in evaluations during later design stages.
Consequently, it is crucial to assess whether there are differences in the evaluation of the various levels of innovation between both stages, to determine if innovation can be perceived differently through the different means used, such as sketches and prototypes. This leads to Hypothesis H4: The evaluation of VL, BL, and RL in the early and final stages of the product impacts the measurement.
In conclusion, the four hypotheses that we aim to corroborate are:
H1. 
Product innovation positively affects user emotional response at the visceral level.
H2. 
Product innovation negatively affects user emotional response at the behavioral level.
H3. 
Product innovation negatively affects user emotional response at the reflexive level.
H4. 
The evaluation of VL, BL, and RL in the early and final stages of the product impacts the measurement.

3.2. Design Process

As depicted in Figure 1, the design process involves two evaluations of the proposals. First, an initial evaluation or “early evaluation” to corroborate hypotheses H1, H2, and H3. Second, a final evaluation of the completed product or “final evaluation” to corroborate hypotheses H4. These evaluations (represented in orange) run in parallel to the design process (represented in blue).
Regarding the design process, the students followed the design thinking methodology, which involved initially understanding the needs of the target users based on the different topics determined by the research team. These topics are (T1) “Study”, (T2) “Therapy/Relax” and (T3) “Leisure” and they were established from the findings of the psychographic study conducted, which is described in the following section. Once the design teams had empathized with the users and defined the product requirements, they proceeded to generate different solutions. Each team was tasked with creating four concepts in at least two different topics, which they initially portrayed through conceptual and functional sketches. These sketches were then used by the researchers to conduct the first evaluation of the 48 initial concepts, employing four distinct focus groups (Study 1) composed of six people each. Figure 1 relates different topics to each focus group through checkboxes, according to the products analyzed in each one.
Following the initial evaluation, the design process proceeds with a focus on developing the eight selected concepts and refining the outstanding aspects of the initial proposals. Once the design teams complete their process, the final evaluation is conducted by the researchers in collaboration with eight potential consumers, using functional prototypes (Study 2).
To provide a more detailed description of the methodology employed, the following is a breakdown of (1) the target consumer, (2) the description of the 48 interactive lamp alternatives, (3) the parameters used during the evaluations, and (4) the evaluation procedure utilized.

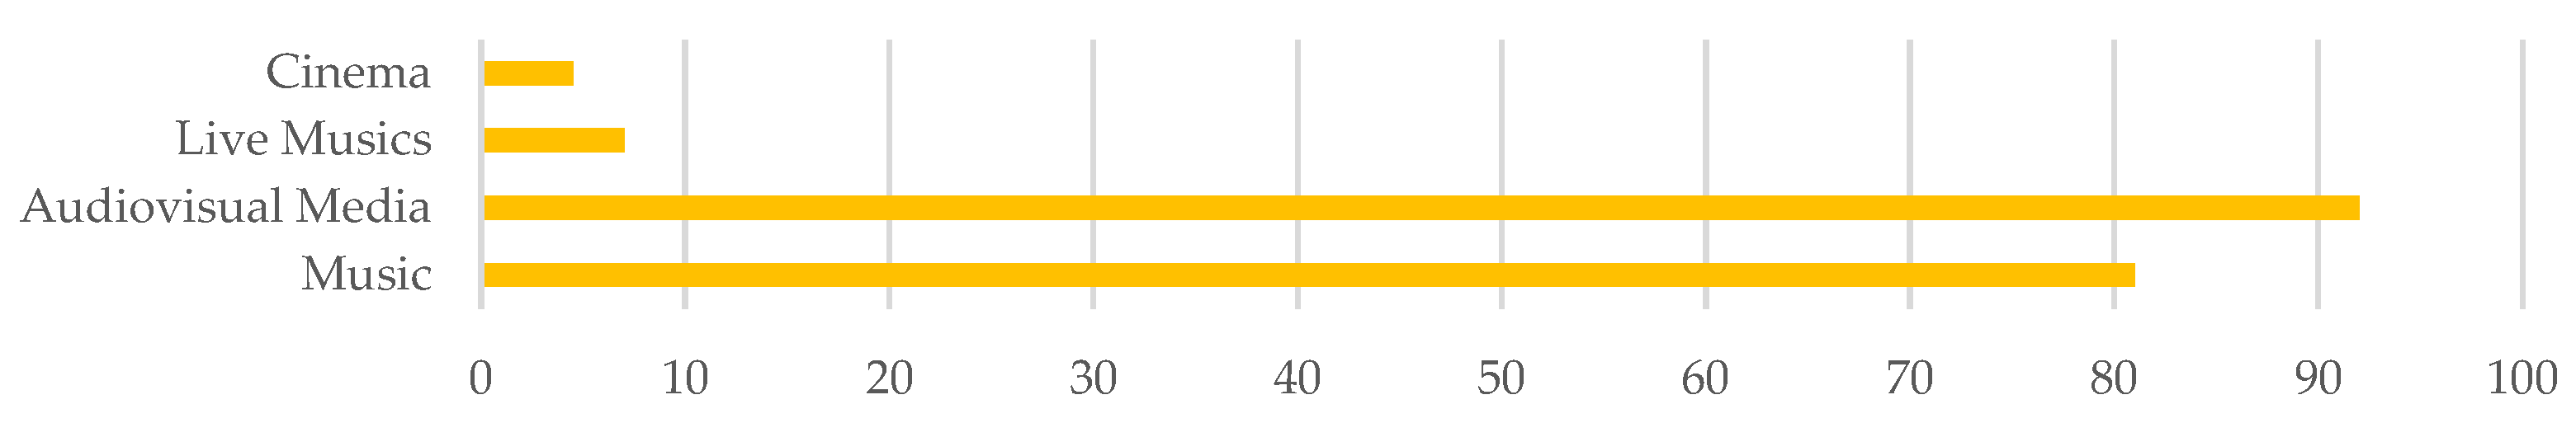
3.3. Knowing the Target Consumer

As mentioned above, a psychographic study was conducted to identify the needs of the target user. For this purpose, a survey was designed according to the five basic dimensions of integral human development [44], which are: (1) neurophysiological development; (2) cognitive, intellectual, and creative development; (3) psychological, affective, and social development; (4) moral, ethical, and values development; and (5) vocational and professional development. The results of this survey, in which 800 users (60% women and 40% men) participated, have been complemented with those from other relevant studies previously carried out by other researchers. The results of the survey suggest that study (Topic 1), therapy and relaxation (Topic 2), and leisure (Topic 3) are the main objectives to be covered in the design of new interactive lamp concepts.
First, 95% of the respondents are students at different levels of the educational system (higher, medium, and lower education), and the remaining 5% are not studying at all. On the other hand, among the respondents, it is observed that 86% are solely dedicated to studying, and 14% combine their studies with work. These data, along with the relationship between the dedication of the surveyed users and their level of study, are shown in Table 1.
This fact reveals that the study is one of the main concerns of the target user, who is concerned about learning. The target user claims to seek quality study time. For this reason, the “study” becomes the first of the three topics or objectives to be covered with the design of the new concepts of interactive lamps.
On the other hand, the surveyed user affirms an intense consumption of new technologies. The user performs technology-dependent activities before those related to the outdoors or direct contact with other users. The young population feels a great interest in music, audiovisual media (especially movies and series), and attending concerts or going to the cinema are unusual habits (Figure 2).
In this sense, it is possible to say that they consume a large number of entertainment brands, something that coincides with the study “It’s Lit, a guide to what teens think is cool”, conducted by Google, where Netflix, YouTube, Google, Xbox, GoPro, and PlayStation are among the most consumed brands by Generation Z, being these six of the top seven in the ranking [45].
They also indicate a great interest in social networks, indicating Instagram as the preferred network. In this sense, the study of social networks in 2021 showed that Generation Z increased its time spent on social networks compared to previous generations, highlighting precisely Instagram, WhatsApp, and YouTube increasing between 1 and 20 points compared with previous generations. Other social networks such as Twitter, Spotify, Twitch, Stereo, and TikTok stand out in this age group compared to previous generations.
In addition, respondents say they prefer a virtual shop to a physical store, as well as responsible and sustainable consumption, showing their interest in recycling and activist brands that provide environmentally sustainable products and services. This coincides with the study “Social Networks, Angels and Demons” [46], which analyses the relationship young people have with networks, and the roles that brands should play in this area. One of the main conclusions is that young consumers are demanding more social commitment and solutions from brands because, although the penetration of networks has increased in recent years, these unfulfilled expectations could be the main reason for the loss of followers. Users demand greater social commitment, and demand that brands take sides, be activists, and provide solutions.
Finally, they show, and admit, a strong dependence on electronic devices. Most respondents spend more than 4 h per day using their electronic devices and consulting their social networks. These results coincide, once again, with [45], which concludes an intensive consumption of more than 3 h from Monday to Friday and more than 5 h per day during weekends. According to experts in psychology, this intense consumption causes low self-esteem, isolation and self-absorption, depression, and anxiety [46]. It causes addiction (84.1%), harassment (81.7%), and rejection of their physical image (81.6%). In addition, according to the survey results, this generation has no time for relaxation, in most cases, causing anxiety and stress. More than 50% of respondents show high or very high levels of stress. The data reveals a clear need to find moments of relaxation.
Therefore, the problems derived from the use of electronic devices become the second topic of the study of this research, seeking that products can be therapeutic and relaxing to combat the addition of new technologies.
Furthermore, to address issues of isolation and depression among users, the research promotes individual leisure through the design of new alternatives (Topic 3). The aim is to encourage face-to-face interaction among individuals, which is crucial for human development and serves as a preventative measure against isolation and depression [46].

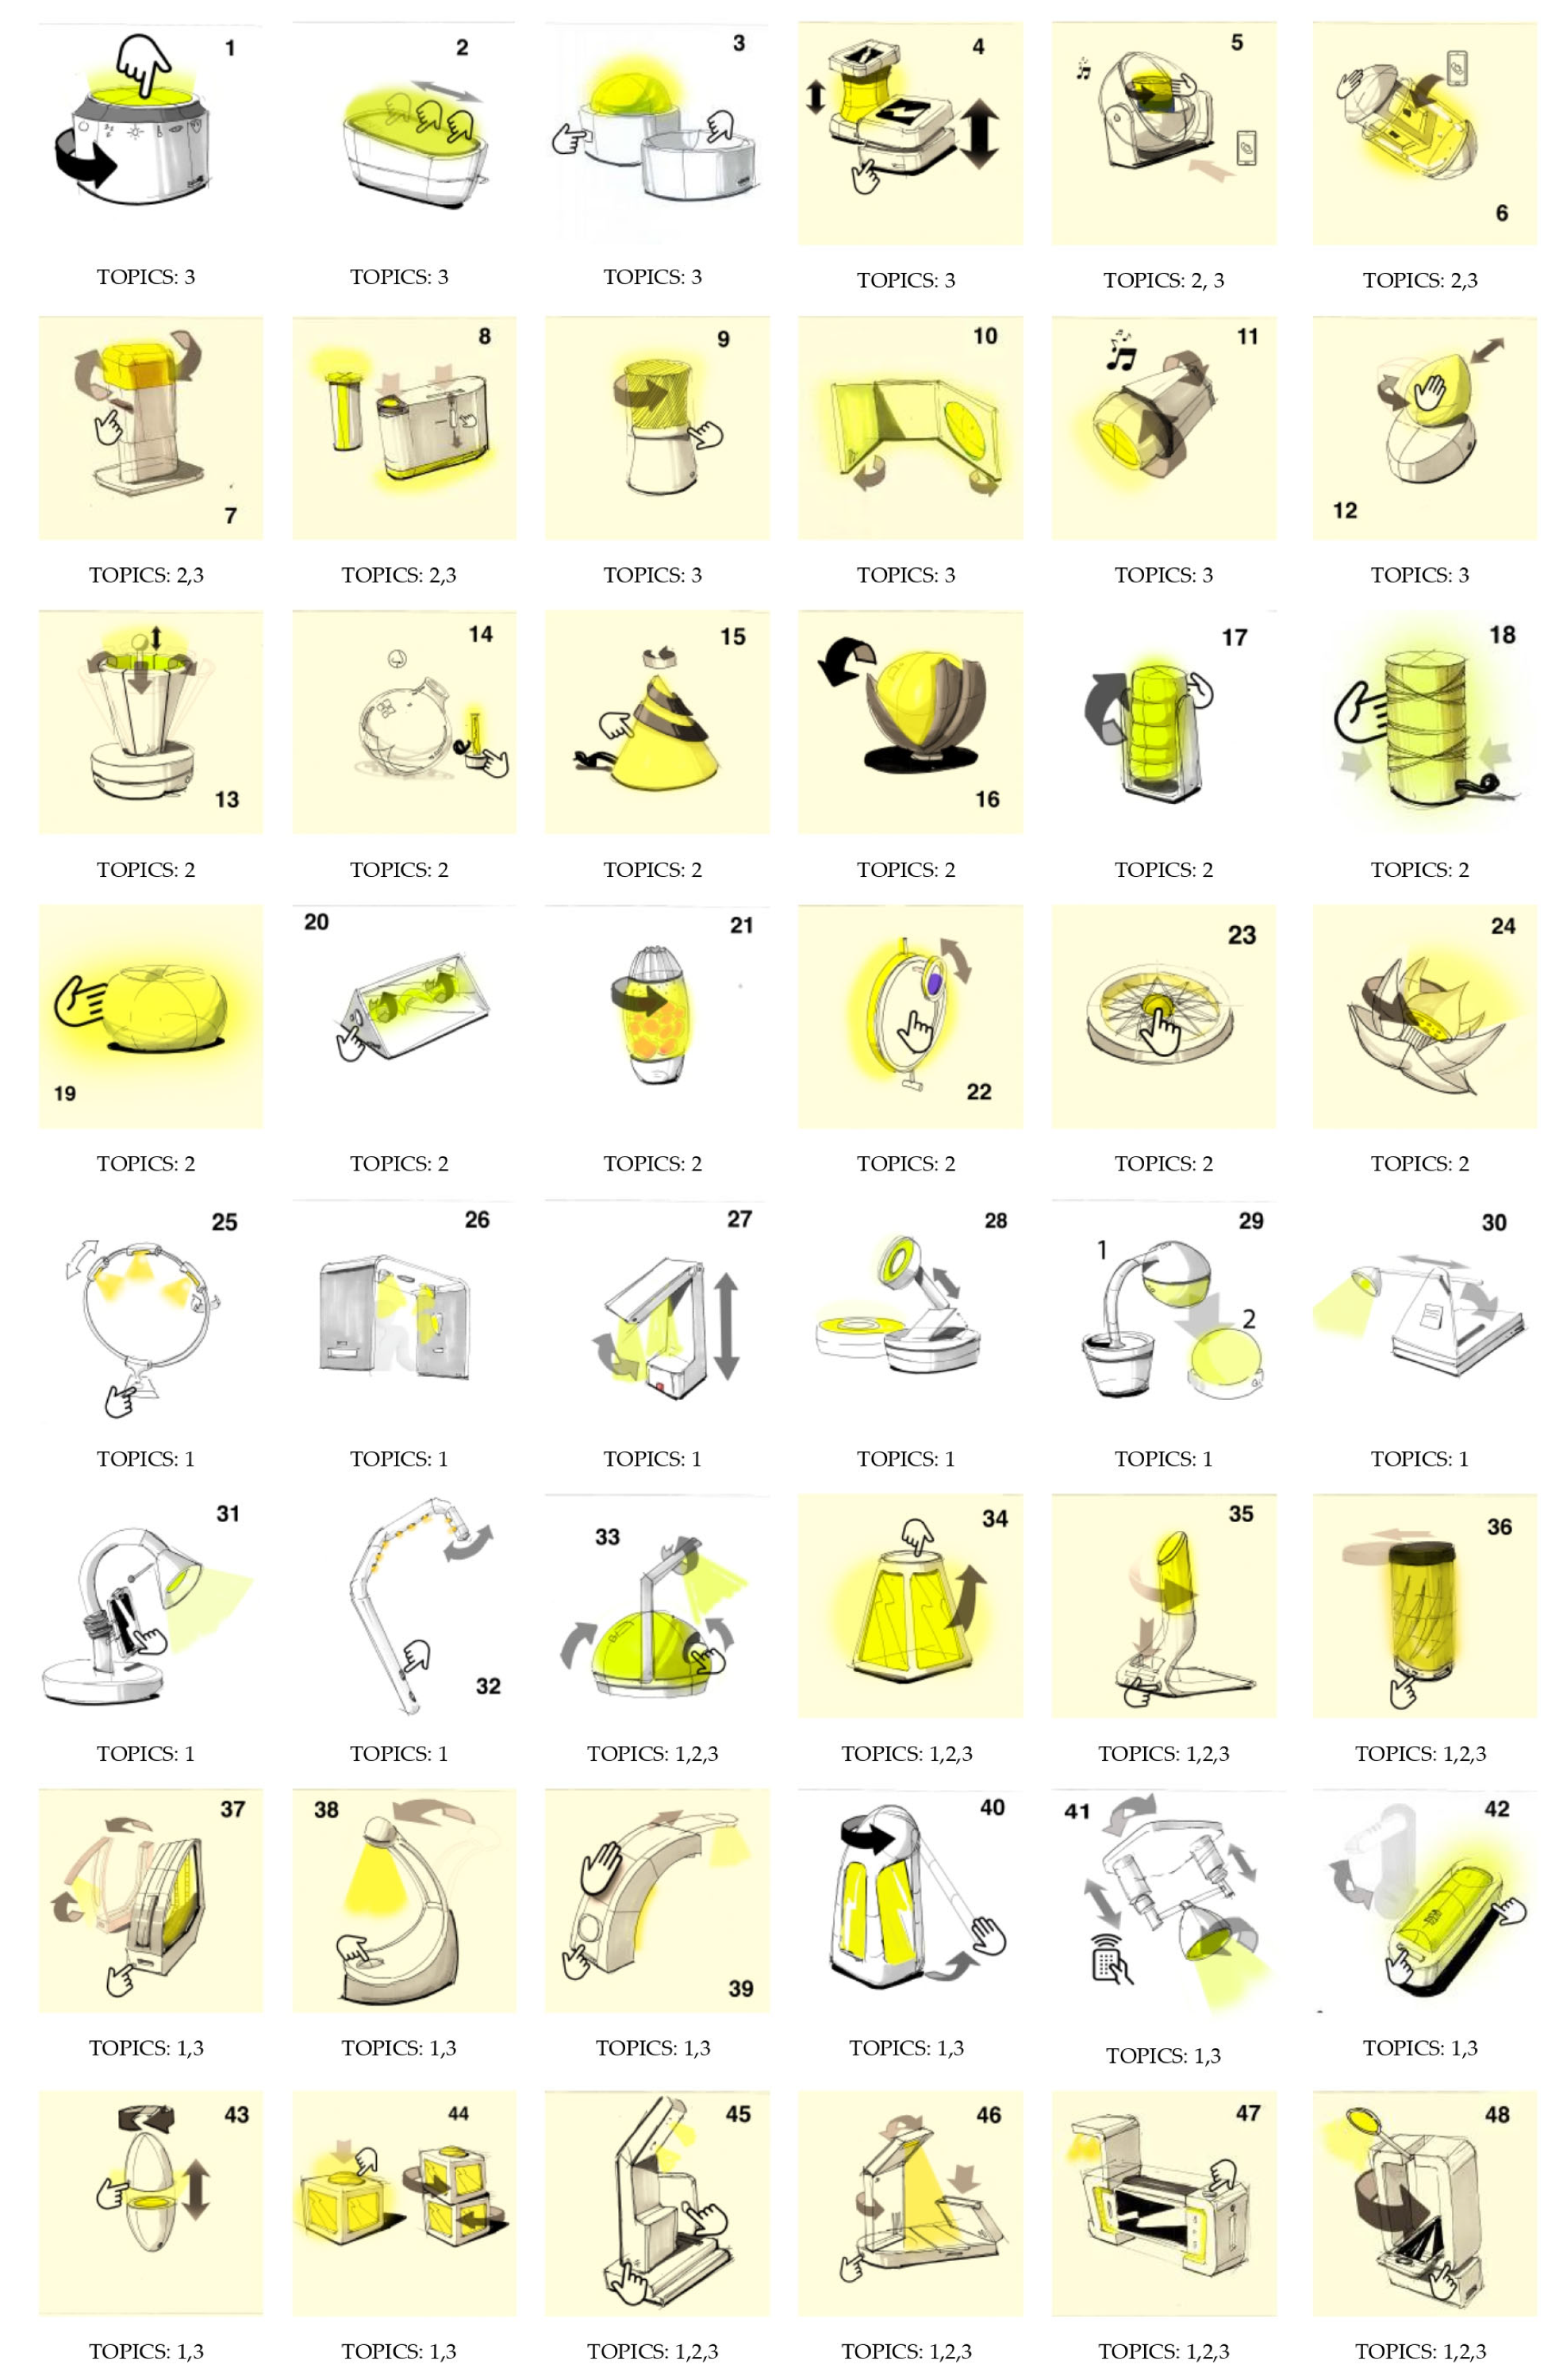
3.4. Interactive Lamp Designed Concepts

After having analyzed the different consumer necessities and topics, the design teams developed 48 different alternatives (Figure 3). This figure distinguishes between interactive lamp alternatives that are more divergent from the traditional concept (represented by yellow) and those that adhere more closely to tradition (represented by white).
To distinguish between the more innovative and traditional concepts, a panel of experts was employed consisting of six professionals in industrial design with a minimum of 5 years of professional experience in the sector. Furthermore, it indicates the specific areas or topics in which each proposal is classified, which, as mentioned earlier, were conditions imposed by the research team on the volunteer students. By requiring design teams to work on four different concepts and cover at least two topics, we eventually obtained 24 concepts focused on leisure and free time (Topic 1), 24 concepts aiming to mitigate excessive electronic device usage (Topic 2), and 28 concepts catering to study-related needs (topic 3). Additionally, certain concepts are hybrid in nature, designed to address multiple topics simultaneously.
First, products 1–12 focus on user interaction. Among these alternatives, 1–4 is designed for outdoor activities, emphasizing portability, lightness, and energy autonomy. Concepts 5–8 propose lighting as a means of fostering interaction among users within the home, encouraging them to reduce their reliance on cell phones. On the other hand, concepts 9–12 introduce lighting and sound systems that require user interaction to activate various functions, specifically catering to social gatherings at home.
Second, alternatives 13–24 aim to alleviate symptoms of stress, anxiety, or illnesses resulting from excessive use of technological devices. These alternatives include therapeutic breathing tools (13–16) and other sensory stimuli. Alternatives 17–20 offer visual relaxation tools through interactive lighting systems.
Third, alternatives 21–24 strive to create an environment conducive to stress reduction by combining touch and scent, incorporating nature-related elements.
Fourth, concepts 25–36 are lighting systems designed for studying or working purposes. The initial proposals (25–28) are fixed systems intended for libraries or study rooms, aiming to eliminate shadows and minimize physical contact for activation. In contrast, alternatives 29–36 target individual use within private spaces, focusing on reducing dimensions. Additionally, alternatives 33–36 are hybrid concepts intended for individual leisure, featuring an “ambient” mode.
In the last category, alternatives 37–48 are all hybrid or multi-purpose concepts. Concepts 37–44 combine the functions of a studio lamp and ambient lighting, while alternatives 45–48 also aim to reduce mobile device usage. Furthermore, concepts 37–40 and 45–48 incorporate more innovative sculptural forms and interactions, whereas concepts 41–44 utilize more common collection systems and modularity.

3.5. Procedure

The testing procedure assesses the VL, BL, and RL of the interactive lamps through user observations, interactions, and reflections, respectively. It uses various sketches in Study 1 and prototypes in Study 2. This process is illustrated in Figure 3.
On the other hand, Figure 4 illustrates the various stages involved in both Study 1 (in orange) and Study 2 (in blue), as well as the combined steps from both studies (in grey).
In total, 32 users participated in both studies. The first study is carried out through four virtual focus groups via Google Meet. Each group was composed of six people. In total, the focus groups are composed of a sample of 24 people: 15 men and 9 women. These users are between the ages of 18 and 24, so, according to “The Completed Life Cycle” [47], they are young users and potential consumers. In the second study, 9 potential consumers with similar characteristics participated. This evaluation was conducted in person, using functional physical prototypes.
Both studies were conducted in controlled environments to minimize external influences that could impact participants’ responses. Additionally, participants were required to sign an informed consent form provided by the researchers.
The first study took place in a virtual room programmed by the research team. The second study was conducted in a classroom where only one researcher, the surveyed volunteer, and the eight prototypes were present.
In both cases, a questionnaire was designed to ensure clarity and minimize potential biases in the formulation of the questions.
During the early (Study 1) and final (Study 2) evaluations, several parameters have been analyzed to assess user responses across different levels of Emotional Design. These parameters (Table 2) have been evaluated using specific methods of user consultation and participation. In this regard, although all the data have been obtained from the opinions of users who voluntarily chose to participate in the study, some data have been collected directly by the users themselves, while others have been collected by the researcher.
First, parameters P1–P5 (VL) were directly evaluated by the volunteers through the observation of conceptual drawings (Study 1) and prototypes (Study 2). However, although in Study 1 the values were recorded by the researcher, in the second study, they were collected directly by the users through a fillable questionnaire. The difference in data collection is due to the execution of both tests through different means (virtual and in-person) and collectively and individually, respectively. However, as mentioned, in both cases, the questions were the same, and the recorded responses were verbalized by the participating users themselves. Second, P6–P10, which are related to BL, were evaluated through the observation of functional drawings (Study 1) and interaction with physical prototypes (Study 2). In both cases, the data have been recorded by the researcher to obtain precise information about the usability parameters being evaluated. In the first study, users were consulted on how they would use the product, and the values were recorded based on the volunteers’ accuracy level. In the second case, researchers invited volunteers to interact with the product, observed their interactions, and recorded the corresponding data for each parameter. Finally, RL (emotional response) was measured based on the assimilation of concepts with feelings, emotions, and memories evoked by them. In this regard, in both cases, researchers engaged in dialogue with the participants to gather information about the sense of these responses (positive or negative), and the data were recorded.
As mentioned before, different tools have been used to present the designed concepts. These tools include the conceptual and functional sketches developed by the teams in Study 1, as well as the functional prototypes derived from them in Study 2.
Before data processing, an outlier study was conducted to obtain more robust and reliable results. Users who exhibited low confidence levels in their responses were excluded from the analysis. After this exclusion, the final size of the first sample remained unchanged at 24 users. However, in the second study, only the information collected from eight out of the nine volunteer participants could be used due to significant inconsistencies in the responses of one of the users.
Once the sample sizes were established, a descriptive analysis was conducted for both studies. Additionally, in Study 1, an inferential analysis was carried out, specifically a Kruskal–Wallis test, after performing a test of normality. The analyses conducted in each case are detailed in the results section.

3.5.1. Early Evaluation—Study 1

This study aims to detect, starting from the early evaluation phase of the design process, whether innovation affects the interest, intuitiveness, and desirability that consumers may have towards products, as proposed in hypotheses H1, H2, and H3. If so, it also aims to determine whether this influence is positive or negative in each case. Additionally, the study aims to investigate whether the topic of each product affects this perception.
In the case of the early evaluation, the response to each level will come from the researchers’ interpretation of the dialogue and debate generated by the members of the different focus groups. The research team moderates three discussions in each focus group, through which the three levels of Emotional Design are analyzed. In any case, positive responses to any product are coded as +1, negative responses as −1, and neutral or non-response responses receive a value of 0.
First, to assess VL, Study 1 looks at the attractiveness that each concept generates in the user through the first impression. For this purpose, general sketches are used as a method of presentation to the user, and the user is consulted on their attractiveness before any explanation of the presented concept is made.
Second, BL seeks to understand the usability of the products analyzed. To do this, and based on different functional sketches of the 48 proposals, the participants are asked whether or not they consider the products to be intuitive, and a dialogue is moderated with the group to check whether or not they have understood the usefulness of each proposal, and how it works. On this occasion, the consultation is carried out from functional drawings, and on two occasions: before (B) and after (A) having commented on the functionality of the different concepts.
Last, RL analyses whether the memories suggested by the products evaluated are positive or not for the user by asking the user what they are reminded of and the nature of this memory. This reflection is sought once the user has reviewed the general and functional drawings, but also when the volunteer has received the researchers’ explanation of the different concepts.

3.5.2. Final Evaluation—Study 2

The objective of this study is to assess whether there are any discernible differences between the early and final evaluations of new products (H4). To achieve this, a group of eight target customers participated in the testing of nine physical prototypes.
The values for each level come from user’s response to a questionnaire, from the observation of the research, and from the dialogue between the researcher and the volunteer. Thanks to the small number of participating users and the tangibility of the physical prototypes, these levels are analyzed from different dimensions, and not in a general way, as was conducted in Study 1. In either case, responses are measured on a 7-point Likert scale, from −3 to +3.
In the case of VL, it is the user who indicates the measurement. A semantic differential scale of five bipolar pairs—unpleasant/attractive, boring/interesting, ordinary/surprising, useless/useful, and old/novel—is employed. To select these bipolar pairs, 16 objects related to the three established topics were considered. From these, based on customer reviews, the five most repeated adjectives for each were taken, resulting in a total of 80 adjectives. According to these repetitions, the five most repeated adjectives are taken again in each case, and in this way, the five most desired characteristics by users are obtained.
BL was measured by the researcher’s observation of the interaction that users had with each product tested. The dimensions taken into account at this level were, in the same way, the five traditionally established for usability tests: Learning Facility (LF), Efficiency (EY), Satisfaction (ST), Memorization (M), and Efficacy (E) [35]. To ensure correct measurement, two consecutive user–product interactions were carried out, separated by a brief explanation of the use of the product. During the first interaction, the following parameters were assessed: (LF), (EY), and (S). During the second, the remaining two were evaluated: (M) and (E). In this way, it is possible to evaluate whether the errors made by the user can be alleviated by a quick and easy learning process.
RL was assessed through user assimilation, which involved volunteer observation and interaction with the different prototypes on two occasions. Following this, each volunteer was prompted to reflect on the sensations, memories, and emotions experienced during the testing, as in other research [28]. To facilitate this process, the researcher conducted a brief interview with the user.

4. Results and Discussion

Once the data were collected and coded, a descriptive analysis was conducted demonstrating the differences in the perception of potential consumers regarding traditional and innovative products. This analysis, which was divided into two studies, compared the values obtained in two groups consisting of the more traditional concepts and the more innovative concepts, indicating that innovation directly affects product success, as other researchers have suggested before [2,3,4,5,6,7]. Study 1 analyzes the overall perception of the user, using the parameters of interest, intuitiveness, and desirability as representatives of the three levels of Emotional Design established by Norman [13]. The second study analyzes these differences through various parameters previously established by researchers [12,13,28,35] to define each of the levels (Table 2).
To ensure more robust results, an inferential analysis was conducted in Study 1, while no inferential analysis was performed in Study 2 due to its smaller sample size and specific objective of comparing data with Study 1. This could represent a limitation in the study. However, the objective of Study 2 was to ratify the first one and confirm that there are no appreciable differences between early and final evaluations, as already conducted in other previous investigations [28]. In Study 1, after verification through the Kolmogorov–Smirnov normality test that the collected sample did not follow a normal distribution, the non-parametric Kruskal–Wallis test was employed, using a significance level of 0.05 and a confidence interval of 95%. Both Study 1 and Study 2 provide evidence of differences in consumers’ perception of a product based on its level of innovation and the topic it belongs to, thus validating the hypotheses stated in this section.

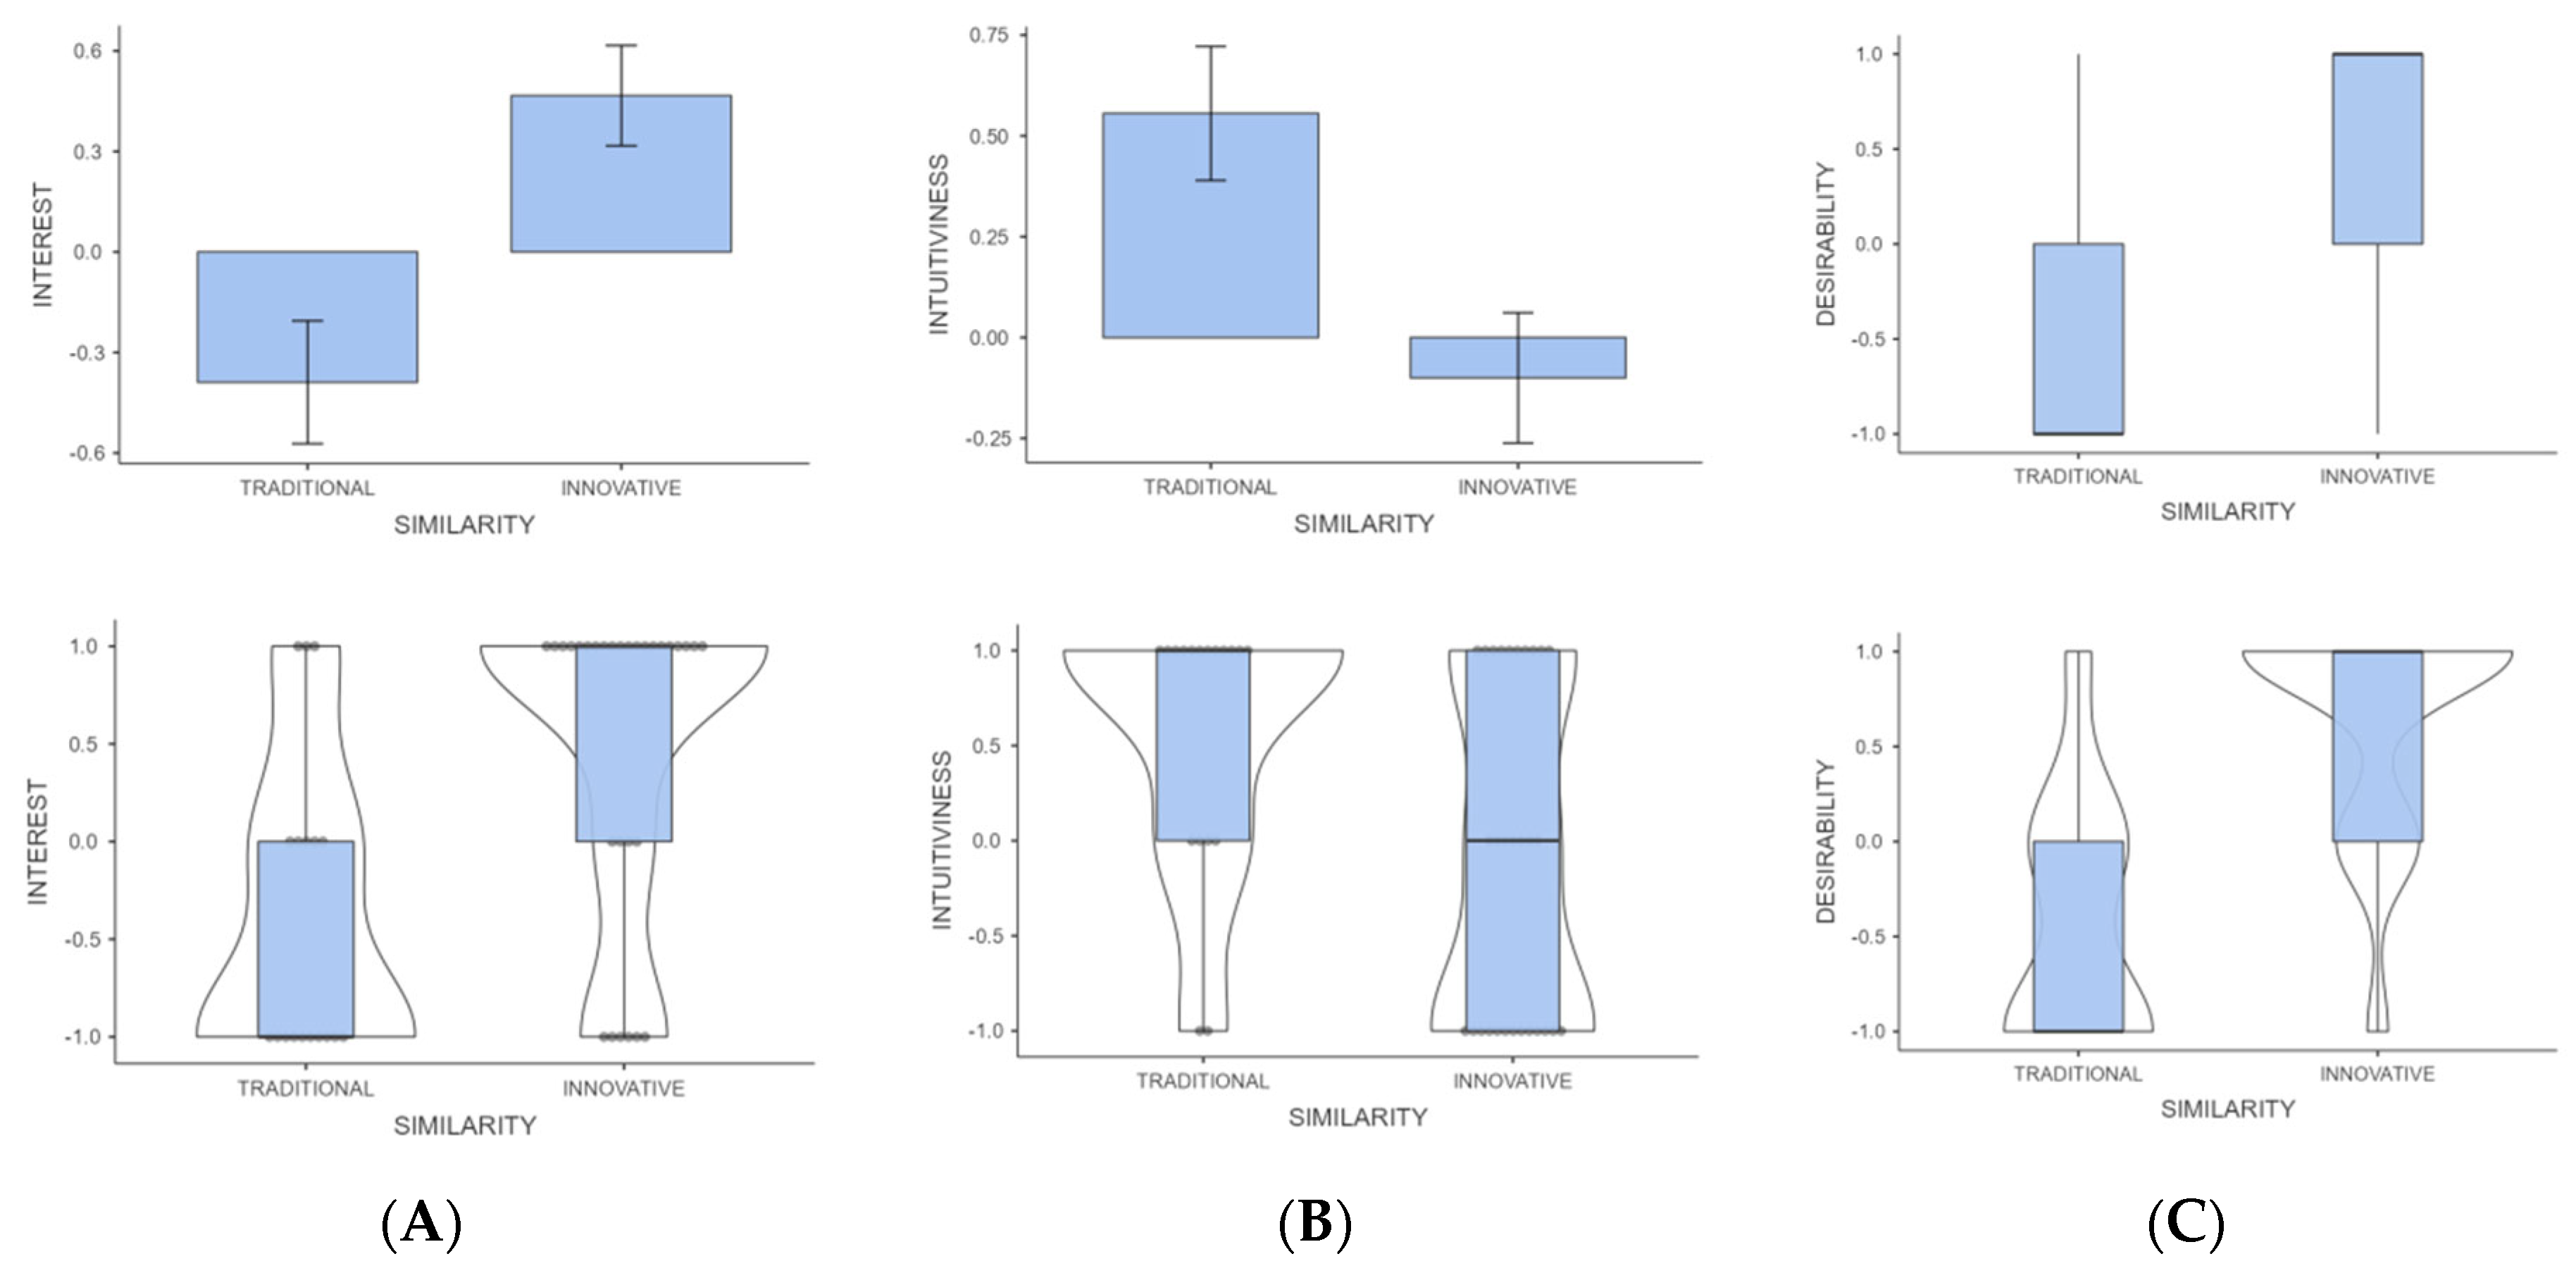
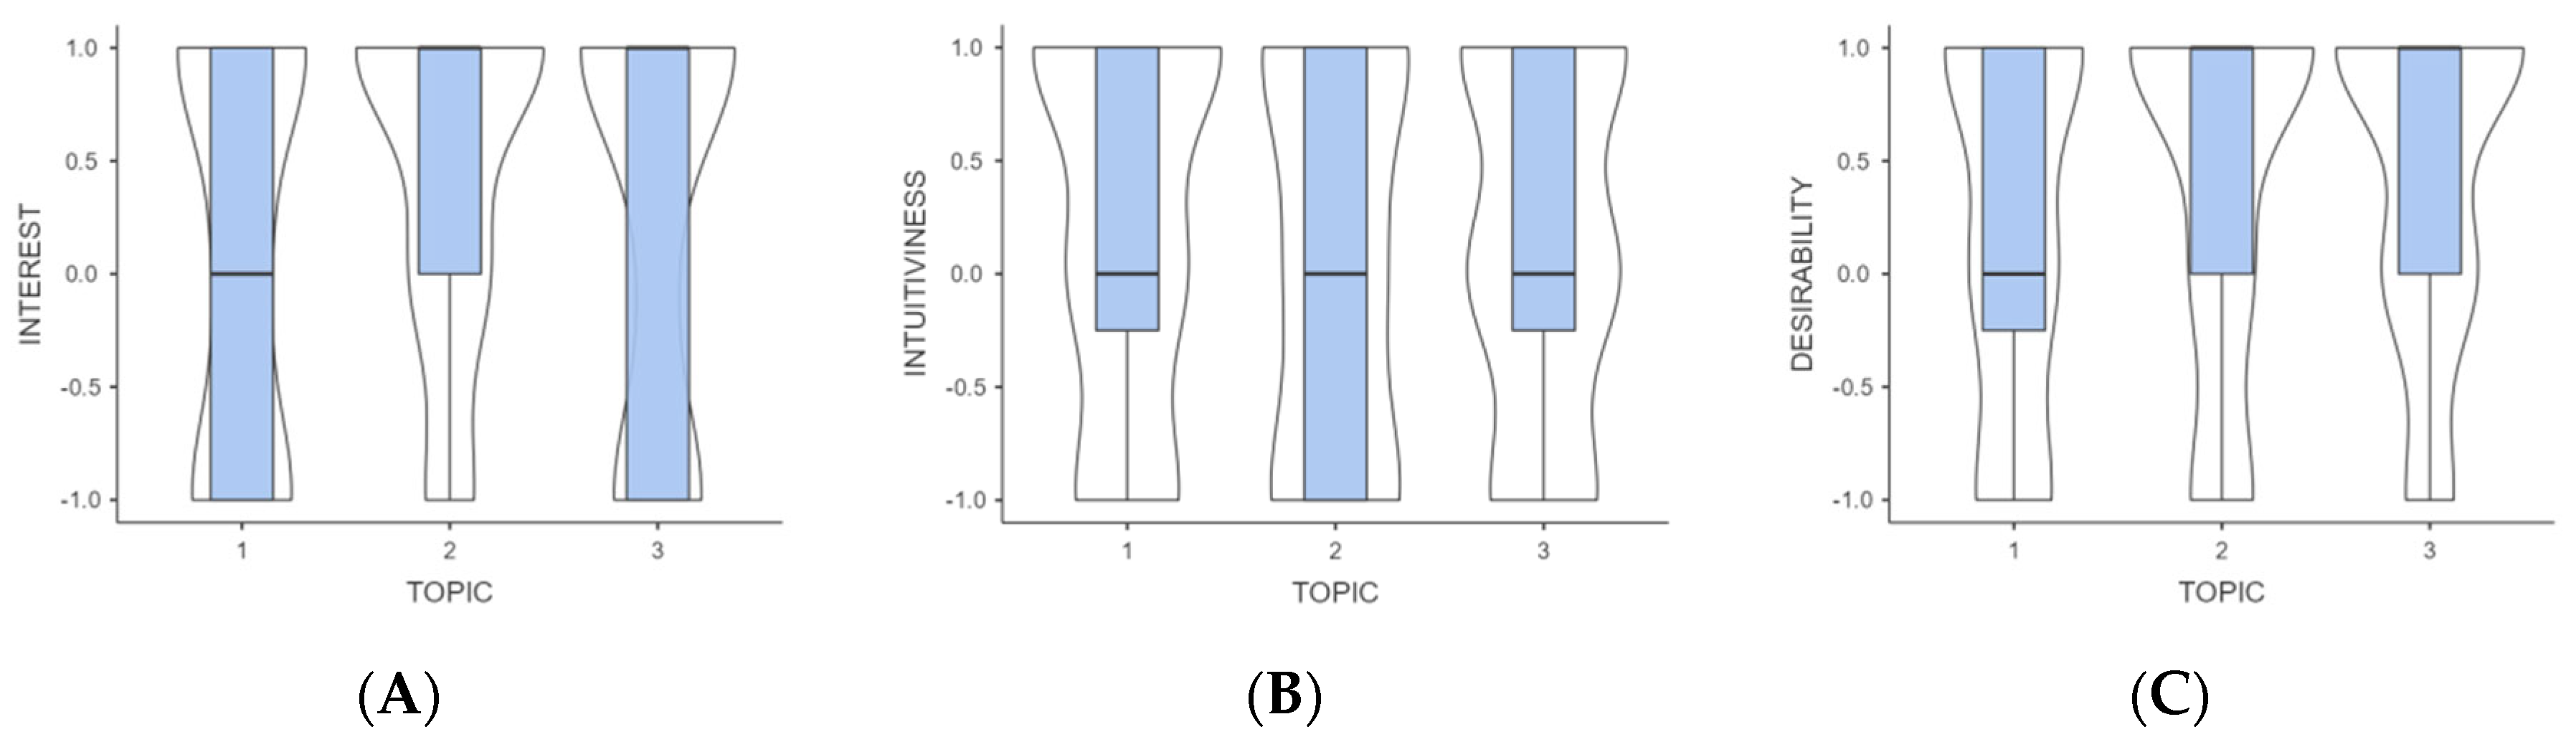
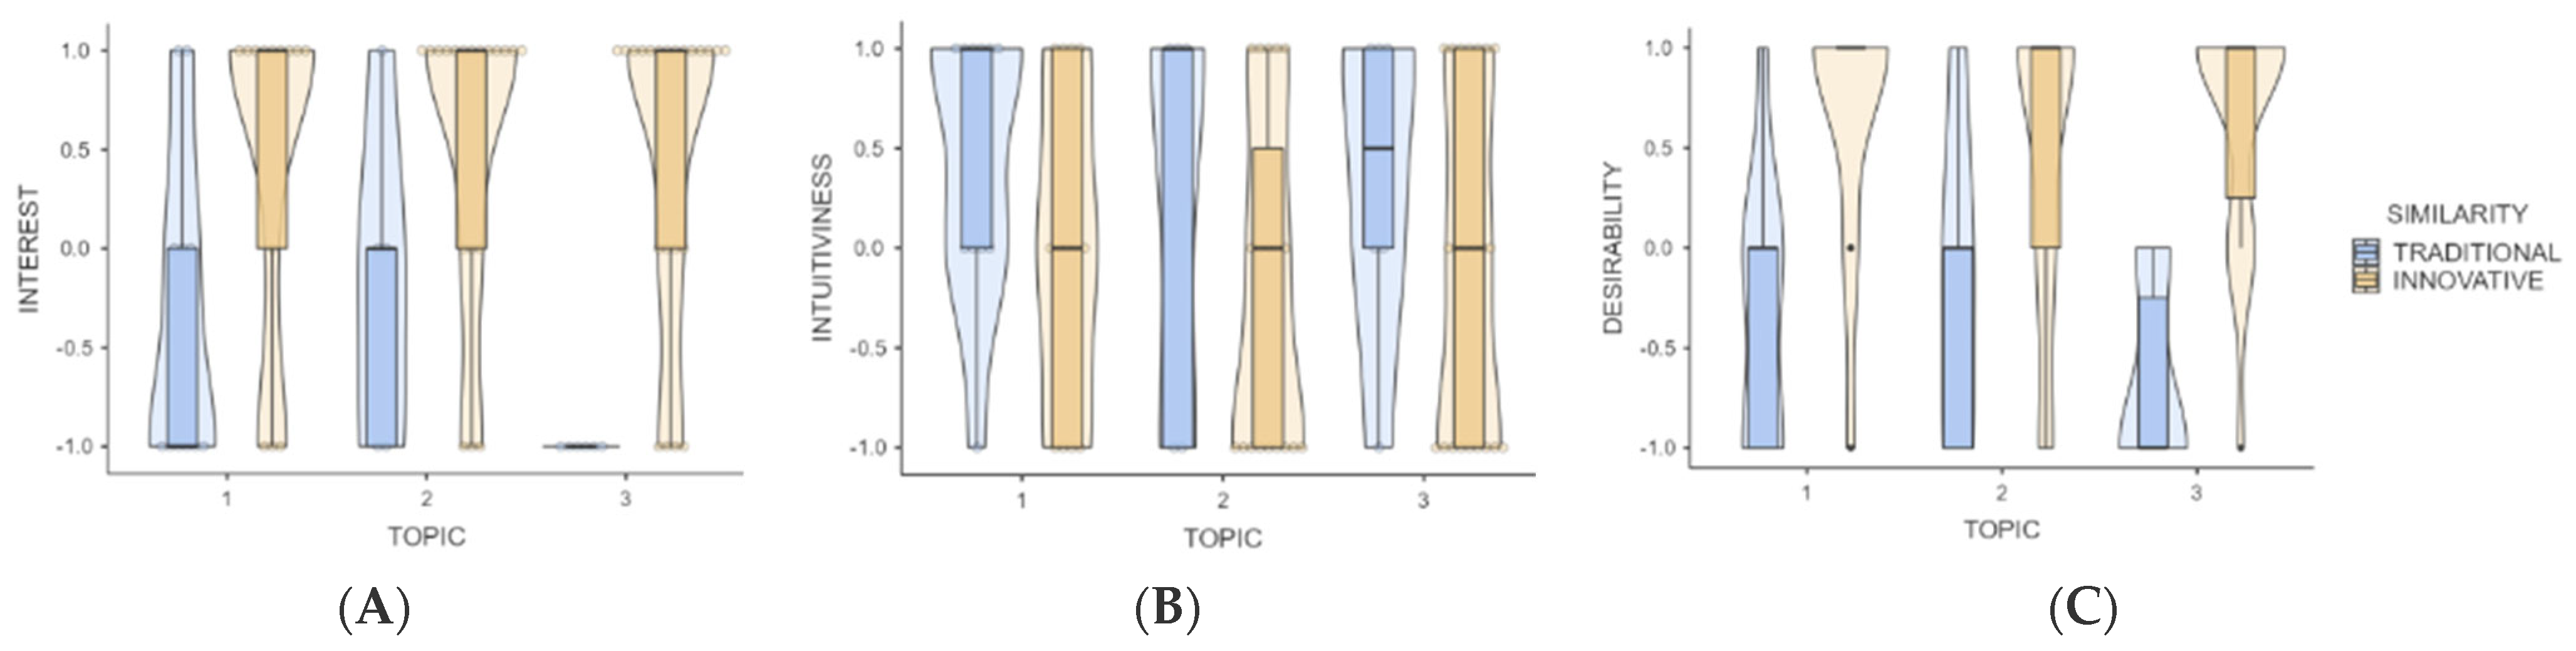
4.1. Study 1—Impact of Innovation on Topic, and Visceral, Behavioral, and Reflexive Levels

On the one hand, general descriptive analysis suggests, regardless of the topic, differentiates between user perception of innovative and traditional products. These differences are observed through interest (VL), intuitiveness (BL), and desirability (RL) towards a product (Figure 5). The three box blots (Figure 5 up), show innovative products prompt a higher level of interest and desire on the part of users than traditional products, which, on the other hand, show better levels of intuitiveness than innovative products. This finding supports the notion put forth in other studies [2,3,4,6,11] that innovation in a product can generally add the essential value needed to set it apart from competitors. However, this does not occur at all levels of Emotional Design. When evaluating the three levels separately, it can be observed that the emotional response at the behavioral level, related to the individual’s behavior and product usability, worsens in more innovative products. This is something that had not been evident in previous studies and could be related to the findings of the study conducted by Mugge and Dahl [5]. In this study, researchers examined how consumers respond to products with different levels of design novelty, both in radical and incremental innovations. They used 130 participants who evaluated the products in an experimental context. The results showed that, in the case of radical innovations, products with a less novel design were better received by consumers and were associated with lower learning costs. On the other hand, in the case of incremental innovations, no differences were found in consumer responses to different levels of design novelty. Through the violin diagrams (Figure 5, below), some nuances in this interpretation can be observed. This indicates that, while traditional products generally show negative values in those characteristics in which they do not stand out, innovative products exhibit greater dispersion in user opinion regarding their intuitiveness. In other words, although the majority perceive them as not very intuitive, some users positively value this quality. This may be due, in part, to the fact that although some of these products are not related to the traditional concept of a lamp, they are functionally related to other products from a different family. For example, Product 11 is considered innovative as it is not functionally related to the traditional concept of a lamp. However, this product is controlled as if it were a pepper mill. For this reason, and even though the product is considered innovative within its product family, some users identify it, through unconscious thinking [37,38], as a pepper mill and not as an interactive lamp. Based on the thinking of Freud [38], it is believed that this is the reason, and no other, why this type of product is sometimes considered intuitive despite being classified as an innovative product. Therefore, we can conclude that in all cases, innovation (whether technological or aesthetic) hinders the usability of the product.
To corroborate these assumptions, an inferential analysis is carried out. This analysis compares the results of the three analyzed qualities or levels perceived in traditional and innovative products. The inferential test confirms the differences already detected in the descriptive analysis, as shown in Table 3 (p-value is from all qualities under 0.05). We can therefore affirm that hypotheses H1, H2, and H3 are true, with clear differences existing in the perception of innovative and traditional products across the three studied levels.
However, these data do not reflect the possible differences that may exist between one topic and another. By contrast, a descriptive analysis is carried out to assess the level of interest, intuitiveness, and desirability evoked by the analyzed concepts in relation to each specific topic. According to this analysis, there are, indeed, some differences. These differences are particularly evident in terms of interest (Figure 6A) and intuitiveness (Figure 6B). In both parameters, concepts from Topics 1 and 3 seem to exhibit similar values, but differ from those originating from Topic 2. Additionally, slight differences are observed in the “desirability” parameter (Figure 6C). In this case, the differences are observed between products in Topic 1 and those in Topics 2 and 3.
Although we can confirm hypotheses H1, H2, and H3 based on these data, we still lack information regarding the direction of influence and whether innovation affects the three levels studied in all three topics, and, if so, to what extent. Hence, it is considered valuable to conduct a comparative analysis of users’ perceptions regarding traditional and innovative products, taking into account both overall evaluation and a topic-specific evaluation. Regarding this matter, Table 4 presents a comprehensive overview of the mean, mode, and standard deviation for the levels of interest, intuition, and desirability across the different topics.
Based on the information provided in Table 4 and Figure 7, we can observe a clear trend in the ratings of traditional and innovative products. Traditional products tend to receive negative ratings in terms of interest and desirability, and obtain positive ratings in terms of intuitiveness. On the other hand, innovative products show negative ratings primarily in terms of intuitiveness. This indicates that, in general, traditional concepts tend to be perceived as more intuitive compared to innovative concepts as we assumed in the descriptive analysis. However, when it comes to the interest and desire expressed by potential consumers, the opposite trend is observed, as we assumed before too. In conclusion, users consistently show a strong preference for innovative concepts over traditional ones. However, it is important to note that there are some variations in this preference across the different topics analyzed. Although the overall trend favors innovative concepts, the extent of the preference may vary depending on the specific topic.
In this regard, Figure 7 illustrates the perception of interest, intuitiveness, and desirability of traditional and innovative products according to each topic. This figure shows that, although no significant difference is evident in the interest expressed for the more innovative products across the different topics, there is a clear distinction in the perception of traditional products. In this case, the perceived interest in study-related products (Topic 1) and products for therapy and relaxation (Topic 2) differs from the interest perceived in products intended for leisure (Topic 3), which obtains considerably lower values. Regarding the records of perceived intuitiveness, Figure 7 demonstrates differences among topics for both traditional and innovative products, highlighting that in this case, the difference is not topic-dependent. On the other hand, the values related to desirability show similar results to interest data. Again, traditional products show differences between Topics 1 and 2 and Topic 3, while innovators show similar dispersion data.
Consequently, Table 4 records modes indicating that the response trend is (−1.00) for interest and desire towards the more traditional products, and (+1.00) towards the more innovative concepts. Generally, the opposite is true in terms of intuitiveness. However, the products in Topic 1 (study) attain a mode of 0.00, implying that innovative products in this particular sector are not perceived as highly unintuitive, unlike the other two topics analyzed: therapy and relaxation (Topic 2) and leisure (Topic 3).
Similarly, through the standard deviation, it can be observed in Table 3 that there is some dispersion in the data and differences in the response. The only exception is the perception of the level of attractiveness in traditional products related to Topic 3, which obtains a value of 0.00 points. The greatest dispersion of data is also found in traditional products. In this case, the highest deviation is observed in user perception of the intuitiveness of study-oriented products classified as traditional. To corroborate this, an inferential analysis was conducted once again using the Kruskal–Wallis test (Table 5).
Through this inferential analysis, it can be observed that the differences detected in the overall analysis are not significant in all cases, and indeed, in some cases, they depend on the topic to which each concept belongs. In this way, we can observe how user interest in a product does depend on its level of innovation. The higher the level of innovation, the greater the interest the user expresses in purchasing it, regardless of the product’s function. On the other hand, products related to study will be more intuitive the more traditional the product. However, despite the initial analysis indicating this relationship in general terms, it does not hold for the other two topics, as no significant differences are observed in the intuitiveness expressed by consumers towards traditional and innovative products in the areas of rest, therapy, and relaxation. This emphasizes what was discussed based on the descriptive analysis. Even though it continues to hold that innovative products within the family of interactive lamps, similar to the traditional concept of other product families, are considered intuitive by the user due to unconscious thinking, this only occurs in Topics 2 and 3 related to therapy, relaxation, and rest. However, it does not happen with lamps related to study.
Regarding the desirability of products, as a general rule, users desire the most innovative products. However, this is not the case for products in therapy and relaxation (Topic 2) as no significant differences are observed in the perception that consumers have of innovative and traditional products in this parameter. This is probably due to the scarcity of interactive lamp products related to both topics. The lack of products from this family with this purpose in the market generates, in the consumer, a sense of technological innovation, although not aesthetic innovation [7,11]. Because of this, the products that do resemble the morphological and aesthetic concept of a traditional lamp are not perceived as “traditional” products but as innovative ones, due to their original and novel function. Therefore, although the development of innovative and traditional products generates variations in user perception, belonging to one topic or another does not play a significant role.

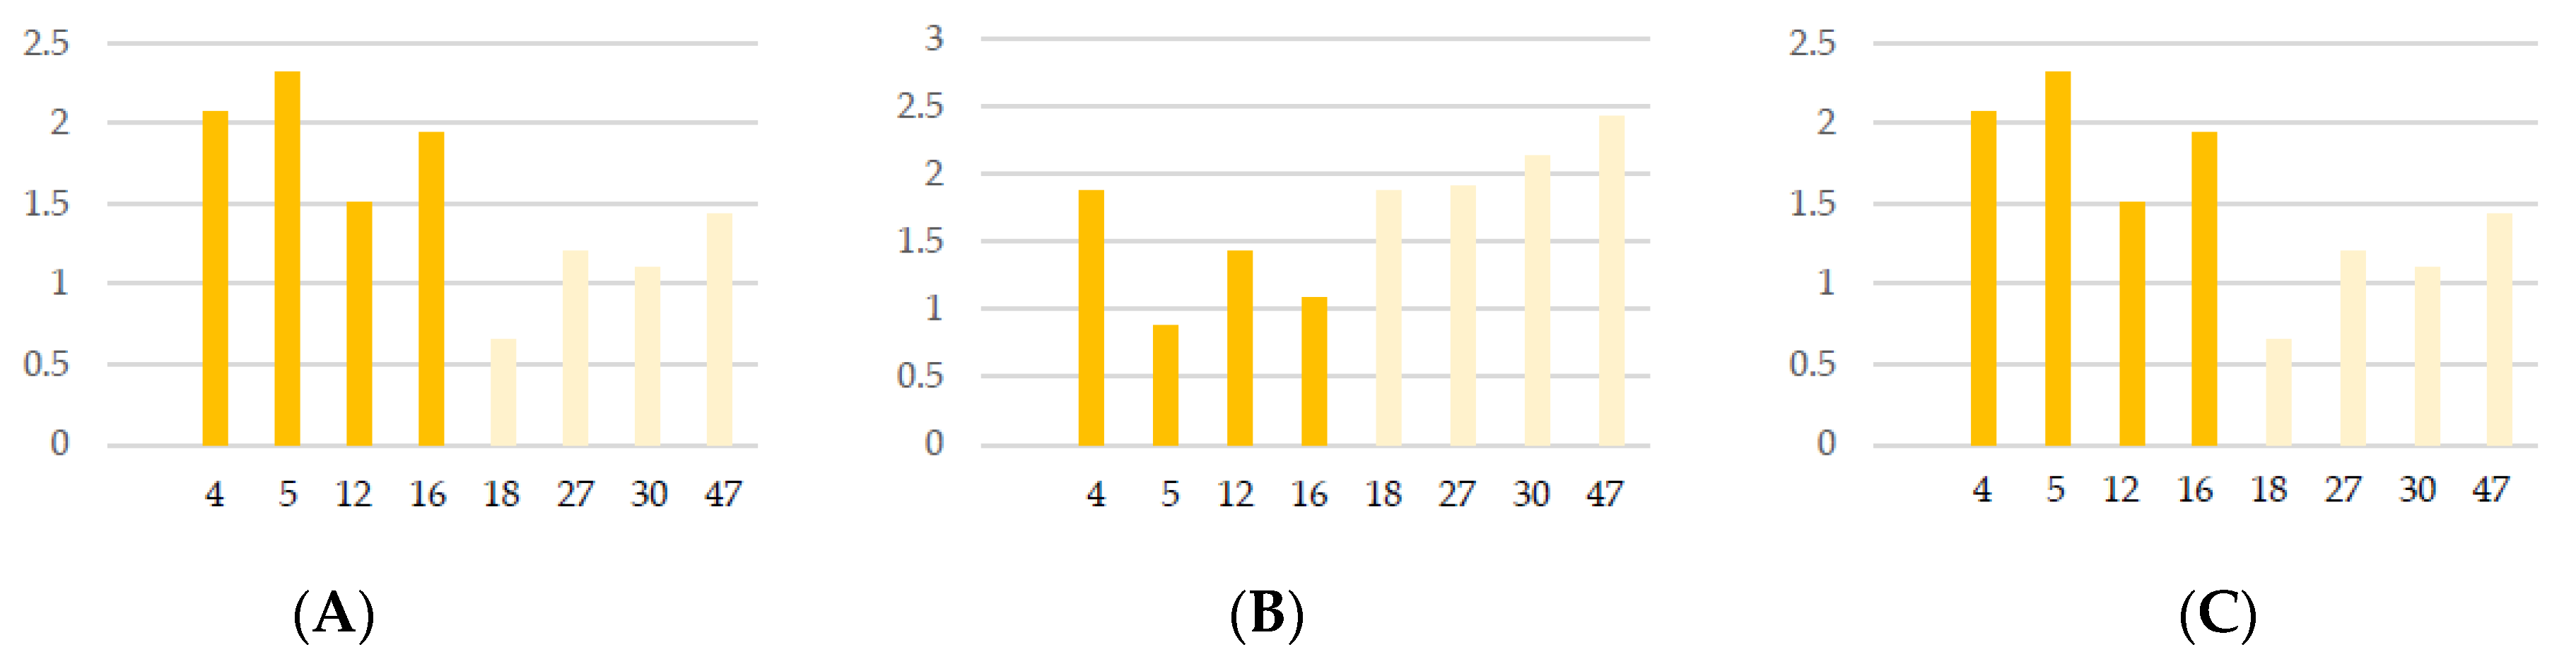
4.2. Study 2—Errors and Successes Arising from Early Evaluation

The final test involved eight participants and eight original products, consisting of four traditional and four innovative designs. These products are numbered 4, 5, 12, 16, 18, 27, 30, and 47 in Figure 3, representing the different topics analyzed. This test analyzes the different levels of Emotional Design (VL, BL, and RL), evaluating the 11 parameters detailed in this methodology (Table 2). Furthermore, as mentioned earlier, these parameters were evaluated using a 7-point Likert scale, ranging from −3 to +3 points, depending on user negative or positive emotional response. Descriptive analysis was conducted to analyze these parameters, and the results, including the mode, mean, and standard deviation, are presented in Table 5.
As seen in Table 6, all three analyzed levels consistently receive positive absolute values. Although there may be negative values for certain parameters, none of the products receive overall evaluations below 0 for each level. However, considering that the positive values range from 0.00 to +3.00 points, we establish a minimum threshold of +1.50 points for a favorable mean rating at each level. Values below this threshold are highlighted in bold, suggesting that the product may not have elicited a sufficient emotional response (though still positive) from the surveyed potential consumers. Based on this, we observe that traditional products achieve insufficient means in VL and RL, while innovative products exhibit lower figures in BL, just like in the first study.
In Figure 8, the values achieved by the eight tested products in VL (A), BL (B), and RL (C) are shown. The innovative products are represented in a darker shade, while the traditional ones are represented in a lighter shade. It can be observed that, in the case of BL, Product 1, classified as “innovative,” achieves values higher than +1.50. This may be because, despite being an innovative interactive lamp, it bears a resemblance to other types of products, allowing users to associate its functionality with that of a regular lamp.
Based on the findings of this study, we can confidently conclude that there are no significant differences between the results of the early evaluation and the final evaluation. This result strongly supports and confirms Hypothesis 4. Therefore, it is recommended that design teams utilize early evaluation as a cost-effective and resource-efficient approach to ensure product success in the market, as already recommended by previous research [9,28].

5. Conclusions

This work demonstrates the influence of innovation on the success of a product in the market. To do so, researchers conducted a specific case study in which they evaluated the emotional response of 33 voluntary potential consumers to a total of 48 new interactive lamp concepts (28 innovative and 20 traditional). The proposed products were classified into three different topics: study, therapy and relaxation, and leisure. The evaluation was conducted in two different phases: the first coincided with the early stage of product design, and the second coincided with the end of the design process, using different materials for each phase. In the first case, sketches were used, and in the second case, functional prototypes were employed. Similarly, the evaluation of the perception of the products was based on the three traditional levels of Emotional Design proposed by Norman, using established parameters from previous research studies.
The research conducted was based on a specific practical case, using a particular population sample (young users aged between 18 and 24 years) and a specific product family (interactive lamps). For this reason, while this study is valid for this type of product and the target population, and it can serve as a good starting point for designing and producing successful products that create a sustainable market and strong business competitiveness, it does have a limitation. It would be interesting to approach the same research with a broader population sample and a different or wider range of product types to verify that the findings presented here can be applied to the design of any product family and various population segments.
Based on the results of these evaluations, the level of success that the proposals would have in the market is analyzed based on their similarity to already-known concepts. In general, the findings of this research highlight the importance of considering innovation, topic relevance, and user perception in product development to meet consumer expectations and achieve market success.
However, the analysis reveals that the differences observed in the overall evaluation are not significant in all cases and may depend on the topic to which each concept belongs, as well as the level at which the emotional response is analyzed. This suggests that innovation is not a guarantee of success and may negatively impact consumer perceptions and preferences in some cases. Although the perceived emotional response in the visceral and reflective levels of innovative products is more positive than in traditional products, the emotional response that users obtain at the conceptual level is more favorable in traditional products.
Innovation only affects this level in products related to leisure and study. The results show that, in these cases, innovation has a negative influence on user understanding of the product, its utility, and its functioning. However, this does not apply to products related to therapy and relaxation (Topic 2) and rest (Topic 3), where, unlike the interest shown, innovation does not affect user perception of the product, either positively or negatively. This may be partly due to the rejection that users have towards the specific function of the product and its lack of relationship to other products primarily focused on leisure and entertainment.
Finally, the study evaluates the differences in the evaluation of this perception between the early stages and the final phase of the design process, finding no significant differences. In this sense, the sample used in the study conducted with prototypes (Study 2) is sufficient to corroborate the results of the first study and verify that there are no significant differences between early and final evaluations. Therefore, it encourages companies and design teams to involve potential consumers in the early stages of the design process to achieve successful products and a sustainable market through collaboration with consumers. However, it would be advisable to repeat the research along these lines with a larger sample size. With direct user–product interaction, a greater number of parameters related to product usability can be evaluated. Therefore, it is recommended for researchers and companies to replicate the experience with a larger number of users and to delve deeper into the measurement of behavioral levels. This is of interest, given the significant differences in emotional responses of the participants in this aspect compared to the other two levels analyzed.

Author Contributions

Conceptualization, M.A.-G.; methodology, M.A.-G.; validation, M.A.-G., E.C.R. and D.M.N.; formal analysis, M.A.-G.; investigation, M.A.-G., E.C.R. and D.M.N.; resources, M.A.-G., E.C.R. and D.M.N.; data curation, M.A.-G.; writing—original draft preparation, M.A.-G.; writing—review and editing, M.A.-G. and E.C.R.; visualization, D.M.N.; project administration, M.A.-G.; funding acquisition, M.A.-G. All authors have read and agreed to the published version of the manuscript.

Funding

The prototypes developed have been partially funded by the University of Cádiz.

Institutional Review Board Statement

Ethical review and approval were waived for this study due to the retrospective nature of the study, and because all the procedures performed were part of routine care.

Informed Consent Statement

Informed consent was obtained from all subjects involved in the study.

Data Availability Statement

The user data collected in this research is not available due to data protection laws.

Conflicts of Interest

The authors declare no conflict of interest.

References

  1. Liu, Y.; Li, K.J.; Chen, H.; Balachander, S.; Liu, K.J.L.Y. The Effects of Products’ Aesthetic Design on Demand and Marketing-Mix Effectiveness: The Role of Segment Prototypicality and Brand Consistency. J. Mark. 2017, 81, 83–102. [Google Scholar]
  2. Van de Ven, A.H. Central problems in the management of innovation. Manag. Sci. 1986, 32, 590–607. [Google Scholar]
  3. Gemser, G.; Barczak, G. Designing the Future: Past and Future Trajectories for Design Innovation Research. J. Prod. Innov. Manag. 2020, 37, 454–471. [Google Scholar]
  4. Gemser, G.; Leenders, M.A. How integrating industrial design in the product development process impacts on company performance. J. Prod. Innov. Manag. 2001, 18, 28–38. [Google Scholar]
  5. Mugge, R.; Dahl, D.W. Seeking the Ideal Level of Design Newness: Consumer Response to Radical and Incremental Product Design. J. Prod. Innov. Manag. 2013, 30, 34–47. [Google Scholar]
  6. Talke, K.; Salomo, S.; Wieringa, J.E.; Lutz, A. What about Design Newness? Investigating the Relevance of a Neglected Dimension of Product Innovativeness. J. Prod. Innov. Manag. 2009, 26, 601–615. [Google Scholar]
  7. Dan, S.M.; Spaid, B.I.; Noble, C.H. Exploring the sources of design innovations: Insights from the computer, communications and audio equipment industries. Res. Policy 2018, 47, 1495–1504. [Google Scholar]
  8. Rubera, G. Design Innovativeness and Product Sales’ Evolution. Mark. Sci. 2015, 34, 98–115. [Google Scholar]
  9. Van Kleef, E.; Van Trijp, H.C.; Luning, P. Consumer research in the early stages of new product development: A critical review of methods and techniques. Food Qual. 2005, 16, 181–201. [Google Scholar]
  10. Marquis, J.; Deeb, R.S. Roadmap to Successful Product Development. IEEE Eng. Manag. Rev. 2018, 46, 51–58. [Google Scholar]
  11. Moon, H.; Miller, D.R.; Kim, S.H. Product Design Innovation and Customer Value: Cross-Cultural Research in the United States and Korea. J. Prod. Innov. Manag. 2013, 30, 31–43. [Google Scholar]
  12. Chapman, J. Emotionally Durable Design: Objects, Experiences, and Empathy; Routledge: London, UK, 2015. [Google Scholar]
  13. Norman, D. Emotional Design: Why We Love or Hate Everyday Things; Hachette: London, UK, 2007. [Google Scholar]
  14. Hekkert, P. Design Aesthetics: Principles of Pleasure in Design. Psychol. Sci. 2006, 48, 157. [Google Scholar]
  15. Truong, Y.; Klink, R.R.; Fort-Rioche, L.; Athaide, G.A. Consumer Response to Product Form in Technology-Based Industries. J. Prod. Innov. Manag. 2014, 31, 867–876. [Google Scholar]
  16. Desmet, P.M.; Nicolás, J.C.O.; Schoormans, J.P. Product personality in physical interaction. Des. Stud. 2008, 29, 458–477. [Google Scholar]
  17. Cooper, R.G. The drivers of success in new-product development. Ind. Mark. Manag. 2019, 76, 36–47. [Google Scholar]
  18. Pauley, S.M. Lighting for the human circadian clock: Recent research indicates that lighting has become a public health issue. Med. Hypotheses 2004, 63, 588–596. [Google Scholar]
  19. Schütte, S.T.; Eklund, J.; Axelsson, J.R.; Nagamachi, M. Concepts, methods and tools in Kansei Engineering. Theor. Issues Ergon. Sci. 2004, 5, 214–231. [Google Scholar]
  20. Alcántara, E.; Artacho, M.A.; González, J.C.; Garcia, A.C. Application of product semantics to footwear design. Part I. Identification of footwear semantic space applying diferential semantics. Int. J. Ind. Ergon. 2005, 35, 713–725. [Google Scholar]
  21. Demir, E.; Desmet, P.M.; Hekkert, P. Appraisal Patterns of Emotions in Human-Product Interaction. Int. J. Des. 2009, 3, 41–51. Available online: http://www.ijdesign.org/index.php/IJDesign/article/view/587/259 (accessed on 14 July 2023).
  22. Desmet, P.M. Faces of Product Pleasure: 25 Positive Emotions in Human-Product Interactions. Int. J. Des. 2012, 6, 1–29. Available online: https://diopd.org/wp-content/uploads/2012/09/faces-of-product-pleasure-published.pdf (accessed on 14 July 2023).
  23. Liberman-Pincu, E.; Bitan, Y. FULE—Functionality, Usability, Look and Feel and Evaluation Novel User Centered Product Design Methodology. Illustrated in the Case of an Autonomous Medical Device. Appl. Sci. 2021, 11, 985. [Google Scholar]
  24. Aftab, M.; Rusli, H.A. Designing Visceral, Behavioural and Reflective Products. Chin. J. Mech. Eng. 2017, 30, 1058–1068. [Google Scholar]
  25. Norman, D.A. Designing Emotions Pieter Desmet. Des. J. 2003, 6, 60–62. [Google Scholar]
  26. Cecil, J.; Kanchanapiboon, A. Virtual engineering approaches in product and process design. Int. J. Adv. Manuf. Technol. 2007, 31, 846–856. [Google Scholar]
  27. Berni, A.; Borgianni, Y. Applications of Virtual Reality in Engineering and Product Design: Why, What, How, When and Where. Electronics 2020, 9, 1064. [Google Scholar]
  28. Alonso-García, M.; Pardo-Vicente M, Á.; Rodríguez-Parada, L.; Moreno Nieto, D. Do products responds to users desires? Symmetry 2020, 12, 1350. [Google Scholar]
  29. Becattini, N.; Borgianni, Y.; Cascini, G.; Rotini, F. Investigating users’ reactions to surprising products. Des. Stud. 2020, 69, 100946. [Google Scholar]
  30. Kamil, M.J.M.; Abidin, S.Z. Unconscious human behavior at visceral level of emotional design. Procedia-Soc. Behav. Sci. 2013, 105, 149–161. [Google Scholar]
  31. Greeno, J. Gibson’s affordances. Psychol. Rev. 1994, 101, 336–342. [Google Scholar] [CrossRef] [Green Version]
  32. Desmet, P.M.; Xue, H.; Fokkinga, S.F. The Same Person Is Never the Same: Introducing Mood-Stimulated Thought/Action Tendencies for User-Centered Design. She Ji J. Des. Econ. Innov. 2019, 5, 167–187. [Google Scholar]
  33. Shneiderman, B.; Plaisant, C.; Cohen, M.S.; Jacobs, S.; Elmqvist, N.; Diakopoulos, N. Designing the User Interface: Strategies for Effective Human-Computer Interaction; Addison-Wesley: Boston, MA, USA, 2016. [Google Scholar]
  34. Bustamante, N.G.; Macías AA, M.; Durán, A.A.; Nicolás JC, O.; Quiñones, A.R. Usability Test and Cognitive Analyses during the Task of Using Wireless Earphones. In Handbook of Research on Ergonomics and Product Design; IGI Global: Hershey, PA, USA, 2018. [Google Scholar]
  35. Nielsen, J. Usability Engineering; Morgan Kaufmann: San Francisco, CA, USA, 1993. [Google Scholar]
  36. Hua, M.; Fei, Q. The value of unconscious behavior on interaction design. In Proceedings of the IEEE 10th International Conference on Computer-Aided Industrial Design & Conceptual Design, Wenzhou, China, 26–29 November 2009. [Google Scholar]
  37. Bargh, J.; Morsella, E. Unconscious behavioral guidance systems. In Then a Miracle Occurs: Focusing on Behavior in Social Psychological Theory and Research; Oxford University Press: Oxford, UK, 2010; pp. 1–36. [Google Scholar]
  38. Freud, S. The Unconscious; Hogarth Press: London, UK, 1955. [Google Scholar]
  39. Vollmer, F. The Control of Everyday Behaviour. Theory Psychol. 2001, 11, 637–654. [Google Scholar]
  40. Chu, C.-H.; Kao, E.-T. A Comparative Study of Design Evaluation with Virtual Prototypes Versus a Physical Product. Appl. Sci. 2020, 10, 4723. [Google Scholar]
  41. Palacios-Ibáñez, A.; Alonso-García, M.; Contero, M.; Camba, J.D. The Influence of Hand Tracking and Haptic Feedback for Virtual Prototype Evaluation in the Product Design Process. J. Mech. Des. 2022, 145, 1–44. [Google Scholar]
  42. Tsai, A.Y.-J.; Yang, M.-J.; Lan, C.-F.; Chen, C.-S. Evaluation of effect of cognitive intervention programs for the community-dwelling elderly with subjective memory complaints. Int. J. Geriatr. Psychiatry 2008, 23, 1172–1174. [Google Scholar] [PubMed]
  43. Krippendorff, K. The Semantic Turn: A New Foundation for Design; Taylor & Francis Group CRC Press: New York, NY, USA, 2006. [Google Scholar]
  44. Martínez Miguélez, M. Dimensiones Básicas de un Desarrollo Humano Integral. Polis. Revista Latinoam. 2009, 8, 119–138. [Google Scholar]
  45. Google. It’s Lit, A Guide to What Teens Think Is Cool; Google: Mountain View, CA, USA, 2017. [Google Scholar]
  46. España, C. Social Networks, Angels and Demons 2020. Available online: https://assets-eu-01.kc-usercontent.com/1cce5d9b-1373-0176-8af1-0e1a4a708487/dbf017e1-535a-404c-be7f-298b0afffd95/Informe%20Carat_Redes%20Sociales_%C3%A1ngeles%20y%20demonios.pdf (accessed on 14 July 2023).
  47. Erikson, E. The Complete Life Cycle; W. W. Norton & Company: New York, NY, USA, 2000. [Google Scholar]
Figure 1. Evaluations (orange) and design process (blue).
Sustainability 15 12231 g001
Figure 2. Main entertainment interests of surveyed users.
Sustainability 15 12231 g002
Figure 3. Interactive lamp alternatives designed by the 12 teams.
Sustainability 15 12231 g003
Figure 4. Process employed during the research [35].
Sustainability 15 12231 g004
Figure 5. Differences in user perception of traditional and innovative products, according to the interest (A), intuitiveness (B), and desirability (C) they represent. Box plot diagrams (top) and violin diagrams (bottom).
Sustainability 15 12231 g005
Figure 6. Perception of interest (A), intuitiveness (B), and desirability (C) of the products according to the topic they belong to. Descriptive analysis.
Sustainability 15 12231 g006
Figure 7. Perception of interest (A), intuitiveness (B), and desirability (C) of the products are categorized by their respective topics and their similarity to traditional concepts. Descriptive analysis.
Sustainability 15 12231 g007
Figure 8. Results of the evaluation for the innovative products 4, 5, 12, and 16, and the traditional products 18, 27, 30, and 47 in VL (A), BL (B), and RL (C).
Sustainability 15 12231 g008
Table 1. Distribution of the sample consulted according to education and dedication.
EducationDedication
Currently studying (95%)Higher Education77.9%Currently working and studying12.2%
Currently studying65.7%
Medium Education16.2%Currently working and studying1.8%
Currently studying14.4%
Lower Education0.9%Currently studying0.9%
Currently not studying5.0%Currently working5.0%
Table 2. Parameters, methods, and tools for measuring response at different levels by study.
ParametersMethodsTools
USER PARTICIPATION: observation (o), INTERACTION (I) OR assimilation (a)Measurement. Before (B)/During (D)/After (A) explanation
Study12121212
VLInterestUnpleasant/attractive (P1)
Boring/interesting (P2)
Ordinary/surprising (P3)
Useless/useful (P4)
Old/new (P5)
OOBBGeneral sketchesPrototype
BLIntuitivenessLearn. facility (P6) Memorization(P7) Effectiveness (P8) Efficiency (P9) Satisfaction (P10)OIB, ADFunctional sketchPrototype
RLDesirabilityEvoked feelings,
emotions, and
memories
AAAAGeneral and
Functional sketches
Prototype
Table 3. General differences between traditional and innovative products. Post hoc test.
χ2glpε2
Interest15.691 0.0030.334
Intuitiveness6.2510.0120.133
Desirability17.3710.0030.370
Table 4. Mean, mode, and standard deviation of traditional and innovative products according to the topic the products belong to. Descriptive analysis.
SimilarityTopicInterestIntuitivenessDesirability
MeanTraditional1−0.3640.455−0.364
2−0.2000.200−0.200
3−1.000.333−0.667
Innovative10.4620.000.692
20.526−0.2110.474
30.455−0.09090.682
ModeTraditional1−1.001.00−1.00
2−1.001.00−1.00
3−1.001.00−1.00
Innovative11.000.001.00
21.00−1.001.00
31.00−1.001.00
Standard
Deviation
Traditional10.8090.6880.674
20.8371.000.837
30.000.8160.516
Innovative10.8770.8160.630
20.7720.8550.772
30.8000.8680.568
Table 5. Topic 1, 2, and 3 differences between traditional and innovative products. Post hoc test.
TOPIC 1:Study
χ2glpε2
Interest4.8510.0280.2109
Intuitiveness1.9610.0420.1852
Deseirable3.2210.0430.1399
TOPIC 2: Therapy and relaxation
χ2glpε2
Interest3.40610.0650.14808
Intuitiveness0.71210.3990.03094
Deseirable0.21810.6410.00947
TOPIC 3: Leisure
χ2glpε2
Interest11.0510 .0010.4091
Intuitiveness1.1510.2850.0424
Desirable7.5310.0060.2789
Table 6. Differences between traditional and innovative products by testing prototypes. Study 2.
VLBLRL
SimilarityVL1VL2VL3VL4VL5 LFMEYESS
MeanInnovative1.882.471.930.7142.421.88−0.2662.281.851.731.011.322.33
Traditional1.001.410.9271.101.061.101.132.842.602.631.222.081.19
ModeInnovative−0.6302.030.380−0.2501.901.52−1.502.501.881.381.630.8801.80
Traditional−0.2500.3800.3800.8800.6300.6500.2502.752.632.500.6301.870.250
Standard
Deviation
Innovative1.450.4480.9670.9660.3960.3361.230.2230.6700.3411.610.3760.471
Traditional0.8730.7380.5130.5250.5400.3310.6380.1200.1560.1440.7150.2540.09
Disclaimer/Publisher’s Note: The statements, opinions and data contained in all publications are solely those of the individual author(s) and contributor(s) and not of MDPI and/or the editor(s). MDPI and/or the editor(s) disclaim responsibility for any injury to people or property resulting from any ideas, methods, instructions or products referred to in the content.

