Article

Quantitative Distribution and Contamination Risk Assessment of Cu and Zn in Municipal Sewage Sludge

Department of Soil Science and Microbiology, Poznan University of Life Sciences, 60-656 Poznań, Poland
Sustainability 2023, 15(15), 12087; https://doi.org/10.3390/su151512087
Submission received: 24 May 2023 / Revised: 23 July 2023 / Accepted: 31 July 2023 / Published: 7 August 2023
(This article belongs to the Special Issue Treatment, Evaluation, Recycling and Use of Sewage Sludge)

Abstract

:
One of the methods of managing sewage sludge (SS) is its soil application. This possibility is promoted by the chemical composition rich in organic matter and nutrients. However, heavy metal contents in SS must meet respective permissible limits. Among the heavy metals in SS, Cu and Zn are found in the largest amount; thus, this study focuses on these elements. The main aim of the study is to investigate the quantitative distribution of metals in sequentially separated fractions of sewage sludge. Additionally, the potential risk of environmental contamination with heavy metals was assessed in the case of SS application for agricultural purposes. The relevant analyses were conducted on four different examples of municipal SS. Based on the total amounts as well as those determined in the SS fractions, the following indices were calculated: Igeo (geoaccumulation index), ICF, (individual contamination factor), and RAC (risk assessment code). The use of data from the sequential analysis as well as the calculated indices made it possible to assess the usefulness of SS in practice in terms of potential introduction of Cu and Zn into the environment with the sludge dose. It was found that total Cu (Cutot) and Zn (Zntot) did not exceed the permissible limits binding within respective Polish and international regulations. Regardless of the years of study and the analyzed SS, Cutot ranged from 260.9 to 393.5 mg·kg−1, and Zntot from 475.5 to 1153.1 mg·kg−1. The amounts of Cu and Zn were predominantly reducible (bound to iron and manganese hydroxides, Fr. II) and oxidizable complexes (bound to organic matter and sulfides, Fr. III). The average amounts of Cu in Fr. II ranged from 149.4 to 172.4 mg·kg−1, while those of Zn in Fr. II ranged from 370.9 to 754.6 mg·kg−1. Cu amounts in Fr. III were from 160.9 to 183 mg·kg−1 and Zn amounts in Fr. III were from 104.9 to 171.9 mg·kg−1. Total content of metals as well as TOC values strongly determined the quantitative level of both elements in the SS fractions. Generally, with the increase in the total amount of metals, their levels in the sludge fractions increased. In turn, the increase in TOC resulted in a decrease in the amounts of Cu and Zn in the sludge fractions. Calculated Igeo and ICF ratios showed high and very high SS contamination with Cu and Zn. Igeo values for Cu, regardless of the year of study and sludge sample, that ranged from 4.62 to 5.43 and for Zn from 3.41 to 4.86. At the same time, the ICF values for Cu ranged from 8.59–23.04, and for Zn 15.42–44.47. The RAC values indicated a low (Cu) and medium (Zn) risk of using SS in terms of the potential metal availability in the environment. The RAC values ranged from 1.46 to 4.40% for Cu and from 9.63 to 23.13% for Zn.

1. Introduction

Copper and zinc belong to the group of chalcopyrene elements, found in ores mainly in the form of sulfides. These metals are common in nature, together with other cyclic elements, and constitute as much as 99.9% of the Earth’s crust [1]. In addition to their considerable economic importance, both elements are microelements essential for the health of humans, animals, and plants. Zinc and copper are mainly loaded with industrial wastewater from such industry branches as metallurgy, textile, paint and fertilizer production, as well as manufacture of plant protection products and plastics. In municipal sewage sludge, the presence of Cu and Zn is primarily associated with the corrosion of copper and galvanized pipes and is also the result of the use of dietary supplements, cosmetics, or medicines by humans [2,3,4,5]. Heavy metals in wastewater are found in various forms, which is mainly due to their biogeochemical character. Additionally, according to Ziolko et al. [6], most metals in wastewater can be associated with three major sub-fractions: surface-bonded organic ligands, insoluble matter, and soluble organic ligands. The ability to form various fractions is used in the process of purifying wastewater from impurities. During the municipal wastewater treatment process, not only biogenic compounds (C,N,P) are removed, but also heavy metals. Ziolko et al. [6] or Sylwan and Thorin [7] described these issues in detail, emphasizing the importance of the sedimentation process during the initial mechanical treatment of wastewater. More complex processes are involved during the stage of biological wastewater treatment by activated sludge, such as binding of soluble metals to bacterial walls and extracellular polymers, active cellular uptake of soluble metals by the bacteria cells, or volatilization of metal to the atmosphere. Additionally, metals may be transferred from wastewater during chemical precipitation of phosphorous and during sludge stabilization in fermentation chambers [6]. In addition, during the sewage sludge dewatering process, at least partial removal of heavy metals from the sludge can be expected, although this largely depends on the type of processes used [8]. According to the cited authors [8], the obtained centrate may contain high contents of N and heavy metals, mainly Zn, Cu, Ni, and Pb, which was confirmed in the study carried out by these authors in relation to Zn. In general, the cited studies found low metal concentrations in the centrate, which was explained by the authors in view of special factors resulting from low redox conditions and neutral pH. These conditions are conducive to the formation of insoluble complexes, leaving the dissolved state. Moreover, with an increasingly negative surface charge during the process, sludge flocs are likely to exert strong electrostatic attraction toward cationic metals and metalloids, thus promoting adsorption to the sludge surface [8].
Due to the multitude of processes, by which metals can be transferred from wastewaters to sludge, as well as the fact that these pollutants are not subject to decomposition, they may be readily accumulated in the product of municipal wastewater treatment, i.e., sewage sludge. Thanks to the technological progress and the increased populations having access to the sewage system, the mass of sewage sludge produced is increasing, which is particularly noticeable in Europe, North America, and East Asia [9]. Of course, such a tendency has positive effects in terms of protecting aquatic ecosystems, but it also creates a problem with management of the biomass of such waste. According to Shaddel et al. [10], the management of SS varies in different countries due to dissimilar social, economic, and technical contexts. The authors cited above [10] listed common strategies such as no recycling (landfill, storage), substance reuse (land use), substance conversion (composting, anaerobic digestion, incineration), and energy recovery. Regardless of the various possibilities, low-cost methods are still chosen, which are not always in line with the principles of environmental protection. Presently, land application as a major route for SS utilization in the EU has been banned in several countries, or limited only to its use for reclamation purposes. However, in many countries around the world (the USA, China, South Korea), sewage sludge is successfully used for agricultural purposes, in view of the SS chemical composition rich in organic matter and nutrients [11,12,13], and thus it contributes significantly to the improvement of soil fertility [14,15,16]. However, when SS is applied repeatedly, there is a possibility of heavy metal accumulation in soil and the resulting incorporation into the food chain. To minimize the negative impacts of adding SS to soil, the EU passed the European Directive [17] as an SS management measure, specifying the content limits of heavy metals both in soil and SS [18]. A similar legal regulation exists in Poland [19]; it specifies the conditions for SS use and criteria regarding hygienization and thresholds of heavy metal contents both in soil and SS. Compliance with these legal provisions is important because according to statistical data [20], sewage sludge management in Poland is based on its agricultural use as an alternative to organic manure, or sewage sludge is subject to co-composting. The aforementioned legal regulations, both Polish and EU, limit the level of heavy metals in SS based on their total amounts. Of course, this is essential information, and the total contents of heavy metals in SS can provide important but general knowledge. However, toxicity, mobility, bioavailability, and geochemical processes of metals in the environment depend strongly on their geochemical fraction [11,21,22,23]. Generally, metals can be found in various forms: water-soluble, exchangeable, carbonate-bound, bound to Mn, Fe oxides and hydroxides, bound to organic matter, or they appear in the residual fraction. The sequential extraction procedure is performed with increasingly aggressive solutions of the reagent. For each step there is a selected reagent capable of eluting the group of metal compounds with strictly known properties—for example, susceptibility of a given element to solubility and mobility. The BCR method, the most popular among the sequential techniques and very frequently used for various matrices, defines four main fractions: exchangeable, bound to iron and manganese oxyhydroxides, bound to organic matter and sulfides, and residual. Among them, the first two are the most important because metals in these combinations are the most mobile and accessible to plants, while they may also be subject to secondary accumulation on SS colloids [22,23]. Knowledge of geochemical fractionation through sequential extraction is essential for understanding of the physical and chemical behavior of heavy metals for proper SS management. This is primarily related to the mobility and bioavailability of metals, which directly determines their potential negative environmental impact. For this purpose, such additional indicators are applied as, e.g., the geoaccumulation index (Igeo), contamination factor (ICF), and risk assessments code (RAC) to evaluate the potential harm of heavy metals in SS to the environment. Considering the above, this research presents an innovative and comprehensive approach to the broadly understood environmental safety of sewage sludge used for fertilization purposes. This issue has been included as a sub-compilation of a sophisticated chemical analysis on metal fractionation in the solid phase of sludge with the use of indices evaluating the mobility and potential negative accumulation of Cu and Zn in the environment along with a forecast of such risk. In view of the above, scientific hypothesis can be made that an important issue for practice is the mutual interaction between the examined variables, i.e., the metals in the SS and the calculated indices. It can be assumed that such a relationship will exist and the assessed amounts of Cu and Zn in various connections with SS will determine the index values, indicating at the same time the level of environmental safety of the tested sewage sludge. Therefore, this study aimed to achieve the following: 1. Investigate the occurrence and quantify the current range of total Cu and Zn contents in sewage sludge originating from different municipal wastewater treatment plants; 2. Investigate the distribution and geochemical fractionation as a key to the evaluation of Zn and Cu bioavailability and mobility in relation to the potential use of the geoaccumulation index (Igeo), contamination factor (ICF), and risk assessment code (RAC); and 3. Valorize the special and temporal variation of Cu and Zn amounts in sequentially separated fractions, as well as in their total contents in sewage sludge.

2. Materials and Methods

2.1. Materials

There are 400 different municipal wastewaters treatment plants (WWTPs) operating in the Wielkopolskie province, which treat incoming wastewaters in a similar technological system, generating sewage sludge (SS). In this work, samples of sewage sludge were analyzed, which are exemplary and representative materials of typical WWTPs. Details related to the characteristics of SS treatment, collection, and its preparation for chemical analyses were presented in detail in an earlier papers by Jakubus [22,23]. Here, general information is given to provide understanding of the research context. Sewage sludge samples used in this study were gathered from four WWTPs differing in their designed size expressed as the equivalent number of inhabitants (ENI), and consequently the amount of wastewaters purified and the resulting sewage sludge produced (Table 1). Sewage sludge samples 1 and 2 (SS1, SS2) came from large facilities, serving large urban agglomerations, while sludge samples 3 and 4 (SS3 and SS4) came from small, local installations, serving smaller towns. The locations of WWTPs are presented in Figure 1. The SS samples were collected in three consecutive years after the completed process of SS management at the WWTPs. The SS samples were dried at 105 °C, ground to obtain a homogeneous, uniform structure, and then stored in plastic bags at 4 °C. Briefly, the reporting results concerned SS indicating typical properties characterized by an alkaline reaction, C:N values of 5.8–6.6, Ntot ranging from 50.4 to 73.0 g·kg−1, and the amount of TOC from 329.6 to 420.1 g·kg−1. For the assessment of Ntot and TOC, the Vario Max CNS apparatus was used.

2.2. Methods

As previously noted, detailed information on the analytical procedures used can be found in earlier publications by Jakubus [22,23]. Total copper (Cutot) and zinc (Zntot) contents in sewage sludge were determined using the aqua regia procedure [24]. Distribution of metals in individually separated fractions of SS was analyzed by the BCR method [25]. According to this protocol, the following four fractions were separated: Fr. I (exchangeable, water, and acid-soluble), Fr. II (reducible, e.g., bound to iron and manganese hydroxides), Fr. III (oxidizable, e.g., bound to organic matter and sulfides), and Fr. IV (residual, non-silicate bound metals). The Cu and Zn concentrations in the obtained extracts, both total amounts and in separated sewage sludge fractions, were determined by flame atomic absorption spectrometry (FAAS) using the Varian Spectra AA 220 FS apparatus.

2.3. Indices of Contamination Assessment

The metal amounts in the separated SS fractions allowed to determine the following independent indexes: the geoaccumulation index (Igeo), the individual contamination factor (ICF), and the risk assessment code (RAC). Table 2 presents detailed information concerning the above-mentioned indices.

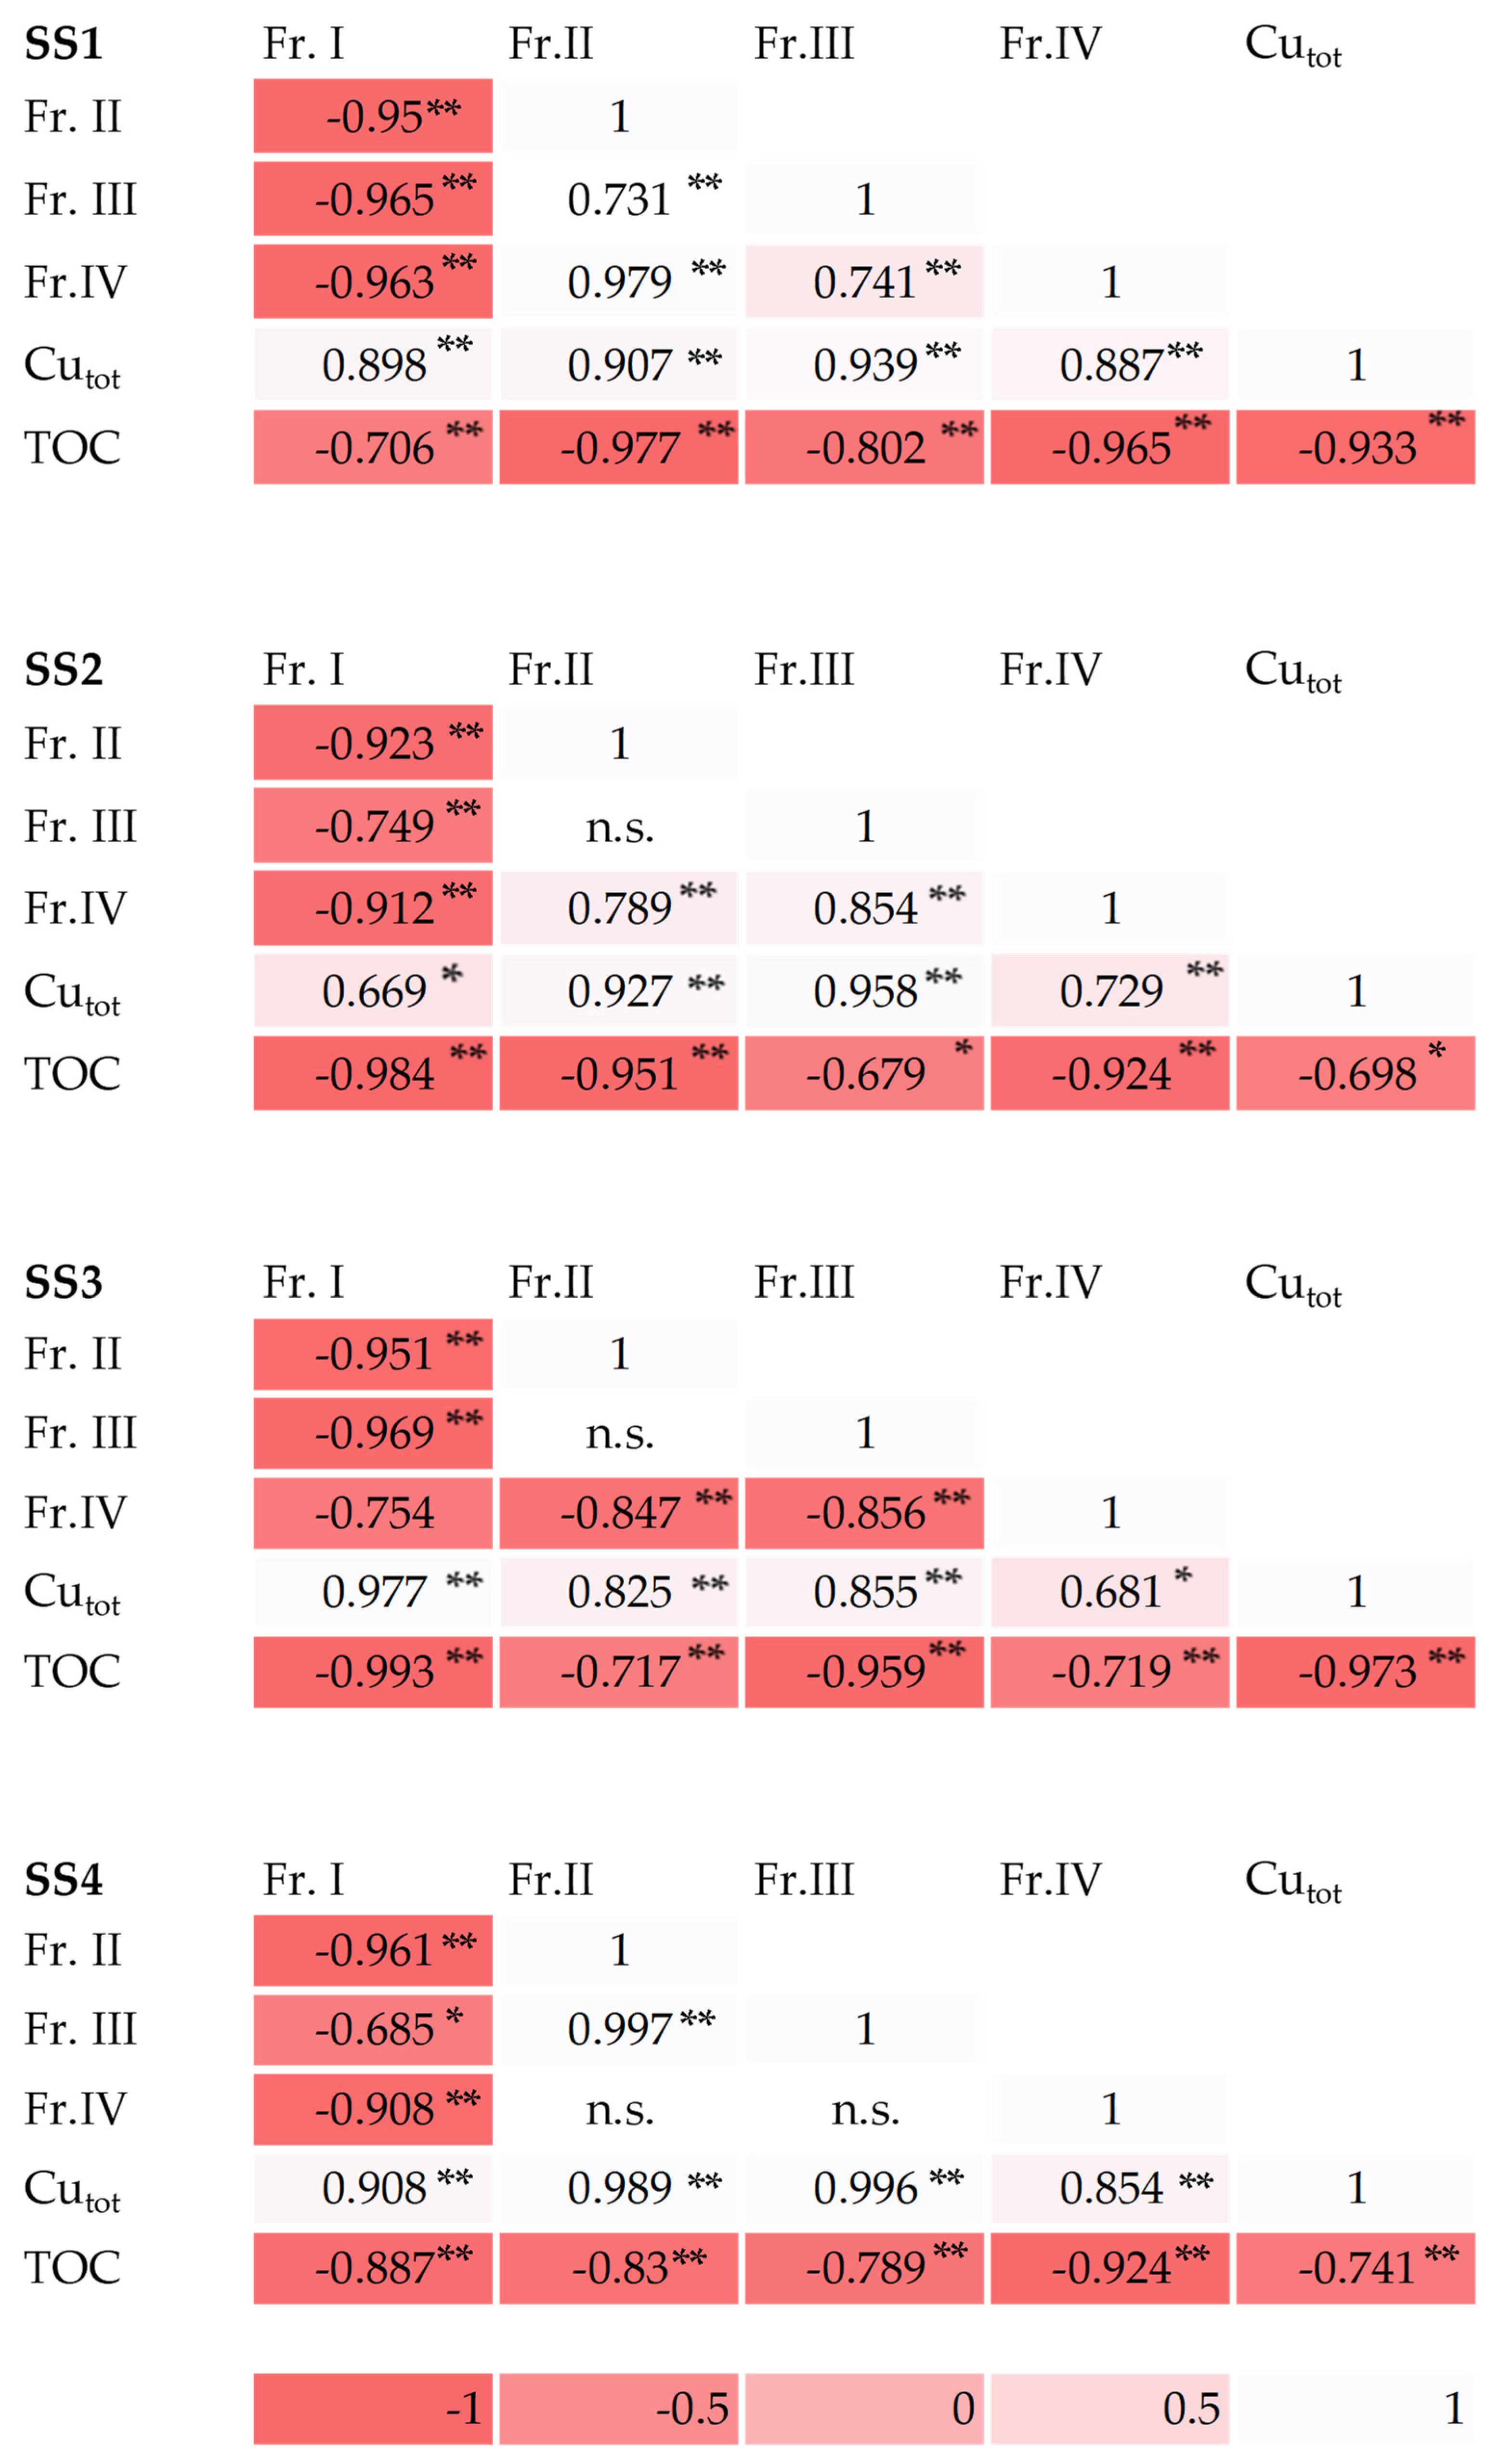
2.4. Statistical Analysis

Data presented in the paper are means of three repetitions. Statistical calculations were made using the STATOBL software working in the Windows environment. Due to the fact that the experiment takes into account three factors—years (A), amounts of metals in the separated fractions (B), and sewage sludge (C)—the three-way ANOVA was applied. On the other hand, two-way ANOVA was applied to calculate total metal amounts, including the following two factors: years (A) and sewage sludge (B). Tukey’s test at the α = 0.05 level was applied to calculate the least significant differences and to indicate uniform, homogeneous groups (mean contents of metals do not differ significantly) within the factor level. Box-whiskers plots were constructed to represent the total and individual amounts of metals in the SS fractions. In the boxplot figures, the distribution of data is given by the minimum value, maximum value, median, and first and third quartiles shown for each parameter. In addition, Pearson’s correlation coefficients were calculated for the analyzed parameters. Based on the correlation coefficients, the determination coefficient was calculated as follows: R2 (%) = r2·100%. Moreover, for pairs (x, y) of correlated parameters, estimates of simple regressions of the form can be determined (Regression model): y = β0 + β1x, where the regression parameter β1 shall be interpreted as follows: if parameter x increases by one unit, parameter y increases (decreases) by β1 units.

3. Results and Discussion

3.1. Total Amounts of Metals

The mean total amounts of Cu for the years of the study were as follows: for SS1—383.1 mg·kg−1, ranging from 267.8 to 469 mg·kg−1; for SS2—362.5 mg·kg−1, ranging from 336.3 to 393.5 mg·kg−1; for SS3—347.4 mg·kg−1, ranging from 311.4 to 377.8 mg·kg−1, and for SS4—324.1 mg·kg−1, ranging from 260.9 to 379.4 mg·kg−1 (Figure 2). It should be noted that the total Cu amounts were decreasing from year to year, which was particularly evident for SS1 (42% reduction) and SS4 (21% reduction). On the other hand, the average total amounts of Cu for SS2 and SS3 were comparable in the years of the study (Table 3). The decrease in total Zn amounts during the years of the study was also noticeable. Such a tendency can be noted for SS1 (2-fold decrease) and SS3 and SS4 (20% lower amount). As shown in Figure 2, the amounts of Zn in the years of the study ranged from 652.6 to 1311.3 mg·kg−1, on average 1080.2 mg·kg−1 for SS1, from 1009.5 to 1153.1 mg·kg−1, on average 1094.5 mg·kg−1 for SS2, from 475.5 to 704.4 mg·kg−1, on average 591.1 mg·kg−1 for SS3, and from 477.8 to 677.4 mg·kg−1, on average 583.5 mg·kg−1 for SS4. It is worth emphasizing that SS1 was characterized by wide quantitative ranges of both Cu and Zn (Figure 2). SS from the facilities serving large agglomerations (SS1 and SS2) had significantly higher Zn contents than those found for SS3 and SS4, while significantly differing from each other. Zntot was at a comparable level for SS3 and SS4 and not significantly different, especially in the 2nd and 3rd year of the study (Table 3). The total amounts of Cu also did not differ significantly for SS2, SS3, and SS4. Significantly higher amounts of the metal were found in SS1 (Table 3).
When comparing the total amounts of Cu and Zn found in the analyzed sewage sludge with the permissible threshold values given in the Polish, EU, and American regulations (Table 3), it should be stated that they were below the admissible limits, and thus such SS can be used for agricultural purposes as well as co-composting.
The composition of sewage sludge is the result of many factors [23]; hence, various amounts of heavy metals are presented in the literature. In general, sewage sludge from China is more heavily loaded with heavy metals, which may be related to China’s position in the production of rare earth elements, accounting for almost 50% of world production [21]. In addition, a study conducted by Braga et al. [29] showed higher amounts of these metals in analyzed sewage sludge. The quantitative levels of Cu and Zn in the presented studies are comparable to other data [5,11,30], but they are also higher in relation to the results reported by [2,4,31,32].
Table 3. Mean total metal contents depending on sewage sludge and the years of the study (mg·kg−1).
CuZn
1st2nd3rd1st2nd3rd
SS1460.1420.7268.41277.41307.2656.2
SS2349.2396.3342.01098.11150.51035
SS3344.3373.5324.4700.3596.1476.8
SS4331.5379.4261.4673.1592.5484.9
LSD = 15.664LSD = 18.540
Polish permissible level [19]10002500
EU permissible level [17]1000–17502500–4000
US EPA permissible level [33]15002800
Total metal contents provide a general idea on the degree of possible SS contamination with them. Based on the total amounts of metals in the SS, we theoretically estimate the amount of metals introduced with the SS dose per arable layer per hectare. Generally, these amounts are small, which is mainly due both to the legal regulations specifying certain limits of metals in SS and the statutory annual dose of SS that can be used. However, despite the above, it is important to remember that such safely small amounts can be misleading, because the total amount of metals does not take into account the degree of mobility of the various combinations of elements with the solid phase of sewage sludge. In view of metal bioavailability, their total contents are of limited importance; therefore, this issue should be considered in more detail using sequential analysis methods [22,23]. Studies related to the quantitative distribution of metals in SS fractions not only indicate their mobility and potential distribution, but it is also possible to estimate the potential negative environmental impact on their basis.

3.2. Quantitative Distribution of Metals in Sewage Sludge

Cu amounts in sequentially separated fractions decreased in the following series: Fr. III > Fr. II > Fr. IV > Fr. I. Most studies on the quantitative distribution of metals in sewage sludge fractions show a similar distribution pattern, indicating the dominance of Cu in organic connections, with the lowest amount of this element in the exchangeable, i.e., the most mobile fraction [4,31,32,34]. In turn, Braga et al. [29] showed that Cu was the least associated with the residual fraction of sewage sludge. The level of this metal in fraction I was comparable for the analyzed sewage sludge. On the other hand, the amounts of Cu in fractions II, III, and IV differed significantly between individual SS samples (Table 4).
Cu amounts in Fr. IV for SS1 and SS2 were comparable, similarly as for SS3 and SS4. Regardless of the years of the study, the Cu amounts in individual fractions varied within wide ranges, which was particularly noted for SS2 and SS3 for Fr. I, as well as SS3 and SS4 in the case of Fr. II, III, and IV (Figure 3). It should be noted that although SS2 and SS4 came from different facilities (different sizes of wastewater treatment plants, i.e., serving large agglomerations and small municipalities) and significantly differed in the total amount, their average metal contents in the fractions were comparable (Table 4).
As indicated by the data contained in Table 5, the Cu content in fractions II, III, and IV decreased in the years of the study, while it increased in fraction I. The decrease in the Cu amount in the years of the study was also emphasized as a mean value for fractions. The greatest reduction in the metal content was found for SS1 (by 25%) and SS4 (by 30%) (Table 5).
Regardless of the SS sample, the amount of Cu in the fractions was determined by the total amount of the metal in 45–98% (R2). In addition, TOC content had a strong, but negative impact on the Cu total content, as well as its amounts in the individual SS fractions (Figure 4). Table 6 presents estimators for significant pairs of variables, which prove their mutual influence. The amounts of TOC strongly influenced the amounts of Cu in Fr. II, III, and IV. Therefore, it can be assumed that when the TOC content increases by 1 g·kg−1, the amount of Cu in Fr. II will decrease by 0.17 mg·kg−1 (SS1), 1.15 mg·kg−1 (SS2), 1.89 mg·kg−1 (SS3), and 1.55 mg·kg−1 (SS4). In the case of fraction III, such a reduction in metal level will be as follows: by 0.15 mg·kg−1 (SS1), 0.98 mg·kg−1 (SS2), 0.60 mg·kg−1 (SS3), and 1.84 mg·kg−1 (SS4). For the amount of Cu in the residual fraction, it can be assumed that it will decrease by 0.54 mg·kg−1 (SS2), 0.53 mg·kg−1 (SS3), and 0.56 mg·kg−1 (SS4). An increase in TOC by 1 g·kg−1 can also theoretically contribute to a decrease in Cutot by 0.32 mg·kg−1 in SS2 or 0.45 mg·kg−1 in SS3. Tytła [35] also calculated Pearson’s correlation coefficients for selected parameters in the examined sewage sludge but found no significant correlations between the amount of Cu in sludge fractions and the content of organic matter.
As can be seen from the data in Table 6, the total Cu amounts influenced the amount of the metal in Fr. II and III. With an increase in Cutot by 1 mg·kg−1, the amount of Cu in Fr. II may increase by 0.29 mg·kg−1 (SS1), 0.28 mg·kg−1 (SS2), and 0.59 mg·kg−1 (SS3 and SS4), while in Fr. III an increase in Cu of 0.21 mg·kg−1 (SS1), 0.76 mg·kg−1 (SS2), 0.91 mg·kg−1 (SS3), and 0.66 mg·kg−1 (SS4) can be noted. The data presented in Figure 4 also indicate a significant relationship between the Cu amount in fraction I and the amount of the metal in the other SS fractions, which was expressed by the determination coefficient (R2) in the range from 47 to 94%.
The Zn amounts in separated SS fractions decreased in the following order: Fr. II > Fr. III > Fr. I > Fr. IV, while significantly differing between the analyzed sewage sludge (Table 7). The dominant share of Zn in fractions II and III (i.e., reducible and oxidizable complexes, e.g., bound to iron and manganese hydroxides and bound to organic matter and sulfides, respectively) was indicated by Wang et al. [4], Braga et al. [29], Karwowska and Dąbrowska [31], Zhang et al. [32], Latosińska et al. [34], and Tytła [35]. Those authors also indicated a small amount of the metal in the connections of the residual sewage sludge, with the exception of a study conducted by Latosińska et al. [34], where the lowest level of the metal was showed in fraction I. As presented in Figure 5, the Zn content varied within wide ranges, which was particularly observed for SS1 in fractions II, III, and IV, and SS2, SS3 in fractions III and IV. The Zn amounts in fractions I–III were comparable for SS1 and SS2, not significantly different. In turn, significant differences were noted between the Zn contents both in sewage sludges and their fractions. Regardless of the above, the mean amounts of the metal for SS3 (149.4 mg·kg−1) and SS4 (147.4 mg·kg−1) did not differ significantly (Table 7).
Over the years, the Zn amounts decreased in fractions of SS, which on average for SS was 1.5 times lower (Fraction II and III) and 2.5 times lower (Fraction IV). This tendency was reflected for individual SS variants, where mean contents for the fractions showed a reduction in Zn amounts by 2.0 times in SS1 and by 30 and 25% in SS3 and SS4 (Table 8).
As can be seen from the data in Figure 6, the total amount of Zn determined in 52–97% (R2) the metal amount in the separated SS fractions. The level of Zn in fraction I depended on the content in the other fractions in 53–95% (R2), and these relationships were negative. The dependences between the amount of TOC and Zn total and in the SS fraction were inversely proportional, and thus the potential direction of quantitative changes in Zn amounts in sewage sludge fractions can be assessed based on the estimators of linear regression showed in Table 6. As in the case of Cu, linear regression estimators calculated for Zn indicate significant relationships between pairs of variables. The amounts of TOC significantly reduced the Zn content in fractions II, III, and IV. Assuming an increase in TOC by 1 g·kg−1, we can conclude that the amount of the metal in fraction II will decrease by 1.11 mg·kg−1 (SS1), 1.67 mg·kg−1 (SS2), 2.94 mg·kg−1 (SS3), and 3.99 mg·kg−1 (SS4). In the case of the metal in fraction III, the values will be lower by 0.60 mg·kg−1 (SS1), 1.50 mg·kg−1 (SS2), 1.86 mg·kg−1 (SS3), and 0.44 mg·kg−1 (SS4). In turn, the Zn content in the residual fraction will be lower by 0.94 mg·kg−1 (SS2), 0.60 mg·kg−1 (SS3), and 0.42 mg·kg−1 (SS4) when the TOC amount increases by 1 g·kg−1. Such relationships between Zn in the fractions and the content of organic matter in the analyzed sewage sludge were not found by Tytła [35]. The influence of the total Zn amount on the metal level in the fractions was positive, which was particularly reflected in the case of fraction II. With an increase in Zntot by 1 mg·kg−1, we can expect an increase in the amount of the metal in fraction II by 0.75 mg·kg−1 (SS1), 0.66 mg·kg−1 (SS2), 0.45 mg·kg−1 (SS3), and 0.72 mg·kg−1 (SS4) (Table 6).
The data related to the preferential distribution of Cu and Zn in sparingly soluble connections and at the same time with a high dependence on the TOC content should be interpreted in a multifaceted approach. On the one hand, the conditions of wastewater treatment need to be considered. In this context, attention should be paid to the optional use of coagulants by wastewater treatment plants, which not only increases phosphorus removal from the wastewater, but is effective also for trace metals. As a standard practice, Fe and Al compounds (oxides, sulfate, chloride) are used, which at alkaline pH precipitate as amorphous Fe, or Al hydrated oxides or oxyhydroxides [36], constituting a good matrix for metal sorption. This phenomenon may explain the higher amounts of Zn and in Fr. II. Smaller, local sewage treatment plants very often limit the amounts of used coagulants because of high operating costs and thus automatically the potential sorption matrix for metals is smaller. In the presented study, Zn levels in Fr. II in SS3 and SS4 were significantly lower in comparison to the amounts assessed in SS1 and SS2 (Table 8). On the other hand, this is due to the biogeochemical character of metals, which was mentioned by Kabata—Pendias and Szteke [1], indicating high susceptibility to sorption, especially by organic compounds. These relationships were underlined by significant negative correlations between the TOC contents and amounts of metals in SS, as it was proved by statistical data. The fact that SS is rich in humic compounds with high sorption capacity was underlined by Jakubus et al. [37]. The quoted authors particularly emphasized the dominance of easily decomposable compounds such as fulvic acids (FAs) and water-extracted organic carbon (WEOC), which may indicate considerable SS susceptibility to microbiological degradation in soil. In the discussed context, this is important information indicating a potentially easy and quick release of previously accumulated metals, which will increase their pool of forms easily available for plants.

3.3. Risk Assessment of Metals in Sewage Sludge

To analyze the possible negative impact of heavy metals contained in sewage sludge on the soil environment, three independent, most popular indicators—the geoaccumulation index (Igeo), individual contamination factor (ICF), and risk assessment code (RAC)—were used in this study. Some parameters, such as Igeo are based on the total amount of metals, while others, such as ICF or RAC use the amount of metals present in various combinations (fractions) with the solid phase of the sewage sludge. The Igeo parameter was used as a method of calculating metal contamination degree in SS. The obtained results (Figure 7) showed that although zinc was present in larger amounts in the SS, the Igeo values were significantly lower than those calculated for Cu. The Igeo values for Cu in the 1st and 2nd year of the study for the SS ranged from 5.0 to 5.43, i.e., they indicated a very high contamination of SS with Cu. In the last year of the study, the SS samples were highly and very highly contaminated with Cu (Igeo: 4.62–4.96) (Figure 7). Regardless of the years of the study, SS1 (except for the 3rd of the study) and SS2 were highly and very highly contaminated with Zn (Igeo: 4.52–4.86). On the other hand, SS3 and SS4 were characterized by Igeo from 3.41 to 3.96, i.e., they were highly contaminated with Zn. The presented differences in the values of Cu and Zn Igeo are a consequence of changes in the total amounts of metal in the years of the study, as well as differences between individual SS samples. Latosinska et al. [34] also stated that Igeo values for analyzed SS indicated a potential high risk of Zn and Cu contamination. In turn, the Igeo values found for Cu and Zn by Nkinahamira et al. [21] or by Zhai et al. [38] were small and indicated no negative impact of heavy metals contained in sewage sludge. Yakamercan and Aygün [2] found domestic SS to be moderately contaminated by Zn and Cu, although the values for Zn were significantly higher than those for Cu. In addition, You et al. [11] assessed the contamination degree of heavy metals based on Igeo. According to these authors, Zn was a metal for which one of the highest pollution indicators was determined, i.e., the pollution level ranged from moderate to strong, whereas Cu pollution was at a medium level.
In both cases for Cu and Zn, the calculated ICF values were greater than 6 and thus indicated very high contamination of SS with these metals. Here it should be noted that the ICF values for Cu and Zn were considerably higher for SS3 and SS4 (except for Zn in the 3rd year of the study) despite the fact that lower amounts of the metals were found in fractions for these SS (Figure 7). In addition, Tytła [35] stated very high contamination of SS by Zn and Cu, which was expressed by Cu values in the range of 9.2–24.7 and by Zn values of 16.0 to 68.7.
The environmental risk caused by Cu and Zn was also assessed using the RAC parameter. This parameter has been generally applied for the evaluation of heavy metal contamination in SS. RAC shows the availability of heavy metals in SS using a percentage scale to the presence of Cu and Zn in Fraction I of SS (Table 2). The RAC values determined for Cu ranged from 1.34 to 4.40, indicating a low risk associated with the use of SS (Figure 7). Similar Cu ranges were showed by Tytła [35]. Based on the RAC values calculated for Zn (from 9.78 to 23.13), a medium risk was found. Results obtained in this study confirmed earlier reports by Latosińska et al. [34]. The cited authors due to the low share of Cu and Zn in the most mobile fraction (Fr. I) found a low or medium environmental risk. Studies by other authors also underlined different levels of Cu and Zn availability in separated fractions of sewage sludge, which directly affects the calculated RAC values. Zhang et al. [32] stated no risk for Cu, while for Zn it was a medium risk. Wang et al. [4], Nkinahamira et al. [21], Xiao et al. [26], and Tytła [35] defined a high or very high risk level for Zn to the ecosystem in the case of sewage sludge application. Simultaneously, the cited authors for Cu specified its medium risk level to the environment. According to You et al. [11], average values of RAC for Cu and Zn were 11.8 and 14.4%, respectively, indicating a medium risk, i.e., a relatively dangerous impact to the environment.
A characteristic feature of all SS was an increase in RAC for Cu and Zn in the years of the study. At the same time, SS3 and SS4 had higher values than those determined for SS1 and SS2 (Figure 7). Obviously, this is a direct reflection and connection with the amounts of metals in fraction I, which in the years of the study increased (2.0 times) as in the case of Cu (Table 5), or were at a constant, comparable level as for Zn (Table 8).

4. Conclusions

It was found that Cu and Zn showed significant similarities in fractional distribution, which results from their belonging to the chalcopyrene group of elements. The amounts of both metals were dominant in reducible (bound to iron and manganese hydroxides) and oxidizable fractions (bound to organic matter and sulfides). The research verified the hypothesis, indicating partial dependencies between the tested parameters, because the above-mentioned complexes are less mobile, and therefore less available to plants, as confirmed by the RAC values indicating a low (Cu) and medium (Zn) potential risk of the dangerous environmental impact. Despite such an assessment, other indicators used (Igeo, ICF) serve as a qualitative assessment of sewage sludge application safety showing high contamination of the tested SS with Cu and Zn. This information conflicts with applicable regulations, because according to the standards these metals did not exceed the permissible values and, in accordance with the law, they can be used for agricultural purposes. The three evaluation indices focus on three different aspects, hence leading to some interpretation discrepancies, especially when referring to the total metal content, as is used in practice to calculate the amount of metals introduced into the soil together with doses of sewage sludge. Therefore, in order to obtain comprehensive and accurate assessment results, all aspects of heavy metal presence in SS should be considered. The results presented in the study emphasize the need for a comprehensive analysis of heavy metal contents in sewage sludge, especially in the case of its use as an alternative source of nutrients and organic matter, or as a substrate for composting.

Funding

This research received no external funding.

Institutional Review Board Statement

Not applicable.

Informed Consent Statement

Not applicable.

Data Availability Statement

Not applicable.

Conflicts of Interest

The authors declare no conflict of interest.

References

  1. Kabata-Pendias, A.; Szteke, B. Trace Elements in Abiotic and Biotic Environments, 1st ed.; CRC Press: Boca Raton, FL, USA, 2015; 468p. [Google Scholar] [CrossRef]
  2. Yakamercan, E.; Aygün, A. Ecological risk assessment of domestic sewage sludge: A case study. Sigma J. Eng. Nat. Sci. 2021, 39, 422–433. [Google Scholar]
  3. Witkowska, D.; Słowik, J.; Chilicka, K. Heavy Metals and Human Health: Possible Exposure Pathways and the Competition for Protein Binding Sites. Molecules 2021, 26, 6060. [Google Scholar] [CrossRef] [PubMed]
  4. Wang, X.; Chang, V.W.-C.H.; Li, Z.; Chen, Z.; Wang, Y. Co-pyrolysis of sewage sludge and organic fractions of municipal solid waste: Synergistic effects on biochar properties and the environmental risk of heavy metals. J. Hazard. Mater. 2021, 412, 125200. [Google Scholar] [CrossRef] [PubMed]
  5. Kirchmann, H.; Börjesson, G.; Kätterer, T.; Cohen, Y. From agricultural use of sewage sludge to nutrient extraction: A soil science outlook. Ambio 2017, 46, 143–154. [Google Scholar] [CrossRef] [PubMed] [Green Version]
  6. Ziolko, D.; Martin, O.V.; Scrimshaw, M.D.; Lester, J.N. An Evaluation of Metal Removal during Wastewater Treatment: The Potential to Achieve More Stringent Final Effluent Standards. Crit. Rev. Environ. Sci. Technol. 2011, 41, 733–769. [Google Scholar] [CrossRef] [Green Version]
  7. Sylwan, I.; Thorin, E. Removal of heavy metals during primary treatment of municipal wastewater and possibilities of enhanced removal: A review. Water 2021, 13, 1121. [Google Scholar] [CrossRef]
  8. Genz, P.; Reemtsma, T. Polar micropollutants and metals in centrate from dewatered sewage sludge intended for reuse in soilless horticulture. ACS EST Water 2022, 2, 2548–2557. [Google Scholar] [CrossRef]
  9. Eurostat. Available online: https://ec.europa.eu/eurostat (accessed on 21 April 2023).
  10. Shaddel, S.; Bakhtiary-Davijany, H.; Kabbe, C.; Dadgar, F.; Østerhus, S.W. Sustainable sewage sludge management: From current practices to emerging nutrient recovery technologies. Sustainability 2019, 11, 3435. [Google Scholar] [CrossRef] [Green Version]
  11. You, M.; Hu, Y.; Van, Y.; Vao, J. Speciation characteristic and ecological risk assessment of heavy metals in municipal sludge of Huainan, China. Molecules 2021, 26, 6711. [Google Scholar] [CrossRef]
  12. Zhang, X.; Wang, X.; Wang, D. Immobilization of Heavy Metals in Sewage Sludge during Land Application Process in China: A Review. Sustainability 2020, 9, 2017. [Google Scholar] [CrossRef] [Green Version]
  13. Górecki, T.; Jakubus, M.; Krzyśko, M.; Wołyński, W. Application of Distance Covariance in Selection of Nutrients During Dynamic Process of Sewage Sludge Conditioning with Bio-preparation. Waste Biomass. Valori. 2020, 11, 4157–4166. [Google Scholar] [CrossRef] [Green Version]
  14. Jakubus, M.; Graczyk, M. Microelement variability in plants as an effect of sewage sludge compost application assessed by different statistical methods. Agronomy 2020, 10, 642. [Google Scholar] [CrossRef]
  15. Jakubus, M.; Bakinowska, E. Visualization of long-time quantitative changes of microelements in soils amended with sewage sludge compost evaluated with two extraction solutions. Commun. Soil Sci. Plant 2018, 49, 1355–1369. [Google Scholar] [CrossRef]
  16. Sharma, B.; Sarkar, A.; Singh, P.; Singh, R.P. Agricultural utilization of biosolids: A review on potential effects on soil and plant grown. Waste Manag. 2017, 64, 117–132. [Google Scholar] [CrossRef]
  17. Directive 86/278/EEC on the Protection of the Environment, and in Particular of the Soil, when Sewage Sludge Is Used in Agriculture. Available online: https://eur-lex.europa.eu/legal-content/EN/ALL/?uri=CELEX%3A31986L0278 (accessed on 21 April 2023).
  18. Collivignarelli, M.C.; Abbà, A.; Frattarola, A.; Miino, M.C.; Padovani, S. Legislation for the Reuse of Biosolids on Agricultural Land in Europe: Overview. Sustainability 2019, 11, 6015. [Google Scholar] [CrossRef] [Green Version]
  19. Ordinance of Ministry of Environment on Sewage Sludge. Journal of Laws of 2015, Item 257. Available online: https://isap.sejm.gov.pl/isap.nsf/download.xsp/WDU20230000023/O/D20230023.pdf (accessed on 21 April 2023).
  20. Central Statistical Office. Available online: https://stat.gov.pl (accessed on 21 April 2023).
  21. Nkinahamira, F.; Suanon, F.; Chi, Q.; Li, Y.; Feng, M.; Huang, X.; Yu, C.-P.; Sun, Q. Occurrence, geochemical fractionation and environmental risk assessement of major and trace elements in sewage sludge. J. Environ. Manag. 2019, 249, 109427. [Google Scholar] [CrossRef] [PubMed]
  22. Jakubus, M. Changes in lead and chromium contents in sewage sludge evaluated using both single extractants and sequential method. Environ. Pollut. Bioavail. 2020, 32, 87–99. [Google Scholar] [CrossRef]
  23. Jakubus, M. Distribution of oxyphilic elements in sewage sludge fractions based on manganese and nickel. Ecol. Eng. J. 2021, 22, 72–82. [Google Scholar] [CrossRef]
  24. ISO 11466: 1995; Soil quality—Extraction of Trace Elements Soluble in Aqua Regia. International Organization for Standardization: Genève, Switzerland, 1995.
  25. Mossop, K.F.; Davidson, C.M. Comparison of original and modified BCR sequential extraction procedures for the fractionation of copper, iron, lead, manganese and zinc in soils and sediments. Anal. Chim. Acta 2003, 478, 111–118. [Google Scholar] [CrossRef] [Green Version]
  26. Xiao, Z.; Yuan, X.; Leng, L.; Jiang, L.; Chen, X.; Zhibin, W.; Xin, P.; Jiachao, Z.; Zeng, G. Risk assessment of heavy metals from combustion of pelletized municipal sewage sludge. Environ. Sci. Pollut. Res. 2016, 23, 3934–3942. [Google Scholar] [CrossRef]
  27. Czarnowska, K. Total content of heavy metals in parent rocks as reference background levels of soils. Soil Sci. Ann. 1996, XLVII, 43–50. [Google Scholar]
  28. Yang, T.; Huang, H.; Lai, F. Pollution hazards of heavy metals in sewage sludge from four wastewater treatment plants in Nanchang, China. Trans. Nonferrous Met. Soc. China 2017, 27, 2249–2259. [Google Scholar] [CrossRef]
  29. Braga, A.F.M.; Zaiat, M.; Silva, G.H.R.; Fermoso, F.G. Metal fractionation in sludge from sewage UASB treatment. J. Environ. Manag. 2017, 193, 98–107. [Google Scholar] [CrossRef] [Green Version]
  30. Shaheen, S.M.; Shams, M.S.; Ibrahim, S.M.; Elbehiry, F.A.; Antoniadis, V.; Hooda, P.S. Stabilization of sewage sludge by using various by-products: Effects on soil properties, biomass production, and bioavailability of copper and zinc. Water Air Soil Pollut. 2014, 225, 2014. [Google Scholar] [CrossRef]
  31. Karwowska, B.; Dąbrowska, L. Bioavailability of heavy metals in the municipal sewage sludge. Ecol. Chem. Eng. A 2017, 24, 75–86. [Google Scholar]
  32. Zhang, J.; Tian, Y.; Zhang, J.; Li, N.; Kong, L.; Yu, M.; Zuo, W. Distribution and risk assessment of heavy metals in sewage sludge after ozonation. Environ. Sci. Pollut. Res. 2017, 24, 5118–5125. [Google Scholar] [CrossRef]
  33. USEPA. A Guide to the Biosolids Risk Assessment for EPA Part 503 Rule, EU Environmental Office of Wastewater Management, United STATES, 1995, EPA 832-B-93-005. Available online: https://www.epa.gov/biosolids/guide-biosolids-risk-assessments-epa-part-503-rule (accessed on 21 April 2023).
  34. Latosińska, J.; Kowalik, R.; Gawdzik, J. Risk assessemnt of soil contamination with heavy metals from municipal sewage sludge. Appl. Sci. 2021, 11, 548. [Google Scholar] [CrossRef]
  35. Tytła, M. Assessment of Heavy Metal Pollution and Potential Ecological Risk in Sewage Sludge from Municipal Wastewater Treatment Plant Located in the Most Industrialized Region in Poland—Case Study. Int. J. Environ. Res. Public Health 2019, 16, 2430. [Google Scholar] [CrossRef] [Green Version]
  36. Contin, M.; Malev, O.; Izosimova, A.; De Nobili, M. Flocculation of sewage sludge with FeCl3 modifies the bioavailability of potentially toxic elements when added to different soils. Ecol. Eng. 2015, 81, 278–288. [Google Scholar] [CrossRef]
  37. Jakubus, M.; Bakinowska, E.; Tobiasova, E. Valorisation of sewage sludge humic compounds in the aspect of its application in natural environment. Environ. Prot. Eng. 2021, 47, 67–83. [Google Scholar] [CrossRef]
  38. Zhai, Y.; Chen, H.; Xu, B.; Xiang, B.; Chen, Z.; Li, C.; Zeng, G. Influence of sewage sludge–based activated carbon and temperature on the liquid-fraction of sewage sludge: Yield and composition of bio-oil, immobilization and risk assessment of heavy metals. Bioresour. Technol. 2014, 159, 72–79. [Google Scholar] [CrossRef] [PubMed]
Figure 1. Locations of WWTPs in the study area.
Sustainability 15 12087 g001
Figure 2. Total contents of Cu and Zn regardless of years of the study.
Sustainability 15 12087 g002
Figure 3. Cu amounts in individual fractions of sewage sludge regardless of year of the study.
Sustainability 15 12087 g003
Figure 4. Heat maps for Pearson’s correlation coefficient between Cutot, Cu in fractions and TOC for sewage sludge 1–4. Significance: ** 0.01, * 0.05, n.s.—not significant.
Sustainability 15 12087 g004
Figure 5. Zn amounts in individual fractions of sewage sludge regardless of year of the study.
Sustainability 15 12087 g005
Figure 6. Heat maps for Pearson’s correlation coefficients between Zntot, Zn in fractions, and TOC for sewage sludge 1–4. Significance: ** 0.01, n.s.—not significant.
Sustainability 15 12087 g006
Figure 7. Changes of Igeo, ICF, and RAC values for sewage sludge in relation to metal and year of the study.
Sustainability 15 12087 g007
Table 1. Basic parameters of WWTPs, from which sewage sludge samples were collected, after [22].
Sewage SludgeENIAverage Capacity—Q (m3/d)Approximate Mass of Generated Sewage Sludge (t/Year)
SS11,200,000200,00017,000
SS2350,00060003500
SS351,5006000730
SS428,5006000550
Table 2. Indices used in the study.
IndicesEquationValue Ranges with a Description
geoaccumulation index (Igeo)
[26]
Igeo = log2 ( C n 1.5 B n )
Cn-amount of metal in SS
Bn-geochemiocal background value in soil: for Cu = 7.1 mg·kg−1; for Zn = 30 mg·kg−1 [27]
Igeo < 0—no pollution
0 < Igeo < 1—no to moderate pollution
1 < Igeo < 2—moderate pollution
2 < Igeo < 3—moderate to high pollution
3 < Igeo < 4—high pollution
4 < Igeo < 5—high to very high pollution
Igeo > 5—very high pollution
individual contamination factor (ICF) [23]ICF = F r . I   +   F r . I I   +   F r . I I I F r . I V ICF < 1—low contamination (LC)
1 < ICF < 3—moderate contamination (MC)
3 < ICF < 6—considerable contamination (CC)
ICF > 6—very high contamination (VHC)
risk assessment code (RAC)
[28]
RAC = F r . I t o t a l   c o n t e n t ·100%RAC < 1%—no risk (safe to the environment)
RAC 1–10%—low risk (relatively safe to the environment)
RAC 11–30%—medium risk (relatively dangerous to the environment)
RAC 31–50%—high risk (dangerous to the environment)
Table 4. Copper contents in individual fractions of sewage sludge as a mean for the years of the study (mg·kg−1).
FractionSS1SS2SS3SS4Mean for Fraction
I6.48.39.68.88.2 d *
II172.4149.4170.5166.4164.7 b
III183.0172.6169.7160.9171.5 a
IV27.728.323.623.725.8 c
LSD for BxC = 3.359
Mean for SS97.4 a *89.7 c93.3 b89.9 c
* Homogeneous groups of tested variables are indicated by the same lowercase letters.
Table 5. Mean copper contents for sewage sludge and its fractions depending on the years of the study (mg·kg−1).
Years of StudyFractions (Mean for SS)
IIIIIIIV
1st6.1165.9183.335.1
2nd7.4184.4192.025.5
3rd11.2143.7139.316.8
Sewage sludge (mean for fractions)
SS1SS2SS3SS4
1st108.691.893.596.7
2nd102.498.9102.7105.3
3rd81.278.383.867.7
LSD = 2.643
Table 6. Estimators of the linear regression parameter for pairs of variables.
Metal/Sewage SludgeYXβ0β1
Cu/SS1Fr. IICutot73.810.29
Fr. IITOC227.08−0.17
Fr. IIITOC199.75−0.15
Fr. IIICutot94.790.21
Cu/SS2CutotTOC446.71−0.32
Fr. IITOC531.69−1.15
Fr. IICutot48.800.28
Fr. IIITOC499.49−0.98
Fr. IIICutot101.570.76
Fr. IVTOC208.45−0.54
Cu/SS3CutotTOC576.69−0.45
Fr. IITOC964.17−1.89
Fr. IICutot36.710.59
Fr. IIITOC80.34−0.60
Fr. IIICutot143.420.91
Fr. IVTOC249.62−0.53
Cu/SS4Fr. IITOC795.59−1.55
Fr. IICutot30.170.59
Fr. IIITOC919.48−1.84
Fr. IIICutot47.780.66
Fr. IVTOC253.0−0.56
Zn/SS1Fr. IIZntot53.260.75
Fr. IITOC1109.1−1.11
Fr. IIITOC190.28−0.60
Zn/SS2Fr. ITOC9.29−0.38
Fr. IITOC1299.6−1.67
Fr. IIZntot21.120.66
Fr. IIITOC662.53−1.50
Fr. IIIZntot463.660.57
Fr. IVTOC352.24−0.94
Zn/SS3Fr. IITOC1609.6−2.94
Fr. IIZntot138.840.40
Fr. IIITOC903.57−1.86
Fr. IIIZntot93.900.36
Fr. IVTOC274.31−0.60
Zn/SS4Fr. IITOC2003.8−3.99
Fr. IIZntot47.130.72
Fr. IIITOC282.26−0.44
Fr. IVTOC193.07−0.42
Table 7. Zinc contents in individual fractions of sewage sludge as means for the years of the study (mg·kg−1).
FractionSS1SS2SS3SS4Mean for Fraction
I137.0136.376.990.5110.2 c *
II754.6741.5375.5370.9560.6 a
III171.9163.0121.0104.9140.2 b
IV52.439.924.123.334.9 d
LSD for BxC = 7.310
Mean for SS279.0 a *270.2 b149.4 c147.4 c
* Homogeneous groups of tested variables are indicated by the same lowercase letters.
Table 8. Mean zinc contents for sewage sludge and its fractions depending on the years of the study (mg·kg−1).
Years of StudyFractions (Mean for SS)
IIIIIIIV
1st119.4622.8159.846.6
2nd93.7624.1159.439.3
3rd117.5435.0101.419.0
Sewage sludge (mean for fractions)
SS1SS2SS3SS4
1st333.93270.19175.9168.6
2nd330.57288.1148.9148.9
3rd172.37252.28123.4124.9
LSD = 5.752
Disclaimer/Publisher’s Note: The statements, opinions and data contained in all publications are solely those of the individual author(s) and contributor(s) and not of MDPI and/or the editor(s). MDPI and/or the editor(s) disclaim responsibility for any injury to people or property resulting from any ideas, methods, instructions or products referred to in the content.

