Article

Low-Carbon Manufacturing or Not? Equilibrium Decisions for Capital-Constrained News Vendors with Subsidy and Carbon Tax

1
School of Management, Xi’an Polytechnic University, Xi’an 710048, China
2
School of Management, Xi’an Jiaotong University, Xi’an 710049, China
3
School of Information, Xi’an University of Finance and Economics, Xi’an 710100, China
4
Business School, Hunan University, Changsha 410082, China
*
Authors to whom correspondence should be addressed.
Sustainability 2023, 15(15), 11779; https://doi.org/10.3390/su151511779
Submission received: 5 June 2023 / Revised: 25 July 2023 / Accepted: 26 July 2023 / Published: 31 July 2023
(This article belongs to the Special Issue Advanced Research in Green Supply Chain Management)

Abstract

:
At a time when low-carbon life has become an important global issue, the decarbonization of manufacturing enterprises cannot be delayed in the face of the government’s green policy and other objective conditions. Under these circumstances, how to arrange the production plan before and after the implication of low-carbon policies is an urgent issue to be settled, especially for the capital-constrained news vendors. To address these problems, this paper firstly builds a stylized supply chain model consisting of two different types of manufacturers (i.e., low-carbon type and traditional type) with capital constraints, then obtains equilibrium production and business strategies resorting to Stackelberg game theory, and lastly conducts an analysis of how the key factors affect manufacturers’ green transition decisions under different scenarios of carbon policy. With the study’s structure, some interesting and important results and managerial insights are derived. For example, but not limited to, it is found that: (i) compared with traditional products, the price fluctuation of low-carbon products is greater than that of traditional products with the increase in consumers’ low-carbon awareness. And consumers have more tolerance for price increases for low-carbon products. (ii) When producing low-carbon products is cost-effective, it is a wise choice to produce more low-carbon products. When producing low-carbon items is costly, producing more low-carbon products is still a dominant strategy until the expenditure difference between low-carbon and traditional ones exceeds a certain threshold. (iii) When the expenditure on low-carbon production is moderate, the manufacturer first prefers the traditional strategy, then the low-carbon one, with an increase in consumers’ low-carbon awareness. When the expenditure on low-carbon production stays at a low or high level, the low-carbon strategy always dominates the traditional one with a certain condition satisfied. This study can enrich the theory of green supply chain management and provide decision support for enterprise managers in the green transition.

1. Introduction

With the increasing awareness of environmental protection worldwide, low-carbon production has become an inevitable trend. In the automotive industry, Yutong Bus Co., Ltd. and State Electricity Investment Hydrogen Energy Company jointly developed 30 hydrogen fuel cell vehicles for the Beijing Winter Olympics by using zero-emission, long-range, and highly convenient hydrogen energy. The UK has spent GBP 91 million on developing low-carbon vehicle technologies, including fast charging, “zero-emission” engines, and autonomous driving. China Power Construction Group has also implemented innovative measures to reduce carbon emissions in transportation and production. The textile and apparel industry (IEA), also known as the second largest source of pollution in terms of people’s lives, is also on the agenda for low-carbon issues. The European Commission, for example, has proposed the EU Sustainable and Recycled Textiles Strategy to redefine the sustainability of textile products, starting from the eco-design link at the forefront of the value chain. In China, countless textile enterprises have embarked on the path of research and development of new technologies under the encouragement of their policies. Innovative technologies such as waterless dyeing technology that can significantly reduce water pollution, recycled fibers made from used plastic bottles and waste clothing, and carbon fiber materials with excellent performance are leading the textile industry to enter a new stage of green and low-carbon development. It can be said that the concept of green development has been deeply rooted in people’s hearts and minds and has been ingrained into various aspects of people’s lives, such as “food, clothing, housing and transportation”.
According to statistics, compared with 2020, the green and low-carbon transformation and upgrading index of the manufacturing industry increased by 7% in 2021. However, in low-carbon manufacturing, green technology development and the use of environmentally friendly materials can lead to a high production cost, which makes the manufacturing cost of low-carbon products higher than that of traditional products [1]. This could directly discourage traditional manufacturers from making the low-carbon transition. For example, ExxonMobil, the world’s largest non-government oil and gas producer in the United States, insisted on traditional production and rejected a low-carbon transition because of the high cost of low-carbon manufacturing. After losing $2.4 billion in nine months and its stock price falling by about 35%, they eventually found the necessity of a low-carbon transition at a heavy cost. In the process of low-carbon green globalization, to further encourage enterprises with a wait-and-see attitude to engage in low-carbon manufacturing, the government has taken two main measures. (1) Subsidies. State and Trends of Carbon Pricing 2020, published online by the World Bank Group, saw a total of USD 45 billion mobilized worldwide through carbon pricing mechanisms in 2019, with nearly half of that amount going to environmental or broader development projects, more than 40% of the revenues going to the general budget, and the remainder going to tax cuts and direct funding and subsidies to sectors that are directly related to carbon emission reductions, such as energy, industry, and transportation. In March 2022, the government of Xuhui District in Shanghai developed and implemented measures to encourage industries to save energy and reduce carbon emissions. For enterprises with significant carbon reductions, the government will give a subsidy of CNY 1200 per ton of standard coal according to the annual energy savings achieved by the project. (2) Carbon tax. According to a study by the World Bank organization, carbon taxes directly set the price of carbon by defining tax rates on greenhouse gas emissions or, more commonly, the carbon content of fossil fuels. For a long time, China has levied resource taxes on fossil energy sources such as crude oil, natural gas, and coal; consumption taxes on refined oil products; environmental protection taxes on air pollutants and other pollutants; and vehicle purchase taxes on small cars and other vehicles. This has played an important role in reducing carbon emissions and promoting low-carbon development. As of May 2021, a total of 64 carbon pricing mechanisms have been implemented in 27 countries worldwide, 35 of which are carbon tax policies. In August 2021, China’s Development Research Center of the State Council pointed out that it is of significance to regulate carbon emissions using the carbon tax tool, especially for high-carbon enterprises. In this case, the high cost of low-carbon manufacturing can be mitigated by subsidies, while the low cost of traditional production can be aggravated by carbon tax penalties. Therefore, whether it is more beneficial to choose low-carbon manufacturing or to maintain traditional manufacturing in the presence of government subsidies and a carbon tax is an urgent issue to be addressed.
In addition to the government’s reward and punishment mechanisms, financial constraints are also important factors influencing the choice of production modes. From the perspective of ease of financing, low-carbon enterprises with financial constraints are more likely to obtain external financial support due to the guiding role of national policies. For instance, in 2021, the combined size of the green loan balances of the 18 A-share listed banks exceeded CNY 11 trillion, and each bank achieved different degrees of growth in green loans compared to the previous year. From the perspective of financing rates, the financing interest rate of low-carbon manufacturers is usually lower than that of traditional ones. This can compensate for the high cost of low-carbon production to a certain extent. However, under the consideration of government subsidies and carbon taxes, it is uncertain whether the difference in interest rates between low-carbon and traditional manufacturing will be sufficient to incentivize manufacturers to engage in low-carbon manufacturing.
Based on the aforementioned argument, this paper is dedicated to discussing the following two research questions in detail: (1) In the presence of government subsidies and carbon taxes, should manufacturers choose a low-carbon transition or maintain traditional manufacturing? (2) What is the impact of key parameters such as consumers’ low-carbon awareness (LCA) and financing rates on manufacturers’ choices of production modes? To address the above questions, this paper considers a supply chain consisting of one low-carbon manufacturer and one traditional manufacturer, both of which are capital-constrained in the presence of subsidies and carbon taxes issued by the government. With this research feature, some interesting and important results and managerial insights are derived.
Firstly, from the perspective of consumers, both the price of low-carbon and traditional products first increases and then decreases in the consumers’ low-carbon awareness (LCA). Compared to traditional products, if consumers show greater responsibility for protecting the environment when purchasing products, i.e., if they are more environmentally conscious, then they are more likely to accept the price of low-carbon labeled products being higher than that of traditional goods [2,3,4,5]. Compared with traditional products, consumers have a greater tolerance for price increases for low-carbon products. Secondly, the quantity comparisons between low-carbon products and traditional ones are closely related to their production expenditures. It is a wise choice to produce more low-carbon products when producing low-carbon products is cost-effective. Otherwise, producing more low-carbon products is still a dominant strategy until the expenditure difference between low-carbon and traditional ones exceeds a certain threshold. Thirdly, the manufacturer’s low-carbon production strategy is closely related to the production cost and the LCA. When the expenditure on low-carbon production is moderate, the manufacturer first prefers the traditional strategy and then the low-carbon one in LCA. When the expenditure on low-carbon production is low or high, the low-carbon strategy always dominates the traditional one with a certain expression of satisfaction. Finally, social welfare can be maximized both by the subsidy and carbon tax mechanisms, and the difference is that the latter one can ensure much more effective welfare.
The other components of the paper are as follows: Section 2 presents the literature review. Section 3 gives the model description and assumptions. Section 4 analyzes the equilibrium decisions of different models. The sensitivity analysis is conducted in Section 5. Research conclusions and managerial insights are summarized in Section 6. For brevity, all proofs of the results are collected in Appendix A.

2. Literature Review

Our research in this paper focuses on whether financially constrained manufacturers choose a low-carbon transition under the influence of government environmental policies and the operational decision-making strategies of manufacturers under different manufacturing and financing models. This paper mainly reviews three streams of literature that are closely related to our study: low-carbon supply chains (low-carbon manufacturing), capital-constrained supply chains, and governmental low-carbon policy.

2.1. Low-Carbon Supply Chains

Most of the studies in this stream take low-carbon supply chains as a background and then add some specific conditions for decision-making. Meng et al. [6] studied the choice of low-carbon products from the perspective of power structure. They found that two competing enterprises adopt the same product strategy in a Nash pricing game regardless of the carbon tax rate, and they also found that differentiated product strategies are used in a Stackelberg pricing game with a low-carbon tax rate. Deng et al. [7] studied low-carbon manufacturing from the perspective of carbon utilization efficiency and provided suggestions for improving carbon utilization efficiency. Wang et al. [8] studied the decision-making in retailer-led low-carbon supply chains under altruistic preferences. They found that altruistic preference can improve the profit and system efficiency of small and medium-sized manufacturers, but it can reduce the profit of retailers. In contrast, Lin et al. [9] studied the problems from the perspective of retailers’ social preferences. They found that higher social preference among retailers not only always benefits carbon reduction and manufacturers but also helps to maintain the stability of the supply chain system. Heydari et al. [10] studied channel coordination and pricing in green supply chains under the environmental awareness of consumers. Similarly, Zhang et al. [11] explored the choice of products produced by traditional manufacturers and found that the manufacturer’s optimal product choice is related to the investment value and unit production cost of green products. Gao and Souza [12] examined firms’ purchasing decisions when considering consumers’ low-carbon awareness and product carbon footprints. Based on aggregate control and transaction control, some scholars also studied the impact of waste products on carbon emission reduction in closed-loop supply chains [13], the production decision-making of manufacturing [14], and the retail mode selection problem of e-retailers in supply chains [15], respectively. The above literature has studied low-carbon (green) supply chains from different perspectives, such as power structure, social preference, and consumer environmental awareness, with the assumption of no capital constraint. Further, the existing research also studies the enterprise structure, business model, corporate social responsibility, and some other different aspects of the impact of low-carbon policies on the operational decision-making role of enterprises, respectively. However, it is not difficult to find that some topics need to be further explored and deeply dug into in the current research. As the actual object of low-carbon policy is not detailed, a large number of studies have only roughly studied the impact of low-carbon policy on enterprises. Several studies have not paid enough attention to the issue of capital constraints, which results in the study conclusion lacking specific practical application value. Firstly, according to the survey conducted by the China Bureau of Statistics, it was found that the number of small, medium, and microenterprise units in China in 2022 accounted for 99.8% of all large-scale enterprise units. These data indicate that these enterprises are an important part of China’s economy, but there are very few studies that take them as the main body of research. Secondly, in the face of the current unpredictable international situation, the economic situation is not clear. Therefore, the research value of the capital-constraint scenario needs to be further studied and deeply dug into. The purpose of this paper is to study the operational decisions of capital-constrained enterprises in low-carbon supply chains with more practical significance, which will be combined with the previous research to obtain richer conclusions.

2.2. Capital-Constrained Supply Chain

Regarding the issue of capital constraints, there are two streams involved. Firstly, several scholars study the operational decisions for a capital-constrained supply chain [16,17,18,19,20]. For example, Wang et al. [21] investigated manufacturers’ production decision-making (general product or low-carbon remanufactured product) and carbon permit buy-back strategies under financial constraint. They found that for capital-constrained manufacturers, adopting a carbon permit buy-back strategy can help promote the production of low-carbon remanufactured products. Cao et al. [22] and Cao and Yu [23] analyzed the financing behavior of retailers in a carbon-dependent supply chain consisting of a single supplier and a single capital-constrained retailer.
Another stream mainly pays attention to the issue of choosing a financing strategy [24,25,26,27,28]. For example, Zhang et al. [29] investigated three different financing strategies for capital-constrained manufacturers in a closed-loop supply chain based on a benchmark model without financing. Xia et al. [30] constructed three financing models to analyze the effects of market competition intensity and consumer low-carbon preferences on equilibrium decisions and firm profit and then found the optimal financing strategy through comparative analysis. Cong et al. [31] investigated the issue of optimal green financing strategies for capital-constrained suppliers and manufacturers based on a cap-and-trade mechanism with uncertain revenue. They found that external green financing can enhance the positive impact of the cap-and-trade mechanism on manufacturers with low or medium carbon emission levels. Qin et al. [32] examined the value of prepayment financing for supply chain carbon reduction and production by developing two different financing models (prepayment financing and blended financing), which can help manufacturers and retailers develop financing strategies in times of financial constraints. The above literature has mainly studied the financing strategy of low-carbon capital-constrained supply chains and focused on the comparison of mixed, internal, and external financing strategies, but ignored the regulating role of the government in capital-constrained low-carbon supply chains and low-carbon policy options for firm-specific operational decisions. Therefore, based on previous studies, this paper introduces the government’s low-carbon policy to the capital-constrained supply chain, conducts the model analysis, and examines the optimal production strategy. Thus, the strategic choice of whether or not to make a green transition for a financially constrained manufacturer is obtained, making the decision-making results clearer as well as more rigorous.

2.3. Governmental Low-Carbon Policy

Government incentives and penalties for a low-carbon green economy are broadly divided into two types: carbon subsidies and carbon taxes. Shao et al. [33] have conducted comparisons and analysis of government subsidy schemes based on different market structures. Bao et al. [34] made optimal decisions and conducted a comparative analysis of three game strategies: non-cooperative game, cooperative game, and cost-sharing contract under supply chain coordination, considering consumers’ low-carbon preferences and government subsidies. Bai et al. [35] examined the role of government subsidies in consumer trade-ins of used products. They found that a sharing subsidy program in which government subsidies are proportional to manufacturer’s rebates is more effective than a fixed-amount subsidy in encouraging consumer trade-ins. Some other studies pay attention to the carbon tax policy. Luo et al. [36] developed four methods to evaluate the impact of carbon tax policy on manufacturing and remanufacturing decisions in a closed-loop supply chain consisting of manufacturers and retailers. They suggested that policymakers should tailor carbon tax policies to different industries to promote remanufacturing. Bai et al. [37] studied the issue of manufacturers’ investment in sustainable technology under carbon tax mechanisms. Sun and Yang [38] comparatively analyzed the issue of cap-and-trade and carbon tax policies on carbon reduction for two competing manufacturers. Fan et al. [39] studied the impact of the cap-and-trade policy (quantity commitment) and the carbon tax policy (price commitment) on a firm’s technology investment and production decisions. The above literature is unilaterally studied from the perspective of carbon subsidies or carbon taxes. Although Xia and Xu [40] and Bian and Zhao [41] comparatively study the impact of carbon tax and subsidy policies on low-carbon supply chains, there is only one low-carbon manufacturer in their model assumptions. However, they do not take into account the actual situation of the current market, i.e., the coexistence of green transformation enterprises and traditional-type enterprises. Relatively speaking, it lacks research on the impact of low-carbon policies on the operational decision-making of enterprises when the two types of enterprises coexist in a realistic scenario. Taking this into consideration, this paper makes different assumptions about the two types of manufacturers and draws research conclusions from a comprehensive research comparison. This conclusion can provide direction for the transformation and development of existing traditional manufacturers.
The aforementioned studies take one or more governmental low-carbon policies into account. However, in reality, besides governmental low-carbon policy, the capital shortage of the manufacturer can also affect the newsvendor’s production strategy, especially the one with a wait-and-see attitude towards low-carbon production. Motivated by but unlike the above literature, this paper considers a low-carbon supply chain consisting of two kinds of competing manufacturers (one low-carbon type and one traditional type) under government subsidy and carbon tax. We discuss and select the optimal production strategy for a low-carbon supply chain with capital constraints. With this research feature, the main conclusion can provide a helpful reference for the government to formulate low-carbon policies and beneficial suggestions for enterprises to make reasonable production decisions. For the ease of the reader, this paper summarizes the main differences between our studies and the relevant work in Table 1.

3. Model Description

This section describes the model framework, demand setting, and sequence of the event.

3.1. Model Framework
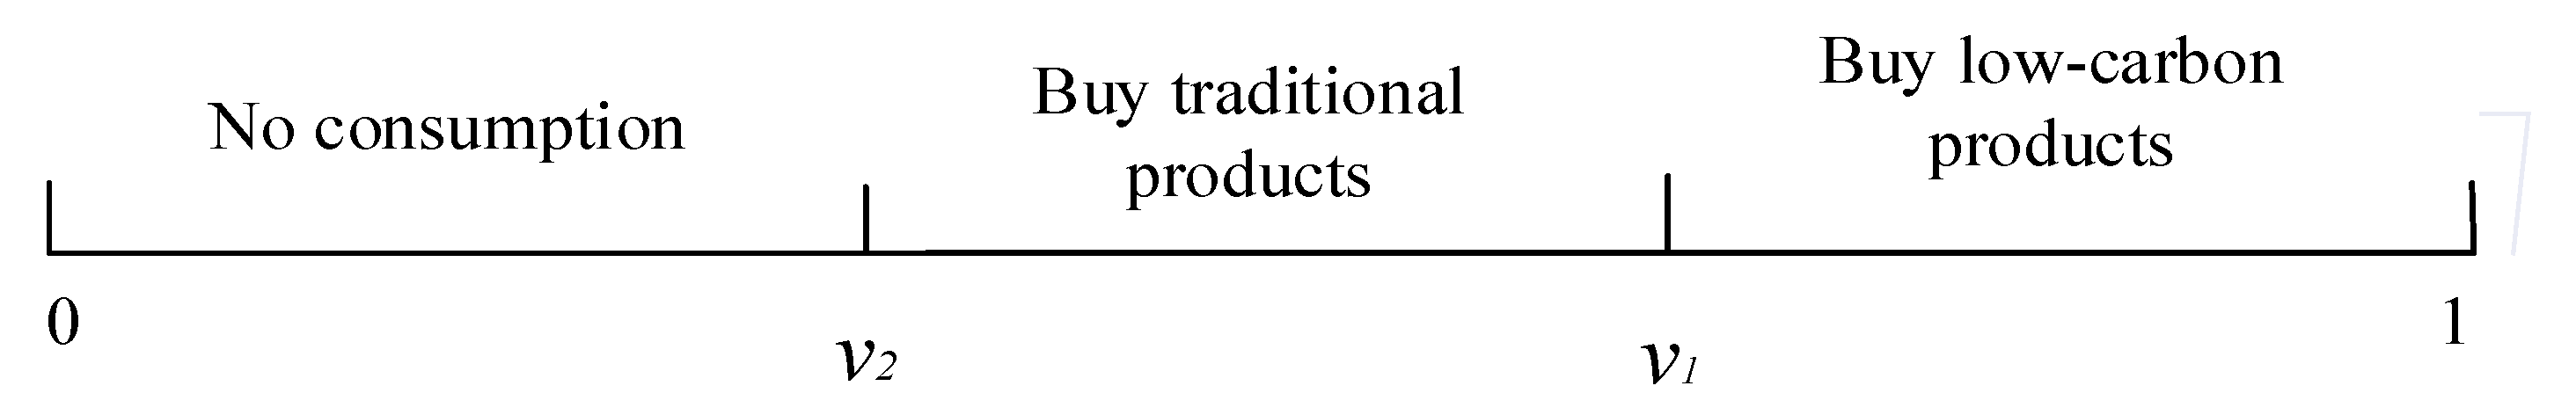
To address the aforementioned problems in Section 1, this paper builds a stylized supply chain model consisting of two different types of manufacturers with capital constraints, i.e., the low-carbon manufacturer (denoted as L-type) and the traditional one (denoted as T-type). Each manufacturer produces only its corresponding type of product. That is to say, the low-carbon manufacturer produces low-carbon products, and the traditional manufacturer produces traditional products. Firstly, it is assumed that these two kinds of products are produced with unit production costs of c l and c t and sold at prices of p l and p t [42], respectively. And c l > c t is satisfied since c l includes the cost of improving green technology to produce low-carbon products. To achieve carbon peaking and carbon neutrality, the government subsidizes α for each unit of low-carbon products and collects a carbon tax β on each unit of traditional products.
Secondly, it is assumed that both of the two capital-constrained manufacturers can obtain bank credit. The difference is that the L-type manufacturer could enjoy green credit financing with an interest rate r l and the T-type one bears ordinary bank credit financing with r t , while r l is no higher than r t . This assumption can be justified by the following observation: According to the benchmark CNY legal lending rate for financial institutions in the China Statistical Yearbook 2021, the interest rate for bank loans is set at around 4.5%, while the interest rate for green loans is usually lower than other types of loans and generally ranges from 3.6% to 3.8%. Therefore, it is reasonable to assume that r l r t . In this case, before the selling period, the capital-constrained L-type and T-type manufacturers borrow the amounts of funds c l q l and c t q t from the bank to operate their businesses. At the end of the selling period, the manufacturer repays the principal and interest according to the green credit rate r l or the ordinary financing credit rate r t declared by the bank.

3.2. Demand Setting

To derive the demand functions for the low-carbon product and the traditional product, we need to analyze consumers’ purchases by comparing their utility. Scholars often use utility theory to study consumer behavior. This utility function has been widely used in the literature supply chain management [43,44,45,46]. Consumer utility refers to the satisfaction a buyer receives from a product or service, and it is a subjective evaluation within the consumer’s mind. Considering that the heterogeneity in consumers’ valuation of different products can in turn affect their desire to obtain low-carbon or traditional products, the valuation of consumers’ service provided by the product is denoted by v . Also, for computational convenience, we assume that the consumers’ valuation of the product follows a uniform distribution over the interval of [0, 1]. Consumers are assumed to be risk-neutral and to decide which manufacturer’s product to purchase based on the perceived magnitude of utility. The difference between low-carbon products and traditional products is that low-carbon products can bring additional green utility to consumers. The difference between low-carbon products and traditional products is not only in production costs, financing rates, and selling prices; low-carbon products can also bring additional green utility to low-carbon-conscious consumers. The consumer’s low-carbon awareness (LCA) is denoted by θ . According to the study of Shao et al. [33], consumers can obtain the utility of v and ( 1 + θ ) v by purchasing the traditional product and the low-carbon product, in which v denotes the basic functional utility obtained from the low-carbon product as the traditional product and θ v denotes the low-carbon product’s green utility.
Consumers have three choices in the market: to buy the low-carbon product, the traditional product, or nothing. Therefore, the utility received from buying the low-carbon product, the traditional product, and nothing is denoted as u l = ( 1 + θ ) v p l , u t = v p t , and u n = 0 , respectively.
In terms of consumer utility, solving u l = u t yields the indifference point v 1 = p l p t θ between buying low-carbon products and traditional products (see Figure 1). Similarly, solving u t = u n yields the location point v 2 = p t between buying traditional products and no consumption. Thus, it can be found that consumers’ demand functions for low-carbon products and traditional products are characterized as q l = 1 v 1 = 1 p l p t θ and q t = v 1 v 2 = p l p t θ p t , respectively.
Some important symbols involved in the model of this paper are organized as follows: y i denotes the y indicator in case i , where y = c , r   , q , p , u , π , w , respectively, denote the production cost per unit product, bank loan interest rate, production volume (demand), price, consumer’s utility, manufacturer’s profit, and social welfare, and i = l ,   t denote the low-carbon model and the traditional model. Finally, the equilibrium value is denoted by .

3.3. Sequence of the Event

At the time of market entry, each consumer has his or her own sense of consumption and valuation of different products. In the paper, the supply chain system is set up with two manufacturers and the government, with the government occupying a higher leadership role than the manufacturers in the whole supply chain and the manufacturers acting as followers. The Stackelberg game is then played in the market, where the government is the leader. The government considers the profit maximization of the manufacturers and sets the subsidy per unit of the low-carbon product and the tax payable per unit of the traditional product in order to maximize social welfare. The manufacturers, as followers, decide the optimal retail price and production quantity based on the subsidy or tax. Finally, according to the principle of maximum utility, different types of consumers choose to buy low-carbon products, traditional products, or remain unpurchased.

4. Model Analysis

4.1. Equilibrium Decisions

By modeling a manufacturer’s market with two different types of manufacturers who also face financial constraints. The L-type manufacturer offers low-carbon products, while the T-type manufacturer offers traditional products on the market. The profit functions for low-carbon and traditional manufacturers are formulated as   π l = ( p l c l + α ) q l c l r l q l and π t = ( p t c t β ) q t c t r t q t . Based on the inverse solution method, the optimal quantity of low-carbon products produced by L-type manufacturers is   q l = ( θ + 1 ) ( 2 θ + c t + β + c t r t ) ( 2 θ + 1 ) ( c l α + c l r l ) θ ( 4 θ + 3 ) , and the optimal selling price of low-carbon products is p l = ( θ + 1 ) [ 2 ( θ + c l α + c l r l ) + c t + β + c t r t ] 4 θ + 3 . The optimal quantity of products produced by T-type manufacturers is q t = ( θ + 1 ) [ θ + c l α + c l r l ( 2 θ + 1 ) ( c t + β + c t r t ) ] θ ( 4 θ + 3 ) , and the optimal selling price of traditional products is p t = θ + c l α + c l r l + 2 ( θ + 1 ) ( c t + β + c t r t ) 4 θ + 3 .

4.2. Price and Quantity Comparison

To obtain a sense of consumer welfare under the different formats, we analyze how the factor of low-carbon awareness (LCA) affects the prices and quantities sold in the market. And the conclusions are drawn in Proposition 1–4.
Proposition 1.
The relationship between the price of traditional products and low-carbon products and consumers’ LCA is shown in Table 2.
It can be seen from Proposition 1 that regardless of the net expenditure of products (only if 2 m + n > 0 ), both the price of low-carbon and traditional products first increases and then decreases in the consumers’ low-carbon awareness (LCA) θ . Slightly differently, the shift from an upward trend to a downward trend in the prices of low-carbon products requires the fulfillment of a higher critical mass of net product expenditures 2 m + n compared to the price trend of traditional products. Specifically, when the net expenditure is small ( 0 < 2 m + n < 3 2 ), both the price of low-carbon and traditional products ( p l , p t ) will increase with the increase in LCA. The behind reason is as follows. In the ordinary case, manufacturing costs are closely related to the selling price. When the net expenditure on the product is small, the price of the product will be low. At this time, due to the higher LCA, consumers are willing to bear the rising price of low-carbon products, which also means they are willing to pay for the high price of low-carbon products. The low price of the product results in consumers still choosing to buy it when the price of traditional products in the market grows with the price of low-carbon products. In this case, the L-type manufacturer will be stimulated to increase the price to make more profit. This increasing price behavior will be followed by the T-type manufacturer. When the net expenditure of both products increases to a moderate level ( 3 2 < 2 m + n < f 1 ( θ ) ), the prices of traditional products themselves will rise, which may result in the portion of traditional products that rise with the price of low-carbon products exceeding the consumer’s upper limit on price increases for traditional goods. In this case, some customers will be put off by excessive price increases. And at this point, due to the presence of LCA, consumer preference for low-carbon products will still be more important than the high price of low-carbon products, so low-carbon products will still be favored by consumers. In this sense, the L-type manufacturer can continue to increase prices to gain profits, while the T-type manufacturer has to reduce prices to gain more market share. When the net expenditure of both products is at a high level ( 2 m + n > f 1 ( θ ) ), the price increases for both traditional and low-carbon products can exceed the psychologically expected price that consumers are willing to bear for low-carbon awareness, and limited LCA is not enough to ensure that consumers pay for high-priced products. Then the L-type manufacturer will charge a lower retail price to sell more quantity, which will be followed by the T-type manufacturer.
Corollary 1.
Compared with traditional products, consumers have a greater tolerance for price increases for low-carbon products.
From the explanation of Proposition 1, we can find that the price of low-carbon products increases in LCA when the net expenditure is at ( 0 , f 1 ( θ ) ) and decreases otherwise. The changing threshold for traditional products is 3 2 with f 1 ( θ ) > 3 2 . This indicates that consumers are more tolerant of price increases for low-carbon products than for traditional ones. But when 2 m + n > f 1 ( θ ) , the prices of both low-carbon products and traditional ones fall as low-carbon awareness grows, so it is unlikely that L-type manufacturers will raise prices significantly enough to deplete consumer tolerance and discourage them from buying.
Corollary 2.
The price fluctuation of low-carbon products is greater than that of traditional products due to consumers’ low-carbon awareness.
From p l θ p t θ > 0 , we can see that low-carbon products fluctuate more dramatically with θ than traditional products. That is, low-carbon products are more marginally “low-carbon aware” than traditional products, which means that consumers’ LCA changes by one unit and low-carbon product prices change more. The reason behind this is that low-carbon awareness plays an important role in the pricing of low-carbon products, as opposed to traditional products that are priced on the basis of value in use. The direct effect of θ (on the low-caron product) is more dramatic than the indirect effect (on the traditional product).
Proposition 2.
The relationship between the demand for traditional products   q t   and the demand for low-carbon products  q l   with the LCA  θ  is shown in Table 3 and Table 4.
An analysis of Table 3 above shows that the effect of consumers’ LCA θ on product demand contains both direct and indirect effects. In this paper, we refer to the “direct effect” as the direct impact of low-carbon awareness θ on product demand and the “indirect effect” as the aspect of low-carbon awareness θ that affects product price and thus indirectly affects product demand. In terms of the direct effect, an increase in consumers’ LCA θ directly increases (decreases) the demand for low-carbon (traditional) products, which results in an increase (decrease) in the production quantity. From the indirect effect (similar to Proposition 1), with the increase in consumers’ LCA θ , the retail price of low-carbon (traditional) products first tends to increase and then decrease with the increase in net expenditure, which in turn first leads to the trend of decreasing and then increasing the production quantity of low-carbon products (traditional products). Combining the two effects, with the increase in net expenditure (from n < m < 1 2 to n < 1 2 < m and then 1 2 < n < m ), the production quantity of both low-carbon and traditional products will tend to first decrease and then increase with the increase in LCA. In particular, when the net expenditure is high ( 1 2 < n < m and m n > f 2 ( θ ) ), the production quantity of traditional products decreases in LCA. This is because the demand reduction effect caused by the increasing LCA and the increasing cost of traditional products outweighs the demand enhancement effect caused by the lower price. When net expenditures of both products are low ( n < m < 1 2 ) , the selling prices of both rise first and result in a reduction in quantity in the LCA. The result is displayed in Table 3 and can be similarly analyzed as that in Table 4, which will be omitted for brevity.
Proposition 3.
(i)
p i r l > 0 ( i = l , t ), p i r t > 0 ( i = l , t );
(ii)
q i r i < 0 ( i = l , t ), q i r j > 0 ( i , j = l , t and i j ).
Proposition 3 reveals that prices ( p l , p t ) are all increasing functions of the interest rate ( r l , r t ) , and an increase in either party’s interest rate increases prices ( p l , p t ) . Sales ( q l , q t ) are all decreasing functions of the interest rate ( r l , r t ) , and so sales decrease as the interest rate ( r l , r t ) increases. Sales q i are all increasing functions of the interest rate r j , and increase as the interest rate on the other increases. An increase in the financing rate will bring about an increase in operating costs, which will inevitably lead to an increase in prices, and an increase in prices will lead to a decrease in output.
Proposition 4.
The quantity comparisons between  q l   and   q t   are as follows:
(i)
q l > q t  always holds for  m < n ;
(ii)
q l > q t for 0 < m n < θ ( m + 1 + 2 n θ + θ ) 4 θ + 2 and q l < q t for m n > θ ( m + 1 + 2 n θ + θ ) 4 θ + 2 .
It can be seen from Proposition 4 that the quantity comparisons between low-carbon products and traditional ones are closely related to their production expenditure. To be specific, it is a wise choice to produce more low-carbon products when producing low-carbon products is cost-effective. When producing low-carbon items is cheap, producing more low-carbon products is still a dominant strategy until the expenditure difference between low-carbon and traditional ones exceeds a certain threshold. Before making a production schedule, a useful implication for the business world is that it is advisable for the decision-maker to assess the expenditure to produce a certain type of product.

4.3. Profit Comparison

Using the solutions of different subgames studied in the previous section, we now compare the profits of L-type and T-type manufacturers to determine the production strategy they will adopt.
Proposition 5.
The profit comparisons between T-type and L-type manufacturers are as follows: where  f ( m , n ) = ( n 1 ) 2 ( 1 + β ) ( m 1 ) ( m 1 2 β ) .
(i)
When 1 < m < 1 + 2 β , then f ( m , n ) > 0 always holds; therefore, π l π t < 0 for θ ( 0 , f ( m , n ) and π l π t > 0 for θ ( f ( m , n ) , 1 ) .
(ii)
When m < 1 or m > 1 + 2 β and ( n 1 ) 2 ( 1 + β ) > ( m 1 ) ( m 1 2 β ) , then f ( m , n ) > 0 holds; therefore, π l π t < 0 for θ ( 0 , f ( m , n ) and π l π t > 0 otherwise.
(iii)
When m < 1 or m > 1 + 2 β and ( n 1 ) 2 ( 1 + β ) < ( m 1 ) ( m 1 2 β ) , then f ( m , n ) < 0 holds; therefore, π l π t > 0 always holds.
It can be seen from Proposition 5 that the manufacturer’s selection of low-carbon production is closely affected not only by the production cost but also by the LCA. When the expenditure of low-carbon production is moderate, with the increasing of the consumers’ LCA, the manufacturer first prefers the traditional strategy and then the low-carbon one. In terms of price, this is because when production costs are moderate, the consumer of the low-carbon product is willing to pay more for his low-carbon awareness, while the price of the traditional product has reached the upper limit of the consumer’s price for the traditional product (as proved in Proposition 1), and the rate of change of the price of the two with the low-carbon awareness positively or negatively differs here. The low-carbon product can continue to increase its price as low-carbon awareness increases, and the traditional product should be downgraded to lower prices as low-carbon awareness increases. Therefore, it is possible to choose the traditional strategy first and the low-carbon strategy to always pursue high prices. When the expenditure of low-carbon production stays at a low or high level, the manufacturer’s production strategy depends on the expression of f ( m , n ) which is related to the parameters of production cost, financing rate, carbon tax, and subsidy. In this case, if f ( m , n ) < 0 , then the low-carbon strategy always dominates the traditional one.

4.4. Social Welfare

Government subsidy programs or taxation programs for different products can affect not only manufacturers’ profits but also consumer surplus. Based on this, this section examines the impact of subsidies and taxes on social welfare by considering manufacturers’ total profits ( π ), consumer surplus ( C s ), and government costs ( G s ). Social welfare can be written as: w = π + C s G s , similar to [41,47,48]. In this case, the total profits of manufacturers are the sum of the profits of the two capital-constrained T-type manufacturer and the L-type manufacturer, and government costs are composed of the subsidy given to the L-type manufacturer and the tax collected from the T-type manufacturer. Consumer surplus is the sum of the true utilities of all consumers participating in the market. It is derived by combining the consumer’s utility and the valuation parameters v for the purchase of traditional products, the purchase of low-carbon products, and no consumption.
Consumer surplus can then be constructed as follows:
C s = v 1 1 [ ( 1 + θ ) v p l ] d v + v 2 v 1 ( v p t ) d v + 0 v 2 0 d v
And because v 1 = p l p t θ and v 2 = p t above, therefore, C s = p l p t θ [ 1 + θ 2 q l q t 2 ] + q l ( 1 + θ 2 p l ) . And π = π l + π t = ( p l c l + α c l r l ) q l + ( p t c t β c t r t ) q t , G s = q t β + q l α . Hence, social welfare can be organized as: w = ( p l c l + α c l r l ) q l + ( p t c t β c t r t ) q t + p l p t θ [ 1 + θ 2 q l q t 2 ] + q l ( 1 + θ 2 p l ) + q t β q l α .
To maximize social welfare, the following conclusion can be drawn:
Lemma 1.
There exists a government subsidy per unit of low-carbon product  α = α , so that social welfare achieves the maximum; there is also a government tax per unit of traditional product  β = β , which makes social welfare obtain the maximum, where
α = 8 θ 4 + ( 16 8 β 8 c l r l 8 c l ) θ 3 + ( 12 7 c t 21 β 4 c l r l 7 c t r t 4 c l ) θ 2 + ( 6 c l 11 c t 17 β + 6 c l r l 11 c t r t + 4 ) θ + 4 c l 4 c t 4 β + 4 c l r l 4 c t r t 8 θ 3 + 16 θ 2 + 12 θ + 4
and
β = 8 θ 3 + ( 13 10 c t 8 α 10 c t r t ) θ 2 + ( 7 c l 12 c t 13 α + 7 c l r l 12 c t r t + 4 ) θ + 4 c l 4 c t 4 α + 4 c l r l 4 c t r t 16 θ 3 + 30 θ 2 + 18 θ + 4
From Lemma 1, for both L-type manufacturers and T-type manufacturers, there exists a definite value that maximizes the social welfare for both firms under the low-carbon policy. Therefore, as the leader in the Stackelberg game, the government should take up market responsibility and regulate through subsidies per unit of low-carbon products and taxes per unit of traditional products, so as to maximize the manufacturer’s profit, the consumer’s surplus, and the social welfare, and try to maximize the interests of all participants. Briefly, under the low-carbon policy, as long as the government handles the relevant standard policies well, both manufacturers can obtain optimal profit, and both can pursue their own economic optimization under the policy so as to optimize the welfare of the whole society. In other words, the government plays a decisive role in the promotion of various low-carbon policies.

5. Sensitivity Analysis

In order to understand the above key findings more clearly and distinctly, this section examines the effects of consumers’ LCA and different interest rates on prices, demand, manufacturer’ profits, consumer surplus, government costs, and social welfare based on actual data. And the management insights obtained can provide suggestions and references for firms’ low-carbon transition decisions and government policies related to low-carbon subsidies and taxes. The following is a numerical analysis of the most typical and comprehensively developed new energy vehicles under China’s domestic low-carbon emission reduction policy, which the authors have assumed to be simulated based on realistic data in order to obtain a more meaningful research value.
In recent years, new energy has gradually entered the public’s view. The low-carbon environmental protection, battery performance safety, and continuous improvement of supporting facilities of new energy-pure electric vehicles make them popular and drive the development of a low-carbon economy. However, the high price of new energy vehicles also deters a considerable portion of consumers from buying new energy vehicles and leads them to choose traditional fuel cars, since the latter are low-priced and easy to obtain. However, the recent increase in oil prices makes it unclear, prior to purchase, whether to choose low-carbon vehicles or traditional ones. Therefore, we carried out a numerical analysis using the relevant data.
Based on what has been mentioned above, the main parameters used in Section 5 are as follows: c l = 1.4 and c t = 0.8 . Other detailed parameters for each figure will be completed and presented in the subsequent analysis in Section 5.1, Section 5.2 and Section 5.3. And all the parameter assignments are in accordance with the corresponding assumption in Section 3. According to the acquisition standards issued by the Ministry of Finance for new energy vehicles in 2021, the subsidy for pure electric vehicles with a range of 300–400 km (including 300 km) decreases to CNY 13,000. The subsidy for pure electric passenger cars with a range of 400 km or more (including 400 km) decreases to CNY 18,000. And there is no subsidy for pure electric passenger cars with a range of 300 km or less. By consulting the new energy vehicles on the official website of “Auto Home”, we find that the subsidy for each vehicle is about CNY 12,600. Also, a survey of the manufacturer’s costs of fuel cars and pure electric cars shows that the total cost of manufacturing a C-class fuel car is 12,300 euros (about CNY 86,392,000), and the total cost of manufacturing a pure electric car is 20,200 euros (about CNY 140,460,000). According to PA Consulting, a UK-based consulting firm, it will cost about USD 6800 to build a traditional petrol car in 2019, while it will cost about USD 8400 to build an all-electric car, a cost gap of about 24 percent. According to a joint report by the American Federation of Labor Organizations and industrial robot maker Fanuc Corporation, the man-hours to build an all-electric vehicle are on average 30% to 50% higher than the man-hours to build a petrol car, which also translates into an increase in manufacturing costs. Based on the benchmark CNY legal lending rate for financial institutions in the China Statistical Yearbook 2021, the bank lending rate is set at around 4.5%. Therefore, the general credit rate and green credit rate are set as 0.05 and 0.04, the production cost of low-carbon product c l and traditional product c t are set as 1.4 and 0.8 (Combining the above data yields), the government subsidy per unit of low-carbon product α is set as 0.126 [49], and the carbon tax per unit of traditional product β is set as 0.1 [50].

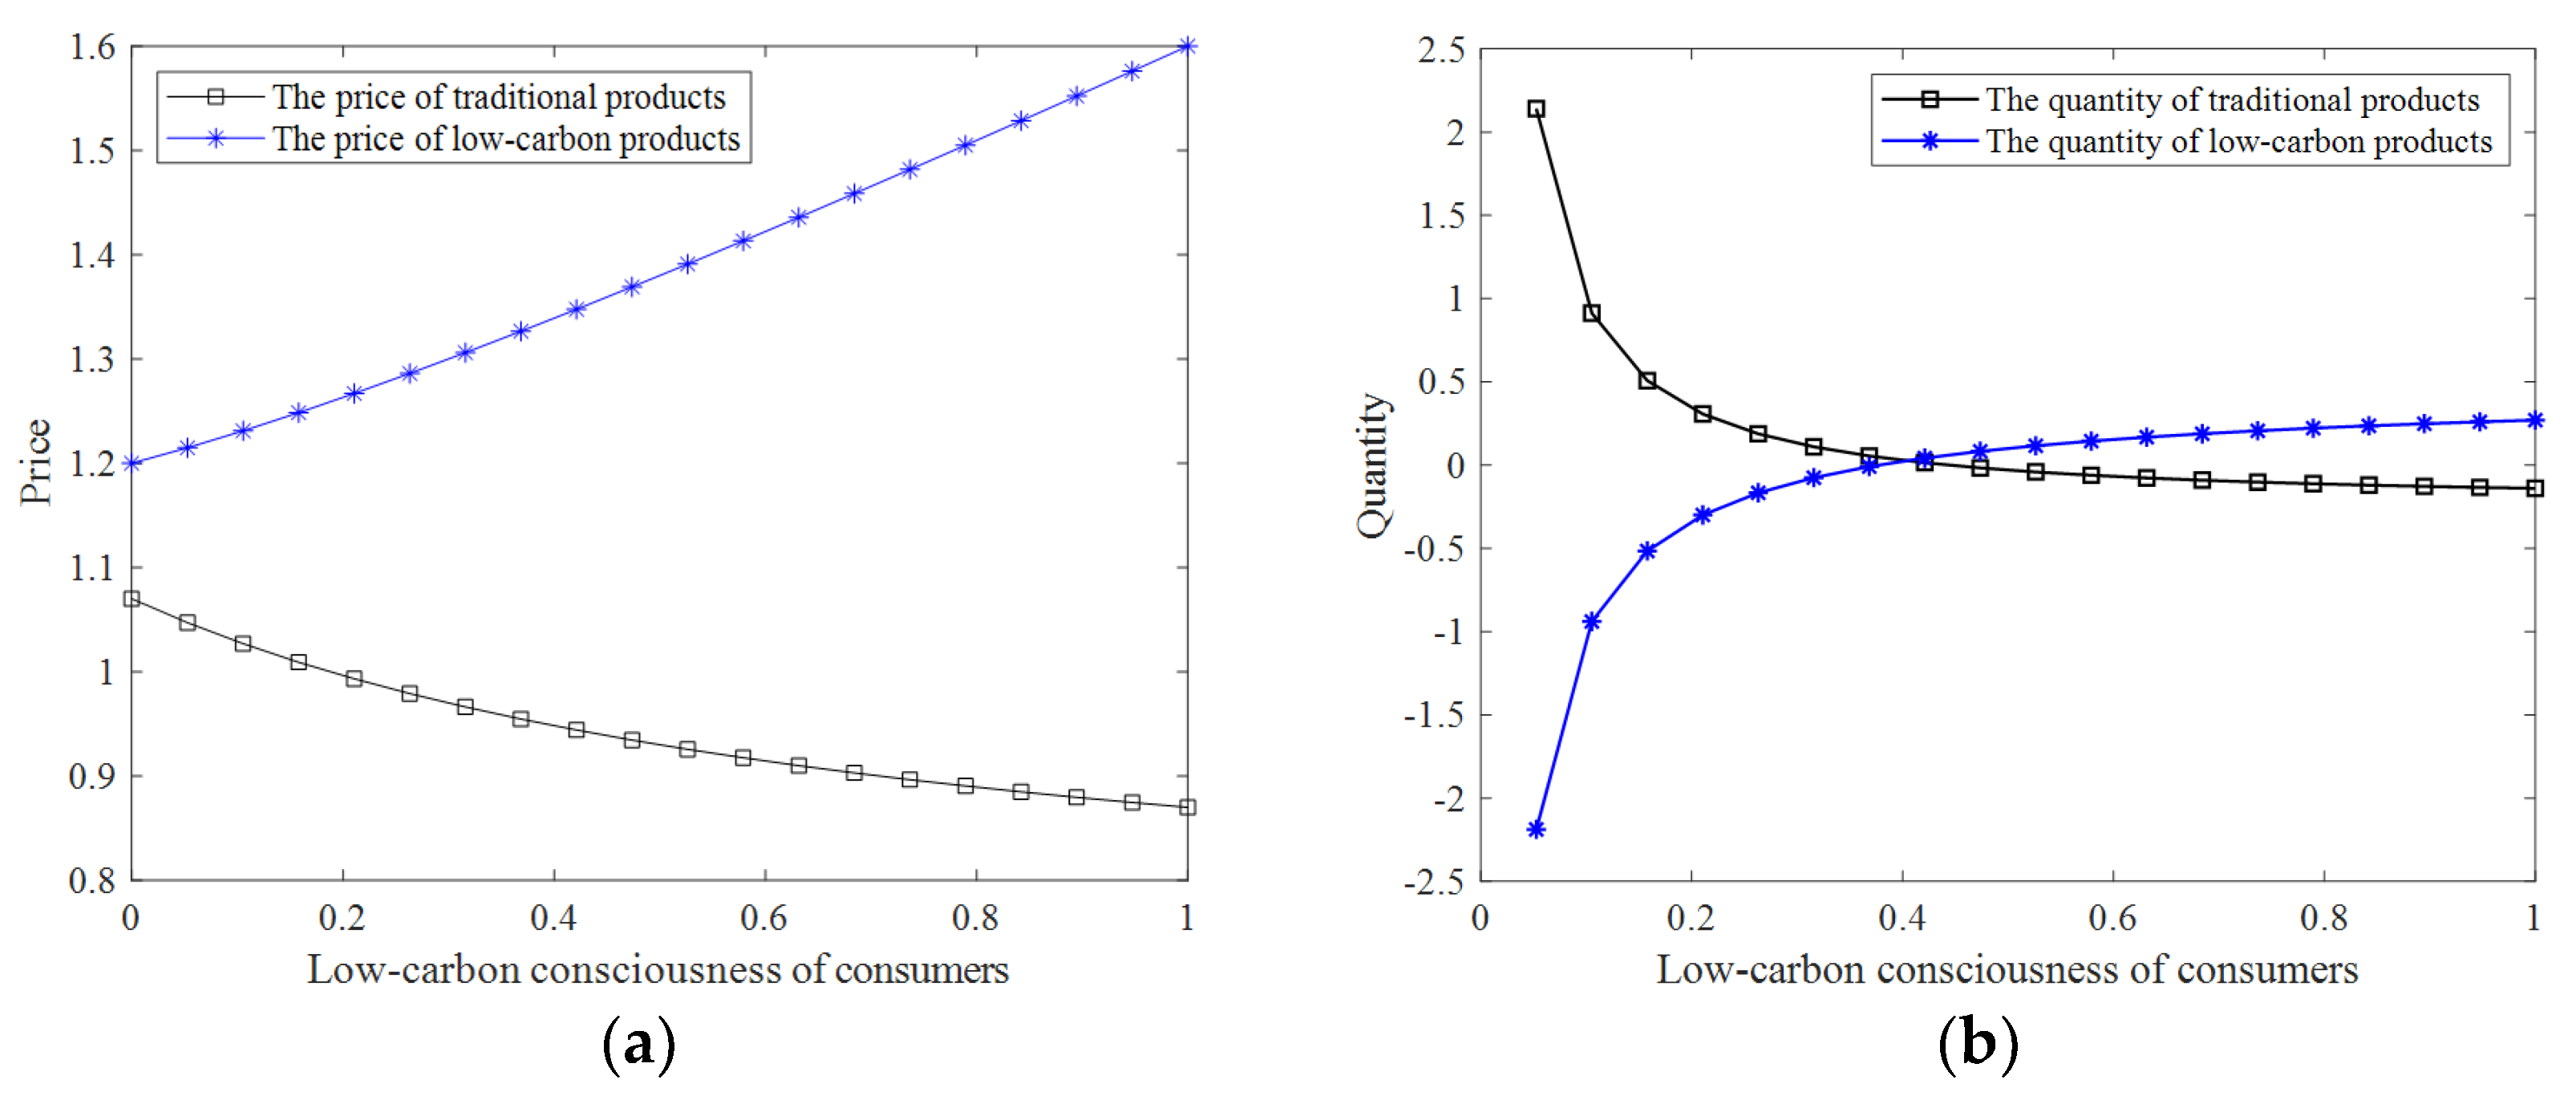
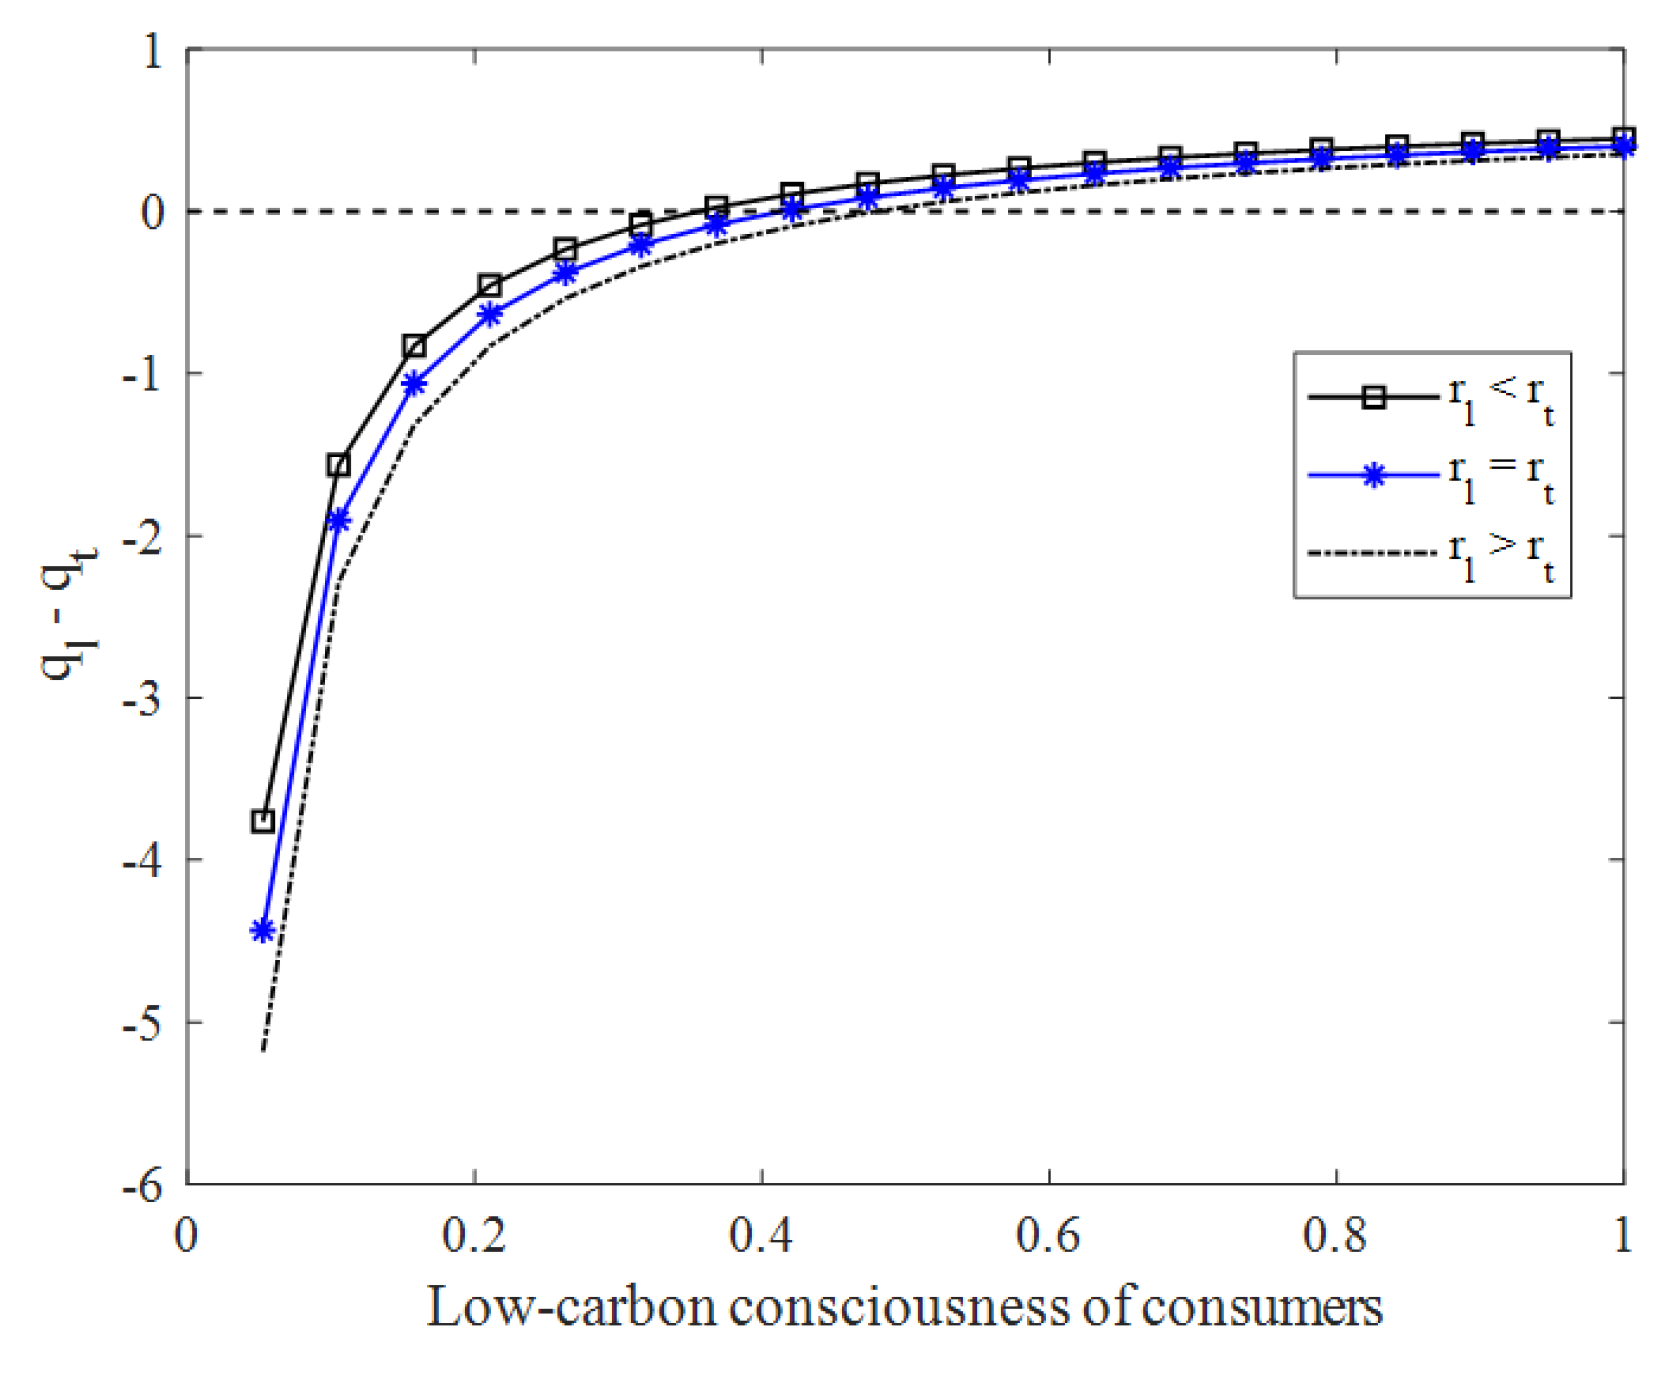
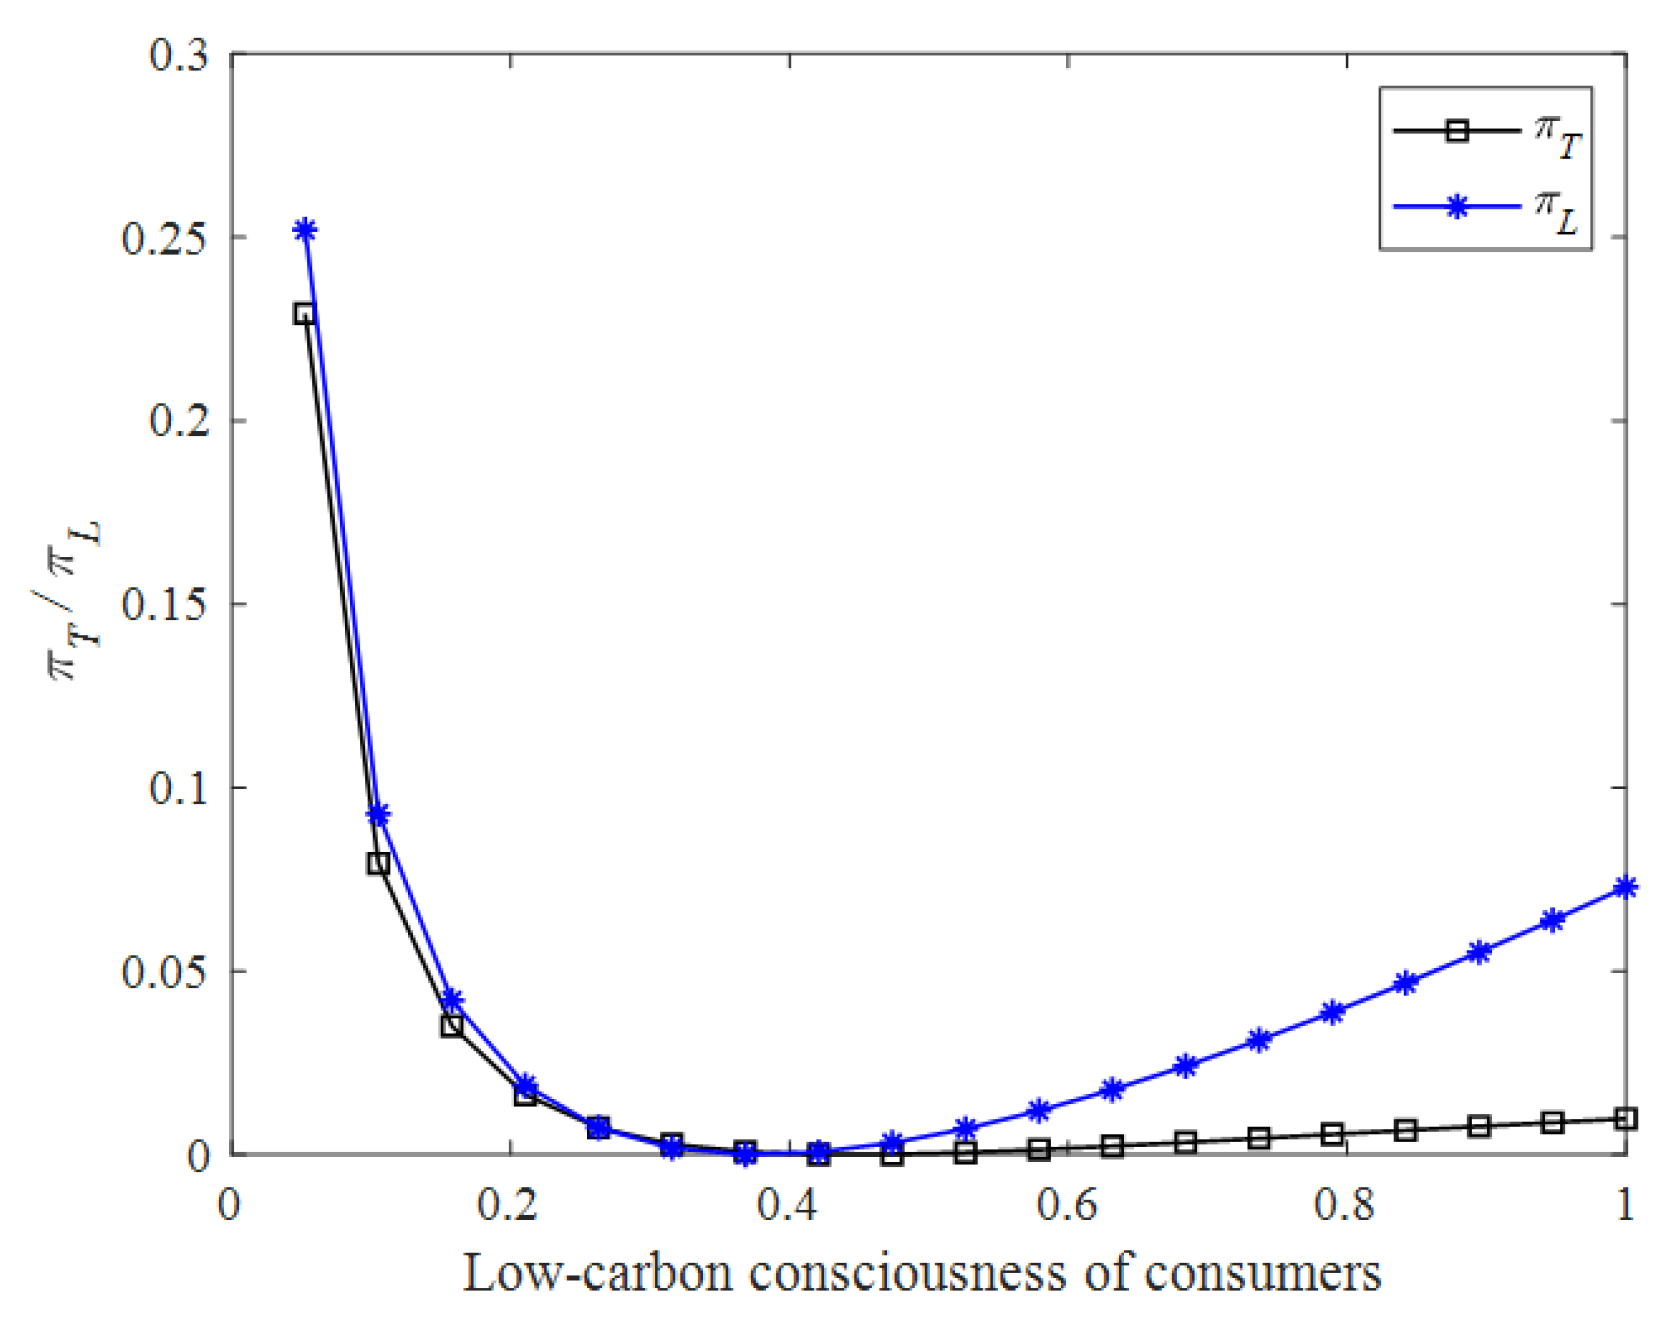
5.1. Effects of Low-Carbon Awareness θ

The parameter values presented in this section are as follows: c l = 1.4 , c t = 0.8 , α = 0.126 , β = 0.1 , r l = 0.04 , and r t = 0.05 . Figure 2a,b reveal how LCA affects price and quantity. From Figure 2a, we can see that the price of traditional products decreases as consumers’ LCA increases, while the price of low-carbon products is the opposite, which is consistent with the second case in Proposition 1 (that is 3 2 < 2 m + n < f 1 ( θ ) ). The increase in consumers’ LCA means that consumers prefer low-carbon products on the market, which stimulates L-type manufacturers to raise prices to gain more profits. However, T-type manufacturers tend to attract consumers by lowering prices in order not to be squeezed out of the market by L-type manufacturers. For consumers with low LCA, price can be the priority factor, so T-type manufacturers can develop a marketing strategy of “low price for most”. For consumers with strong LCA, green is the dominant factor, so L-type manufacturers can carry out other measures, such as advertising, to make consumers no longer hesitate about price.
From Figure 2b, as consumers’ LCA increases, the demand for low-carbon (traditional) products increases (decreases), which is consistent with the second case in Proposition 2. When consumers’ LCA is close to 0, the demand for traditional products is much higher than for low-carbon products. This is because price is relatively important for consumers with almost no LCA. The price of a fuel car is half that of a pure electric car, which makes it a dominant choice to buy a fuel car. When consumer awareness exceeds 0.4, the demand for low-carbon products is gradually higher than traditional products, but instead of the large gap that occurs when consumers’ LCA approaches 0, there is a relatively flat situation. This means that even if consumers’ LCA is at a high level, traditional products cannot disappear from the market. Firstly, although the pure electric car is environmentally friendly, the price is too high for consumers to afford. Secondly, once the fuel car is squeezed out of the market, the market balance in competition will be broken and the monopoly position of pure electric cars will be formed, which is not beneficial for consumers and enterprises. Therefore, to develop a low-carbon economy, it is not advised to change the existing competitive market hastily but to punish and levy taxes on traditional products and promote the low-carbon transition step by step.

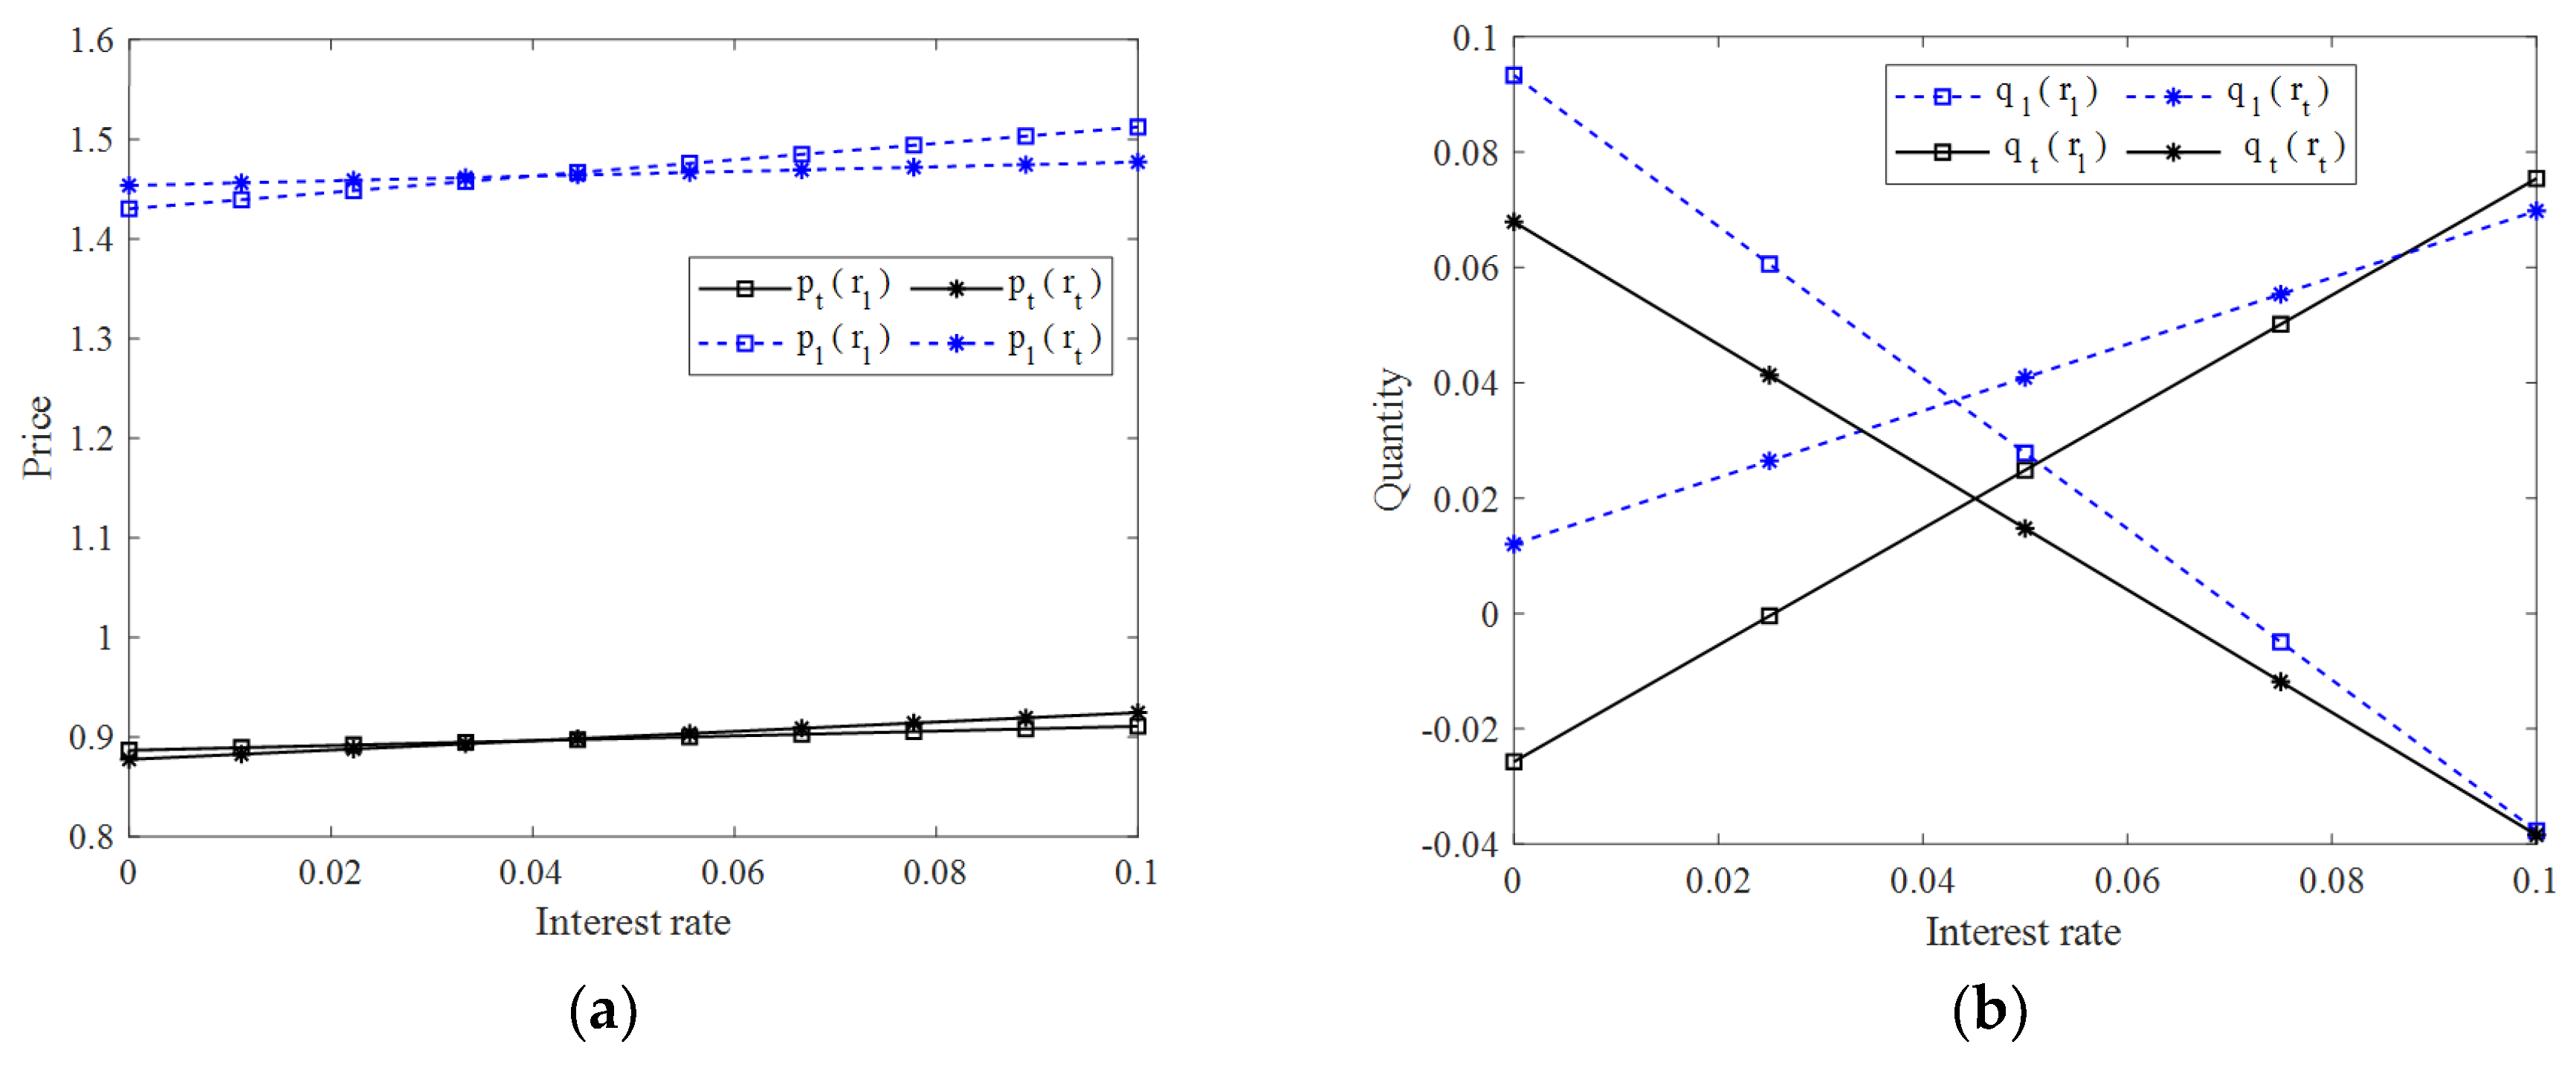
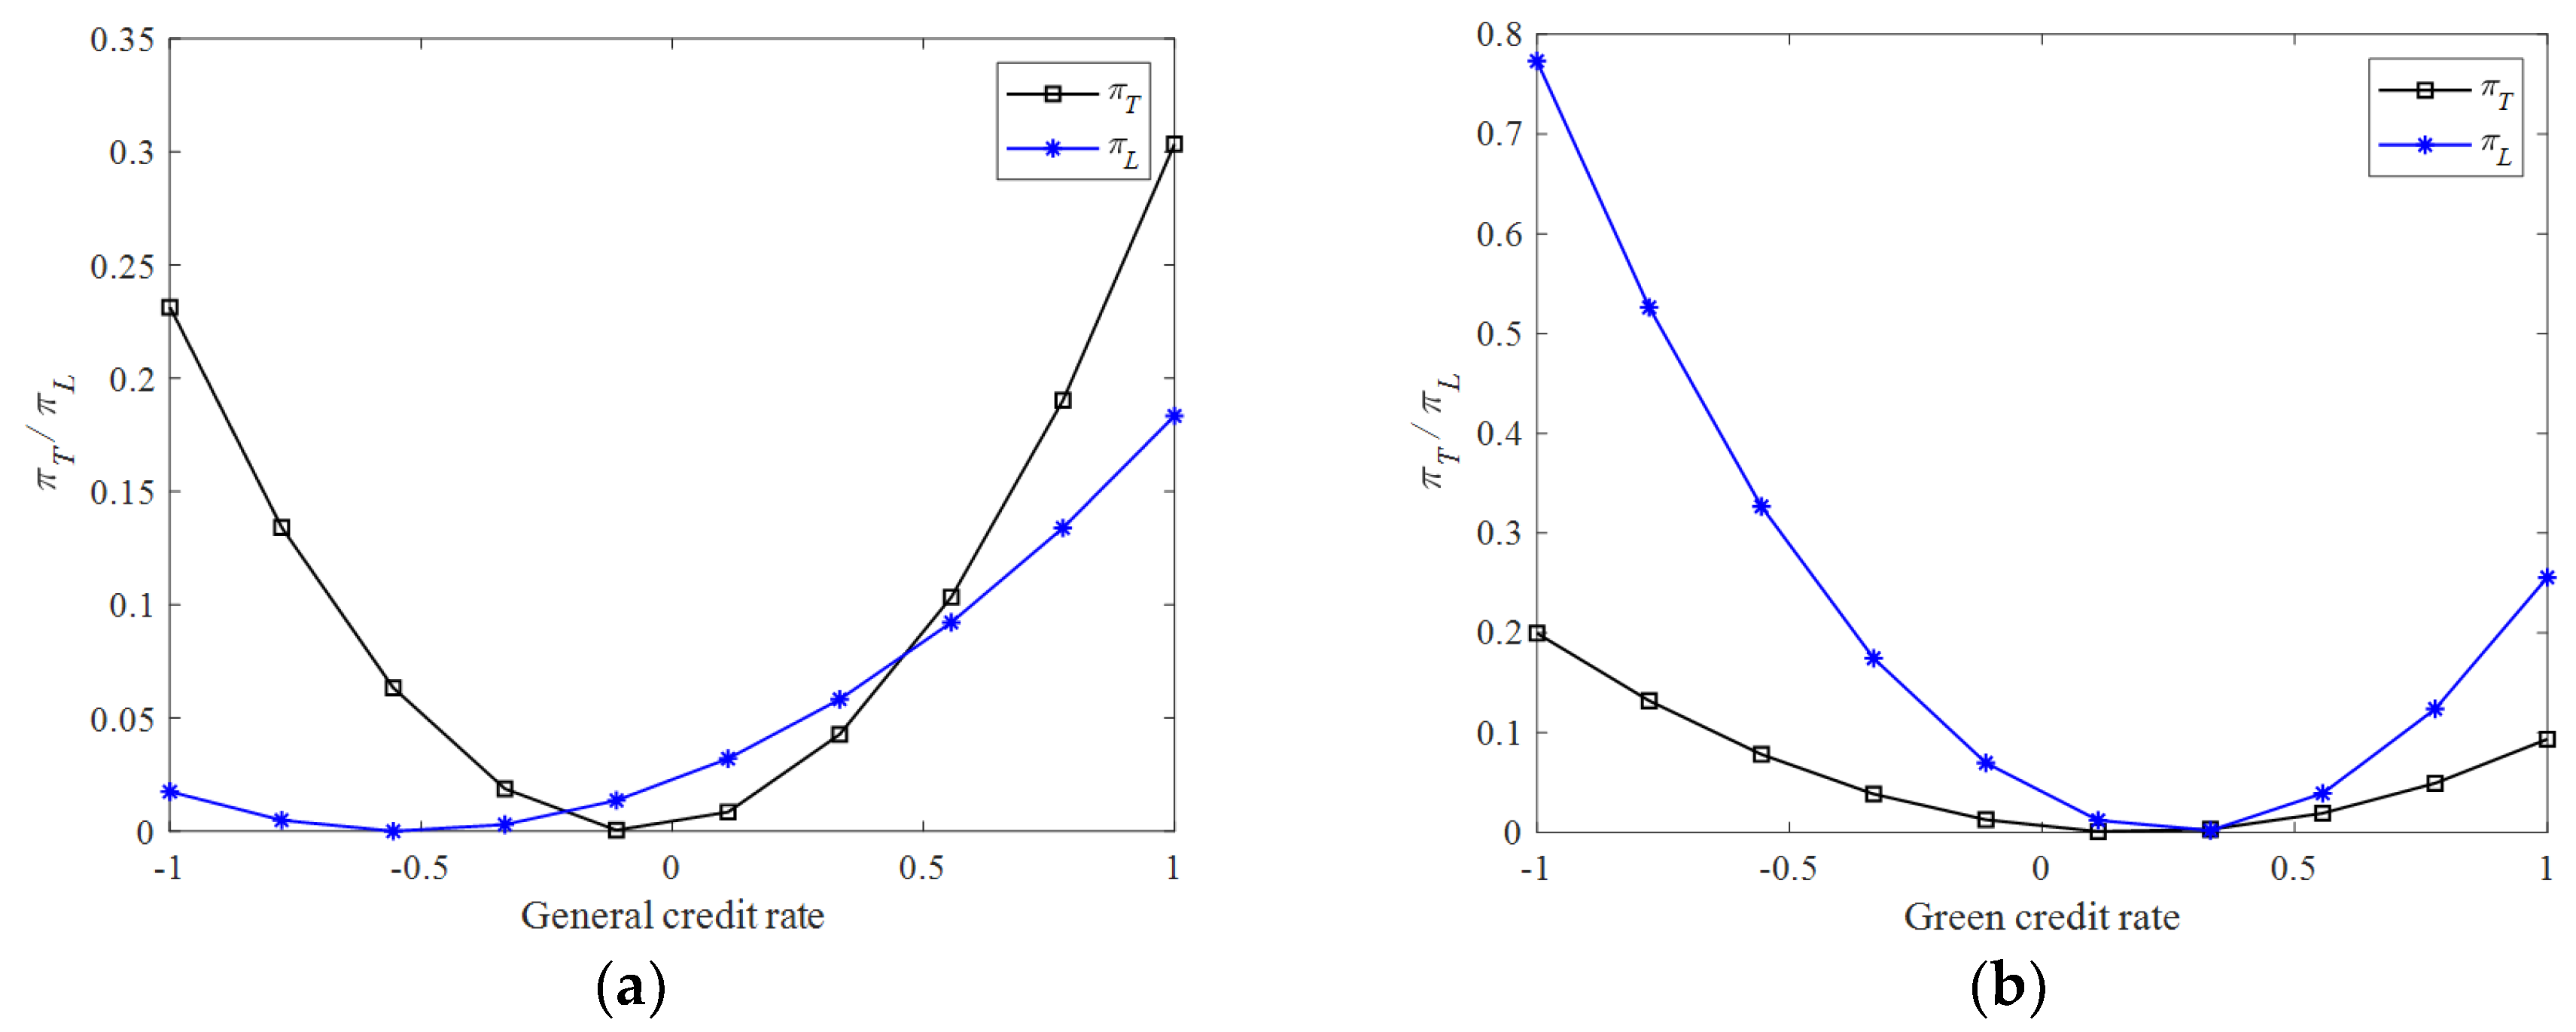
5.2. Effects of Financing Interest Rate

In this section, the values of the main parameters are presented as c l = 1.4 , c t = 0.8 , α = 0.126 , β = 0.1 , r t = 0.05 , and r l ( 0 , 1 ) , which is beneficial to observe how the interest rate of green credit affects the price and quantity. It is necessary to mention that the value of θ is set as θ = 0.7 in Figure 3a and θ = 0.42 in Figure 3b, which can make the difference between study objects more obvious in the graph. From Figure 3a, it can be seen that each straight line shows an increasing trend. This shows that an increase in interest rates in both financing models will increase the price of the product, whatever the type. The government should advocate for financial institutions to use different credit rates for different products to encourage L-type manufacturers to produce low-carbon products. From Figure 3b, it can be found that the production of low-carbon products decreases with the increase in the green credit rate and increases with the increase of the general credit rate, and the same is true for traditional products. The behind reason is as follows. The manufacturer chooses to produce conservatively for fear of not being able to repay their debts or having to bear the risk of bankruptcy, and the increase in their own financing rate intensifies this mentality. However, the increase in the competitor’s financing rate can alleviate the concern stated above. And the manufacturer can then take advantage of the opportunity to increase production to occupy the market and obtain profits. It is also found that when r t = 0.0341 or r l = 0.0513 , then q l = q t can be derived. Therefore, when the interest rate is in the range of ( 0.0341 , 0.0513 ) , then the quantity of low-carbon products is higher than that of traditional products.
The values of c l , c t , α , β in Figure 4 and Figure 5 are set the same as those in Figure 2 and Figure 3 with θ ( 0 , 1 ) to observe the effects of consumers’ low-carbon awareness. And the values of r l and r t are set as r l r t , r l = r t , and r l r t in Figure 4 and r l = 0.04 and r t = 0.05 in Figure 5. The main reason why we have adjusted the values of the specific parameter values of the interest rate in Figure 4 is that we want to verify whether the effects of θ on quantity is associated with the relationship between the two kinds of interest rates. Figure 4 reveals that quantity difference between low-carbon and traditional products ( q l q t ) always increases with the consumers’ LCA θ , whether r l < r t , r l = r t , or r l > r t . Furthermore, we also observe that the production quantity of low-carbon products is first lower, then equal to, and finally higher than that of traditional products. The difference is that, supposing r t is fixed, the turning point of low-carbon awareness θ becomes higher with the increasing of r l . Since interest rate is included as a part of operations costs, a higher level of LCA is needed to make up the increase in interest rates, which can stimulate low-carbon manufacturers to produce more.
Figure 5 reveals the impact of consumers’ LCA on the profits of both types of manufacturers. Both curves in Figure 5 are first decreasing and then increasing, and there is almost no difference between the profits of the two types of manufacturers in the decreasing part. When consumers’ LCA is greater than 0.4, the profits of L-type manufacturers are significantly greater than those of T-type manufacturers. This is because when consumers’ low-carbon awareness is low, they will choose affordable traditional products, but government subsidies help low-carbon products occupy some market share. Meanwhile, the government’s carbon tax causes some losses for traditional products, so the difference between the profits of the two manufacturers in the declining part is not large. But with the increase in consumers’ LCA, consumers will choose low-carbon products, and the increase in demand for low-carbon products directly increases the profit of L-type manufacturers. Coupled with government subsidies and carbon taxes, the profit of T-type manufacturers becomes even lower. At this time, if the T-type manufacturers want to survive in the market, it is necessary to change the long-term development strategy, carry out continuous reform to go green, and realize low-carbon production.
Figure 6a,b are obtained based on the parameters: c l = 1.4 , c t = 0.8 , α = 0.126 , β = 0.1 , r l = 0.04 , and θ = 0.7 . Figure 6a,b examine the manufacturer’s profit from the perspective of the financing rate. It can be seen from Figure 6a that both curves have a first decreasing and then increasing trend. Meanwhile, when r t is less than 0.49, the profit of the L-type manufacturer is higher than that of the T-type manufacturer. And the latter dominates the former otherwise. In practice, however, the financing interest rate should be greater than zero and less than 0.1. Therefore, in a reasonable range, the manufacturer’s profit increases with the increase in the ordinary credit interest rate r t , and the profit of the L-type manufacturer is greater than that of the T-type manufacturer. A similar conclusion can be found in Figure 6b, considering the green credit rate r l , and the explanation can be omitted for brevity. This indicates that the T-type manufacturer with financial constraints does not have an advantage in financing and again reflects the need for manufacturers to make an immediate low-carbon transition.

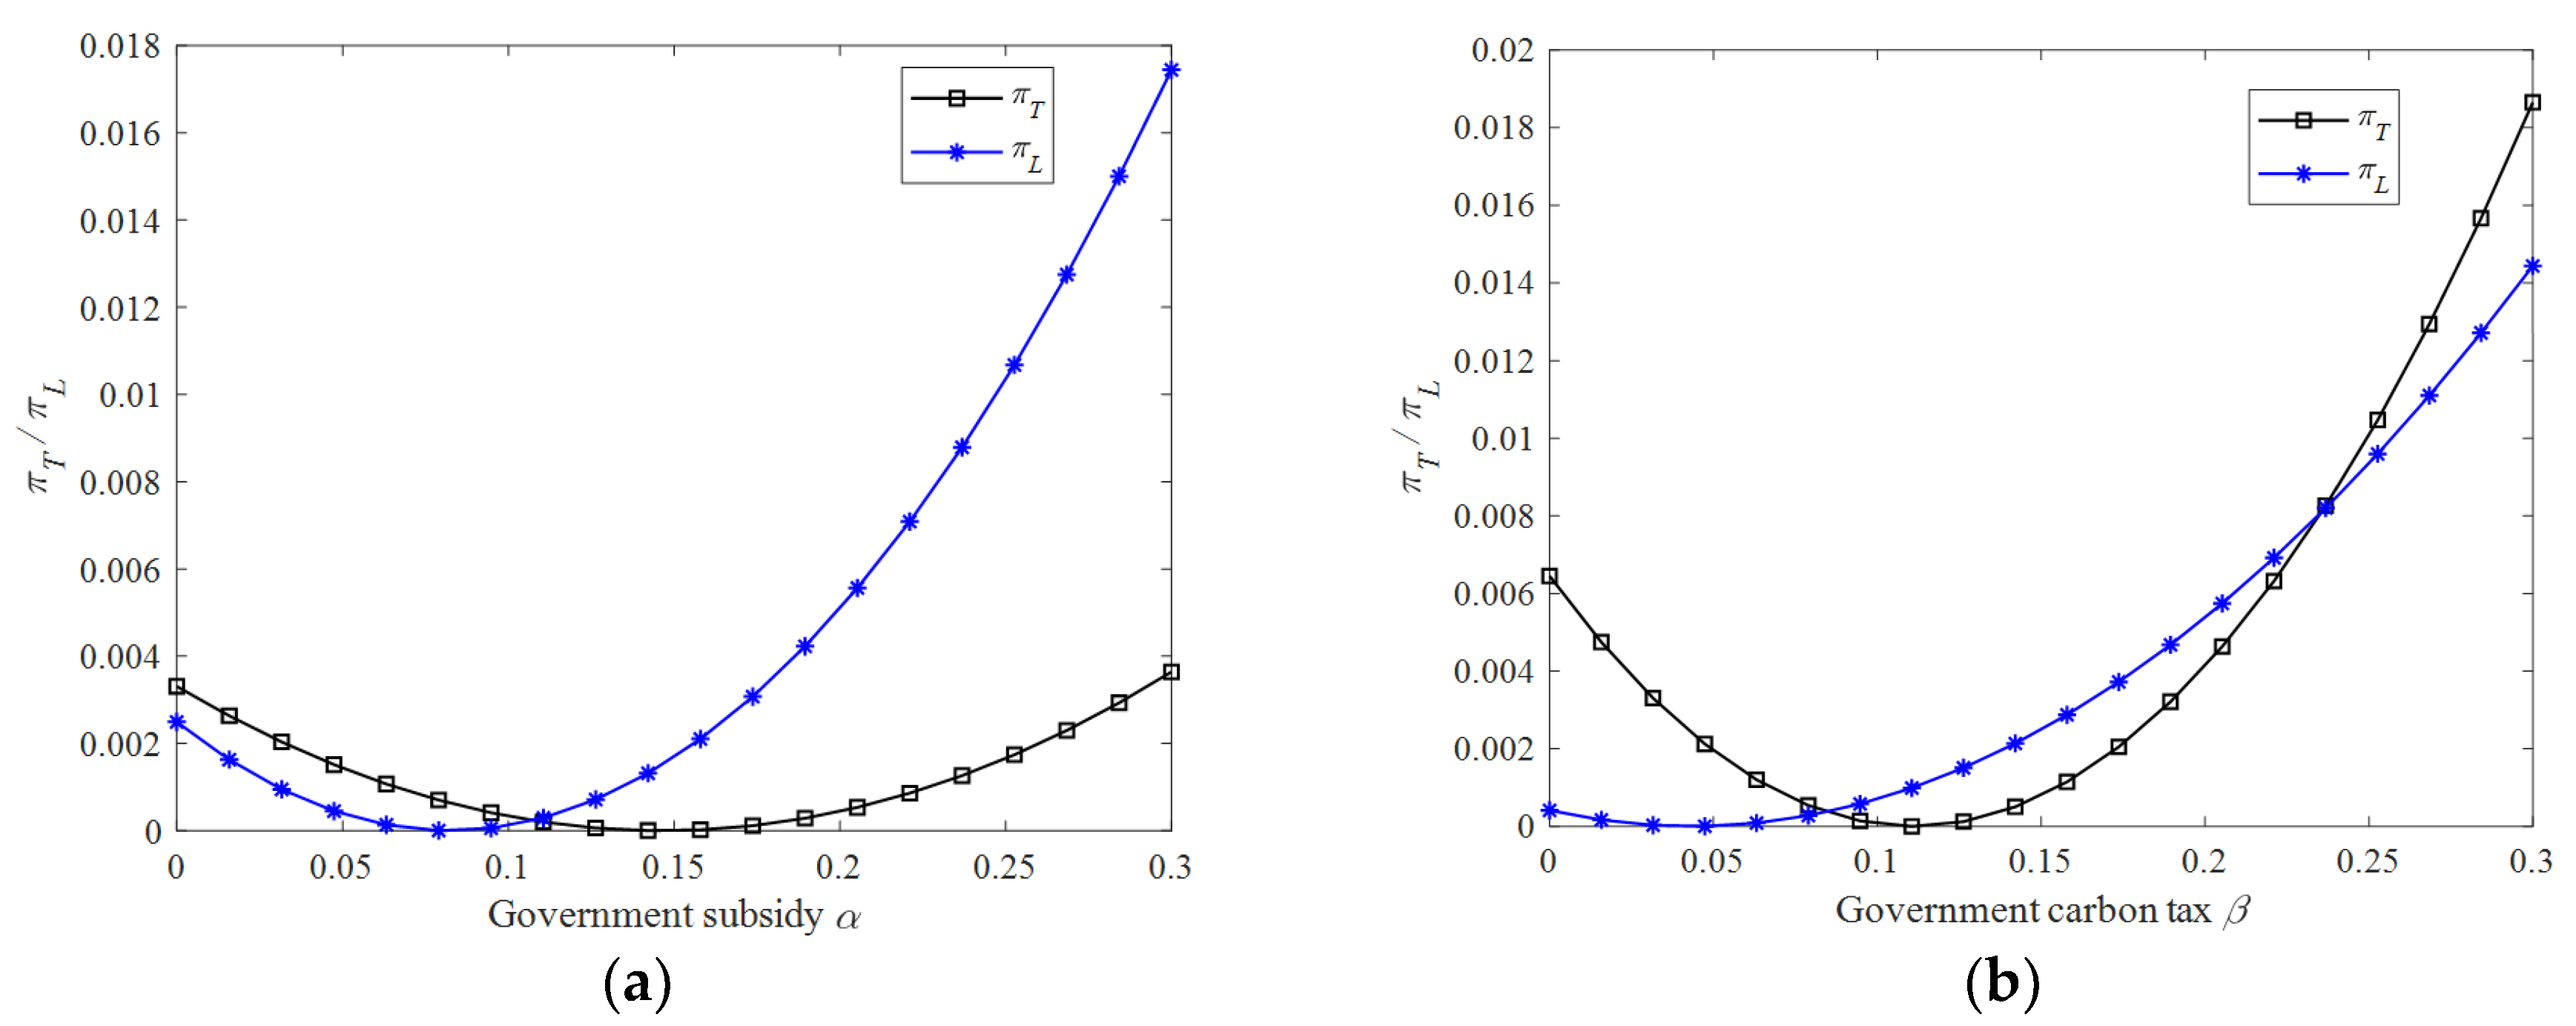
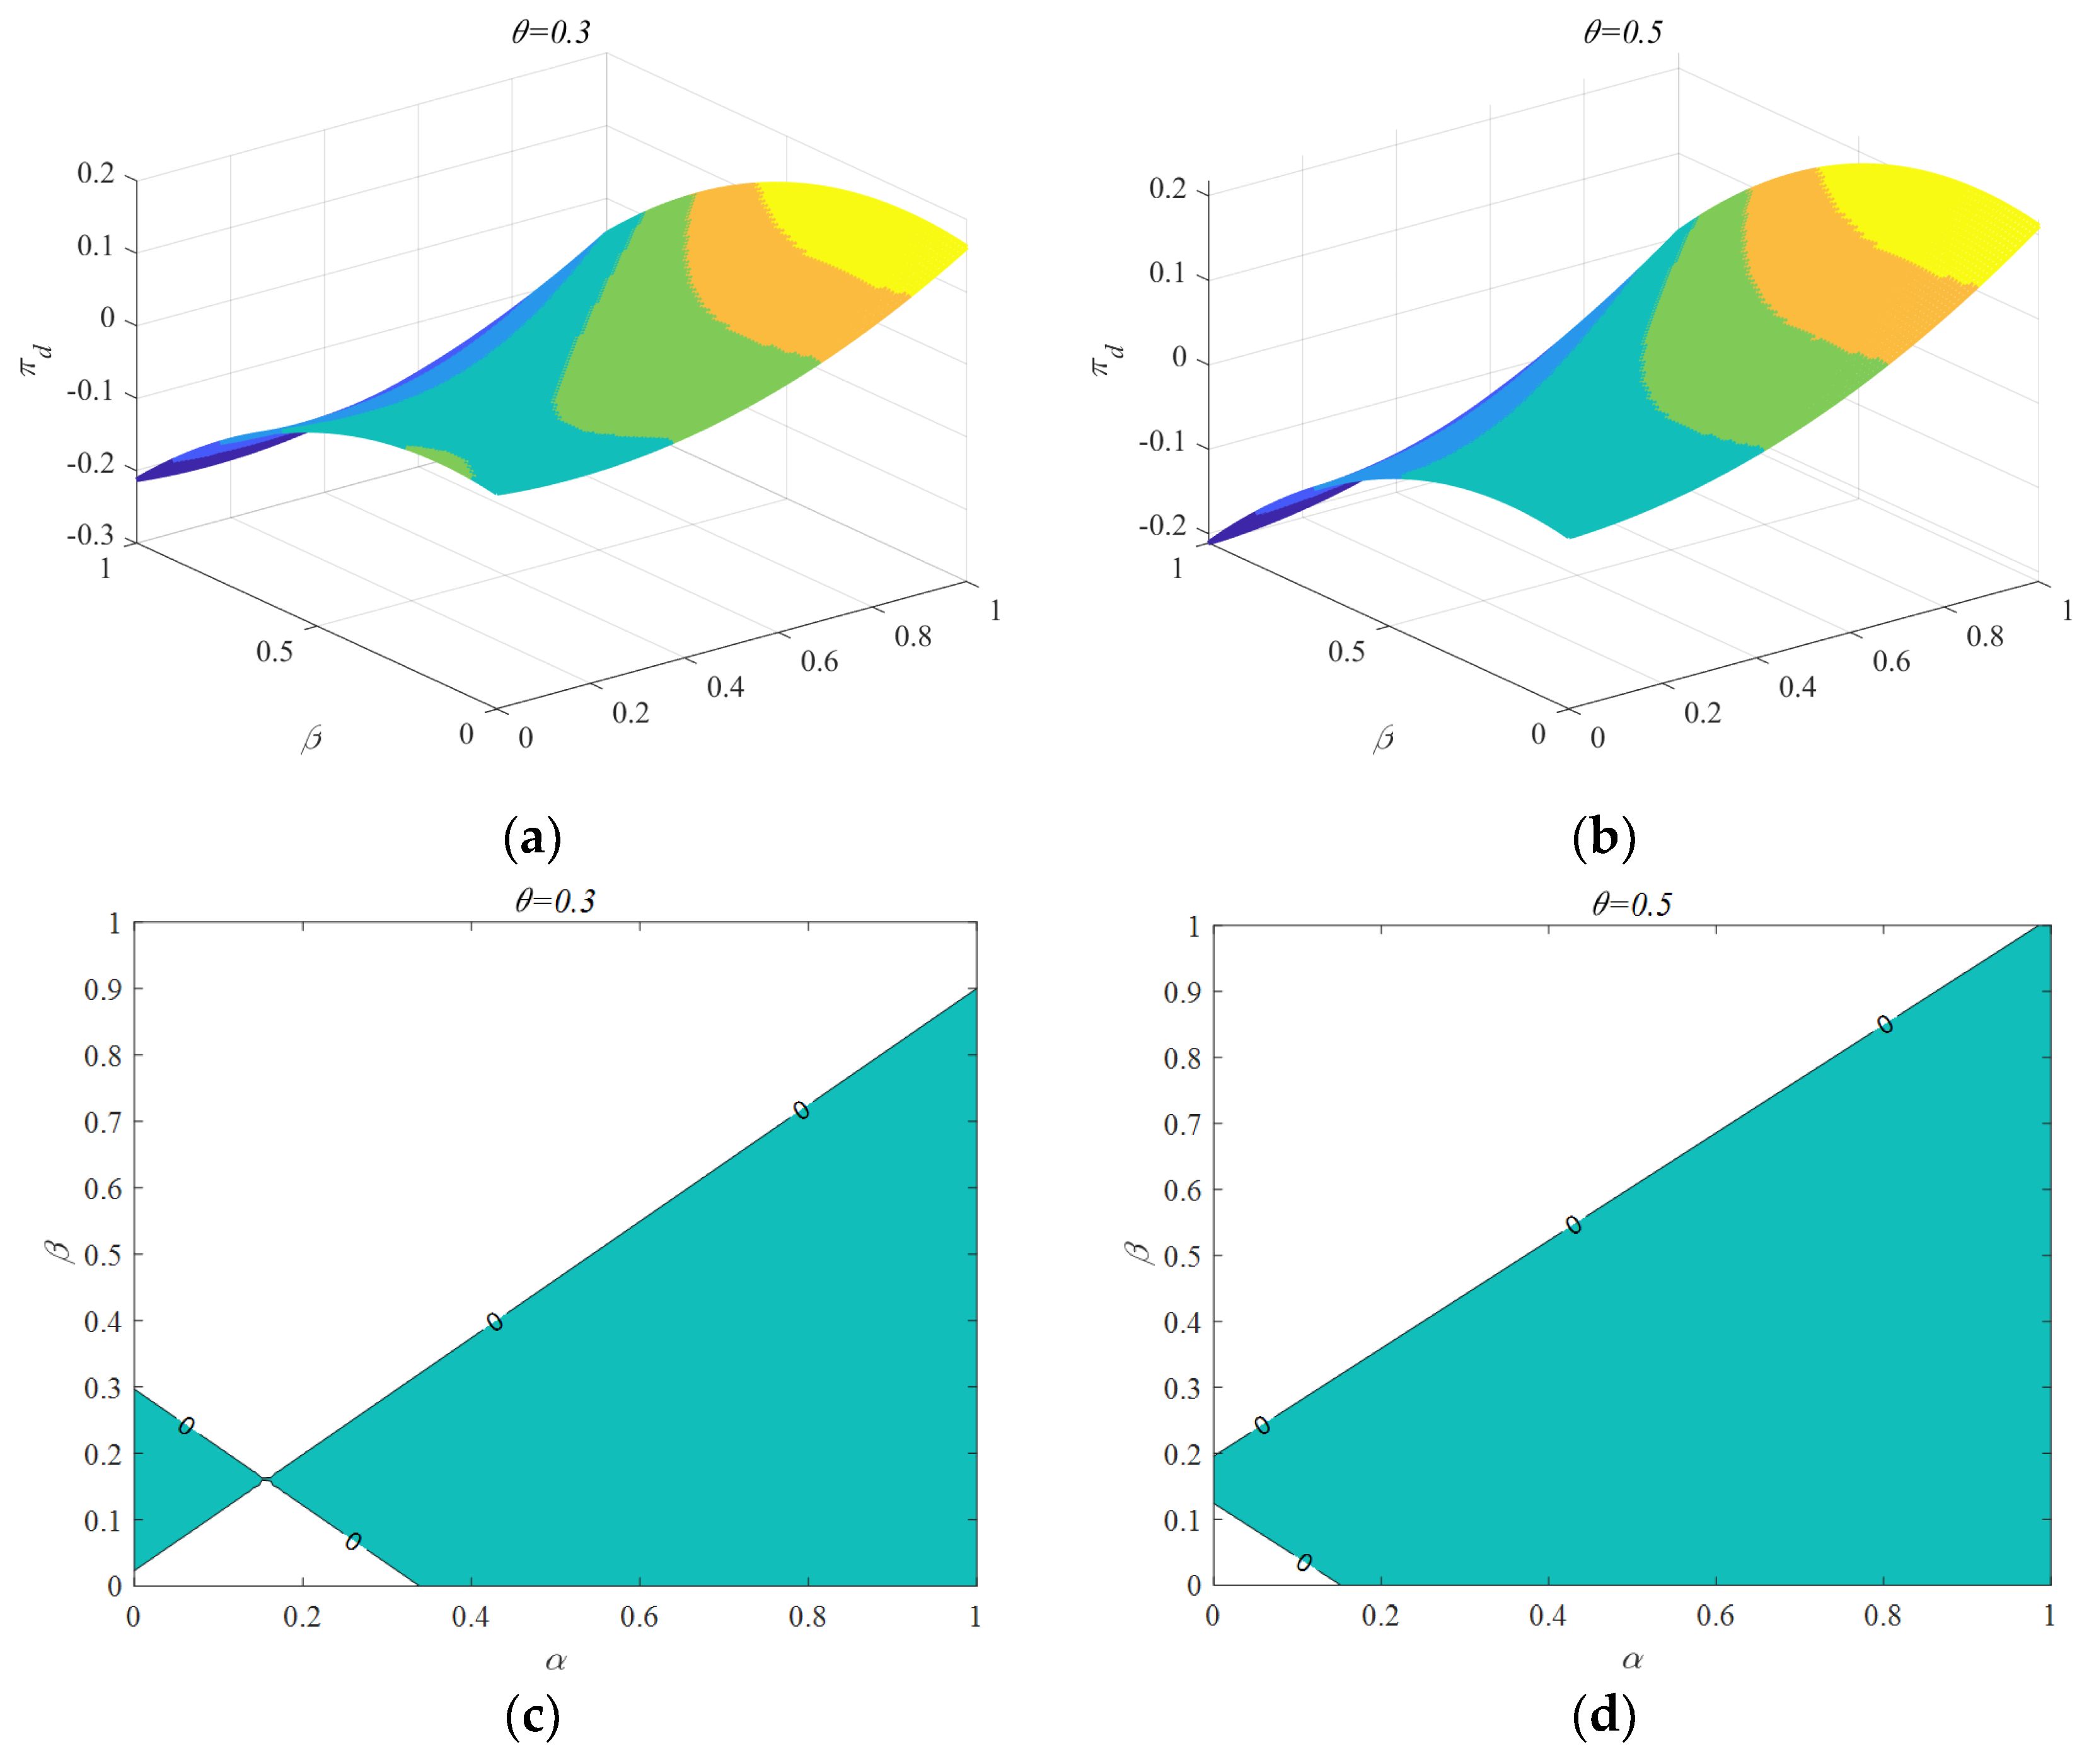
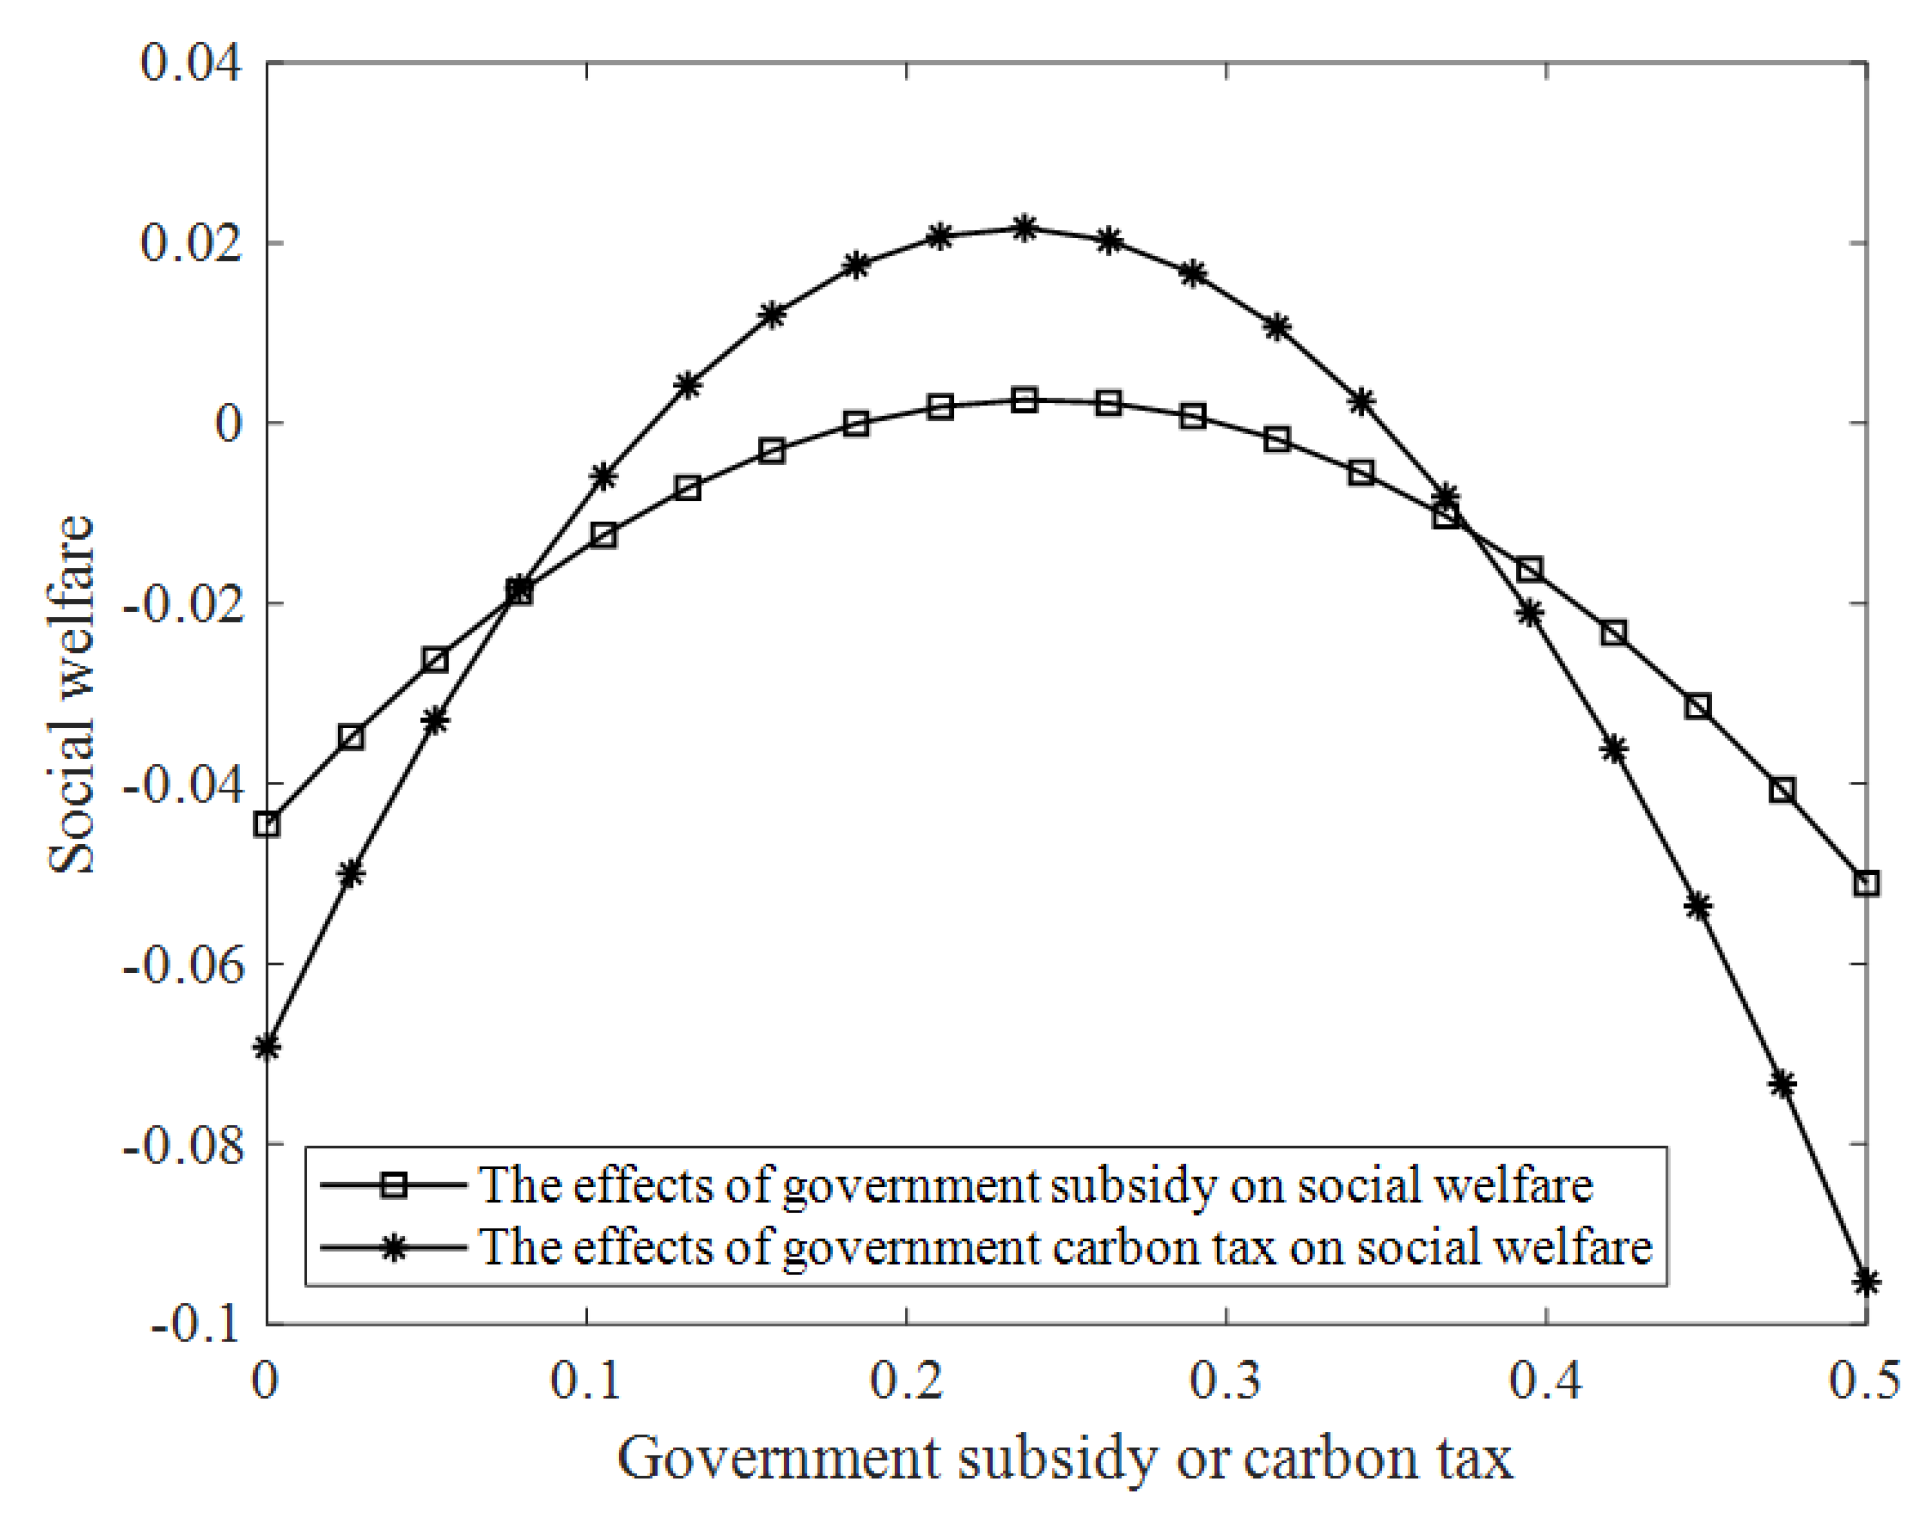
5.3. Effects of the Government Subsidy α and Carbon Tax β

Figure 7a,b are obtained based on parameters: c l = 1.4 , c t = 0.8 , α = 0.126 , β = 0.1 , r l = 0.04 , r t = 0.05 , and θ = 0.42 Figure 7a,b, respectively, reveal the impact of government subsidies and carbon taxes on manufacturers’ profits. First of all, it is seen from Figure 7a that the profit of an L-type manufacturer is much less than that of a T-type manufacturer until the subsidy α exceeds a threshold of 0.11. This is because too little subsidy for low-carbon products cannot make up the higher cost of production and will even encourage the manufacturer to retreat from L-type to T-type. It is contrary to the direction of social and environmental development, so the government subsidy for low-carbon products should be reasonable and cautious to be effective. In Figure 7b, the effect of the government carbon tax on profit is divided into three parts. When β < 0.11   and   β > 0.22 , the profit of the T-type manufacturer is greater than that of the L-type manufacturer, and the middle part is that the profit of the L-type manufacturer is greater than that of the T-type manufacturer. In order to create a sustainable economy, the government can set the tax per unit of traditional products between 0.11 and 0.22. Under the dual policy of subsidy and carbon tax, T-type manufacturers are forced by various pressures to make low-carbon transformations to survive.
Figure 7a,b mainly examine how a single factor, such as a government subsidy or carbon tax, affects the manufacturers’ profits. In practice, both factors can affect the manufacturers’ profits under different consumers’ LCA. This is what we achieve in Figure 8. Figure 8a–d is obtained based on the parameters: c l = 1.4 , c t = 0.8 , r l = 0.04 , and   r t = 0.05 with the difference being θ = 0.3 in Figure 8a,c and θ = 0.5 in Figure 8b,d. It can be observed from Figure 8a,b that under the low-carbon awareness of different consumers, the profit margin of manufacturers (profit of L-type manufacturers minus profit of T-type manufacturers) will be less than 0 in some cases. This indicates that the profit of L-type manufacturers is less than that of T-type manufacturers. Therefore, the government can actively guide consumers to raise LCA to make the profit of L-type manufacturers greater than that of T-type manufacturers, and the manufacturer can be encouraged to choose low-carbon manufacturing and develop a green low-carbon economy.
To express the effects of subsidies and carbon taxes more intuitively and clearly on profits, we draw a two-dimensional graph shown in Figure 8c,d. The white area indicates that the profit of the L-type manufacturer is less than that of the T-type manufacturer. When consumers become more aware of low-carbon products, the area of the shadow gradually becomes larger, which means that L-type manufacturers have more advantages. Therefore, if the consumers’ LCA is low, the government is advised to reasonably adjust the intensity of subsidies and carbon taxes so as to guide the manufacturer to produce low-carbon products.
Figure 9 is obtained based on the parameters: c l = 1.4 , c t = 0.8 , β = 0.1 , r l = 0.04 , r t = 0.05 , and θ = 0.42 Figure 9 reveals that both subsidies and carbon taxes can maximize social welfare. The difference is that social welfare with a carbon tax is higher than that with a subsidy. In addition, it is also found that social welfare is positive when α ( 0.2 , 0.3 ) or β ( 0.12 , 0.35 ) , which can be regarded as an important reference for the government to regulate the subsidy and carbon tax policies. Moreover, combining manufacturer profits with social welfare, the study finds that social welfare is positive and that the low-carbon strategy is the dominant strategy for manufacturers when α ( 0.2 , 0.3 ) and β ( 0.12 , 0.22 ) .

6. Conclusions

This section includes two parts. The first subsection briefly discusses and summarizes the main conclusions of this study. The second subsection presents the limitations and future research of this paper.

6.1. Discussion and Conclusions

This paper innovatively targets the operational decision-making strategies of financially constrained manufacturers, i.e., one low-carbon manufacturer and one traditional manufacturer, in the context of low-carbon living under green policies and the related corporate strategy strategies. It examines the operational strategies of green supply chain entities in the presence of subsidies and carbon taxes issued by the government. With this research feature, comparisons are conducted, and operational decisions and performance are confirmed across different scenarios. The study is of practical significance as basic research and has a certain guiding value for the future. And the managerial insights are concluded as follows:
Firstly, from the perspective of consumers, both the price of low-carbon and traditional products first increases and then decreases the consumers’ LCA. The slight difference lies in the fact that a higher threshold of the net expenditure of products should be satisfied for the low-carbon product’s price to switch from an increasing tendency to a decreasing tendency. Compared with traditional products, consumers have a greater tolerance for price increases for low-carbon products. The price fluctuation of low-carbon products is greater than that of traditional products due to consumers’ low-carbon awareness. Moreover, the selling price increases with the interest rate, regardless of whether it is a low-carbon interest rate or a traditional one. Differently, the selling quantity decreases at its own interest rate and increases in the competitor’s interest rate.
Secondly, the quantity comparisons between low-carbon products and traditional ones are closely related to their production expenditures. To be specific, it is a wise choice to produce more low-carbon products when producing low-carbon products is cost-effective. When producing low-carbon items is costly, producing more low-carbon products is still a dominant strategy until the expenditure difference between low-carbon and traditional ones exceeds a certain threshold.
Thirdly, the manufacturer’s selection of low-carbon production is closely affected not only by the production cost but also by the LCA. When the expenditure of low-carbon production is moderate, with the increase in consumers’ LCA, the manufacturer first prefers the traditional strategy and then the low-carbon one. When the expenditure on low-carbon production stays at a low or high level, the low-carbon strategy always dominates the traditional one with a certain expression of satisfaction. Finally, it is found that, based on the findings of this paper, both subsidies and carbon taxes maximize the social welfare function under the model in this paper, but the social welfare gained from penalizing each unit of conventional products far exceeds the social welfare gained from subsidizing each unit of low-carbon products, and therefore the carbon tax approach is a more effective mechanism in comparison.

6.2. Research Limitation and Future Work

This work has some limitations. Firstly, the demand function in this paper is obtained from the utility function, which is a deterministic demand, but today’s market is fast-changing, so the related research under uncertain demand will be closer to reality. Secondly, the financing model in this paper is only bank financing, which can be extended to include related financing provided by other financial institutions. In addition, the impact of asymmetric information on low-carbon strategies can be explored in depth when members of the supply chain hold different information. In response to the limitations mentioned above, this research can be further extended in the following aspects: Firstly, for the demand function part, we can use more realistic methods such as robust optimization to determine its actual demand. Secondly, the problem of financing small and medium enterprises being difficult and expensive is a classical issue, as a result of which the study of financing strategy is a valuable topic needing sustained attention. Thirdly, in order to tackle the information asymmetry problem, new research on supply chain alliances has emerged, in which the stakeholders in the supply chain are no longer competing independently but instead form a supply chain alliance with interoperability of information in order to maximize the common interests of the whole alliance. Therefore, supply chain alliances are another important issue to be discussed.

Author Contributions

Methodology, Y.Z., M.W., J.Z. and P.L.; Software, M.W. and P.L.; Validation, J.Z.; Formal analysis, Y.Z. and J.Z.; Writing—original draft, M.W. and Y.Z.; Writing—review & editing, J.Z. and T.S. All authors have read and agreed to the published version of the manuscript.

Funding

This work was partially supported by the Shaanxi Science and Technology Department of China (grant number 2023-JC-QN-0093) and the Foundation of China’s Ministry of Education (grant number 22YJCZH107).

Data Availability Statement

No new data were created or analyzed in this study. Data sharing is not applicable to this article.

Acknowledgments

We would like to thank the editor and the anonymous reviewers for their constructive comments that helped us improve the quality of the paper considerably. The authors are grateful for the financial support. All the authors of this thesis agree with this above.

Conflicts of Interest

The authors declare no conflict of interest.

Appendix A

  • Proof of Proposition 1.
For ease of calculation, denote m = c l α + c l r l and n = c t + β + c t r t . Then the equilibrium solutions can be expressed as p t = θ + m + 2 ( θ + 1 ) n 4 θ + 3 , p l = ( θ + 1 ) ( 2 θ + 2 m + n ) 4 θ + 3 , q l = ( θ + 1 ) ( 2 θ + n ) ( 2 θ + 1 ) m θ ( 4 θ + 3 ) , and q t = ( θ + 1 ) [ θ + m ( 2 θ + 1 ) n ] θ ( 4 θ + 3 ) .
The first derivates of prices with respect to θ can be calculated as p t θ = 3 4 m 2 n ( 4 θ + 3 ) 2 = 3 2 ( 2 m n ) ( 4 θ + 3 ) 2 , p l θ = 8 θ 2 + 12 θ + 6 2 m n ( 4 θ + 3 ) 2 = 8 ( θ + 3 4 ) 2 + 3 2 2 m n ( 4 θ + 3 ) 2 = f 1 ( θ ) 2 m n ( 4 θ + 3 ) 2 . It can be seen that 0 < 2 m + n < 3 2 can ensure p t θ > 0 . The price p t of the traditional product is positively correlated with consumers’ LCA θ for 0 < 2 m + n < 3 2 , and negatively correlated otherwise. Similarly, it can be seen that 2 m + n < 8 ( θ + 3 4 ) 2 + 3 2 f 1 ( θ ) can ensure p l θ > 0 . That is to say p l is positively correlated with θ for 2 m + n < f 1 ( θ ) and negatively correlated otherwise. Thus, Proposition 1 table can be obtained. □
  • Proof of Proposition 2.
The first derivates of quantities with respect to θ can be obtained as q t θ = ( n m ) ( 4 θ 2 + 8 θ + 3 ) + ( 2 n 1 ) θ 2 [ θ ( 4 θ + 3 ) ] 2 and q l θ = ( n m ) ( 4 θ 2 + 8 θ + 3 ) + 2 ( 2 m 1 ) θ 2 [ θ ( 4 θ + 3 ) ] 2 .
(i)
For n < m < 1 2 , the expression of q t θ < 0 always holds. The expression of q l θ > 0 holds for m n > ( 1 2 m ) 2 θ 2 4 θ 2 + 8 θ + 3 f 3 ( θ ) .
(ii)
For n < 1 2 < m , the expressions of q t θ < 0 and q l θ > 0 always hold.
(iii)
For 1 2 < n < m , the expression of q l θ > 0 holds. The expression of q t θ > 0 holds for 0 < m n < ( 2 n 1 ) θ 2 4 θ 2 + 8 θ + 3 f 2 ( θ ) .
Then, Table 2 and Table 3 can be obtained. □
  • Proof of Proposition 3.
The first derivates of quantities and prices with respect to r t and r l can be calculated as p t r t = 2 ( 1 + θ ) c t 4 θ + 3 > 0 , p l r t = ( 1 + θ ) c t 4 θ + 3 > 0 , p t r l = c l 4 θ + 3 > 0 , p l r l = 2 ( 1 + θ ) c l 4 θ + 3 > 0 , q l r t = ( 1 + θ ) c t ( 4 θ + 3 ) θ > 0 , q l r l = ( 1 + 2 θ ) c l ( 4 θ + 3 ) θ < 0 , q t r l = ( 1 + θ ) c l ( 4 θ + 3 ) θ > 0 , and q t r t = ( 2 θ + 1 ) c t 4 θ + 3 < 0 . □
  • Proof of Proposition 4.
From the proof of Proposition 3, we can obtain that q l q t = θ ( m + 1 + 2 n θ + θ ) ( m n ) ( 4 θ + 2 ) θ ( 4 θ + 3 ) . Therefore, the expression of q l q t > 0 always holds for m < n . Otherwise, for m > n , we can obtain q l q t > 0 for 0 < m n < θ ( m + 1 + 2 n θ + θ ) 4 θ + 2 and q l q t < 0 for m n > θ ( m + 1 + 2 n θ + θ ) 4 θ + 2 . □
  • Proof of Proposition 5.
The difference between the profits of T-type manufacturer and L-type manufacturer is written as π d = π l π t = θ 2 + ( m 1 ) ( m 1 2 β ) ( n 1 ) 2 ( β + 1 ) 4 θ + 3 . Denote f ( m , n ) ( n 1 ) 2 ( 1 + β ) ( m 1 ) ( m 1 2 β ) . Then, the expression of π l π t can be rewritten as θ 2 f ( m , n ) 4 θ + 3 .
(i)
When 1 < m < 1 + 2 β , then f ( m , n ) > 0 always holds. Therefore, π l π t < 0 for θ ( 0 , f ( m , n ) and π l π t > 0 for θ ( f ( m , n ) , 1 ) .
(ii)
When m < 1 or m > 1 + 2 β and ( n 1 ) 2 ( 1 + β ) > ( m 1 ) ( m 1 2 β ) , then f ( m , n ) > 0 holds. Therefore, π l π t < 0 for θ ( 0 , f ( m , n ) and π l π t > 0 otherwise.
(iii)
When m < 1 or m > 1 + 2 β and ( n 1 ) 2 ( 1 + β ) < ( m 1 ) ( m 1 2 β ) , then f ( m , n ) < 0 holds and π l π t > 0 always holds.
Then, Proposition 5 can be obtained. □
  • Proof of Lemma 1.
From 2 w α 2 = 4 θ 3 8 θ 2 6 θ 2 16 θ 4 + 24 θ 3 + 9 θ 2 < 0 , we know that social welfare is a concave function of government subsidy, so the optimal solution of α is obtained at the zero point of first-order derivative. β can be obtained similarly. Then Lemma 1 can be derived. □

References

  1. Mao, Y.; Wang, J. Is Green Manufacturing Expensive? Empirical Evidence from China. Int. J. Prod. Res. 2019, 57, 7235–7247. [Google Scholar] [CrossRef]
  2. Aoki, K.; Akai, K. Do Consumers Select Food Products Based on Carbon Dioxide Emissions? In Advances in Production Management Systems. Competitive Manufacturing for Innovative Products and Services: IFIP WG 5.7 International Conference, APMS 2012, Rhodes, Greece, September 24–26, 2012, Revised Selected Papers, Part II; Emmanouilidis, C., Taisch, M., Kiritsis, D., Eds.; Springer: Berlin/Heidelberg, Germany, 2013; pp. 345–352. Available online: http://link.springer.com/10.1007/978-3-642-40361-3_44 (accessed on 3 July 2023).
  3. Benkhodja, M.T.; Ma, X.; Razafindrabe, T. Green Monetary and Fiscal Policies: The Role of Consumer Preferences. Resour. Energy Econ. 2023, 73, 101370. [Google Scholar] [CrossRef]
  4. Ricky, Y.K.C.; Lau, L.B.Y. Explaining Green Purchasing Behavior. J. Int. Consum. Mark. 2002, 14, 9–40. [Google Scholar]
  5. Hines, J.M.; Hungerford, H.R.; Tomera, A.N. Analysis and Synthesis of Research on Responsible Environmental Behavior: A Meta-Analysis. J. Environ. Educ. 1987, 18, 1–8. [Google Scholar] [CrossRef]
  6. Meng, X.; Yao, Z.; Nie, J.; Zhao, Y.; Li, Z. Low-Carbon Product Selection with Carbon Tax and Competition: Effects of the Power Structure. Int. J. Prod. Econ. 2018, 200, 224–230. [Google Scholar] [CrossRef]
  7. Deng, Z.; Lv, L.; Huang, W.; Wan, L.; Li, S. Modelling of Carbon Utilisation Efficiency and Its Application in Milling Parameters Optimisation. Int. J. Prod. Res. 2020, 58, 2406–2420. [Google Scholar] [CrossRef]
  8. Wang, Y.; Yu, Z.; Jin, M.; Mao, J. Decisions and Coordination of Retailer-Led Low-Carbon Supply Chain under Altruistic Preference. Eur. J. Oper. Res. 2021, 293, 910–925. [Google Scholar] [CrossRef]
  9. Lin, J.; Fan, R.; Tan, X.; Zhu, K. Dynamic Decision and Coordination in a Low-Carbon Supply Chain Considering the Retailer’s Social Preference. Socio-Econ. Plan. Sci. 2021, 77, 101010. [Google Scholar] [CrossRef]
  10. Heydari, J.; Govindan, K.; Basiri, Z. Balancing Price and Green Quality in Presence of Consumer Environmental Awareness: A Green Supply Chain Coordination Approach. Int. J. Prod. Res. 2021, 59, 1957–1975. [Google Scholar] [CrossRef]
  11. Zhang, Q.; Zhao, Q.; Zhao, X. Manufacturer’s Product Choice in the Presence of Environment-Conscious Consumers: Brown Product or Green Product. Int. J. Prod. Res. 2019, 57, 7423–7438. [Google Scholar] [CrossRef]
  12. Gao, F.; Souza, G.C. Carbon Offsetting with Eco-Conscious Consumers. Manag. Sci. 2022, 68, 7879–7897. [Google Scholar] [CrossRef]
  13. Wang, Z.; Wu, Q. Carbon Emission Reduction and Product Collection Decisions in the Closed-Loop Supply Chain with Cap-and-Trade Regulation. Int. J. Prod. Res. 2021, 59, 4359–4383. [Google Scholar] [CrossRef]
  14. Ji, T.; Xu, X.; Yan, X.; Yu, Y. The Production Decisions and Cap Setting with Wholesale Price and Revenue Sharing Contracts under Cap-and-Trade Regulation. Int. J. Prod. Res. 2020, 58, 128–147. [Google Scholar] [CrossRef]
  15. Liu, J.; Ke, H. Firms’ Preferences for Retailing Formats Considering One Manufacturer’s Emission Reduction Investment. Int. J. Prod. Res. 2021, 59, 3062–3083. [Google Scholar] [CrossRef]
  16. Huang, S.; Fan, Z.P.; Wang, N. Green Subsidy Modes and Pricing Strategy in a Capital-Constrained Supply Chain. Transp. Res. Part E Logist. Transp. Rev. 2020, 136, 101885. [Google Scholar] [CrossRef]
  17. Jing, B.; Chen, X.; Cai, G. Equilibrium Financing in a Distribution Channel with Capital Constraint. Prod. Oper. Manag. 2012, 21, 1090–1101. [Google Scholar] [CrossRef]
  18. Kouvelis, P.; Zhao, W. Supply Chain Contract Design Under Financial Constraints and Bankruptcy Costs. Manag. Sci. 2016, 62, 2341–2357. [Google Scholar] [CrossRef]
  19. Whitmore, G.A.; Darkazanli, S. A Linear Risk Constraint in Capital Budgeting. Manag. Sci. 1971, 18, B-155. [Google Scholar] [CrossRef]
  20. Xu, S.; Fang, L. Partial Credit Guarantee and Trade Credit in an Emission-Dependent Supply Chain with Capital Constraint. Transp. Res. Part E Logist. Transp. Rev. 2020, 135, 101859. [Google Scholar] [CrossRef]
  21. Wang, Y.; Lv, L.; Shen, L.; Tang, R. Manufacturer’s Decision-Making Model under Carbon Emission Permits Repurchase Strategy and Capital Constraints. Int. J. Prod. Res. 2021, 1–19. [Google Scholar] [CrossRef]
  22. Cao, E.; Du, L.; Ruan, J. Financing Preferences and Performance for an Emission-Dependent Supply Chain: Supplier vs. Bank. Int. J. Prod. Econ. 2019, 208, 383–399. [Google Scholar] [CrossRef]
  23. Cao, E.; Yu, M. The Bright Side of Carbon Emission Permits on Supply Chain Financing and Performance. Omega 2019, 88, 24–39. [Google Scholar] [CrossRef]
  24. Cai, G.; Chen, X.; Xiao, Z. The Roles of Bank and Trade Credits: Theoretical Analysis and Empirical Evidence. Prod. Oper. Manag. 2014, 23, 583–598. [Google Scholar] [CrossRef]
  25. Deng, S.; Gu, C.; Cai, G.; Li, Y. Financing Multiple Heterogeneous Suppliers in Assembly Systems: Buyer Finance vs. Bank Finance. Manuf. Serv. Oper. Manag. 2018, 20, 53–69. [Google Scholar] [CrossRef]
  26. Gupta, D.; Chen, Y. Retailer-Direct Financing Contracts Under Consignment. Manuf. Serv. Oper. Manag. 2020, 22, 528–544. [Google Scholar] [CrossRef]
  27. Kouvelis, P.; Zhao, W. Financing the Newsvendor: Supplier vs. Bank, and the Structure of Optimal Trade Credit Contracts. Oper. Res. 2012, 60, 566–580. [Google Scholar] [CrossRef]
  28. Kouvelis, P.; Zhao, W. Who Should Finance the Supply Chain? Impact of Credit Ratings on Supply Chain Decisions. Manuf. Serv. Oper. Manag. 2018, 20, 19–35. [Google Scholar] [CrossRef]
  29. Zhang, Z.C.; Xu, H.Y.; Chen, K.B. Operational Decisions and Financing Strategies in a Capital-Constrained Closed-Loop Supply Chain. Int. J. Prod. Res. 2021, 59, 4690–4710. [Google Scholar] [CrossRef]
  30. Xia, T.; Wang, Y.; Lv, L.; Shen, L.; Cheng, T.C.E. Financing Decisions of Low-Carbon Supply Chain under Chain-to-Chain Competition. Int. J. Prod. Res. 2022, 61, 6153–6176. [Google Scholar] [CrossRef]
  31. Cong, J.; Pang, T.; Peng, H. Optimal Strategies for Capital Constrained Low-Carbon Supply Chains under Yield Uncertainty. J. Clean. Prod. 2020, 256, 120339. [Google Scholar] [CrossRef]
  32. Qin, J.; Han, Y.; Wei, G.; Xia, L. The Value of Advance Payment Financing to Carbon Emission Reduction and Production in a Supply Chain with Game Theory Analysis. Int. J. Prod. Res. 2020, 58, 200–219. [Google Scholar] [CrossRef]
  33. Shao, L.; Yang, J.; Zhang, M. Subsidy Scheme or Price Discount Scheme? Mass Adoption of Electric Vehicles under Different Market Structures. Eur. J. Oper. Res. 2017, 262, 1181–1195. [Google Scholar] [CrossRef]
  34. Bao, B.; Ma, J.; Goh, M. Short-and Long-Term Repeated Game Behaviours of Two Parallel Supply Chains Based on Government Subsidy in the Vehicle Market. Int. J. Prod. Res. 2020, 58, 7507–7530. [Google Scholar] [CrossRef]
  35. Bai, J.; Hu, S.; Gui, L.; So, K.C.; Ma, Z.J. Optimal Subsidy Schemes and Budget Allocations for Government-Subsidized Trade-in Programs. Prod. Oper. Manag. 2021, 30, 2689–2706. [Google Scholar] [CrossRef]
  36. Luo, R.; Zhou, L.; Song, Y.; Fan, T. Evaluating the Impact of Carbon Tax Policy on Manufacturing and Remanufacturing Decisions in a Closed-Loop Supply Chain. Int. J. Prod. Econ. 2022, 245, 108408. [Google Scholar] [CrossRef]
  37. Bai, Q.; Xu, J.; Chauhan, S.S. Effects of Sustainability Investment and Risk Aversion on a Two-Stage Supply Chain Coordination under a Carbon Tax Policy. Comput. Ind. Eng. 2020, 142, 106324. [Google Scholar] [CrossRef]
  38. Sun, H.; Yang, J. Optimal Decisions for Competitive Manufacturers under Carbon Tax and Cap-and-Trade Policies. Comput. Ind. Eng. 2021, 156, 107244. [Google Scholar] [CrossRef]
  39. Fan, X.; Chen, K.; Chen, Y.J. Is Price Commitment a Better Solution to Control Carbon Emissions and Promote Technology Investment? Manag. Sci. 2023, 69, 325–341. [Google Scholar] [CrossRef]
  40. Xia, X.; Xu, C. A Comparative Study on the Impact of Government Carbon Tax and Subsidy Policies on Low-Carbon Supply Chains. Oper. Res. Manag. 2020, 29, 112–120. [Google Scholar]
  41. Bian, J.; Zhao, X. Tax or Subsidy? An Analysis of Environmental Policies in Supply Chains with Retail Competition. Eur. J. Oper. Res. 2020, 283, 901–914. [Google Scholar] [CrossRef]
  42. Moorthy, K.S. Product and Price Competition in a Duopoly. Mark. Sci. 1988, 7, 141–168. [Google Scholar] [CrossRef] [Green Version]
  43. Sun, C.; Zhang, X.; Zhou, Y.W.; Cao, B. Pricing, Financing and Channel Structure for Capital-Constrained Dual-Channel Supply Chains with Product Heterogeneity. Int. J. Prod. Econ. 2022, 253, 108591. [Google Scholar] [CrossRef]
  44. Wu, C.; Li, K.; Shi, T. Supply Chain Coordination with Two-Part Tariffs under Information Asymmetry. Int. J. Prod. Res. 2017, 55, 2575–2589. [Google Scholar] [CrossRef] [Green Version]
  45. Xu, L.; Wang, C.; Zhao, J. Decision and Coordination in the Dual-Channel Supply Chain Considering Cap-and-Trade Regulation. J. Clean. Prod. 2018, 197, 551–561. [Google Scholar] [CrossRef]
  46. Yang, H.; Miao, L.; Zhao, C. The Credit Strategy of a Green Supply Chain Based on Capital Constraints. J. Clean. Prod. 2019, 224, 930–939. [Google Scholar] [CrossRef]
  47. Zhou, Y.; Hu, F.; Zhou, Z. Pricing Decisions and Social Welfare in a Supply Chain with Multiple Competing Retailers and Carbon Tax Policy. J. Clean. Prod. 2018, 190, 752–777. [Google Scholar] [CrossRef]
  48. Pal, R.; Saha, B. Pollution Tax, Partial Privatization and Environment. Resour. Energy Econ. 2015, 40, 19–35. [Google Scholar] [CrossRef] [Green Version]
  49. Circular of the Ministry of Finance and the State Administration of Taxation on the Implementation of Coal Resource Tax Reform. Available online: http://www.chinatax.gov.cn/chinatax/n364/c481369/content.html (accessed on 7 July 2023).
  50. Interpretation of the Circular of the Ministry of Finance, the Ministry of Industry and Information Technology, the Ministry of Science and Technology and the Development and Reform Commission on Further Improving the Financial Subsidy Policy for the Promotion and Application of New Energy Vehicles_Policy Interpretation_Chinese Government Website. Available online: https://www.gov.cn/zhengce/2020-12/31/content_5575908.htm (accessed on 7 July 2023).
Figure 1. Different behaviors of heterogeneous consumers.
Sustainability 15 11779 g001
Figure 2. Effects of θ on price and production quantity. (a) Effects of θ on price. (b) Effects of θ on quantity.
Sustainability 15 11779 g002
Figure 3. Effects of interest rate on price and quantity. (a) Effects of interest rate on price. (b) Effects of interest rate on quantity.
Sustainability 15 11779 g003
Figure 4. Effects of θ on qlqt.
Sustainability 15 11779 g004
Figure 5. Effects of θ on profit.
Sustainability 15 11779 g005
Figure 6. Effects of financing rate on manufacturer’s profit. (a) Effects of rt on profit. (b) Effects of rl on profit.
Sustainability 15 11779 g006
Figure 7. Effects of government subsidy and carbon tax on manufacturer’s profit. (a) Effects of α on profit. (b) Effects of β on profit.
Sustainability 15 11779 g007
Figure 8. The effects of α and β on the manufacturers’ profits difference with different LCA. (a) Profit difference with θ = 0.3. (b) Profit difference with θ = 0.5. (c) Profit difference with θ = 0.3. (d) Profit difference with θ = 0.5. The zone with and without highlighted color represents the values of profits difference is greater or less than zero, respectively.
Sustainability 15 11779 g008
Figure 9. Effects of government subsidy and carbon tax on social welfare.
Sustainability 15 11779 g009
Table 1. Differences between studies.
PaperCapital ConstraintsFinancing MethodCarbon Subsidy PolicyCarbon Tax PolicyCarbon Cap-and-TradeResearch Methodology
Research TheorySpecific Modelling
[21]Carbon Emission Permits Repurchase Strategy (CEPRS) Game theoryStackelberg game
[30]bank financing and internal financing Game theoryStackelberg game,
Nash game
[31]green credit financing Game theoryStackelberg game
[32]supplier, platform or hybrid financing models Planning theoryStochastic Programming
[38] Game theoryStackelberg game,
Nash game
[39] Decision theoryTwo-stage optimization
[40] Game theoryNash game
This papergeneral and green bank credit financing Game theoryStackelberg game
Table 2. The impact of consumers’ LCA on prices.
0 < 2 m + n < 3 2 3 2 < 2 m + n < f 1 ( θ ) 2 m + n > f 1 ( θ )
p t θ +
p l θ ++
Notation: f 1 ( θ ) = 8 ( θ + 3 4 ) 2 + 3 2 > 3 2 . m = c l α + c l r l and n = c t + β + c t r t represent the net expense of low-carbon products and traditional products, respectively.
Table 3. Effect of consumers’ LCA on demand when n < m .
n < m < 1 2 n < 1 2 < m 1 2 < n < m
0 < m n < f 3 ( θ ) m n > f 3 ( θ ) 0 < m n < f 2 ( θ ) m n > f 2 ( θ )
q l θ +++
q t θ +
Table 4. Effect of consumers’ LCA on demand when n > m .
m < n < 1 2 m < 1 2 < n 1 2 < m < n
0 < m n < f 2 ( θ ) m n > f 2 ( θ ) 0 < m n < f 3 ( θ ) m n > f 3 ( θ )
q l θ +
q t θ +++
Notation: f 2 ( θ ) = ( 2 n 1 ) θ 2 4 θ 2 + 8 θ + 3 ; f 3 ( θ ) = ( 1 2 m ) 2 θ 2 4 θ 2 + 8 θ + 3 ; m represents the net expense of low-carbon products and n represents the net expense of traditional products.
Disclaimer/Publisher’s Note: The statements, opinions and data contained in all publications are solely those of the individual author(s) and contributor(s) and not of MDPI and/or the editor(s). MDPI and/or the editor(s) disclaim responsibility for any injury to people or property resulting from any ideas, methods, instructions or products referred to in the content.

