1. Introduction
Tourism is considered a primary source of income for many countries, especially in developing countries like Thailand, where tourism revenue accounted for 17.79% of GDP in 2019, with an average growth rate of 0.04% [
1]. However, the COVID-19 pandemic has significantly impacted the number of tourists [
2] due to domestic and international tourism preventive measures, such as lockdowns, capacity limits in shops, and social distancing [
3]. Wu et al. [
4] have confirmed that city lockdowns have a significant impact on the economy.
Currently, it is evident that the coronavirus has not been eradicated; rather, mutations have emerged, causing a focus on the spread of infection rather than its severity [
5]. Therefore, some countries may declare themselves endemic [
6]. It is necessary to analyze the differences in tourist behavior between these two situations. The first situation refers to the epidemic period, starting from the official announcement of the emergency (since 25 March 2019), during which the agency responsible for controlling the coronavirus enforced measures such as city lockdowns and the regulation of shop and hotel operations. The post-epidemic period is measured by the relaxation of mask-wearing mandates and the cancellation of emergency public administration, which occurred on 1 October 2022 [
7]. These two situations differ significantly and may affect tourism motivation and behavior. Dwivedi et al. [
8] have found that during the COVID-19 pandemic, the emotional aspect of attitude strongly influenced travel decisions.
There have been several tourism research studies analyzing the situation during COVID. For example, Nguyen et al. [
9] studied the role of trust in government performance on travel intentions in Vietnam. Vukomanovic et al. [
10] analyzed the decision-making process regarding whether to travel or not during the COVID-19 situation in the USA. People who choose to travel have various factors to consider, such as government policies in each state and safety measures like social distancing and wearing masks, consistent with the study in Nepal by Devkota et al. [
11], which identified health concerns among tourists during the pandemic.
Regarding post-epidemic tourism, Yu et al. [
12] found an increasing trend in domestic tourism in Beijing. Sohn et al. [
13] studied tourists in Korea and observed changes in their decisions different from pre-COVID-19. They discovered that in the post-COVID-19 pandemic, several factors influenced their motivation to travel, including social distancing measures, and noted that travel patterns often involve short-haul destinations. Additionally, Liu and Chong [
14] found that social media content encourages more people to travel in the post-COVID era. Kim and Liu [
15] revealed that social distancing affects purchase intentions in the restaurant and hotel sectors. Hassan et al. [
16] examined the satisfaction of religious tourists in the post-COVID-19 situation.
For the studies comparing pandemic and post-pandemic tourism, Pappas [
17] conducted a longitudinal study (2019, 2020, and 2021) and found that during the COVID epidemic year (2021), tourists had fewer travel intentions. Yang et al. [
18] discovered that during the period of measures, the number of tourists was reduced. Shin et al. [
19] studied the attitudes of Korean travelers, who discovered that there were different views on tourism in two situations, such as tourist trust, travel constraint, and the extended theory of planned behavior. Ali et al. [
20] studied the intention to use smartphones on the tourist shopping journey to compare the period of COVID-19 and non-COVID-19
For a study in Thailand, Leelawat et al. [
21] used machine learning to analyze Twitter data that could identify the tourists’ opinions on their interests during the COVID-19 pandemic. Wongmonta [
22] studied post-COVID-19 tourism recovery. Chansuk et al. [
23] studied post-pandemic travel behavior and found that Thai tourists prefer to initially travel in the country. In addition, there are various factors affecting travel motivation, such as perceived behavioral control, destination knowledge, etc. From the research on behavior and perceptions that influence travel decisions mentioned above, it is evident that most studies focus on a single situation. Only Shin et al. [
19] provide a clear comparison between the during and post-COVID-19 periods, examining both the decision to travel during COVID-19 and future travel intentions after the pandemic.
To ensure the robustness of the causal model development, it was deemed essential to employ the Health Belief Model (HBM) as the foundational framework for constructing the HBM model in this study. This encompassed various facets pertaining to individuals’ health-related practices, incorporating multiple factors anticipated to exert an impact, such as perceived susceptibility, perceived severity, and cues to action, among others. Various studies have applied the HBM in decision-making in different scenarios. For example, Champahom et al. [
24] examined decision-making regarding child restraint use, while Jomnonkwao et al. [
25] focused on the motivation for wearing helmets. Suess et al. [
26] analyzed the benefits of a COVID-19 vaccine based on the HBM. The COVID-19 pandemic and tourism are evidently considered the decision-makings regarding health. Furthermore, a frequently employed method for causal modeling is Structural Equation Modeling (SEM). SEM enables the construction of a comprehensive model to examine causal relationships between latent variables, encompassing both latent and observed variables [
24].
This academic study delves into the exploration of factors, grounded in the Health Belief Model (HBM), and their influence on travel intention and frequency in developing countries. The research seeks to augment the existing literature by conducting a comparative examination of travel behavior between two distinct situations. Specifically, the study categorizes the two situations based on the Royal Gazette announcements, wherein the “during the epidemic” period encompasses the time since the declaration of the emergency decree (25 March 2019), and the “post-epidemic” period represents the time subsequent to the repeal of the Emergency Decree (1 October 2022). Notably, significant differences emerge between these two situations, as the post-epidemic period allows for unrestricted travel for tourists, characterized by the absence of lockdown measures and limitations on the number of tourists in specific locations. Consequently, such differences may potentially influence the attitudes of tourists during these distinct periods.
Moreover, this investigation adopts a psychological modeling theory as its analytical foundation and incorporates various modifying factors to enhance the realism of the model. By addressing the gap in understanding attitudes and perceptions that shape travel behavior in developing countries, particularly during the epidemic and post-epidemic periods, this research aims to furnish valuable insights that can aid in formulating effective post-COVID-19 travel policies and recommendations. This study contributes to the broader discourse on travel behavior during times of crises and holds potential implications for policymakers, tourism authorities, and other stakeholders concerned with promoting sustainable and resilient travel practices in developing countries.
This paper is structured as follows: (1) Introduction: the primary objective of this study is to investigate the impact of various factors on travel intention and frequency in developing countries. (2) The Health Belief Model (HBM): in this section, we provide a comprehensive overview of the HBM and the hypotheses. (3) Materials and Methods: this section presents the research design, including the development of the questionnaire used to collect data. (4) Results: The findings of the study are presented in this section, which includes descriptive statistics and the results of the statistical models. (5) Discussion: In this section, a comprehensive discussion of the results is provided. Each hypothesis is analyzed in detail, evaluating their significance and comparing them with previous research. (6) Conclusion: the final section summarizes the key findings of the research and offers guidelines for implementation.
2. Health Belief Model (HBM)
The Health Belief Model (HBM) is a psychological model used for behavior modification that can explain and predict behavior according to health belief [
27]. The HBM illustrates that people who believe in their health problem and perceived benefits, as well as perceived obstacles, including external factors like cues to action, can influence behavior [
28] (Fundamental theories can be further studied from Champion and Skinner [
29]). The elements of the HBM involve several aspects that contribute to a conceptual framework and hypotheses development (
Figure 1), outlined as follows: Action refers to expressed behavior. In this study, it is interpreted as the frequency of travel both during and after the pandemic.
Perceived susceptibility involves assessing the risk of experiencing problems when deciding to travel, particularly the chance of being infected with COVID-19. For example, questions could include, “You know whenever you travel for tourism, you must always follow preventive measures against the COVID-19 pandemic, such as wearing masks, checking the temperature, washing hands with sanitizer gel or alcohol, or social distancing in queueing for getting service, etc.” Cahyanto et al. [
30] reached a definitive conclusion that the risk factors have undergone extensive examination and have consistently been shown to heighten the level of perceived destination risk among visitors. Consequently, these perceived risks diminish travel incentives, leading to the formulation of:
Hypothesis 1. Perceived susceptibility exhibits a statistically significant negative impact on travel intention.
Perceived severity means the assessment of the severe impact on health resulting from the consequences of the decision. In this case, it refers to the decision to travel and being infected afterwards. This may include the duration of recovery, which requires treatment until it can affect both work and family. An example of question items includes “You know that being infected with the epidemic may result in disabilities or death.” Su et al. [
31] found a substantial positive correlation between the perceived severity and health risk preventive behavior. In other words, if individuals perceive COVID-19 as a highly severe threat, it is likely that travel incentives will diminish. Consequently, we hypothesize the following:
Hypothesis 2. The perceived severity significantly and negatively influences travel intention.
Perceived benefits involve behaviors that result from perceived actions. In this case, it refers to the decision to comply with regulations or measures aiming to prevent the epidemic. This can be assessed by asking questions like, “You think that following the preventive measures against the COVID-19 pandemic makes you feel worthwhile and enjoy traveling for tourism.” Erul et al. [
32] have revealed that there exists a noteworthy positive correlation between oppositional attitudes towards tourism and passive opposition to tourism. This implies that individuals are less inclined to make travel decisions when they hold a negative perception of tourism. Conversely, a positive perception of the advantages of traveling is likely to be associated with a heightened propensity to be encouraged or motivated to travel. As a result, we propose:
Hypothesis 3. Perceived benefits exert a statistically significant positive influence on travel intention.
Perceived barriers refer to the obstacles that arise in decision-making. In this case, it is seen that there are some obstacles that make it uncomfortable to travel without the spread of COVID-19. Question items such as “You feel that the internal facilities in places for tourists, such as restrooms, waiting seats, under the unstrict preventive measures may make you feel uncomfortable.” Devkota et al. [
11] have demonstrated that there is a strong positive correlation between hygiene and safety and the decision to travel. In other words, when hygiene and safety standards are low, it leads to a decrease in the intention to travel. Furthermore, considering the prevalence of COVID-19 as a major obstacle, the probability of reduced motivation to travel increases. Therefore, we propose:
Hypothesis 4. Posits that Perceived barriers exert a statistically significant negative impact on travel intention.
Self-efficacy refers to behavior caused by self-control. In this case, it is confidence in oneself while traveling that will not be infected with COVID by asking question items such as “You feel that the chance of getting infected by the COVID-19 pandemic depends on yourself.” Kim et al. [
15] discovered that self-efficacy can amplify the influence of social distancing measures on trust, implying that individuals who possess a high level of confidence are more likely to refrain from bringing infections back to their homes. Consequently, such individuals are more strongly inclined to engage in travel. Therefore, we propose:
Hypothesis 5. Self-efficacy has a statistically significant positive impact on travel intention.
Cues to action refer to external stimuli that prompt such behaviors. In this case, the government sector plays a crucial role in stimulating tourism by either implementing measures such as mask mandates or store-related regulation, such as limiting the number of people entering inside. These issues can impact travel behavior. Question item is “You think that the government helps stimulate and support Thai tourism in the context of the COVID epidemic.” Pham, et al. [
33], Okafor, et al. [
34] have demonstrated that robust government support for the tourism industry contributes significantly to its recovery. Undoubtedly, governmental encouragement serves as a catalyst, motivating people to embark on more frequent travels and leading to changes in their travel behaviors. This observation indicates the potential for an increase in travel frequency, thereby supporting the following hypotheses:
Hypothesis 6. The provision of cues to action exerts a statistically significant positive impact on travel intention.
Hypothesis 7. The provision of cues to action exerts a statistically significant positive impact on travel frequency.
HBM defines modifying variables which are variables adjusting based on situations. According to the previous research related to tourism during and after the COVID-19 pandemic, these factors, which have been added into decision-making analysis, consisted of health motivation and outcome expectation.
Health Motivation refers to individuals’ attitudes towards their own health, such as their awareness of risks in different situations. For example, traveling to places where there are strict preventive measures or not. Question items such as “You think that traveling for tourism in places where the number of service users is limited is the safest.” Sohn et al. [
13] have posited that when individuals embrace social distancing, they can still embark on journeys with relative safety. Hence, prioritizing one’s well-being and that of their families may prompt a realization that traveling could potentially result in infections that could be transmitted to their households. Consequently, individuals with such concerns often exhibit diminished motivation to travel. As a result, we hypothesize the following:
Hypothesis 8. Health motivation exerts a statistically significant negative impact on travel motivation.
Outcome expectation relates to a variety of motivation resulting in travel decisions. For instance, statements like “You feel happy whenever you travel for tourism in every situation.” Dwivedi et al. [
8] have highlighted that human responses to psychological emotions or logical thinking often lead to specific patterns of behavior, particularly in the context of travel behavior. Additionally, when individuals harbor elevated expectations, it invariably triggers a compelling inclination towards travel. Hence, we posit the following hypothesis:
Hypothesis 9. Outcome expectation exerts a statistically significant positive influence on travel motivation.
Intention refers to the motivation for travel decisions. Many studies use intention as dependent variables by measuring how many expected trips to travel in the future and the reasons for traveling, a question item such as “You need to have some rest and relaxation.” Chen et al. [
35] conducted a comprehensive analysis of travel intention and behavior in their research. Similarly, Durmaz et al. [
36] discovered a significant positive correlation between the perception of gastronomy tourism and behavioral intentions, indicating its potential to predict consumer behavior. In simpler terms, when individuals exhibit high levels of motivation or favorable perceptions towards travel, there is a subsequent increase in travel behavior and frequency. Consequently, we can propose the following hypothesis:
Hypothesis 10. States that intention exerts a statistically significant positive effect on travel frequency.
Figure 1.
Conceptual Frameworks and Hypotheses. Note: d and p in a bucket indicate the hypothesis of during pandemic model and post-pandemic model, respectively. Variable codes are indicated in
Table 1.
Figure 1.
Conceptual Frameworks and Hypotheses. Note: d and p in a bucket indicate the hypothesis of during pandemic model and post-pandemic model, respectively. Variable codes are indicated in
Table 1.
Table 1.
Variable Description and Descriptive Statistics.
Table 1.
Variable Description and Descriptive Statistics.
| Variable (Code) | Description | During COVID-19 | Post-COVID-19 |
|---|
| M | S.D. | M | S.D. |
|---|
| Frequency (FREQ) | 0 is less than 1 time/month, 1 is 1 time/month, 2 is 2 time/month, 3 is more than 2 time/month | 1.79 | 0.94 | 2.12 | 0.87 |
| Intention (INT) | | | | |
| INT1 a | You travel to change the atmosphere or create inspiration. | 3.02 | 0.94 | 4.57 | 0.61 |
| INT2 a | You like having privacy. | 3.05 | 0.90 | 4.56 | 0.61 |
| INT3 a | You need to have some rest and relaxation. | 3.04 | 0.93 | 4.57 | 0.61 |
| INT4 a | You want to spend time with your family/ beloved people. | 3.00 | 0.86 | 4.53 | 0.62 |
| Perceived Susceptibility (PSU) | | | | |
| PSU1 b | You think that when traveling for tourism, if you protect yourself very well, you will not be infected with the disease. | 2.35 | 1.17 | 4.52 | 0.66 |
| PSU2 b | You think that in traveling for tourism by public transportation system, you take a risk of be infected with COVID-19 disease. | 4.49 | 0.63 | 4.56 | 0.60 |
| PSU3 b | You think that by traveling for tourism by public transportation, you take a risk of being infected with COVID-19. | 4.25 | 0.86 | 4.52 | 0.64 |
| PSU4 b | You know whenever you travel for tourism, you must always follow preventive measures against COVID-19 pandemic, such as wearing masks, checking the temperature, washing hands with sanitizer gel or alcohol, or social distancing in queueing for getting service, etc. | 4.52 | 0.62 | 4.49 | 0.65 |
| Perceived Severity (PSE) | | | | |
| PSE1 c | You know that if you travel for tourism and you are infected, it will make you sick. | 4.53 | 0.61 | 4.53 | 0.61 |
| PSE2 c | You know that being infected with the epidemic may result in disabilities or death. | 4.46 | 0.66 | 4.52 | 0.64 |
| PSE3 c | You know that sickness from infection greatly affects your studies or your work. | 4.53 | 0.59 | 4.55 | 0.58 |
| PSE4 c | Each sickness or death makes you waste your time and your family’s income. | 4.59 | 0.56 | 4.53 | 0.59 |
| Perceived Benefits (PBE) | | | | |
| PBE1 e | You think that during the COVID-19 pandemic, traveling by a private vehicle is safer than traveling by public transportation system. | 4.51 | 0.65 | 4.60 | 0.54 |
| PBE2 f | You think that following the preventive measures against the COVID-19 pandemic makes you feel worthwhile and enjoy traveling for tourism. | 4.32 | 0.86 | 4.54 | 0.58 |
| PBE3 f | You think that having responsibilities for yourself and society can reduce the risks of COVID-19. | 4.54 | 0.58 | 4.50 | 0.61 |
| PBE4 f | You think that traveling for tourism in open places with a limited number of service users makes you feel at ease. | 4.55 | 0.62 | 4.55 | 0.60 |
| Perceived Barriers (PBA) | | | | |
| PBA1 b | You feel that traveling for tourism by public transportation system during the COVID-19 pandemic makes you feel uncomfortable. | 4.53 | 0.65 | 4.54 | 0.58 |
| PBA2 b | You feel that during the COVID-19 pandemic, if tourist places are still open, you will continue using the service. | 3.01 | 0.90 | 4.55 | 0.57 |
| PBA3 b | You feel that there is no need to spend more money on purchasing safety in the situation of the COVID-19 pandemic if you can protect yourself on your own. | 3.06 | 0.90 | 4.50 | 0.63 |
| PBA4 c | You feel that the internal facilities in places for tourists, such as restrooms, waiting seats, under the unstrict preventive measures may make you feel uncomfortable. | 4.57 | 0.56 | 4.53 | 0.61 |
| Self-efficacy (SEF) | | | | |
| SEF1 a | Each decision is based on your own. It does not depend on anyone. | 3.04 | 0.88 | 4.43 | 0.71 |
| SEF2 h | You feel that the chance of getting infected by the COVID-19 pandemic depends on you. | 2.99 | 0.92 | 4.49 | 0.69 |
| SEF3 h | You think that if you get infected with the disease, the cause is not yours. | 2.99 | 0.90 | 4.48 | 0.73 |
| SEF4 h | You think that the chance to get infected from COVID-19 pandemic depends on tourists’ behavior. | 4.42 | 0.74 | 4.49 | 0.66 |
| Cues to action (CTO) | | | | |
| CTO1 b | You think that the government attaches importance to the safety of traveling by public transport in a COVID-19 pandemic situation. | 2.92 | 0.87 | 3.03 | 0.92 |
| CTO2 g | You think that the government helps stimulate and support Thai tourism in the context of the COVID epidemic. | 3.01 | 0.87 | 2.93 | 0.87 |
| CTO3 g | You think that the policy to promote tourism makes you feel like traveling in the context of the COVID-19 epidemic. | 2.97 | 0.95 | 3.03 | 0.85 |
| CTO4 g | You think that the government has allocated budget for managing public health and safety in tourist attractions appropriately | 3.01 | 0.87 | 3.00 | 0.92 |
| Health Motivation (HMO) | | | | |
| HMO1 b | You think that traveling by a private vehicle is the best travel mode. | 4.53 | 0.62 | 4.52 | 0.67 |
| HMO2 b | You think that traveling for tourism in the places where the number of service users are limited is the safest. | 4.52 | 0.62 | 4.54 | 0.60 |
| HMO3 a | You think that health and safety are the most important. | 4.56 | 0.58 | 4.52 | 0.61 |
| HMO4 b | You think that being infected from traveling is the worst issue. | 3.05 | 0.89 | 4.47 | 0.71 |
| Outcome Expectation (OCE) | | | | |
| OCE1 d | You feel happy whenever you travel for tourism in every situation. | 3.02 | 0.94 | 4.47 | 0.70 |
| OCE2 d | You feel worthwhile spending money on travelling for tourism in every situation. | 2.95 | 0.90 | 4.47 | 0.70 |
| OCE3 d | You have no opinion on stopping traveling for tourism with the reason stating that “In any situation, you will get what you expect from traveling for tourism” | 4.31 | 0.87 | 4.50 | 0.67 |
| OCE4 d | You feel happy whenever you travel for tourism in every situation. | 4.52 | 0.62 | 4.43 | 0.77 |
5. Discussion
The results will be discussed based on the theoretical results from SEM, considering the significance of the latent constructs and direction.
Intention in the during COVID-19 group consists of three observed variables. The highest factor loading was INT4, suggesting that in case of during the epidemic, motivation often comes from getting out of the house and spending time with family even more. However, in the post-epidemic period, people have returned to work and may want to travel to relax from work. This effect is similar to the study by Cheng et al. [
46], which noted that the issue of relaxation is very important when everyone is back to on-site work.
H1, perceived risk, has a significantly negative effect on intention. The analysis result revealed that only H1p was supported, potentially interpreting that during the epidemic, perceived risk may vary according to the received messages [
47]. Thus, the relationship with intention is insignificant. While in the post-pandemic period, it was clear that when perceived risk was higher, there was less intention; the results rather make sense. The issue people were most concerned about in this group was PSU2. In this study, public transportation may also refer to public facilities, such as a group of public toilets, or things that must be in common contact with other people as well. This is very clear: People who are anxious do not often travel due to the fear of infection. Similar to Savadori, et al. [
48], Joo, et al. [
49], they discovered a negative correlation between risk perception and intention to tourism.
H2 is a significantly negative relationship between perceived severity and intention. Although the measurement model had only two observed variables, it was significant. The results from SEM indicated that H2d and H2p were supported, interpreting that the more you perceived risks, the less your motivation decreased. Considering the observed variables with high values of factor loadings, the two models were identical—PSE2. This item is very reasonable. It is in line with previous research, such as Su et al. [
31], stating that if people are worried about their own health problems or perceived severity such as congenital diseases, especially respiratory diseases, their health risk preventative behavior is high; in other words, they do not want to go out due to the fear that contracting the disease will cause severe symptoms and fatalities.
H3 is the positive correlation of perceived benefits from tourism with motivation. The results found that in the during COVID model, the hypothesis H3d was not supported. The reason is that even if they follow the preventive measures, they will have a chance to be infected. Therefore, the opinions of the respondents are quite different, as well as the low intention from a lockdown condition and access limitation to various areas. Thus, the correlation between perceived benefits and intention was insignificant. As for H3p, it was supported, especially when considering the question with a high factor loading, PBE2. It is evident that after the epidemic, more knowledge or news makes people confident that compliance with measures will prevent the spread until the motivation of tourism increases. The discovery comprises Nguyen et al. [
9] who proposed that a positive impact strategy is associated with tourist attitudes and product strategies capable of harnessing this imperceptible force to elevate travel experiences following the COVID-19 pandemic.
H4 is the correlation between perceived barriers and motivation. It is predicted to be significantly negative. In the During-COVID model, H4d was not supported, while H4p was supported. The results rather make sense, in other words, when people face obstacles or difficulty while traveling, such as wearing a mask, always wash your hands or cleaning with items that are shared with others, it results in decreased motivation for tourism. The reason may be that when comparing the situation after COVID (which still has an epidemic, but not much) with the situation before COVID when travelling used to be more comfortable. The loading factors of the observed variables were found to be close (0.408–0.485), which suggests that obstacles that arise include the need to spend more money for safety, the closure of tourist attractions, or the use of public facilities. This is consistent with the study of Devkota et al. [
11], which states that expenses such as travel or hotels are very important in travel decisions.
H5 is related to self-efficacy, which has a positive effect on travel motivation. The results showed that both H5d and H5p were supported. Considering the observable variables of latent constructs were similar, in other words, the variable with a high loading factor is SEF2 and SEF3. Before being infected, people think that they could protect themselves, while in the post-pandemic period, the infection results from other people, or in other words, the confidence that their own practices can prevent infection with COVID-19 very well, such as washing hands with alcohol gel on a regular basis or avoiding crowded places. Such measures can prevent infection during travel [
19].
H6 is the correlation between cue to action that has a significantly positive effect on motivation. Models of both situations were found to be unsupported. Cue to action is a collection of question items about assistance measures as well as measures used to stimulate tourism by the government, such as allocating budget and ensuring safety. Interestingly, various stimuli did not significantly increase motivation. The reason may be that people do not perceive concrete results from government measures, such as reducing the number of infected people. Similarly, the study of Nguyen et al. [
9] stated that although the government plays an important role in stimulating tourism, the epidemic must be simultaneously controlled. These measures must be effective so that there will be stimulation and motivation for tourism. Furthermore, Abbas et al. [
50] have posited the necessity of meticulously monitoring the ramifications and repercussions of the COVID-19 pandemic, encompassing critical stakeholders such as the tourism demand, tourism resources, tourism organizations, as well as government leaders, all of whom bear the potential to effect transformative changes and hold implications for the sustainable revitalization of the travel and leisure industry.
H7, which is a continuation of H6, is the correlation between various government measures that affect tourism behavior. As a result, H7d and H7p were not supported. The reason is similar to H6, which is that the results of the measures are no longer tangible. Therefore, they cannot stimulate an increase in tourism frequency.
H8: Health motivation issues have a significant negative effect on tourism motivation. Results from the during COVID-19 model are quite interesting because, in addition to not supporting H8d, the correlation effect was opposite to the hypothesis, potentially interpreting that even though there was quite a lot of health motivation, the travel motivation was high. Considering the question items in the latent construct, the loading factor results focused on HMO1 and HMO2, which are question items about the kinds of travel as well as the selection of attractions that will help reduce the chance of infection. This result is quite reasonable due to good travel planning in advance; even during the COVID epidemic, people wanted to travel [
32], while the post-pandemic situation was insignificant (H8p was not supported). The cause may be that when they are no longer worried about COVID (they think if they are infected, it is not severe due to the less severe virus generation), there is no need to plan the trip in advance.
H9 is the correlation between outcome expectations and tourism motivation. It is predicted to be significantly positive. The results found that H9d and H9p were supported. The observed variables of outcome expectations involve question items about expectations when traveling, such as whether budgeting for infection is appropriate and whether the experience of traveling is worthwhile. These issues are all stimuli for tourism motivation. Considering the outstanding loading factor, the two models were identical, with OCE2 focusing on the incurred expenditure, which may result from protective devices such as alcohol gel or sanitary masks that can be purchased at a low price. This is consistent with the study of Zhang et al. [
51], which found that the prediction of determined or limited tourism expenditures affects tourism in Hong Kong.
H10 is the correlation between motivation and travel behavior, which is indicated by the travel frequency. The result showed that the hypothesis was supported only for H10p. The result makes quite sense because, during the epidemic, there were fewer people traveling. So even though there is a lot of motivation, it cannot cause the travel behavior to increase. This may be caused by many factors, such as the severity of the disease, the strict measures of the government, etc., while the situation after the epidemic and stimulating motivation can increase the travel frequency. This is consistent with the study of Dwivedi et al. [
8], which found that behavioral intention was positively correlated with travel behavior.
6. Conclusions
This study aims to find the relationship between the different factors affecting motivation and travel behavior by comparing the two situations during two periods, namely During the COVID-19 epidemic (timeframe under the country’s emergency management) and after the COVID-19 pandemic (Cancellation of Emergency Situation Management, 1 October 2022). The psychological model was developed based on the Health Belief Model and included a modifying factor. The questionnaire was surveyed among representatives of three provinces distributed across six regions of Thailand, amounting to 2100 sets. Factor analysis was used for grouping questions into the framework of Structural Equation Modeling (SEM), 10 hypotheses for each situation. The model results can be developed into policy recommendations to boost tourism in the present situation.
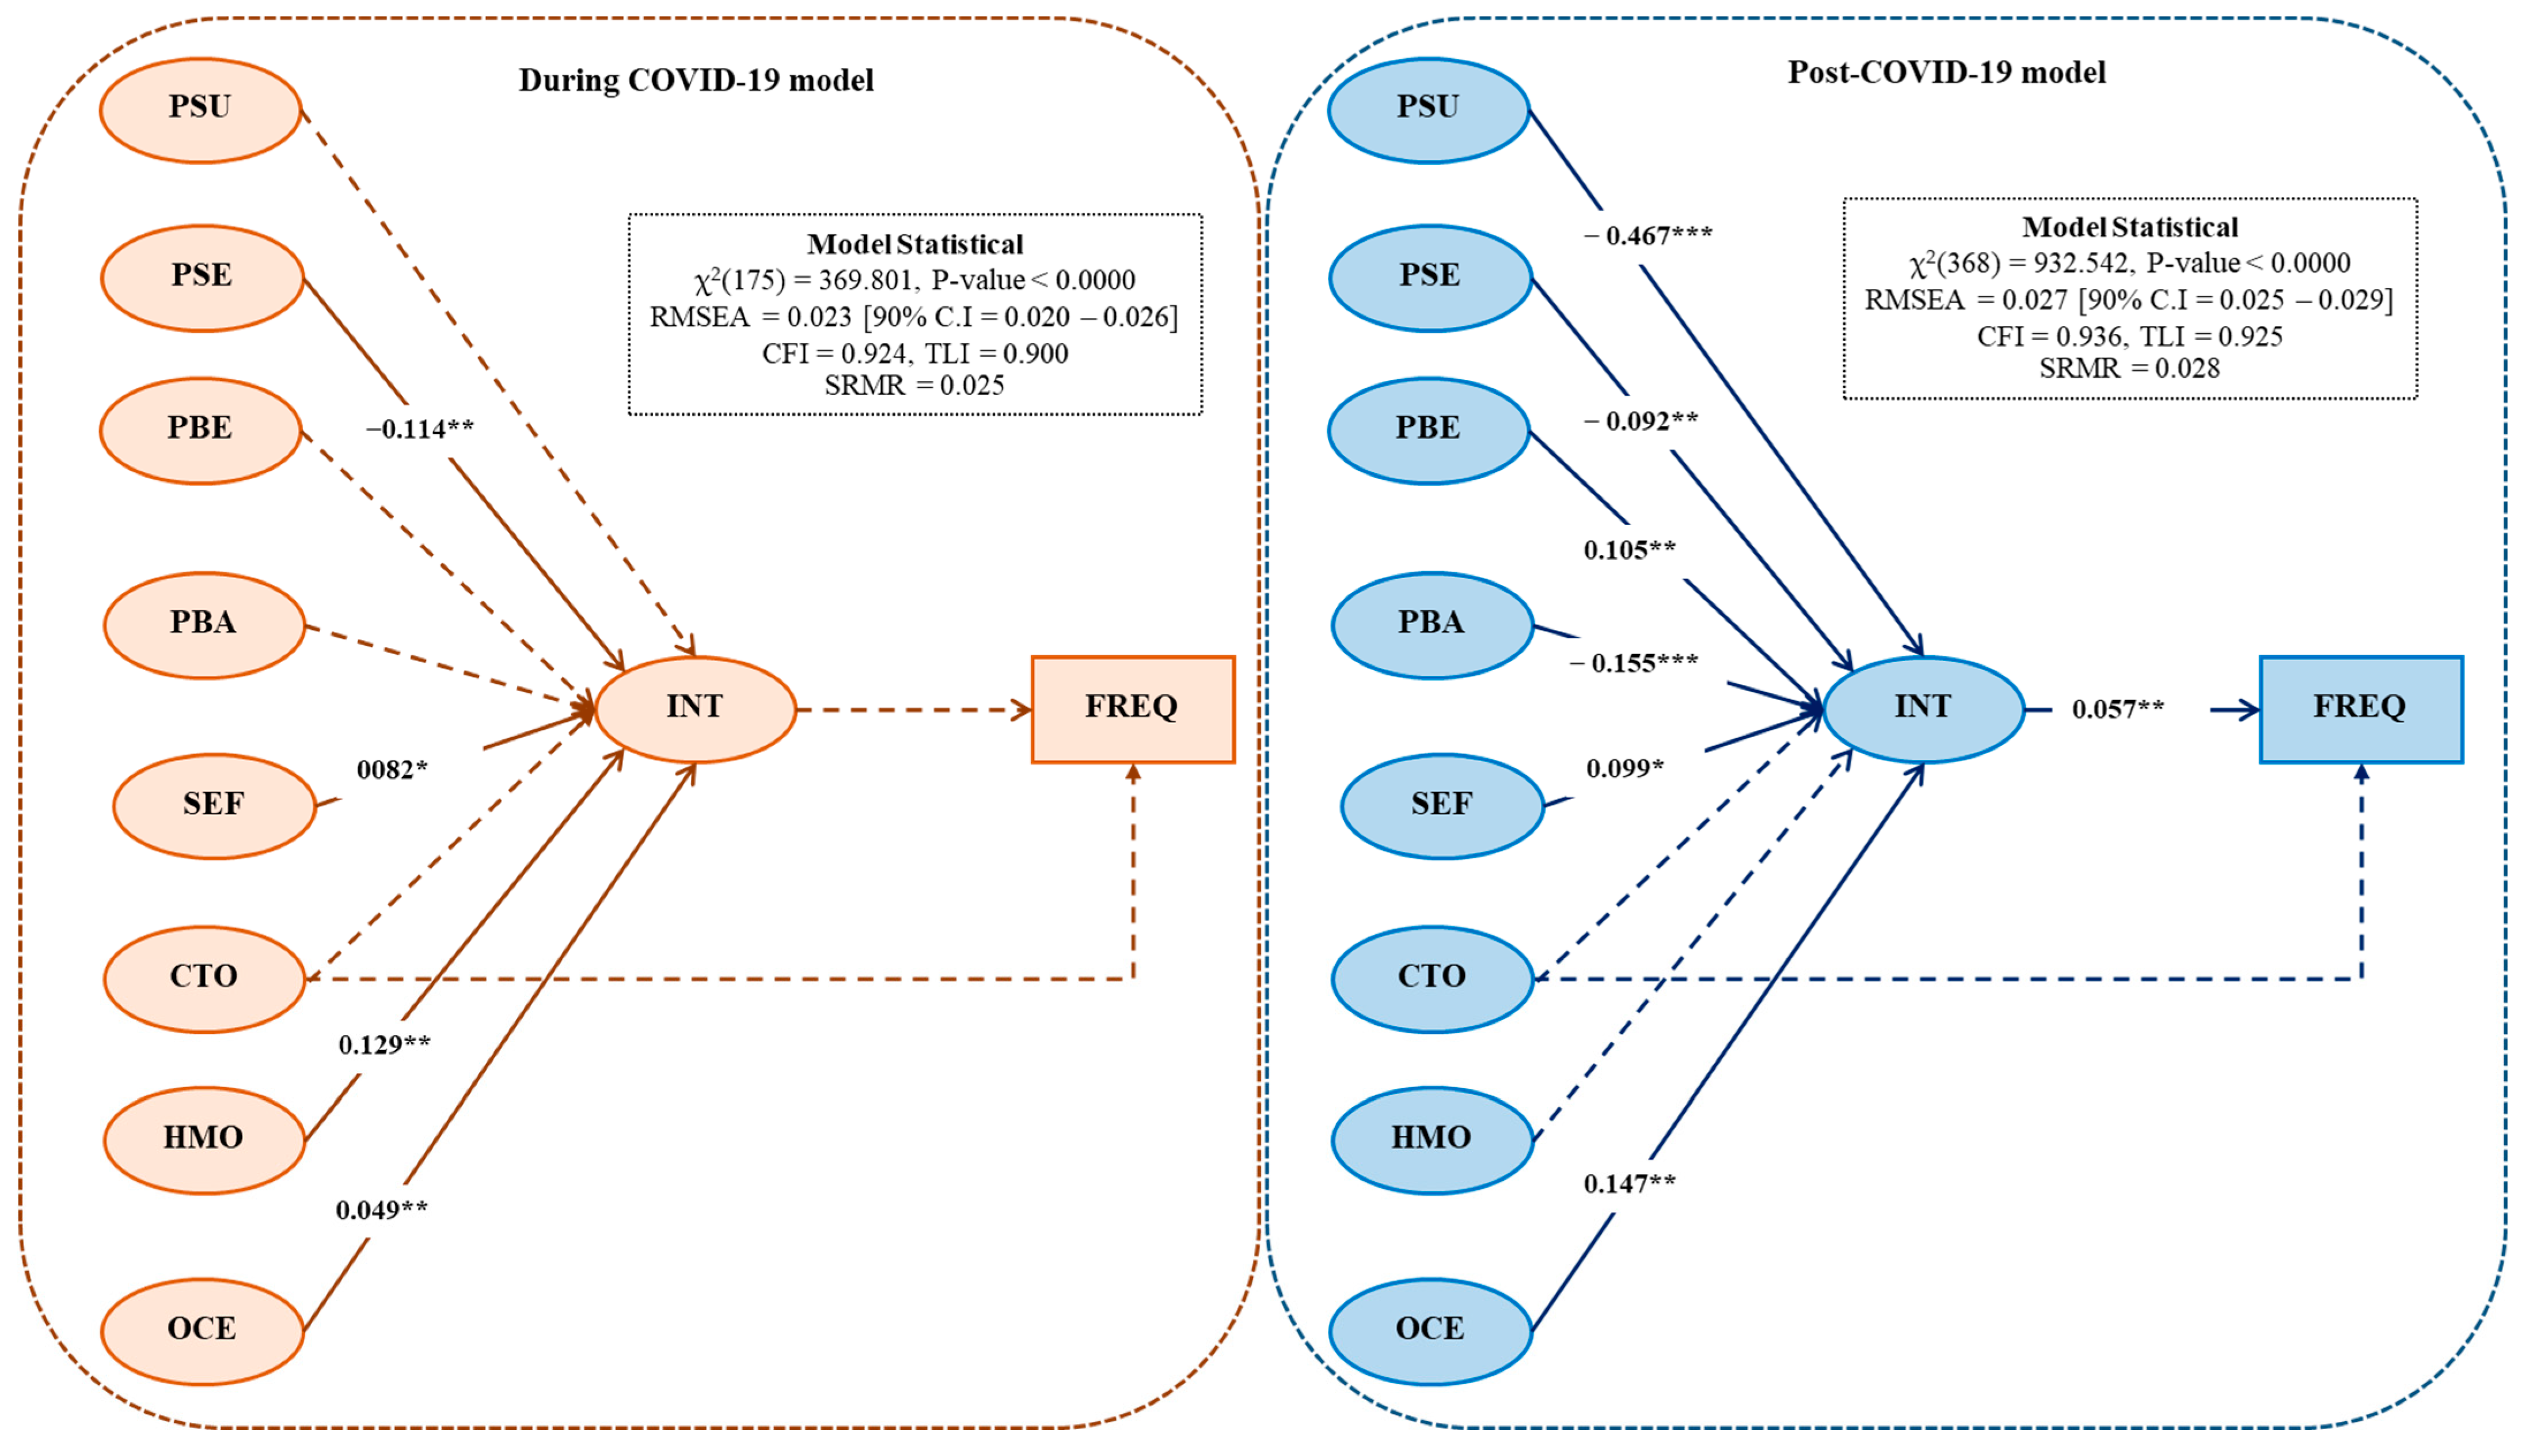
The results showed that the question items can be grouped according to the theory, and the SEM results were consistent with the empirical data in both situations. In the epidemic scenario model, three hypotheses were supported: H2d, H5d, and H9d, which are the relationships between tourism motivation and perceived severity, self-efficiency, and outcome expectations, respectively. H8d was significant, but in the opposite direction to the hypothesis, which is the relationship between health motivation and intention. For the post-COVID-19 situation, there are seven hypotheses that are supported: H1p, H2p, H3p, H4p, H5p, H9p, and H10p, which are the relationships between intention (INT) and perceived susceptibility (PSU), perceived severity (PSE), perceived benefits (PBE), perceived barriers (PBA), self-efficacy (SEF), outcome expectation (OCE), and frequency (FREQ).
The support of H10p shows that if motivation can be increased, it will be able to change behavior to make people turn to travel more frequently. Therefore, the policy recommendations were determined from the loading factor in SEM of both models. But most of them focus on the model. post-COVID-19 rather than because it is close to the current situation. The selection of a latent construct was considered from the structural model and the proposed subsections were considered from measurement models. The variable with the highest factor loading was the PSU, which had a negative effect on motivation. Therefore, policy recommendations to reduce perceived risk include taking preventive measures such as wearing a mask, temperature check, wash hands with alcohol gel, or spacing in queues for services, etc. These measures were seen as obstacles by some groups (this was supported by the effect of the relationship between perceived barriers and motivation, which was found to be of negative significance as well). The suggestion is that the safety of tourist attraction areas may need to be promoted, for example, by setting up well-spaced tables or providing open spaces. This is to give interested people more reason to come and visit [
32,
52]. The government may use benchmarks to assess the chances of infection with COVID-19. If any place is certified for proper spacing, it can use the results to promote its own attractions and increase tourists’ confidence [
9]. The next suggestion results from the effect of the relationship between outcome expectation and intention (H9, which is significant in both models), which indicates that outcome expectation awareness should be increased. The outstanding question item in this group is “Traveling brings more new experiences.” Thus, the agencies involved in promoting tourist attractions should focus on motivating tourists to choose adventure attractions or natural attractions [
36]. A further suggestion was the relationship between perceived benefits and self-determination with intention (H3 and H5), indicating that this should increase tourists’ awareness of benefits. Therefore, the proposal is that in addition to promoting the safety of tourist attractions, promotion should focus on tourists’ confidence. By following the measures, such as not neglecting to wear a mask and regularly washing hands with alcohol gel, tourists will not worry about infection. Agencies that can promote these measures include provinces, districts, or the owners of tourist attractions who can publicize them through websites or social media.
There are certain limitations to the findings of this study, particularly regarding the policy details set by the government sector. These details are still lacking, specifically in terms of the actions taken by the government, such as the development of a tourist application to alert visitors about risk areas, a public relations website aimed at promoting secure tourist destinations, or even contingency plans for tourists in the event of a coronavirus infection. Due to these limitations, the variable related to government actions in this study did not show a significant effect. To address this issue, future studies could delve into the specific details of various measures implemented by the government, assessing their effectiveness and gathering opinions from both Thai and foreign tourists. Moreover, the questionnaire could explore the potential features and functionalities that tourists would desire in such an application in the future.


 ,
, 


