1. Introduction
With the rapid pace of urbanization, urban green and blue spaces have become essential components of the urban ecosystem, playing pivotal roles in promoting sustainable urban development and enhancing residents’ physical and mental well-being [
1]. However, the effectiveness and ecological benefits of these spaces are often constrained by environmental factors such as the urban heat island effect, which limit these spaces’ accessibility and comfort [
2]. These limitations not only decrease outdoor engagement but also hinder urban areas’ overall vibrancy [
3]. The fact that several elements influence personal perception and comfort levels in urban blue–green spaces further contributes to the complexity involved in addressing these issues. While early research on this topic primarily focused on examining the impact of various stimuli on individuals’ environmental perceptions, more recent studies have emphasized the thermal and visual perception aspects of environmental comfort [
4,
5,
6].
Visual–thermal comfort is critical for mitigating heat stress and adapting to climate change [
7]. The American Society of Heating, Refrigerating, and Air-Conditioning Engineers (ASHRAE) defines thermal comfort as ‘the psychological satisfaction of individuals with the thermal environment’ [
8]. Research has shown that urban green spaces can effectively reduce ambient temperatures and enhance thermal comfort by facilitating evaporative heat dissipation and providing shade [
9]. Natural water bodies have the ability to evaporate cooling air to improve the thermal environment [
10]. Vision, a vital sensory component linking individuals to their surroundings, has also been shown to play a critical role in the individual perception of the external environment [
11]. Visual comfort refers to the subjective sense of well-being derived from the visual environment [
12], and in outdoor settings, it is determined by environmental factors such as lighting [
13]. The presence of trees and vegetation in blue–green spaces can attenuate sunlight and provide shade, thereby improving people’s visual comfort, while bodies of water provide wider views and moist air [
14]. Different types of blue–green spaces exhibit varying effects on visual–thermal comfort levels due to variations in the vegetation and the layout of different spaces [
15].
In recent years, extensive research has underscored the comprehensive impact of visual–thermal comfort. Specifically, empirical investigations have shed light on the discernible influence of the visual environment on thermal conditions [
15], as well as the potential of augmenting visual comfort to mitigate thermal discomfort [
16]. Furthermore, scholarly inquiries have delved into the interdependent relationship between the thermal environment and the evaluation of the visual milieu. Notably, Lam et al. revealed a positive correlation between thermal comfort voting and visual comfort voting [
6], while Lau and Choi elucidated a significant association between thermal comfort and aesthetic assessment, unveiling a robust negative correlation between thermal sensation voting (TSV) and perceptual aesthetic voting [
17]. Importantly, explorations of urban landscapes and street thermal comfort have demonstrated that the presence of verdant vegetation within street spaces engenders heightened visual comfort and enhances the acceptance of the thermal environment [
14,
18], despite potential deviations from pleasurable experiences [
19]. Moreover, previous investigations have elucidated the psychological implications of visual perception on human thermal sensation [
20], yet it has been found that manipulating the visual environment does not alter thermal perception when individuals are exposed to temperatures equal to or exceeding 30 °C [
21].
The interaction between humans and their environment is a complex biophysical process, and accurately evaluating human comfort levels requires quantifying physiological indicators and surveying individuals via questionnaires to account for the many physiological parameters involved [
22,
23]. The thermal environment influences the human body in several ways and leads to changes in physiological indicators such as skin temperature (SKT) [
24], heart rate (HR) [
25], electrodermal activity (EDA) [
26], and respiration rate (RESP) [
27]. Alterations in these indicators directly impact individuals’ subjective perceptions and change how they then respond to the environment. Visual comfort is determined by an even wider range of factors, and analyzing these non-thermal aspects requires the careful consideration of several additional factors [
28]. For instance, sunlight alters the brightness and color of the outdoor environment, which affects both visual perception and mental states [
29]. Exposure to intense sunlight in a hot environment often reduces visual comfort, and this change in one’s psychological state has an impact on the regulation of the body’s thermal balance, ultimately reducing thermal comfort as well. Therefore, the visual–thermal environment is defined by the interrelationships between visual–thermal and physiological responses [
30].
In recent years, research has increasingly focused on investigating the relationship between subjective human comfort and objective physiological indicators to evaluate environmental comfort [
31]. One particular indicator that has received considerable attention is skin temperature (SKT) due to its sensitivity to changes in ambient temperature and its strong correlation with thermal sensation votes (TSV) and thermal comfort votes (TCV) [
32]. Skin conductance response (SCR), a highly sensitive measurement method, has frequently been used to discern variations in human responses to several kinds of environmental stimuli [
33,
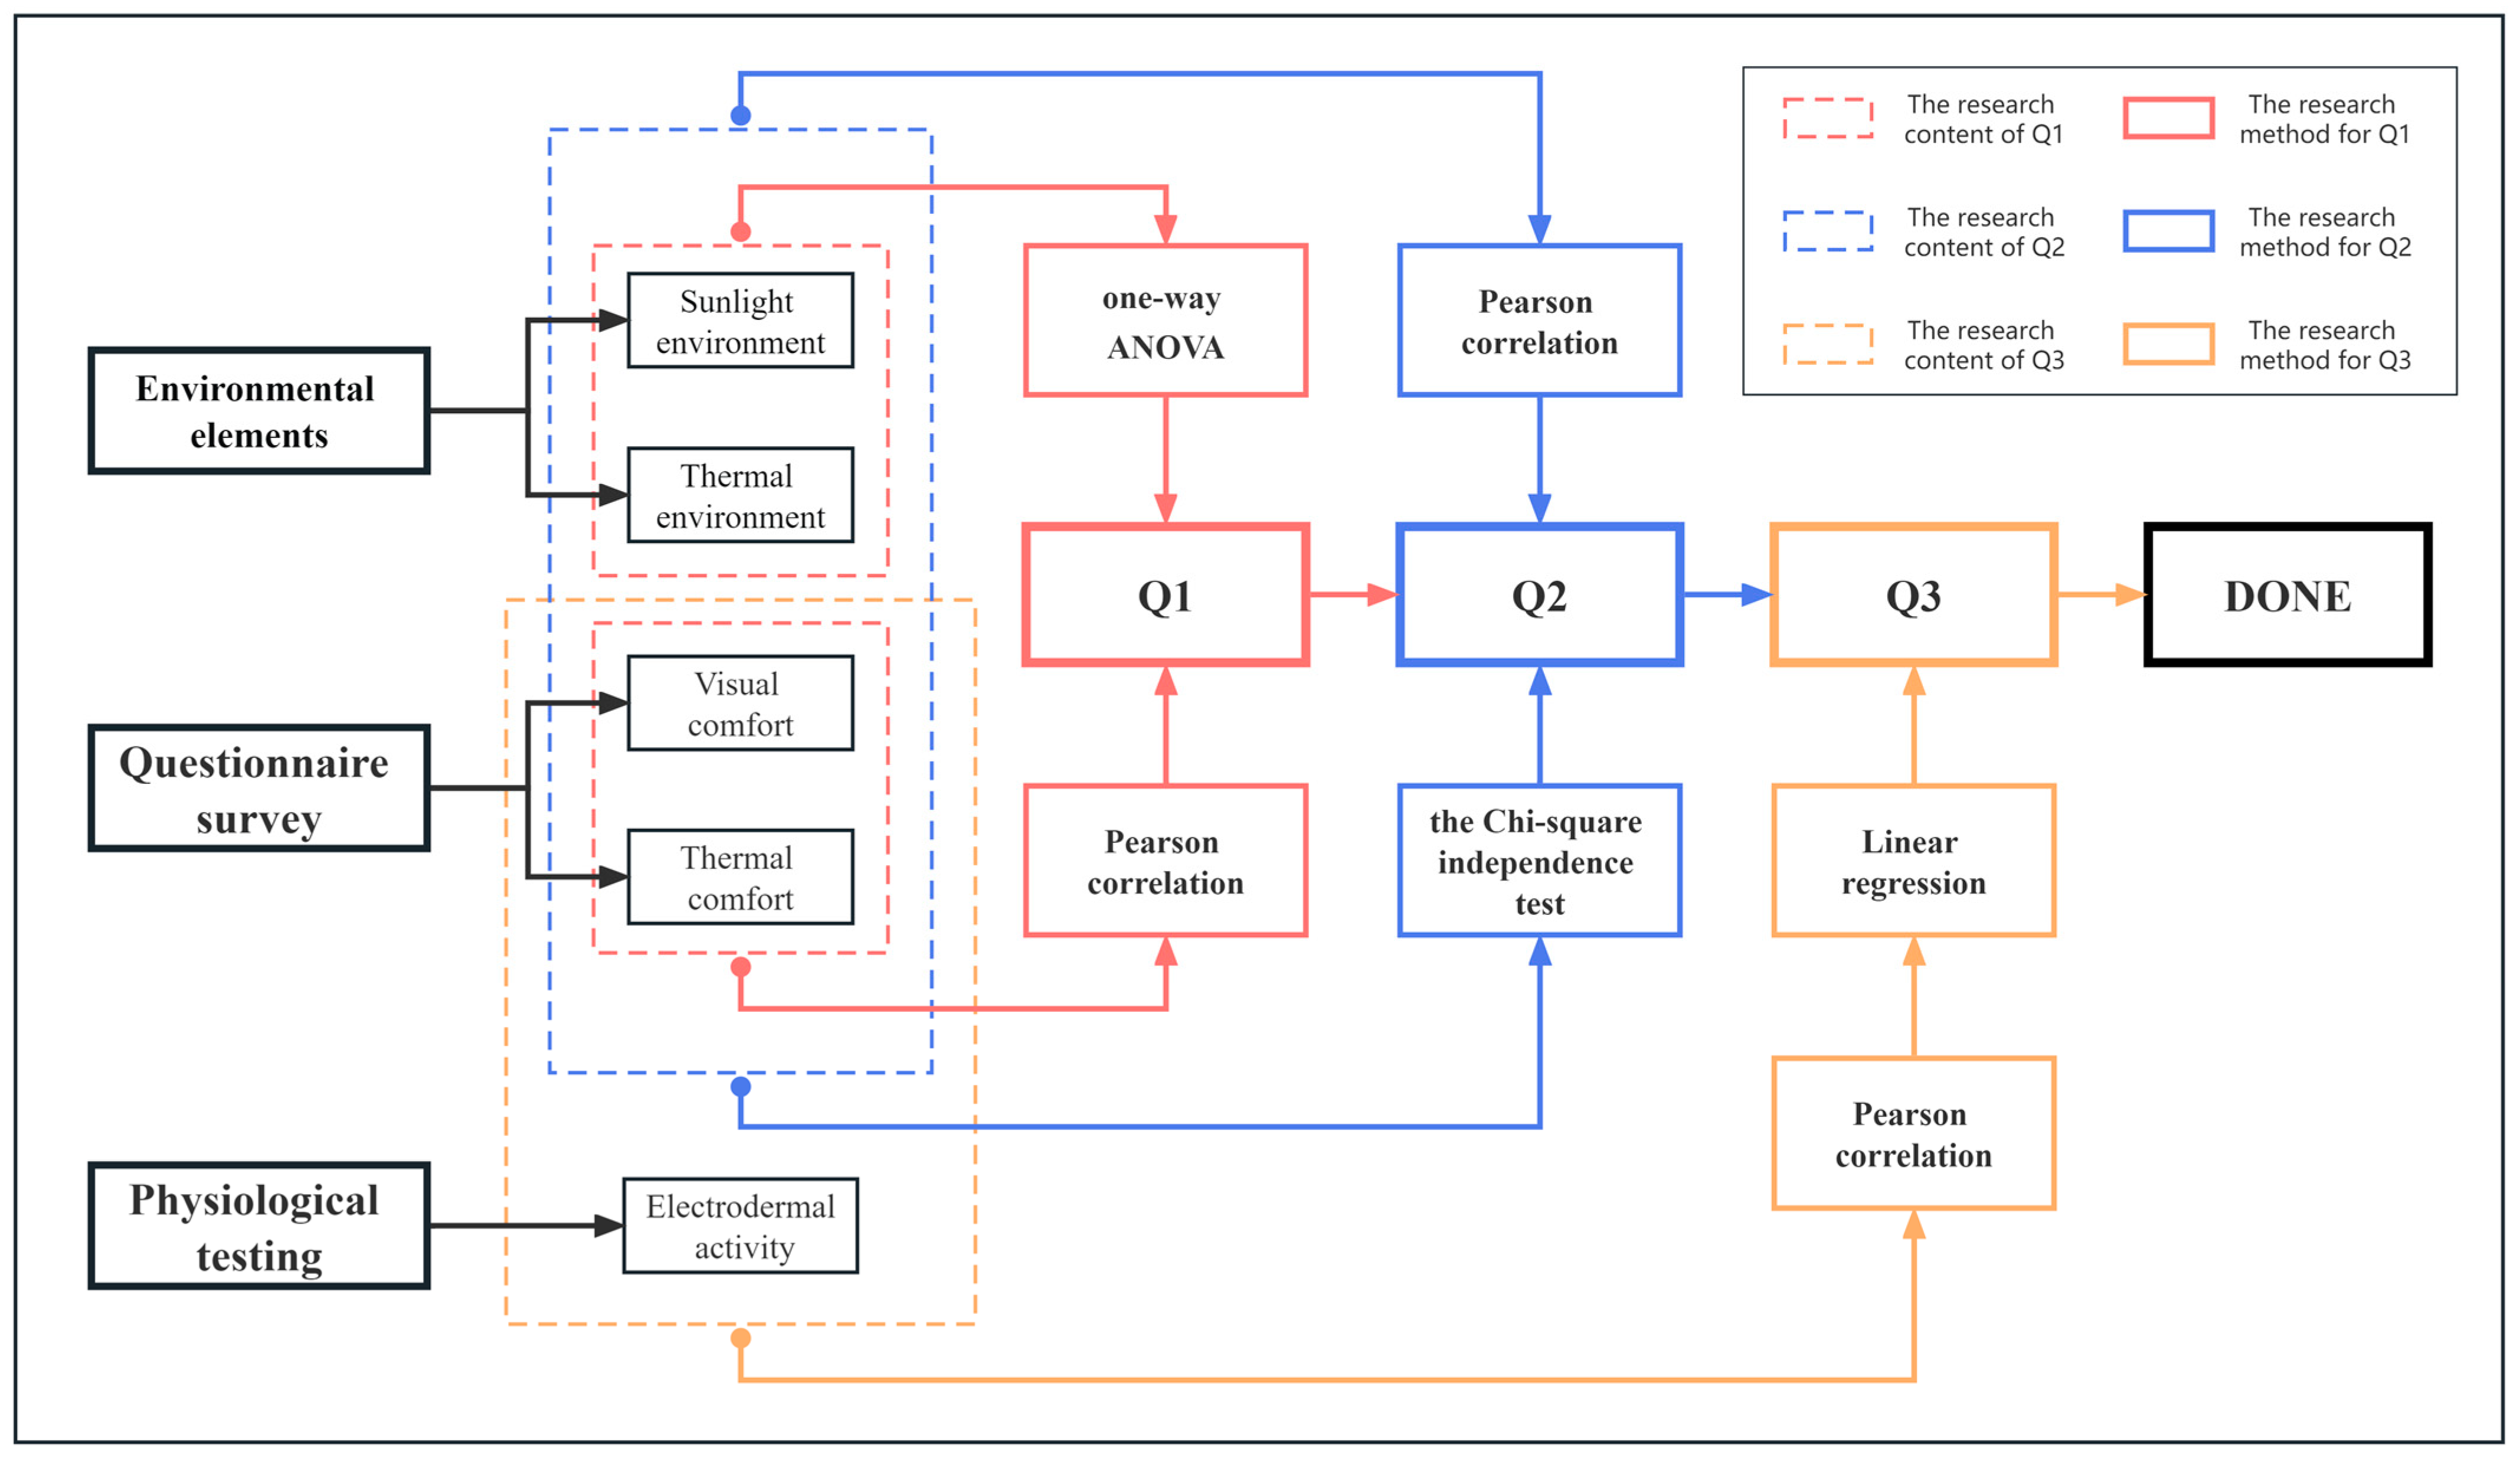
34]. In this study, we aimed to improve the degree of accuracy achieved when predicting changes in visual–thermal comfort and electrodermal activity (EDA) by analyzing variations in participants’ visual–thermal comfort levels across six campus blue–green spaces. Specifically, we sought to address the following research questions (
Table 1).
4. Discussion
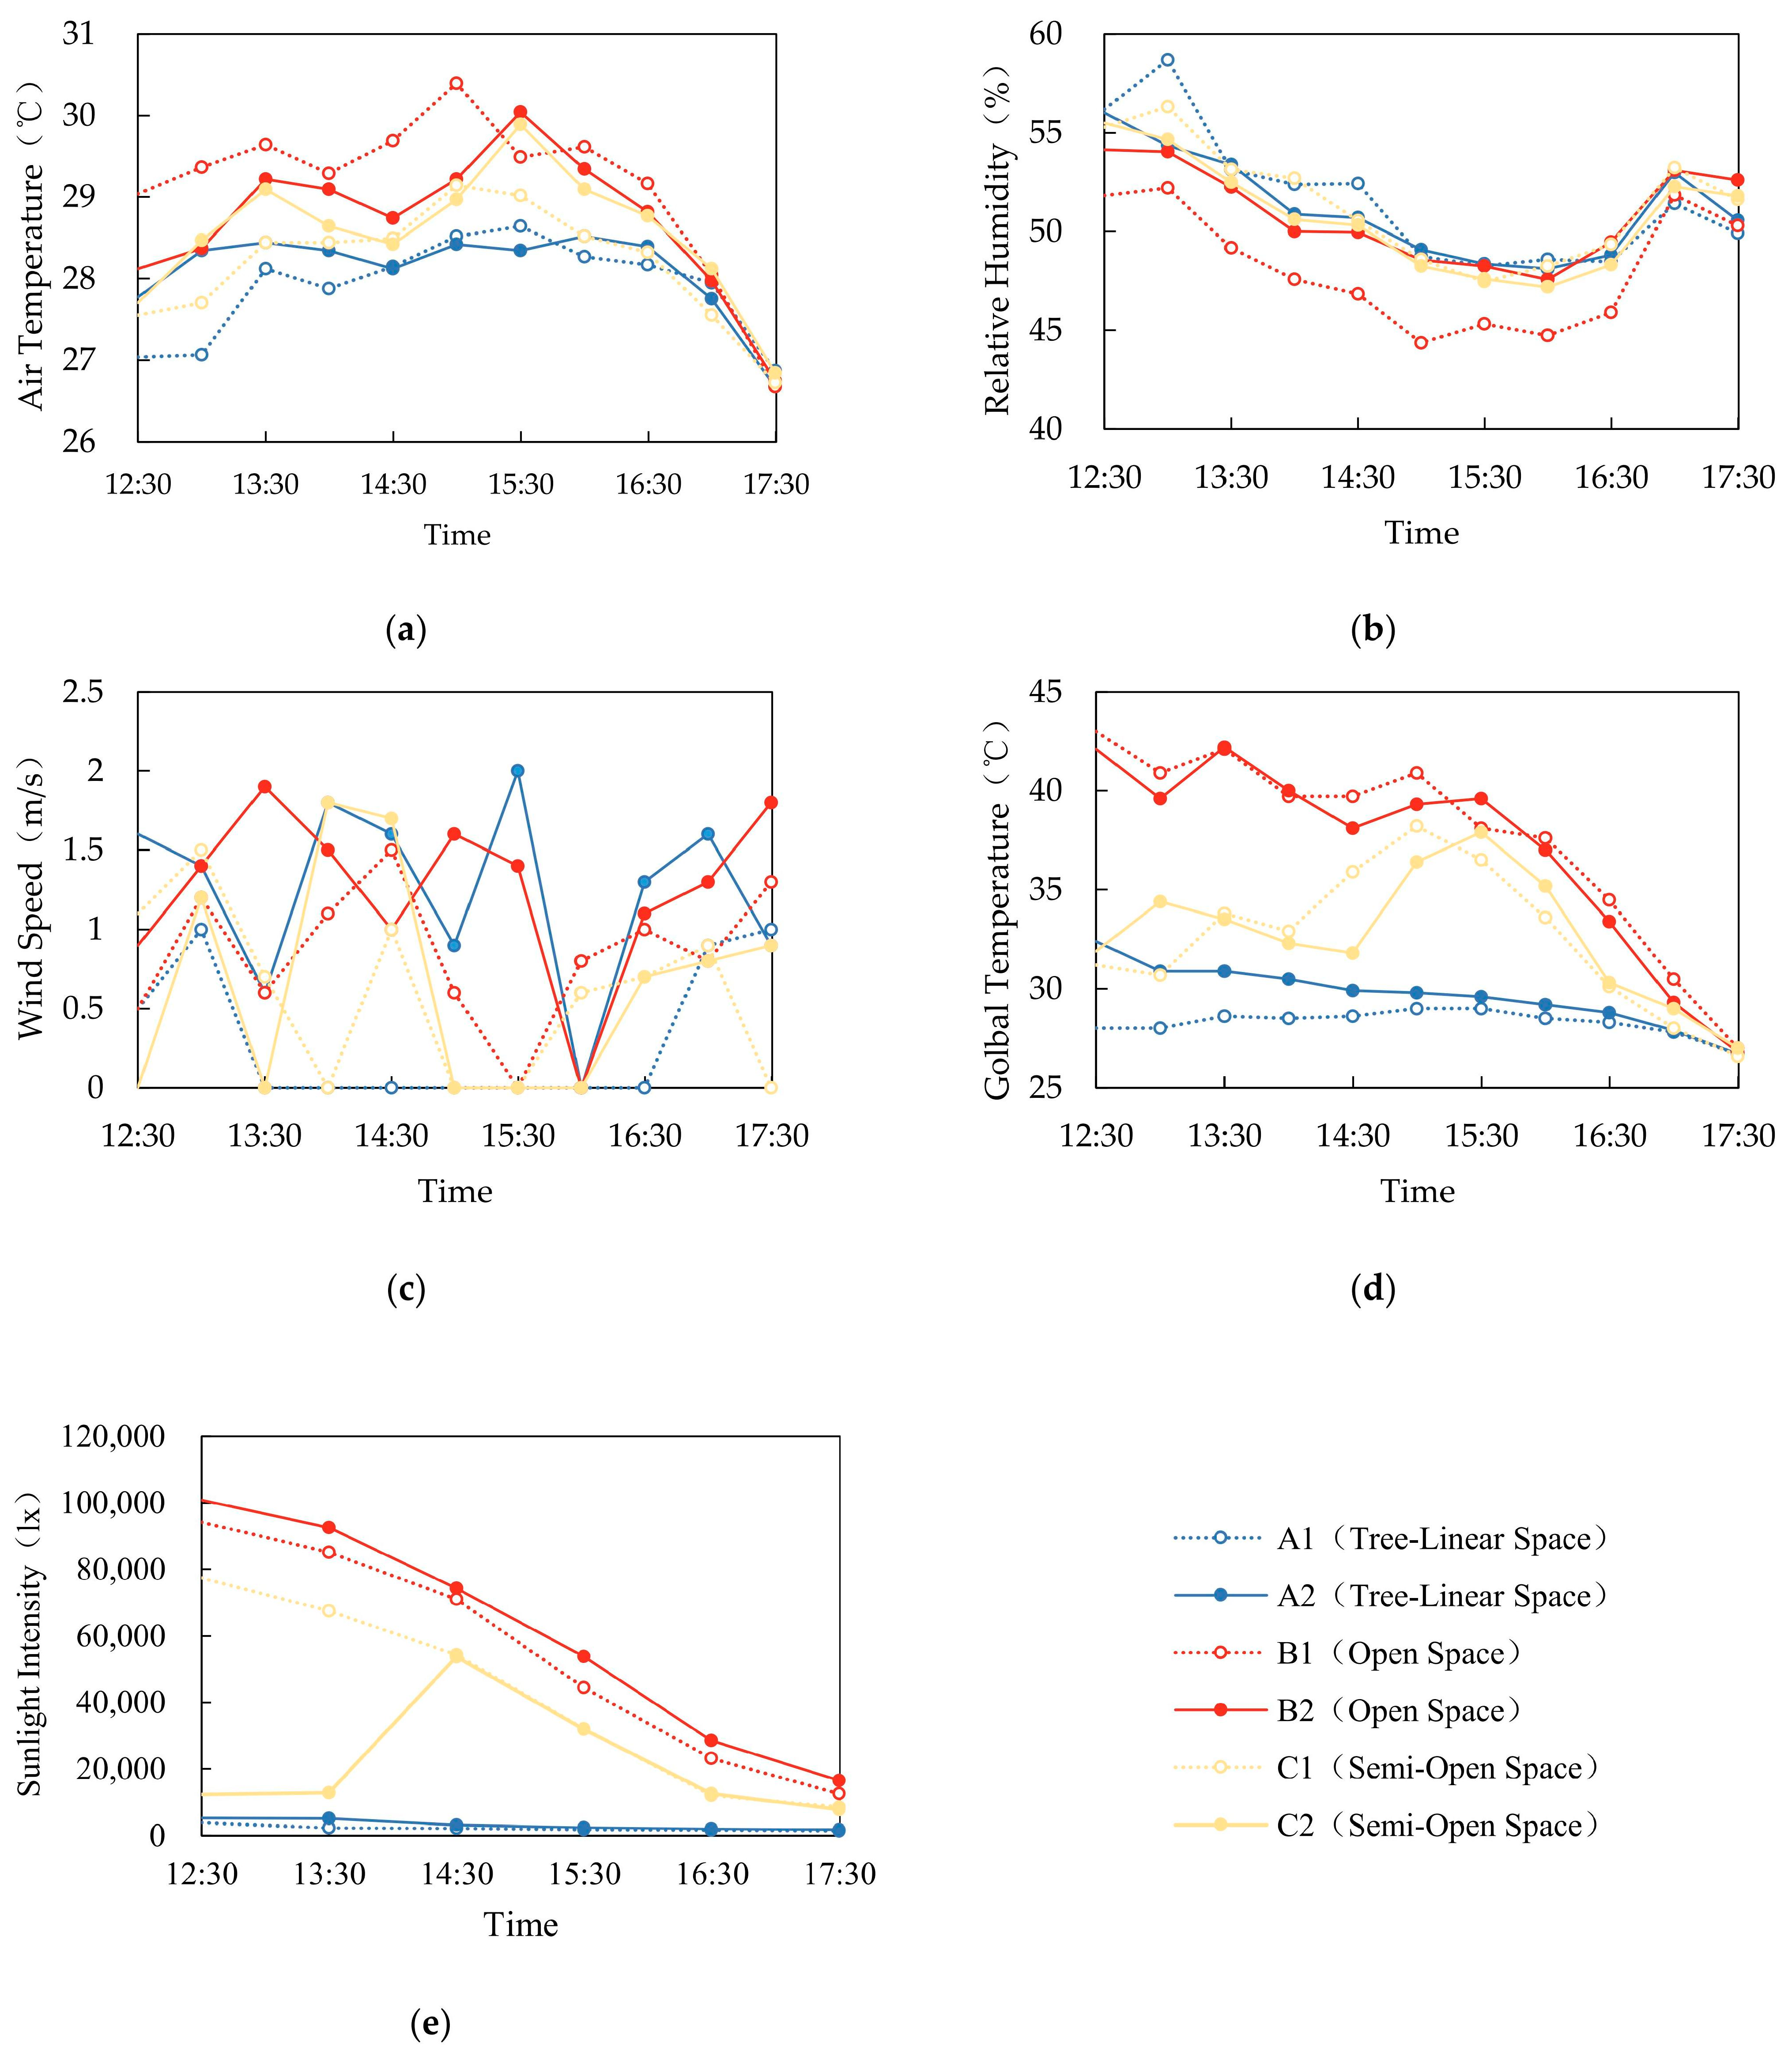
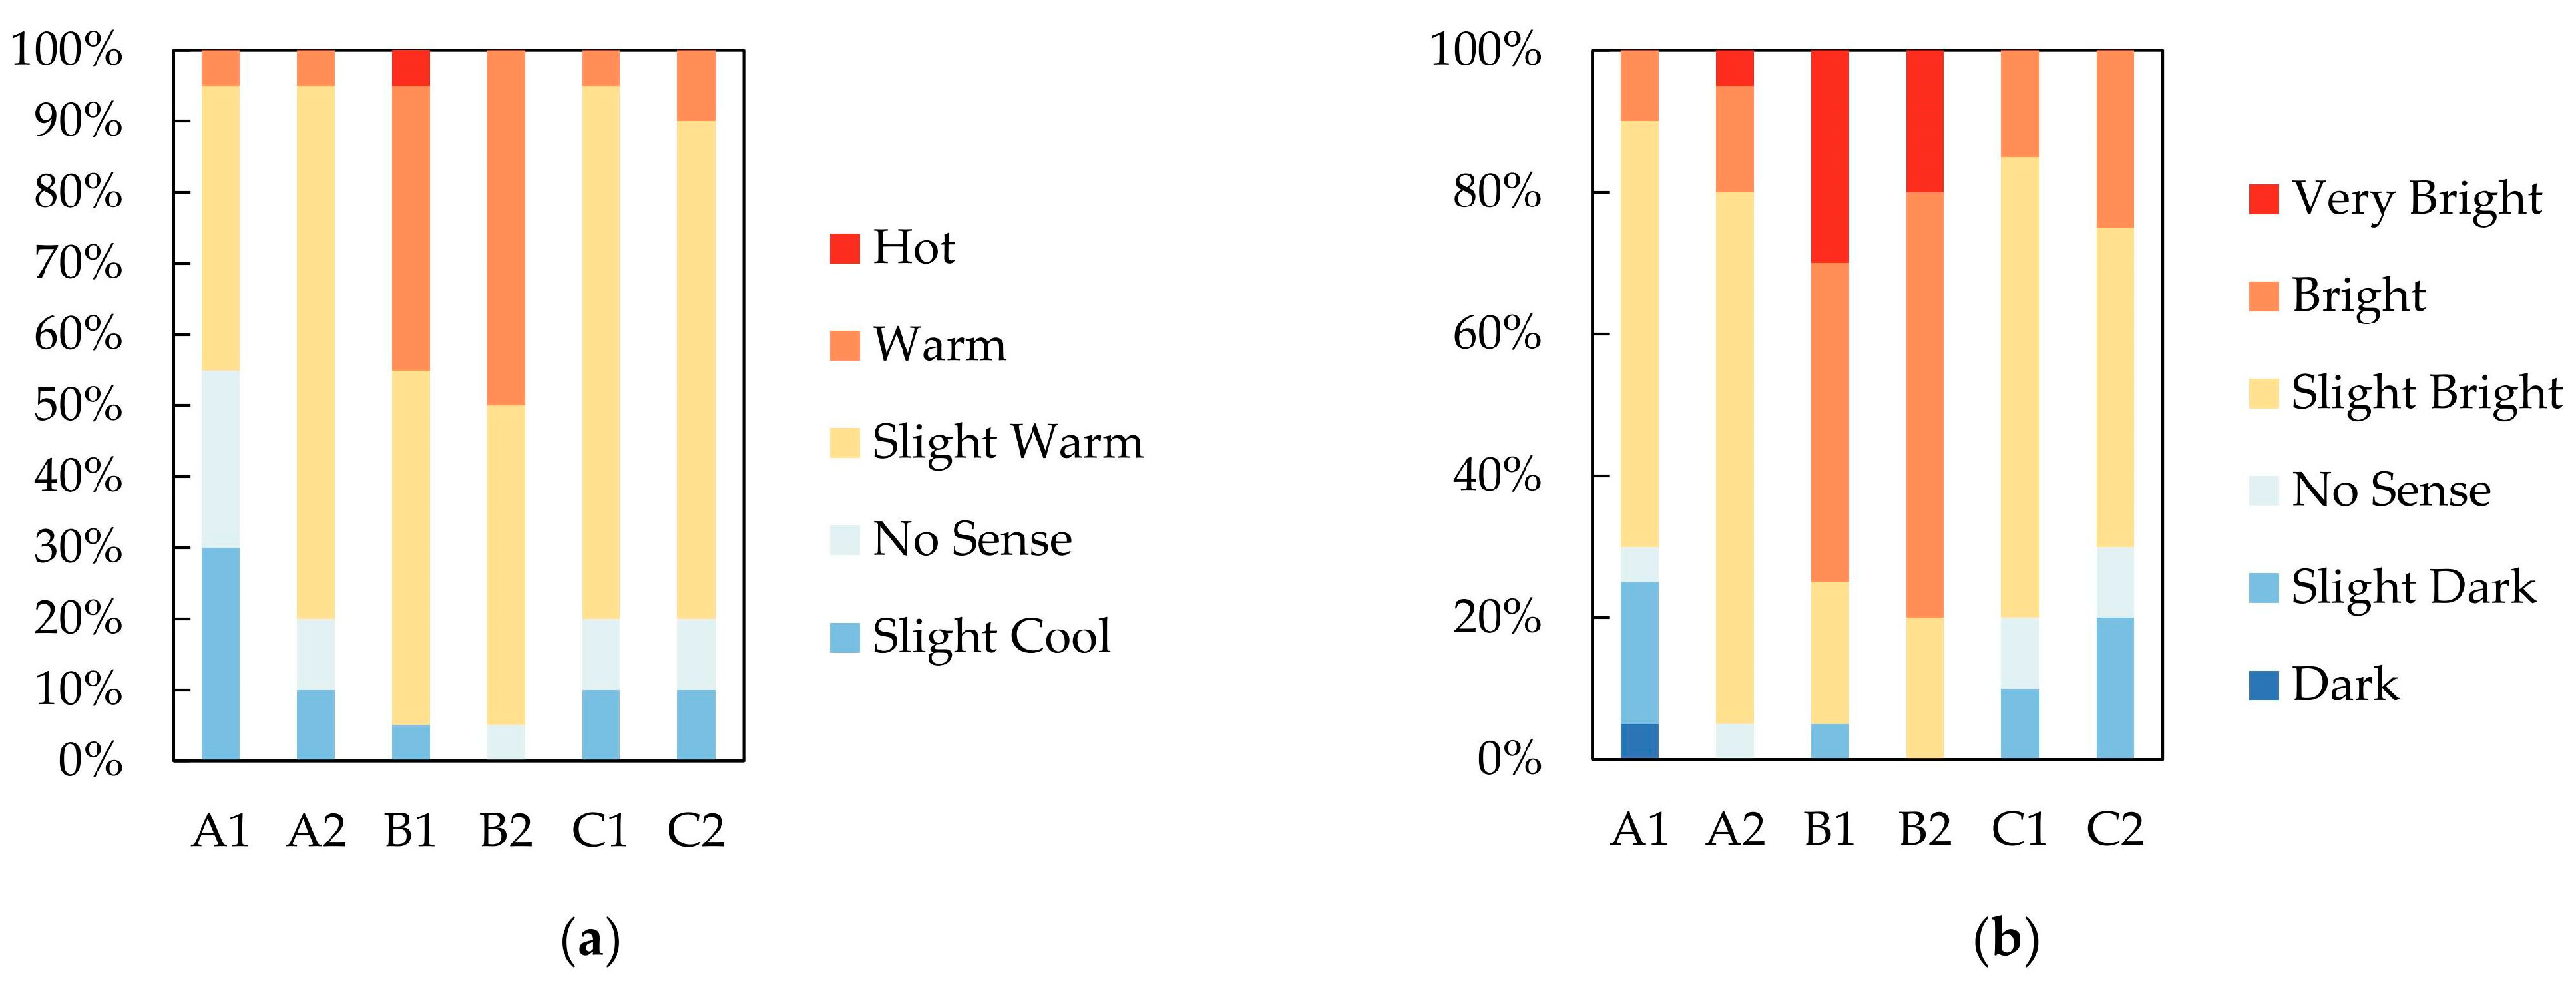
By comparing data from measurement points in six unique spaces, significant differences were identified among environmental parameters in different types of spaces. Among these parameters, Ta and SI were found to be the most affected. When comparing spaces of the same type, it was revealed that spaces with dense vegetation and proximity to water produced more comfortable environmental conditions than spaces with sparse vegetation and high canopy cover (A2, B2, and C2). The SVF values for space A2, B2, and C2 were 0.440, 0.934, and 0.325, respectively. The mean Ta was recorded as 28.6 °C, with a relative humidity of 50.54%. Spaces with dense vegetation and adjacent water sources benefited from cooling and humidifying effects, while areas with sparse vegetation and high canopy cover had higher Ta and lower Rh, reducing comfort levels.
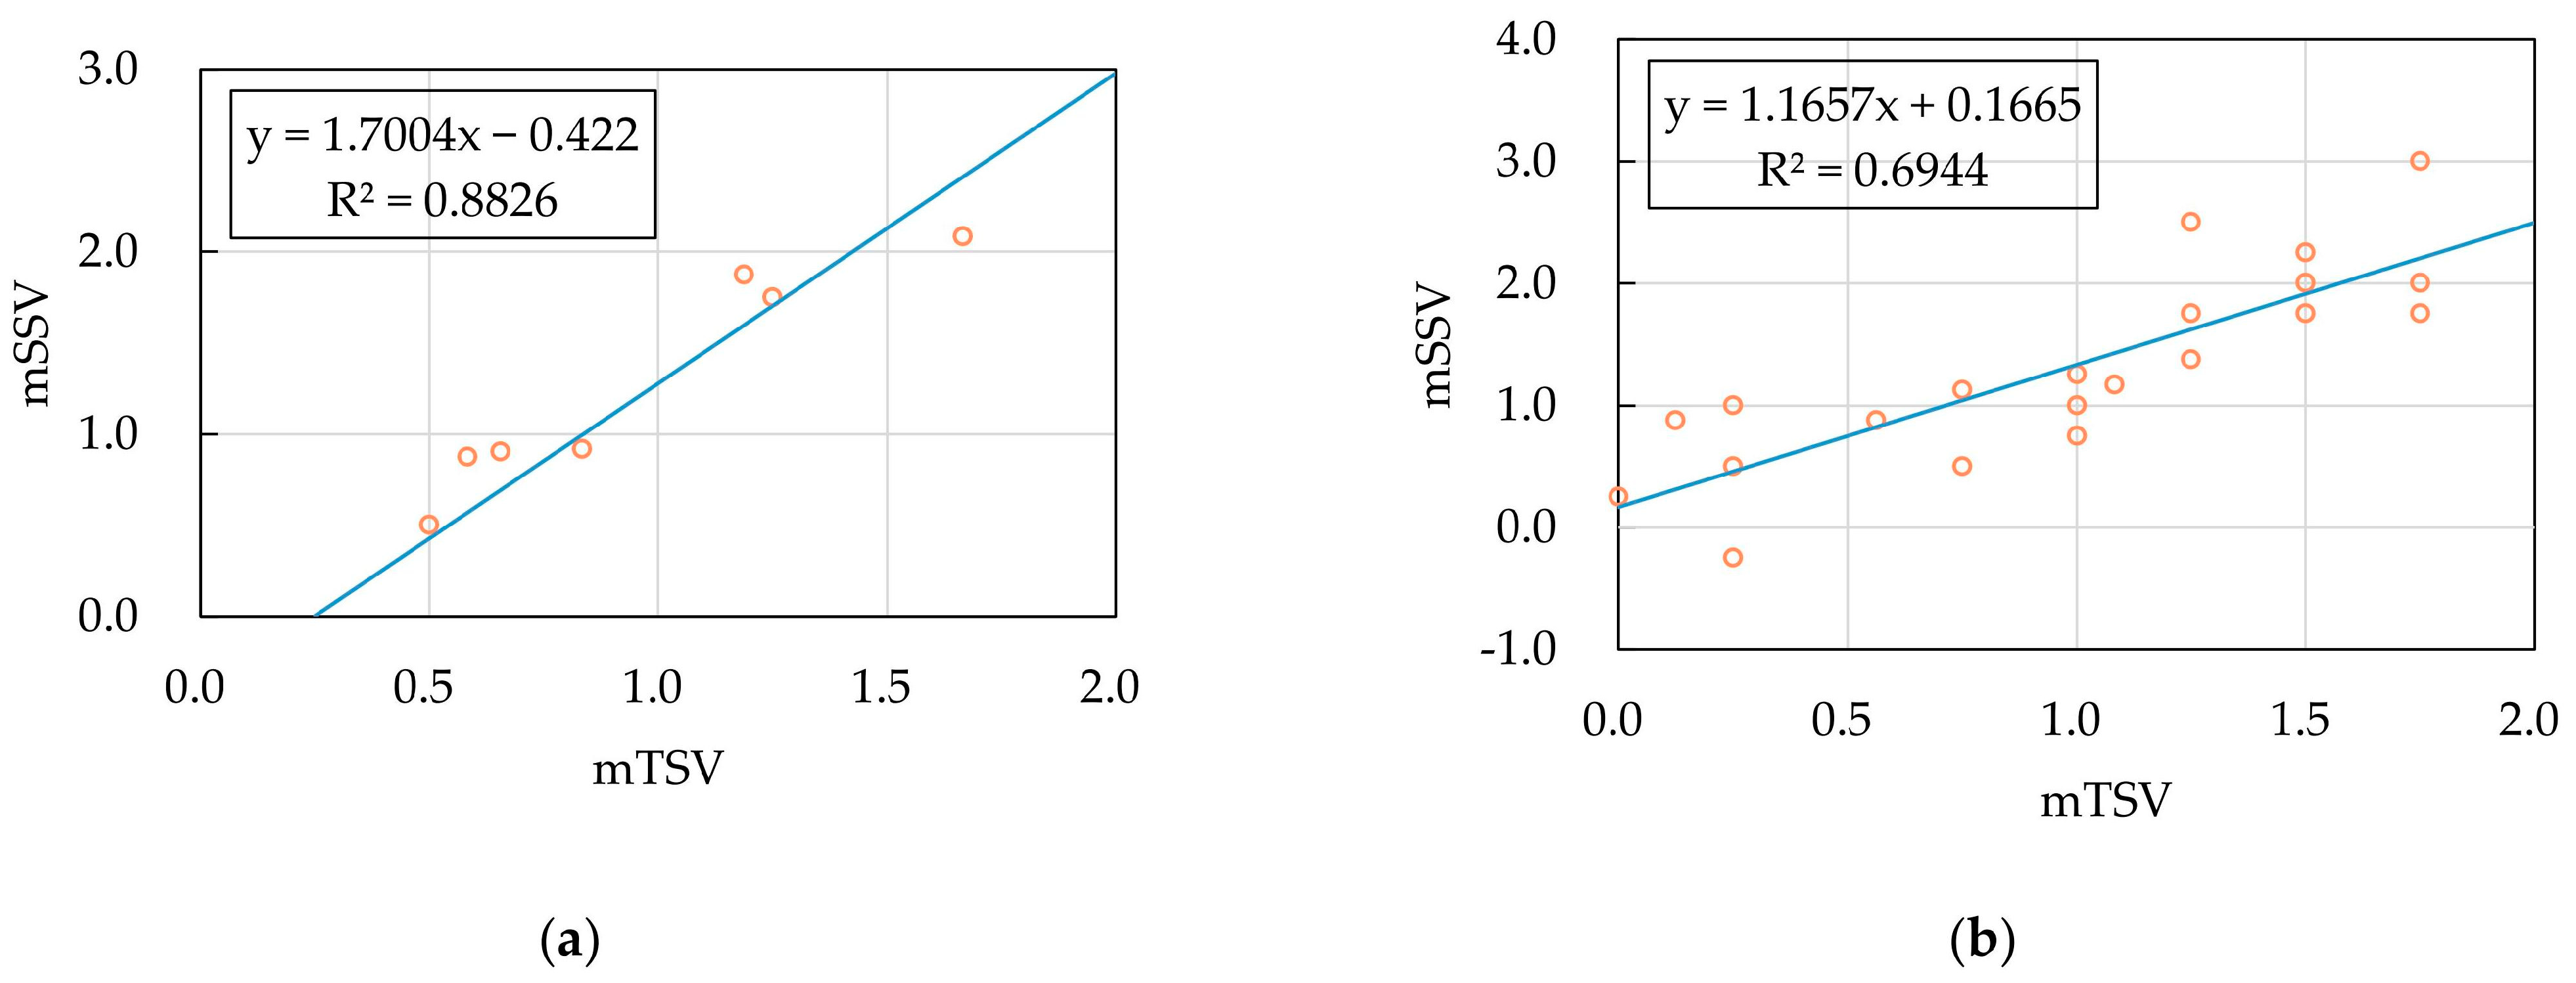
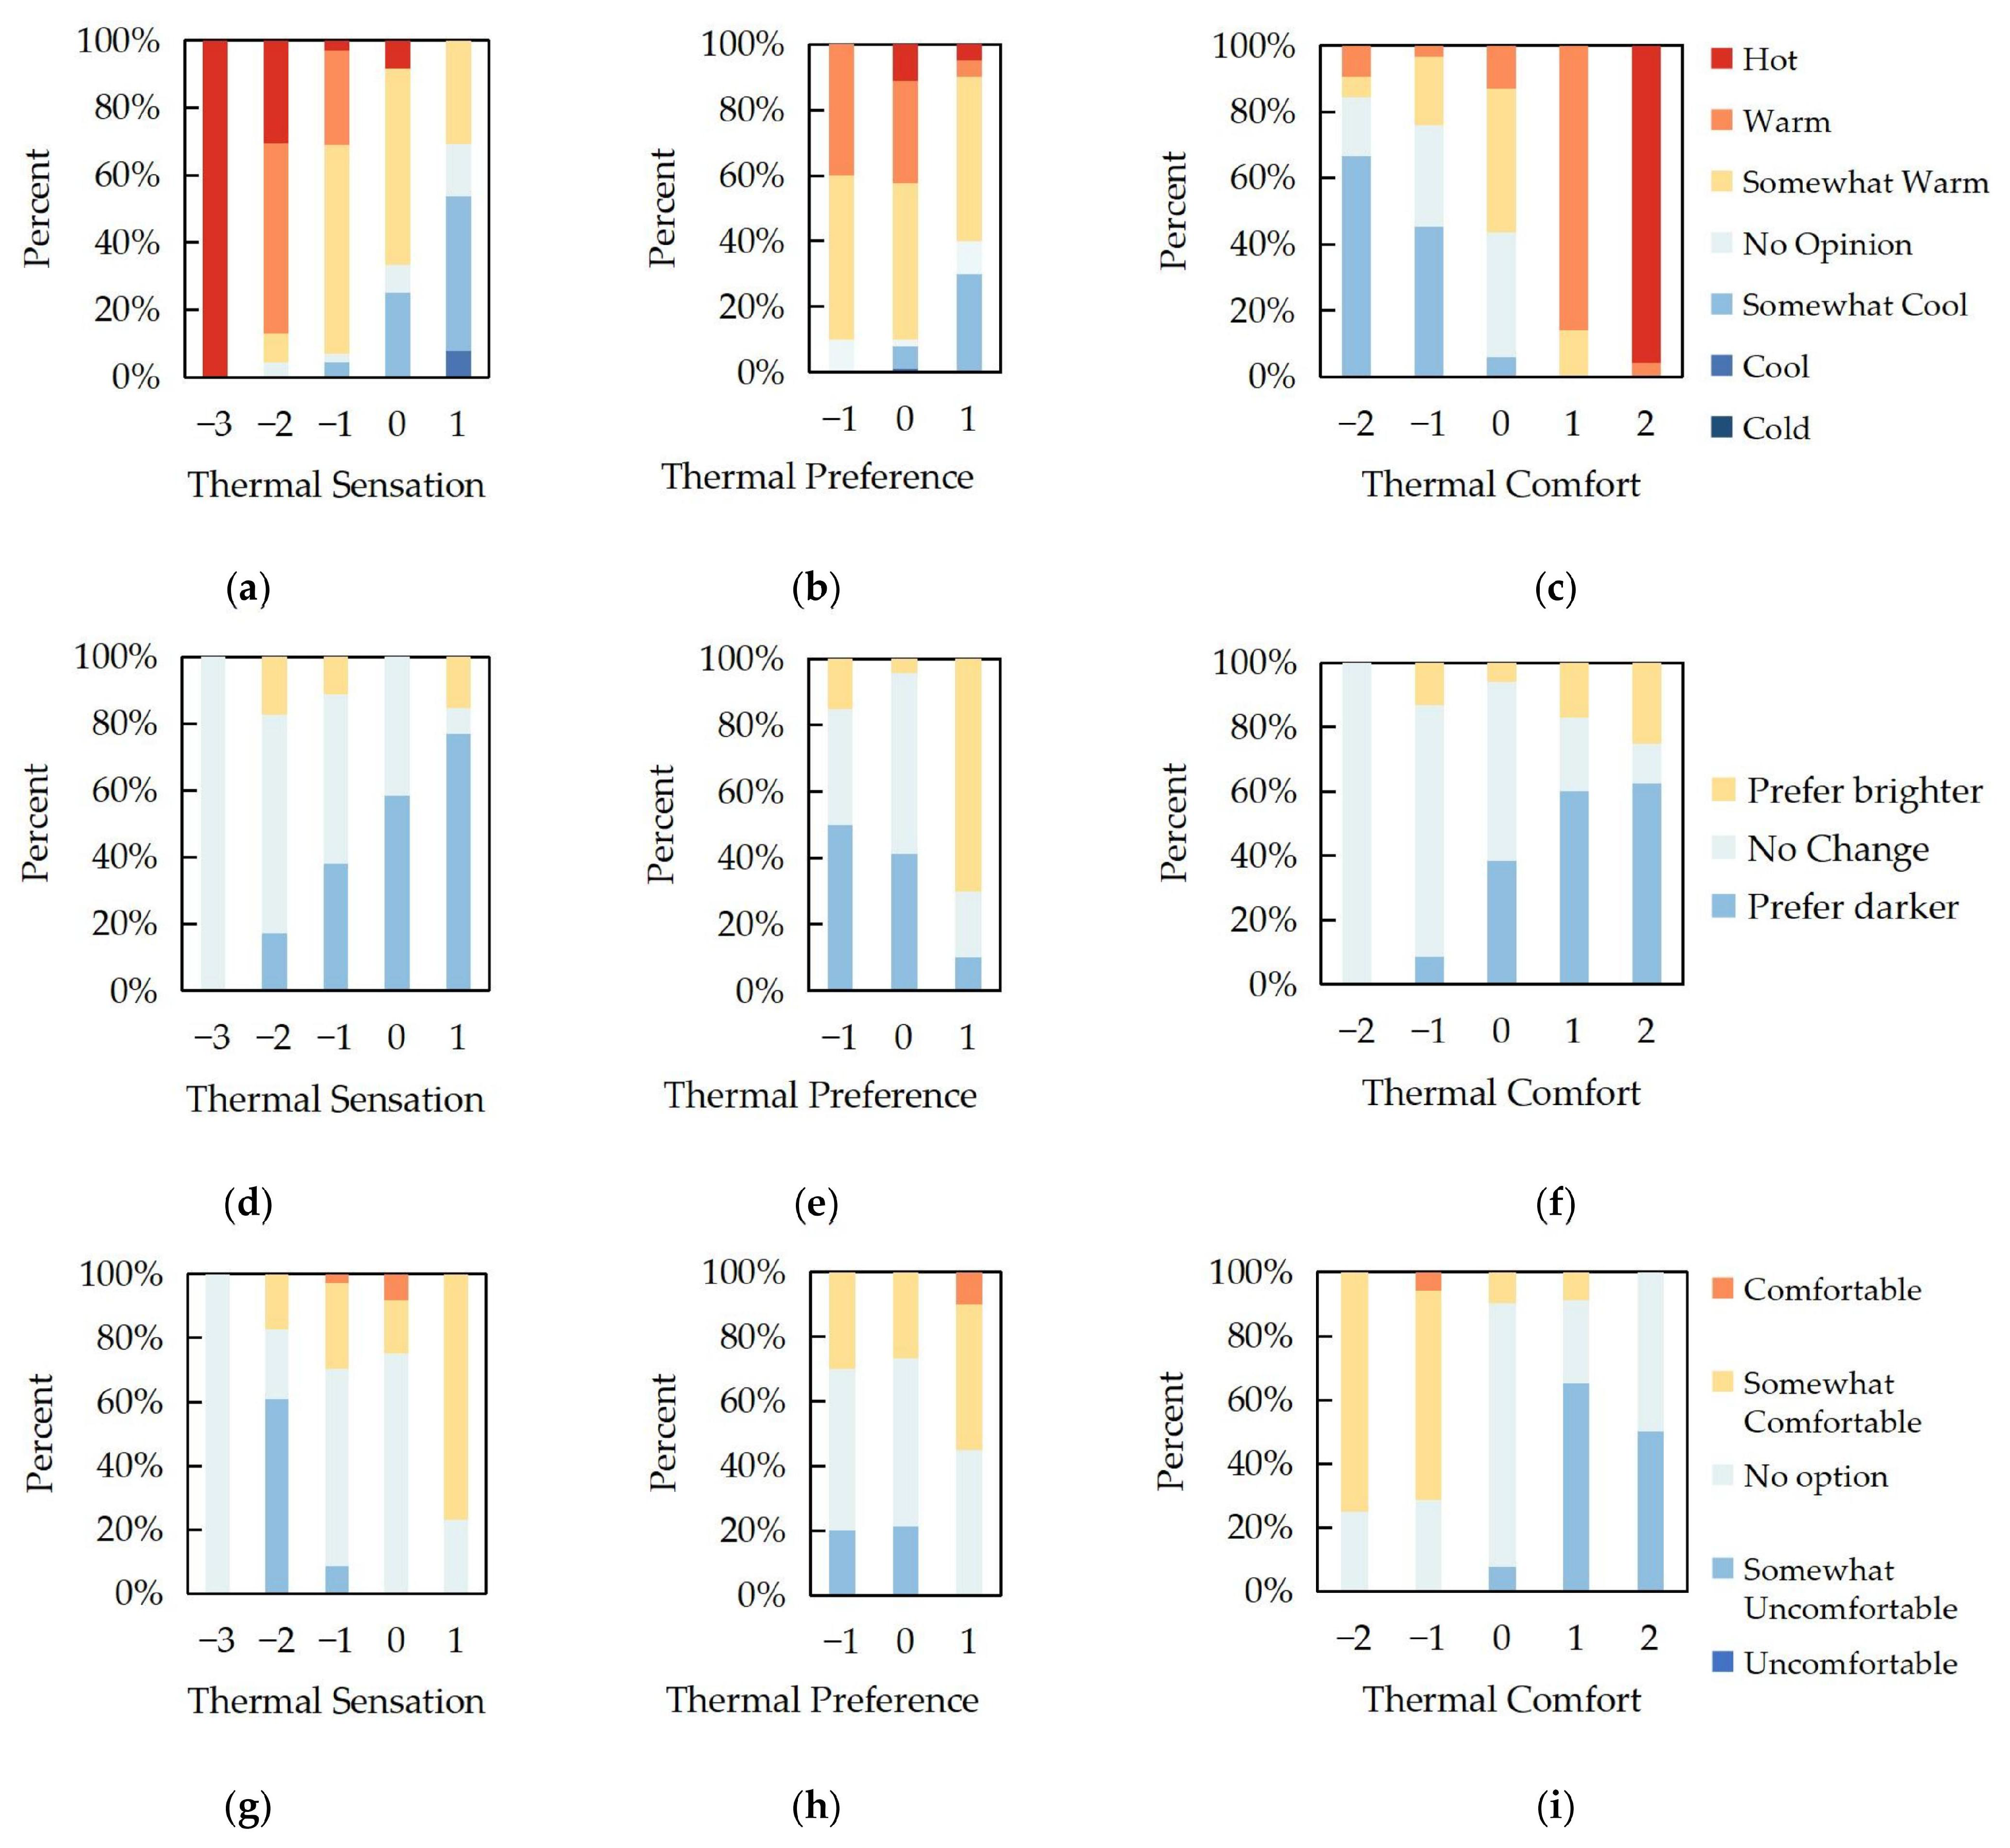
In addition, a positive correlation was identified between the TSV and SSV: the correlation coefficient was 0.615, implicating thermal and non-thermal factors. However, the combined effect of these factors varied across different space types, resulting in differences in UTCI values. Previous studies have established the significant impact of the UTCI on individuals’ subjective TSV; this study found that the UTCI also influences the SSV. In spaces characterized by high Ta, the UTCI variations had a more pronounced impact on the TSV and TCV, with individuals tending to experience more comfortable thermal sensations in low SI environments. In spaces with low Ta, the TSV increased with an increase in SI.
This study also explored the relationship between UTCI levels and visual comfort. Under conditions of low outdoor light intensity, higher UTCI levels were observed to reduce individuals’ SSV and increase the VCV. In contrast, environments with higher SI resulted in lower UTCI levels, suggesting a more comfortable visual experience.
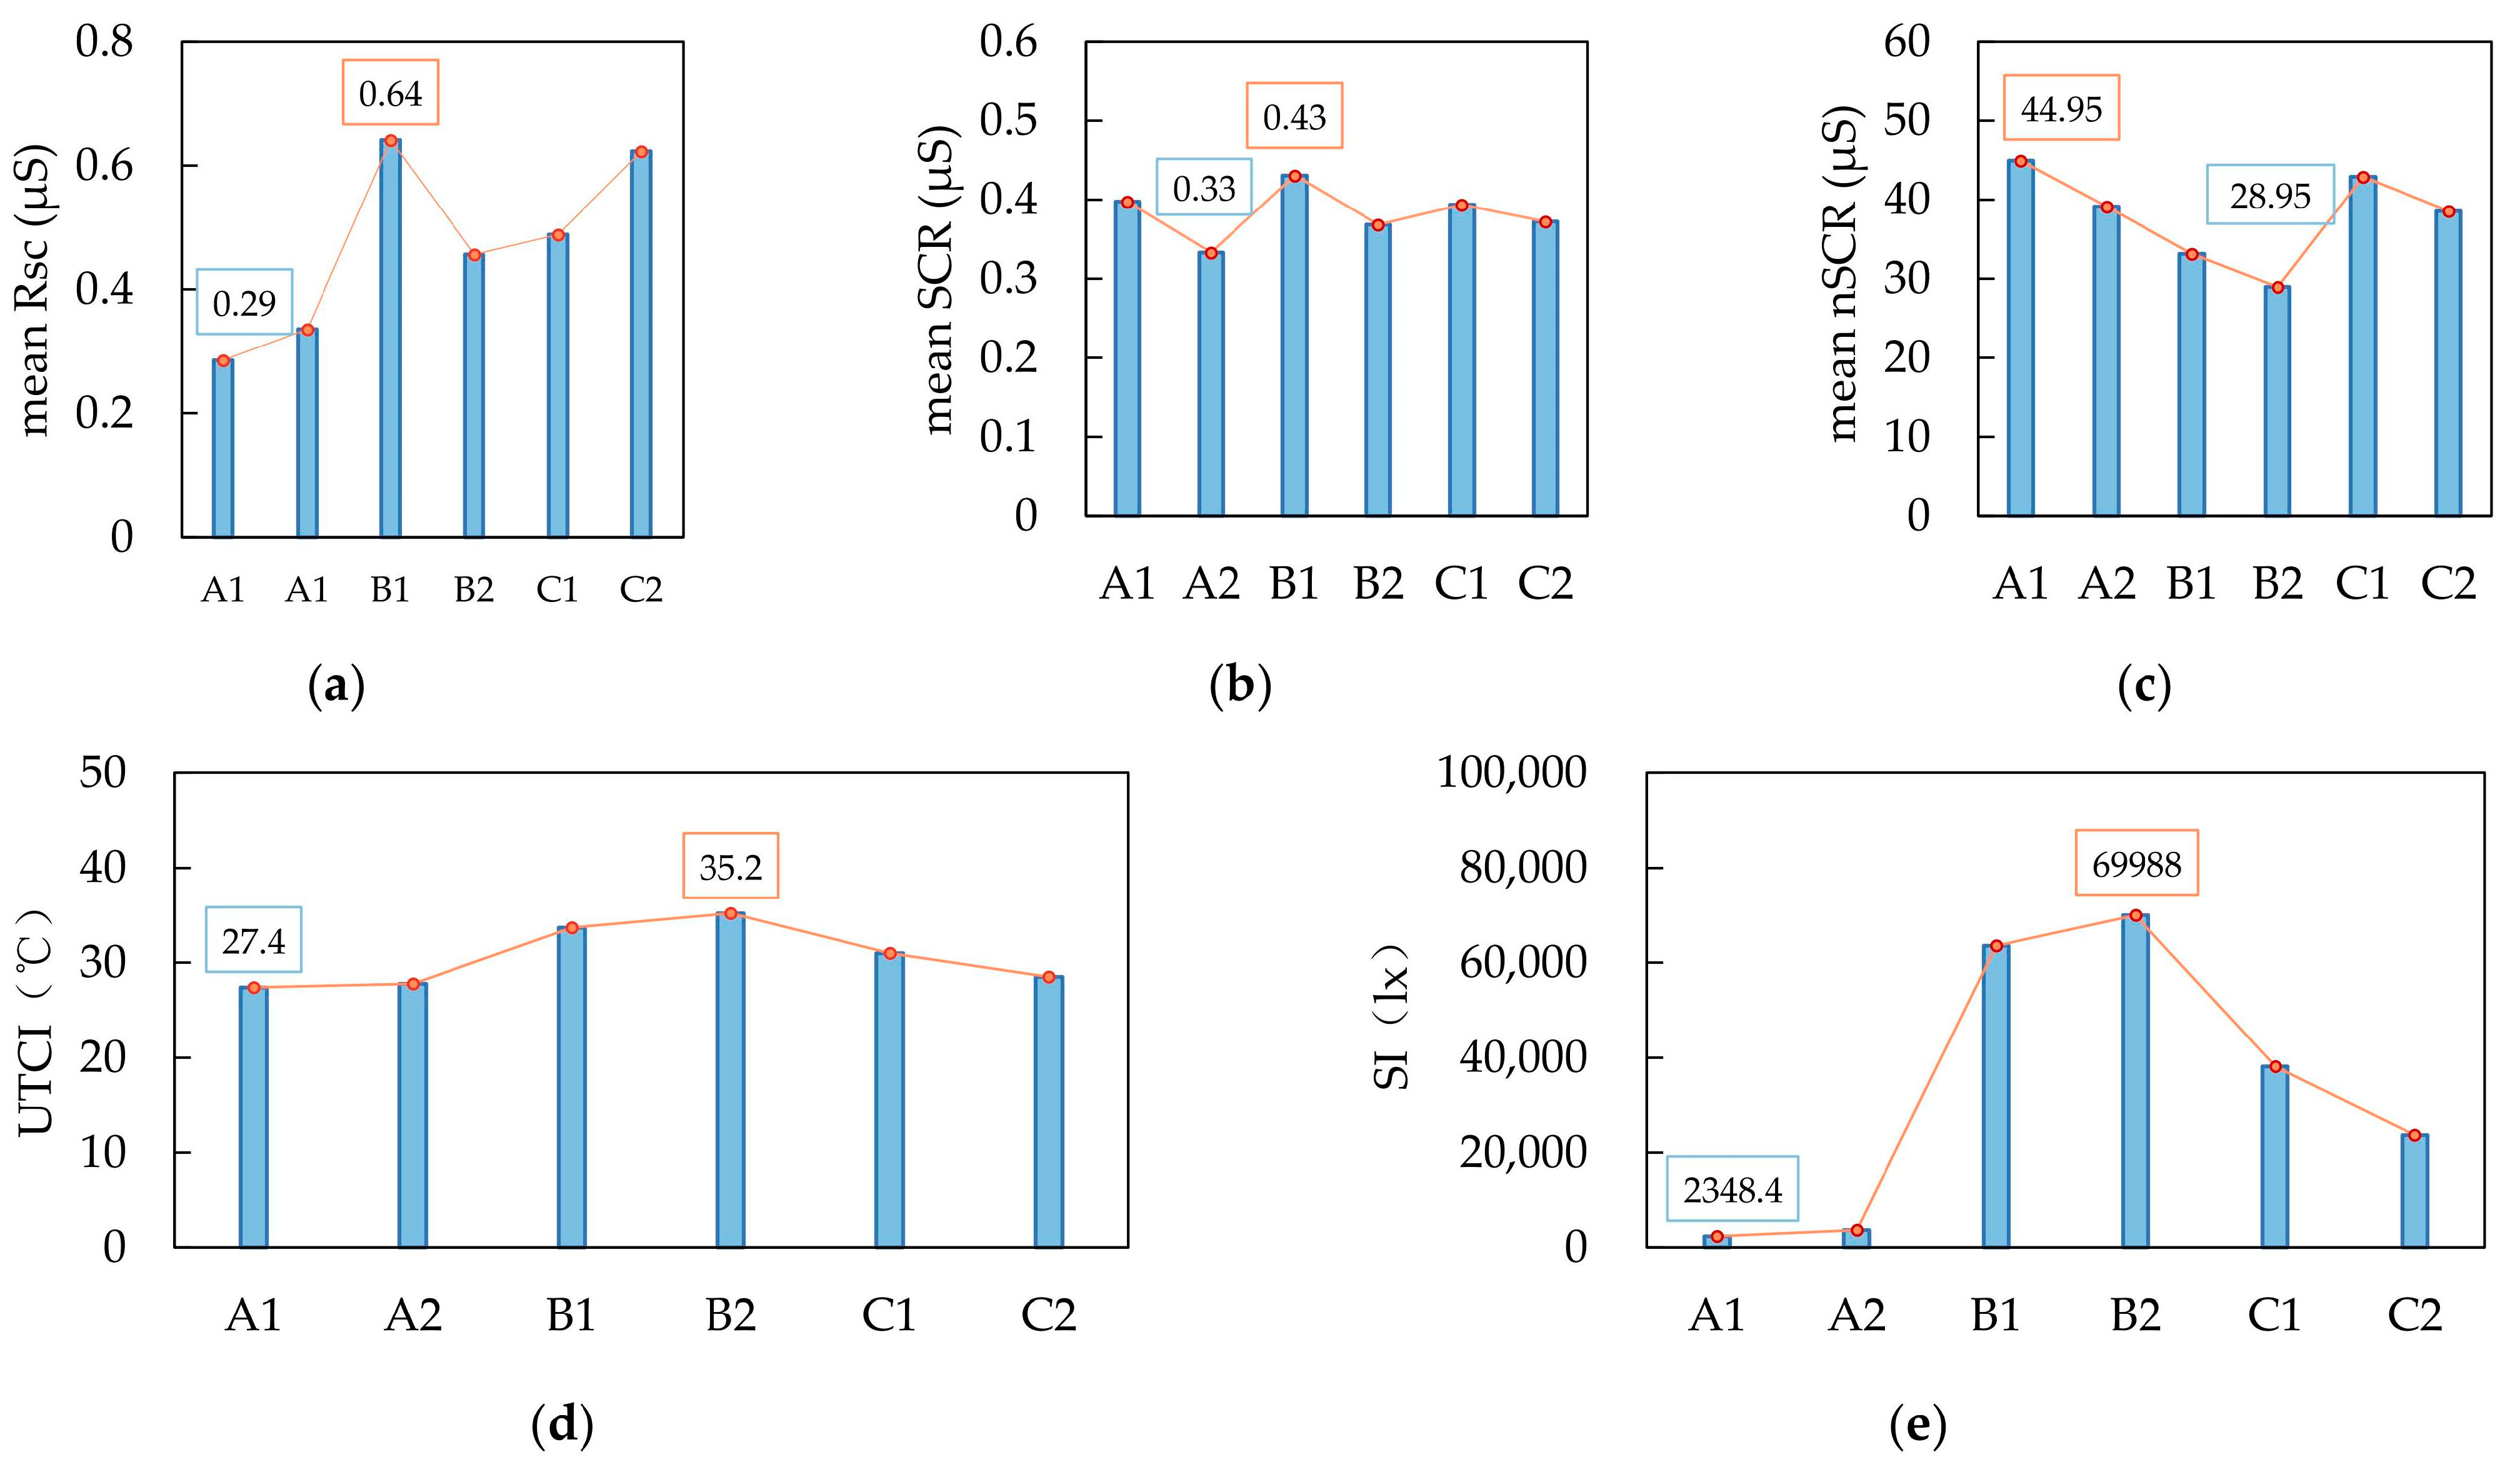
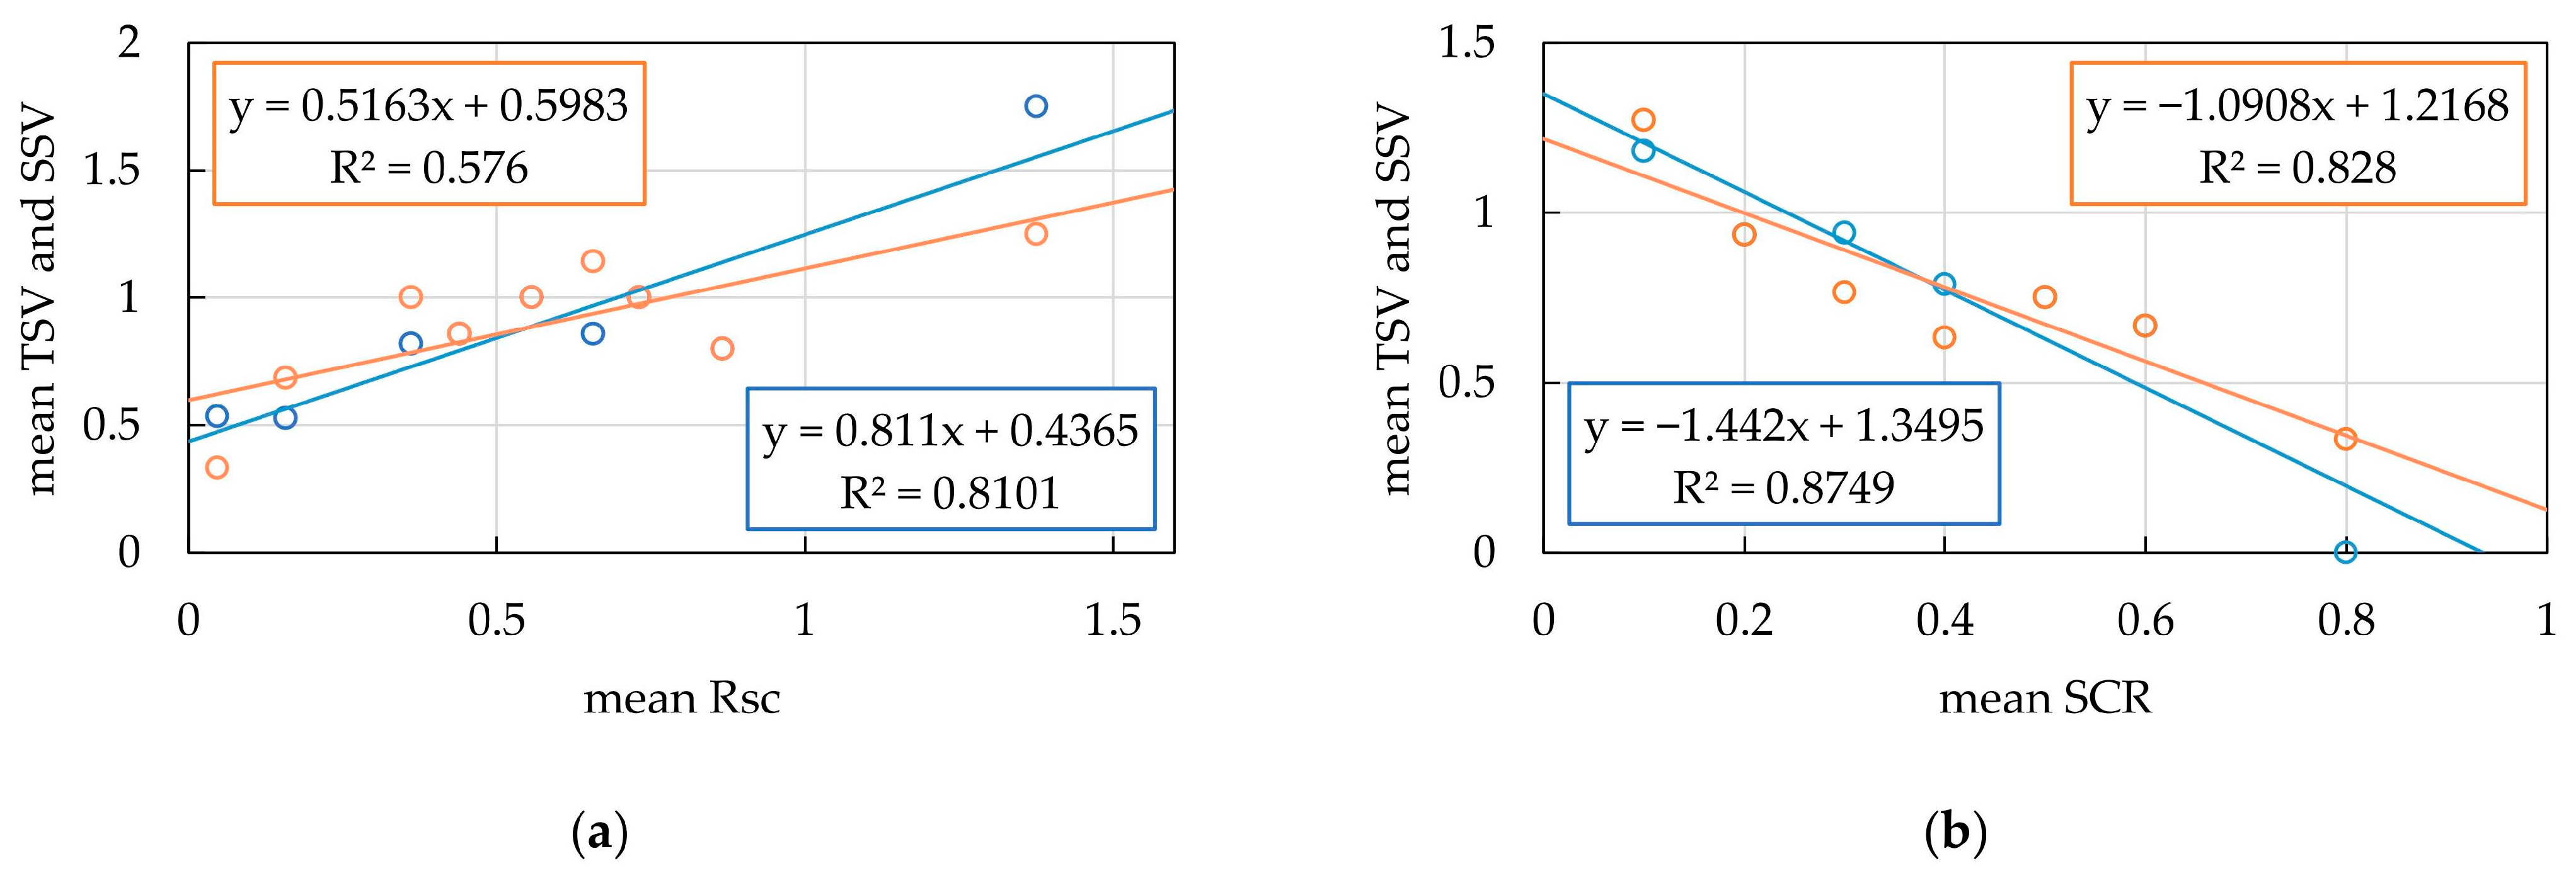
Furthermore, three physiological indices (Rsc, SCR, and nSCR) were identified as being particularly sensitive to environmental changes in outdoor environments, and both thermal and non-thermal factors were significantly correlated with the Rsc and nSCR. The correlation coefficients with Tg were 0.214 and −0.382, and the correlation coefficients with SI were 0.246 and −0.297. Specifically, the Rsc exhibited a strong correlation with SI, indicating that changes in light intensity directly influenced participants’ physiological responses. Weak correlations were also observed between the Rsc and Ta, Tg, and Tmrt. Additionally, linear regression analysis revealed a positive correlation between the Rsc and participants’ visual–thermal sensations—particularly with the TSV and, to a lesser extent, with the SSV. This suggests that both thermal and non-thermal effects directly impact individuals’ perceptions and lead to physiological reactions. For example, higher Ta results in a sensation of heat, triggering sweating and blood vessel dilation, which leads to an increased Rsc.
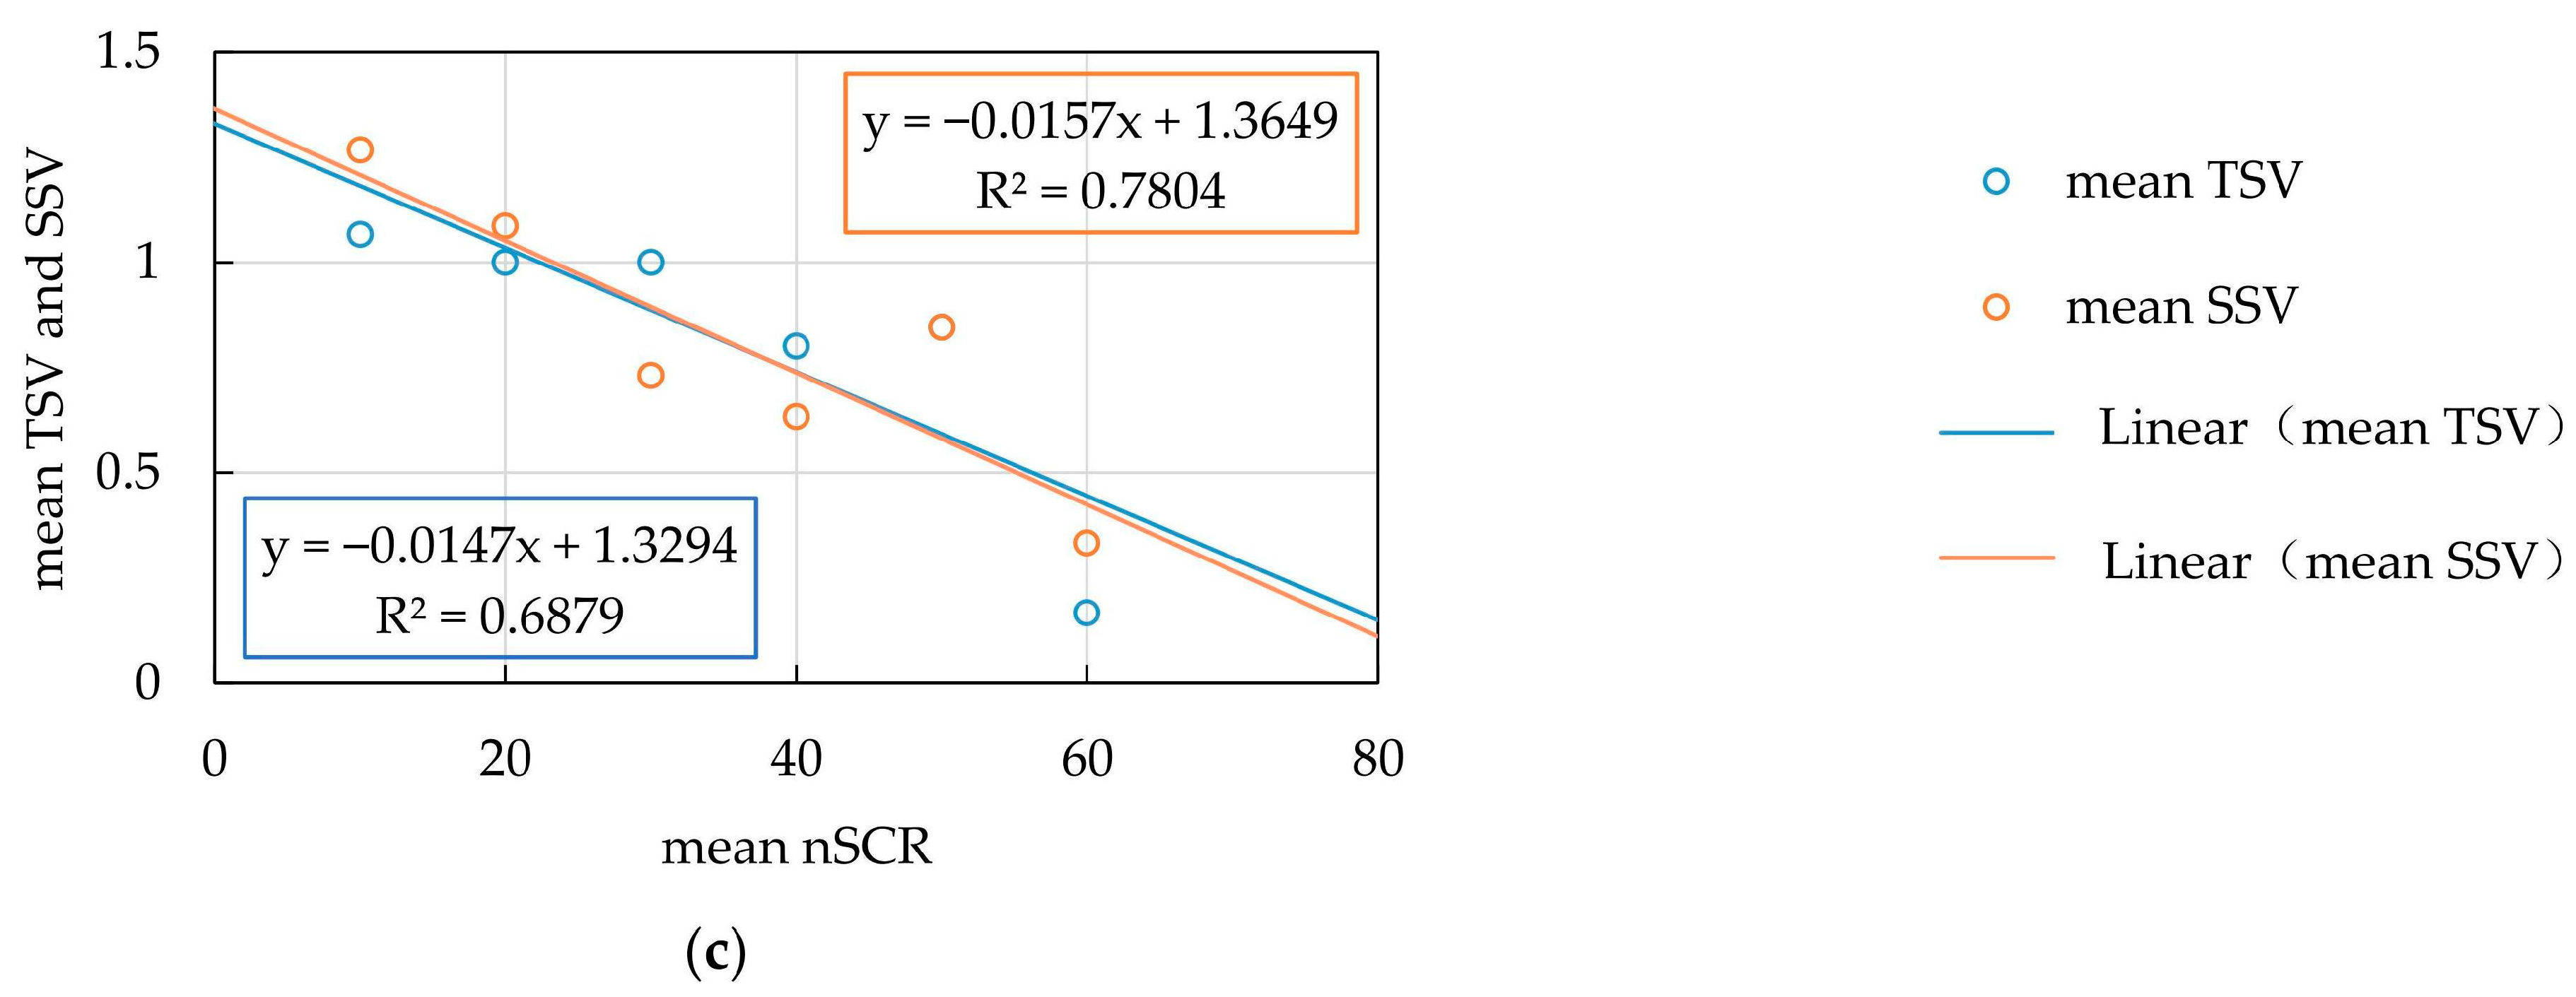
Conversely, high SI induces tension and the constriction of blood vessels via visual stimulation, resulting in an elevated Rsc. In contrast, Ta, Tg, and Tmrt have weaker effects on the Rsc, suggesting that their influence on human comfort occurs indirectly and may depend on overall environmental conditions and interactions. For example, high Tg may contribute to discomfort in the human body, but this discomfort may be caused by a combination of multiple thermal effect factors rather than by temperature alone. Conversely, the nSCR exhibited a significant negative correlation with Ta, Tg, Tmrt, and SVF and a significant positive correlation with Rh, while showing relatively weak correlations with Mws, the UTCI, and SI. Linear regression analysis demonstrated negative correlations between the nSCR and the TSV—and especially between the nSCR and the SSV—indicating that the nSCR is particularly sensitive to changes in light intensity. The weak relationship between the nSCR and the TSV may be attributed to the limits of thermal sensations’ influence on physiological and psychological activation states or the limited range of changes in thermal sensations accounted for by the experiment.
The study also revealed that the Rsc had a stronger positive correlation with SI in environments with lower Ta, while the nSCR exhibited a more pronounced negative correlation with Ta in environments with lower SI. The correlation coefficients for the Rsc between the SSV and TSV were 0.81 and 0.57, respectively, while the correlation coefficients for the nSCR between the SSV and TSV were 0.78 and 0.68, respectively. The Rsc’s higher correlation with the TSV suggests that it is a more reliable predictor of thermal sensation. Conversely, the nSCR was more strongly correlated with the SSV, indicating that it can be used to accurately predict visual comfort. Therefore, it may be concluded that the Rsc can predict the TSV under intense stress (UTCI: 26–32), while the nSCR can be employed to predict the SSV under even greater stress (UTCI: 32–38).
Furthermore, SCR did not exhibit significant correlations with environmental variables, and spatial differences had minimal effects. Therefore, SCR should be regarded as a supplemental indicator for evaluating thermal comfort. Linear regression analysis revealed negative correlations between SCR and the TSV, as well as SCR and the SSV, suggesting that environmental stimuli have a substantial impact on SCR. While environmental variables primarily affect visual–thermal comfort, their effects on physiological responses, such as blood circulation and sweat gland secretion, may not be immediately reflected in SCR measurements. This likely explains the weak correlation between SCR and environmental variables, as well as the minor effects different spaces had on this index. However, SCR still has value for its ability to provide supplementary information on visual–thermal comfort and indicates specific points on the human body that allow the effects of outdoor environmental stimuli to be accurately evaluated.
The findings of this study have important implications for landscape planning, design, and the sustainable development of thermal environments on campuses in China. Despite certain limitations, the experiment highlighted the influence of spatial characteristics on the visual–thermal comfort of its participants. Campus planners and landscape designers should consider how to effectively combine landscape elements and spatial layout in ways that improve overall visual and thermal comfort. The correlations between visual comfort, thermal comfort, and human physiological parameters (such as skin conductance) identified in this study can also be used as a basis for evaluating human experience and satisfaction. It should be noted that, as this study focused on a specific campus setting under typical summer weather conditions, future research should attempt to explore the relationships between a wider range of physiological parameters over multiple seasons, providing a more comprehensive understanding of visual–thermal comfort in green campus spaces.


