1. Introduction
Promoting ecological protection and high-quality development of the Yellow River Basin holds immense historical and strategic significance. The Xiliugou tributary is located in the upper reaches of the Yellow River and is characterized by poor natural conditions, a fragile ecological environment, and prominent soil erosion problems. It is also a major source of coarse sediment that flows into the Yellow River basin. During heavy rainfall periods, floods with high sand content are particularly common. This area covers 1.19 × 10
3 Km
2 and is one of the direct contributors to the “hanging rivers on the ground” in Inner Mongolia and downstream of the Yellow River, which pose a severe threat to local ecology and infrastructure (accelerated equipment wear, exposed foundation of building, etc.). It is, therefore, imperative to conduct scientific research on wind and sand erosion in the Xiliugou tributary to develop and implement effective soil and water conservation measures [
1].
Yang et al. (2018) [
2] used remote sensing images to study the spatial and temporal variations of wind-blown sediment entering the river channel. Yao et al. (2016) [
3] conducted MK experiments to analyze changes in sediment load and their influencing factors in the river basin. By tracking sediment core SSK80/GC2, which had been collected from the Arabian Sea over the past 50 years, Sebastian et al. (2023) [
4] could infer the aridity of the source area and the strength of the southwest monsoon during the deposition period. In another study, Samani et al. (2021) [
5] analyzed the extent to which five different geomorphological types of dune sediments contributed to parts of the Urmia salt lake that had dried up. Meanwhile, Chen et al. (2022) [
6] performed mathematical simulations to map the spatiotemporal distribution of dust emissions in the Aral Sea region and trace the process of dust migration and sedimentation. While many scholars have studied the sediment problem in the Xiliugou tributary in recent years, most previous studies have focused on the macroscopic scale or concentrated on water erosion. In particular, potential wind and sand hazards in the middle reaches of Xiliugou, which also require attention and management, have been ignored.
At present, the fundamental measures for preventing sand damage and improving the environment in sandy areas involve suppressing or weakening the intensity of wind and sand flow. To effectively develop measures for preventing and controlling wind and sand disasters, it is necessary to accurately determine the characteristics of wind and sand movement and sand transport flux. In this study, field observations of wind and sand flow were conducted on the underlying surfaces in the middle reaches of the Xiliugou tributary. The sand transport flux of wind-blown sand flow in different underlying surfaces was determined, and relationships between the transport rate of wind-blown sand, height, and wind speed were analyzed using field survey data. Mathematical fitting models, combined with previous research results, were used to analyze the spatial differences in sand transport flux and particle size distribution characteristics of wind-blown sand flow, revealing the characteristics of wind-blown sand transport fluxes in the Xiliugou tributary. This research aimed to lay a foundation for facilitating a comprehensive understanding of the principles and patterns governing wind and sand erosion, as well as accumulation in this region. These findings provide valuable data support for scientifically controlling wind-blown sand into the Yellow River Basin, and a scientific and theoretical basis for preventing and controlling wind-sand erosion in similar areas.
2. Materials and Methods
2.1. Overview of the Study Area
The Xiliugou tributary is one of the ten basins along the Yellow River, located in Ordos City, Inner Mongolia Autonomous Region (109°24′–110°00′ E, 39°47′–40°30′ N). The region has a typical arid continental climate with significant seasonal changes(
Figure 1). The average annual temperature is 6.4 °C, and the average annual precipitation is only 271.2 mm, while the average evaporation is as high as 2200 mm. The upper reaches of the tributary are characterized by loess hills and gullies, while the middle reaches consist of the Kubuqi Desert, both of which are wind-sand areas dominated by fixed and semi-fixed sand dunes. The primary erosion force in these areas is wind. In contrast, the lower reaches are mainly alluvial plain areas, with low rainfall intensity and slight erosion but suffer from issues of serious riverbed siltation and diffuse beach. The study area was generally characterized by high wind and sand and a dry climate, which was located in the overlapping area of wind erosion and sand erosion, and soil erosion. The predominant wind direction is from the northwest, with an average annual wind speed of 3.1 m/s and a wind power ranging from level 2 to 8. Dust storms are most prevalent from March to May and can reach maximum wind speed of 14 m/s. The annual average evaporation rate (2200 mm) is more than seven times the precipitation rate (305.9 mm). The soil in the area is mainly composed of chestnut soil and coarse chestnut soil. The basin spans a total length of 106.5 km, with a total area of 1193.8 km
2. The length of the wind-blown sand area in the middle reaches is about 18 km, and the area is 280.7 km
2. The eastern riverbank is relatively well-vegetated compared to the western bank, and sand dunes in the area range from a height of 1 m to a peak height of 38 m [
7].
2.2. Sample Plot Setting and Investigation
The midstream wind and sand area of Xiliugou, a typical watershed in the tributaries along the Yellow River, was selected as the study area to investigate the wind and sand transport patterns in August 2021. This was conducted by establishing a foundation for subsequent observations and experimental studies of wind-blown sand transport. At the junction of riverbed and sand dune corresponding to different underlying surfaces, a flat sample plot on the east and west sides (upwind and downwind) of the riverbed was chosen as the typical observation section and designated as A1, B1, C1, D1 and A2, B2, C2, D2, respectively (
Figure 2). A quadrat survey was employed to conduct a plant survey, with shrub quadrats measuring 10 m × 10 m and herb quadrats measuring 1 m × 1 m. A stepped sand sampler, measuring 50 cm in height, was set up along the main wind direction, and three repeated measuring points were set up at each position at equal intervals to ensure the adequacy and accuracy of sand collecting.
2.3. Sand Transport Flux Observation
Sand transport flux refers to the total amount of sand particles passing through a specific study section within a set period of time. A rotating continuous sand accumulator (
Figure 3) was installed in various types of sand, as it is a commonly used sand collector worldwide. This sand accumulator enabled the collection of sand transmission from 0 to 50 cm height simultaneously, with the sand being collected in the sandbag of the accumulator. The sand inlet of the accumulator was 2 cm × 2 cm in size, and 25 layers were continuously divided into 5 segments, specifically 0–10 cm, 10–20 cm, 20–30 cm, 30–40 cm, and 40–50 cm, respectively. These segments mainly aimed to collect sand transmission from different wind directions near the surface during the sandy weather. The sand transport volume was primarily collected from the near-surface under different wind directions during the sandy weather. During the observation test, sand samples were taken from each observation point and placed into sealed bags. The collection time was recorded, and the sand samples were weighed afterward.
The collected samples were dried at 105 °C for 12 h to weigh the dry weight. The particle size of the samples was then determined using a British Malvern MM 2000 laser particle size analyzer.
The fitting function was calculated according to the sediment discharge in different height ranges of each observation point in each observation stage. The horizontal sand transport flux through the section of 0~50 cm high and 100 cm wide of each underlying surface was then determined by using the definite integral. The calculation formula is as follows [
8]:
In the formula: Q is the horizontal sand transport flux in the height range of 0~50 cm; z is the sand transport volume at 5 levels; qz is the fitting equation of sand transport volume with height at 5 levels.
According to the results of the wind tunnel test study in Zinge, the functional relationship between the sand transport rate
q(z) of different height layers above the bed and the corresponding height
z was derived, namely:
In the formula: q(z) is the sand transport rate at height z; b is a constant that varies with sand grain size and shear force; a is the reference height; n is the index.
2.4. Airflow Observation
The observation instrument used was a calibrated EC 9-1 three-cup anemometer, which automatically collects and stores the observation data every 5 s (
Figure 4). To obtain long-term meteorological data, an LGQ-TH1 solar-powered environmental monitoring system was installed in the Xiliugou tributary. This system measured multiple indices such as wind speed, wind direction, solar radiation, ground temperature, rainfall, and evaporation at a height of 2 m. The data were collected every 2 min, and the monitoring data could be downloaded from the website (
http://cloud.usr.cn/, accessed on 28 July 2022).
2.5. Determination of Sand-Driving Wind
According to the standard weather station of the China Meteorological Administration, wind speed is typically determined at a height of 10 m. However, for our research, we utilized an automatic weather station situated within the dune cluster, which recorded wind speed data at a height of 2 m. Therefore, it was necessary to convert the wind speed data from 2 m to 10 m using the appropriate formula while the wind direction remained unchanged.
In the formula below, U
10 is the 10 m height wind speed; U
2 is the 2 m height wind speed; Z
0 is the surface roughness [
9].
Frictional wind speed, denoted as U*, was a critical parameter in determining the sand transport potential of a surface, as it remains largely constant within the near-surface layer. The log-law formula is derived by applying an empirical formula that relates length to the distance from a solid wall and incorporating Carmen’s constant, which is an experimental parameter. This yields a fully developed formula that describes the near-wall surface in a state of steady-state turbulence. Assuming that the airflow within the internal boundary layer was fully adjusted to the new surface, the wind profile can be expressed as a logarithmic function of height.
In the formula: Uz is the wind speed at height z (m) (m/s); k is von Karman’s constant (0.4); Z0 is the surface roughness (m); d is the zero plane displacement (m).
2.6. Classification of Subsurface Types
Between June 2020 and August 2022, a comprehensive plant community survey was conducted in the study area. To ensure a representative sample, a survey site with uniform spatial distribution of plants was selected. Within each selected survey site, a 100 m × 100 m sample plot was established using the five-point survey method, consisting of five 10 m × 10 m shrub samples and nine 1 m × 1 m herb samples in each sample plot. All identified shrubs and herbaceous species within the sample plots were documented, and the basic characteristics of the plants were determined using the ecological “three degrees and one measure” method (
Figure 5).
2.7. Data Processing
The calculation of vegetation coverage, analysis of wind speed, wind direction, and sand transport data was performed using Microsoft Excel software 2017. The representation of wind direction through a rose diagram and sand transport rate through a diagram was facilitated by the use of Origin 2021 software. Finally, the experimental layout diagram was created using AutoCAD version 19.0.
3. Results and Analysis
3.1. Characteristics of the Underlying Surfaces
3.1.1. Vegetation Characteristics
The underlying surface types in the study area were categorized into three classes: moving sandy land, semi-fixed sandy land, and fixed sandy land based on vegetation coverage. The results for this division are shown in
Table 1.
3.1.2. Wind Regime Characteristics
Wind speed is the basic parameter to evaluate regional wind-blown sand activity [
10].
From 2017 to 2021, the variation trend of monthly wind speed in the study area tends to be consistent (
Figure 6a). During this time, sand-driving winds were mostly concentrated in spring months (March to June), followed by winter, with wind speeds ranging from 0 to 13.49 m/s. The predominant wind directions were west-northwest, northwest, and north-northwest (292.5°~337.5°) (
Figure 6b). The speed of sand-driving wind in the Xiliugou tributaries was 5 m/s.
Figure 7 shows that the cumulative duration of sand-driving winds with speeds greater than 5 m/s is 1875 h, accounting for about 20% of the total hours of the year. These sand-driving winds were predominantly concentrated in spring months (April, May, and June), with wind speeds ranging from 5 to 9 m/s.
The hyperconcentrated flows formed in the upper reaches by rainstorms in rainy seasons are favorable for the release of the sediment. In spring and winter specifically, a large volume of aeolian sediment is transported by the wind from sand dunes to the gullies, main channels and floodplains and temporarily stored there. In the following summer, the stored aeolian sediments are delivered downstream by the water. The data of the surveyed dunes in the Xiliugou Tributary can prove the existence of the interseasonal sediment storage and release in the sediment delivery processes in the Ten Tributaries.
3.2. Characteristics of Sand Transport Flux
According to the records of the wind regime, the frequency of wind-blown sand activities is most pronounced between January and June annually. During this time frame, the sand transport flux of wind-blown sand flow on three different underlying surfaces was measured (
Figure 8). The analysis demonstrates marked variations in sand transport flux across the 1-m-wide and 50-cm-high sections of the eastern and western sides of the three underlying surfaces at different points in time.
During the observation period, the sand transport flux of moving sandy land was significantly higher than that of fixed and semi-fixed sandy land. The average sand flux per unit area of moving sandy land in upwind direction (west bank) is 240.95 kg/m2, which is 4.4 times that of semi-fixed sandy land and 16.6 times that of fixed sandy land. The wind-blown sand contribution rate of different underlying surface types was calculated according to the basin area corresponding to different sandy land types. The results showed that the wind-blown sand contribution rate of moving sandy land was 77.67%, while that of fixed and semi-fixed sandy land was 4.68% and 17.65%, respectively. The disparity can be attributed to the underlying surface vegetation coverage. A relatively stable sand crust is formed on the fixed sandy surface, effectively reducing the contact area of wind and quicksand, thus reducing wind erosion.
In moving sandy land, the height of sand dunes can have a certain impact on the sand transport flux per unit area. The average transport flux per unit area for tall dunes is 9.65 kg/m2 more than that of low dunes. Unlike in the upwind direction (west bank), there is no significant difference among the average sand transport flux per unit area of different underlying surfaces in the downwind direction (east bank), which indicates that the sand transport flux in the east bank is not directly impacted by the wind erosion in the west bank.
3.3. Vertical Variation of Surface Sand Transport Rate in the Tributary
During the study, it was found that the sand transport flux in the height range of 0-50 cm in different sandy lands accounted for more than 90% of the total sand transport flux. Therefore, this study focuses on analyzing the sand flux in the 0~50 cm height range.
Figure 9 illustrates the relationship between the height and the rate of sand transport for various underlying surfaces, given different wind speeds. The trend observed is a decrease in the rate of sand transport as height increases. However, there appears to be a boundary at 10 cm from the ground surface, beyond which there is a linear relationship between the rate of sand transport and height. Conversely, below the 10 cm boundary, the relationship exhibits a pronounced curved shape. This suggests the possibility of two distinct functional relationships between the rate of sand transport and height for different underlying surfaces, existing around the height of 10 cm.
3.4. Variation of Sand Transport Rate within 10 cm above the Surface
Figure 10 shows the relationship between sand transport rate and height (0 to 10 cm) in different sandy land types. Within the height of 10 cm, the sand transport rate demonstrates a sharp decrease as height increases, with a reduction rate ranging from 85% to 93%. The content of wind erosion within the near surface (0 to 3 cm) exhibits substantial fluctuation and lacks a clear pattern, due to the intricate interplay of sand grain movement modes, such as creep and saltate, close to the surface.
In the range of 0~10 cm, the sand transport rate of different underlying surfaces has a robust exponential function relation with height. The exponential function formula is:
In the formula: y represents the sand transport rate, quantified in g/(cm·min); x represents the height, expressed in cm; a and b are regression coefficients. We can observe that as wind speed increases, the total sand transport within the airflow increases as a whole. Within the height range of 0 to 10 cm, the correlation coefficient of the exponential function between the sand transport rate and height is above 0.92, indicating an extremely high correlation. Therefore, the exponential function relationship can effectively and accurately reflect the relationship between sand transport rate and height within the 0~10 cm range.
3.5. Variation of Sand Transport Rate in the Height of 10 to 50 cm from the Surface
Figure 11 depicts the relationship between the sand transport rate and the height in the range of 10 to 50 cm in the moving sandy land. As the height increases within the bounds of 10 to 50 cm, the wind erosion rate shows a decline, albeit with a relatively modest reduction. As wind speed increases, the sand transport rate in each elevation experiences an upward trajectory.
At the height of 10 to 50 cm, the distribution of wind erosion content follows a power function as follows:
In the formula: y represents the sand transport rate, denoted in units of g/(cm·min); x represents the height, expressed in cm; a and b are regression coefficients. The height range of 10 to 50 cm exhibits a highly correlated power function relationship between sand transport rate and height, as indicated by a correlation coefficient (P) greater than 0.93. This indicates that the power function relationship can fully reflect the actual distribution of wind erosion content with a height in the range of 10 to 50 cm.
The height of the sand collector used in this study is 50 cm. The simulation results provide the total sand transport rate of the 0 to 50 cm layer on various underlying surfaces, which needs to be calculated. The following formula and steps can be used for the calculation:
Using Formulas (7) and (8):
In the formula, q(x) represents the sand transport rate at the height of x, expressed in units of g/(cm·min); x is the height, expressed in units of cm; 0.9 is the sand collection efficiency; a and b are regression coefficients. Through Formula (9), the total sand transport rate from moving sandy land to river channel can be calculated.
3.6. Relationship between Total Sand Transport Rate and Wind Speed
3.6.1. Relationship between Total Sand Transport Rate and Wind Speed on Different Underlying Surfaces
Figure 12 displays the relationship between the total sand transport rate and wind speed on the sandy land of the Xiliugou tributary. The sand transport rate depicted in the Figure is the total sand transport rate calculated by the simulation function Formula (9). The wind speed represented is the average wind velocity recorded at the height of 2 m during each observation period. The analysis of the relationship between the sand transport flux of different underlying surfaces and the wind speed greater than 5.0 m/s (
Figure 12) shows that the total sand transport rate of the three types of underlying surfaces increases with the increase in wind speed. However, the sand transport rate on the moving sandy land is significantly higher than that of the fixed and semi-fixed sandy land, indicating that the latter surfaces exhibit good wind erosion resistance, while the bare moving sandy land is vulnerable to wind erosion.
Based on our findings, a relationship model between the sand transport rate per unit width and wind speed of different underlying surfaces is established. The results of the analysis indicate that the fitting function of unit width sand transport rate of different underlying surfaces and wind speed exhibits an exponential function relationship:
In the formula: q(v) represents the sand transport rate, expressed in the units of g/(cm·min); x represents the wind speed, expressed in the units of m/s; a and b are regression coefficients.
By fitting verification, the correlation coefficient R
2 is greater than 0.93. The fitting function and correlation test results are shown in
Table 2.
3.6.2. Estimation of Wind Erosion of Blown Sand in the Tributary
When estimating the wind erosion modulus of the tributary, we should focus on the amount of wind erosion when the wind speed is high and the blown sand hazard is frequent. Then, the difference between the west bank of the Xiliugou tributary (points A1, B1, C1, D1) and the east bank (points A2, B2, C2, D2) can be used to obtain the deposition loss of wind erosion into the river channel. The calculation formula is as follows:
| Fixed sandy land: | (11) |
| Semi-fixed sand: | (12) |
| Moving sand: | (13) |
| | (14) |
In the formula, q(x1 − x2) represents the sand transport rate of the average wind speed at v, expressed in g/(cm·min); v represents the average wind speed.
If the tributary’s surface state remains unchanged for an extended period, Formulas (11)–(14) combined with wind speed data from the local meteorological station can be used to estimate the tributary’s annual wind erosion. The results indicate that 77.09%, 15.30%, and 7.61% of wind-bore sand in moving sandy land, semi-fixed sandy land, and fixed sandy land, respectively, enter the Yellow River. Based on this, the total annual wind erosion and sand transport of the Xiliugou tributaries are estimated to be 8.09 × 10⁵ t/a. However, further research should be conducted to account for other factors, such as dune movement, river bank collapse, and atmospheric dust fall, which also contribute to the wind-blown sand volume in the tributaries.
3.7. Particle Size Characteristics of Surface Wind-Blown Sand Flow
The analysis of wind-blown sand particle size can provide insights into the structure and movement patterns of wind-blown sand flows [
11]. From
Figure 13, it is evident that the particle size composition of wind-eroded sand was similar across different types of underlying surfaces on both the east and west banks of the river, indicating no influence by the vegetation cover on the underlying surface. Fine and very fine sand particles dominated the particle size composition of wind-eroded sand on different underlying surfaces of the west bank, comprising about 45–50% of the total, while the particle size composition of wind-eroded sand on the east bank was dominated by powder and clay particles, accounting for about 60% of the total.
The investigation revealed that the difference in the particle size composition of wind-eroded sand was primarily attributed to the dissimilarity of sand sources between the east and west banks. The west bank was predominantly affected by desert wind sand from the upstream region, while the east bank was mainly affected by the sand accumulated from the river channel. The presence of gravel and plants on the underlying surface of the river channel increased the surface roughness, thereby increasing the wind speed of sand initiation and reducing the sand carrying capacity of airflow. This resulted in the deposition of large amounts of sand and dust in the riverbed. During windy periods, the riverbed was subject to secondary wind erosion, leading to the transportation of smaller powder and sticky particles as the main components. Moreover, human activities were found to exacerbate the wind and sand problems in the riverbed, especially the phenomenon of sand mining, which destroyed the stability of the bed structure and brought a large amount of sand material for wind erosion (
Figure 14). In addition, the loss of nutrient elements favorable to plant growth from the riverbed also hindered the growth of plants in the area. These disturbances caused by human activities undoubtedly intensified the rate of riverbed erosion, impeding the ecological recovery of the area.
To better illustrate the process of wind and sand erosion in the riverbed of the basin, a schematic diagram was created. This diagram serves to provide a more visual representation of the erosion process in the basin. Vehicles passing by also contributed to the generation of fine dust that added to the sand deposition on the east bank (
Figure 15). Although this phenomenon somewhat reduces the amount of sediment deposition, it also leads to the removal of a large number of nutrients that are essential for plant growth, hindering plant growth and exacerbating the damage caused by debris flow and flood. Furthermore, the sand mining pits on the riverbed surface accumulate a large number of sand particles, providing abundant material for hydraulic erosion. Thus, human activities have a detrimental impact on ecological restoration by exacerbating the problem of riverbed sand deposition and increasing its negative effects.
4. Discussion
4.1. Ecological and Geological Effects of Soil Wind Erosion
Following two major dust storms that occurred in China in recent years, mankind was prompted to reconsider their actions and their impact on such environmental phenomena. The study of the evolution of desertification, as well as its ecological impacts, is becoming increasingly important, particularly in ecologically vulnerable areas, such as Xiliugou Koudai in the Yellow River Basin. Here, the primary ecological consequences of wind erosion were observed to be the degradation of the ecological system in the basin, impoverishment of soil, and ensuing desertification. During the wind erosion process, fine particulate matter within surface soil was found to be easily carried away by airflow. This process caused the coarsening of surface soil in the affected area, leading to a significant loss of soil organic matter. The degradation of the ecology of sandy lands and the process of soil erosion were found to be intertwined. As vegetation coverage decreased, the exposed surface area increased, resulting in intensified soil wind erosion. This amplified erosion, in turn, further reduced vegetation coverage, thereby creating a vicious cycle. The geological impact of these processes was primarily observed in the acceleration of the sand dune movement towards the riverbed. This movement caused complex and varied geomorphological changes, which rendered the sand dune surface extremely unstable and unfavorable for sand-fixing vegetation. The loss of organic matter and essential nutrients, including nitrogen, phosphorus, and potassium, resulted in decreased soil fertility, land degradation, and a series of ecological and geological effects, including the weakening of the ecosystem’s support function.
4.2. Analysis of Different Factors of Sand Transport Flux
The factors that primarily influence the sand transport flux of wind-blown sand under identical wind speeds include vegetation coverage, sand source abundance, and surface stability [
12]. This study reveals that among the three underlying surfaces, the average sand transport flux of the moving sandy land is greater than that of the fixed and semi-fixed sandy land due to the abundant sand source in the upwind direction of the moving sandy land and sparse vegetation [
13]. While the surface of the dune is in a flowing state, the fixed sandy land and the semi-fixed sandy land, affected by the characteristics of the underlying surface, have formed a solid crust on the surface, with high vegetation coverage and rich species [
14]. During rainy years, the annual herbaceous plants are relatively rich in species, enhancing the plant species richness and surface coverage, thus effectively reducing the sand transport flux, indicating the vital role of vegetation in windbreak and sand fixation. As vegetation coverage increases, wind-blown sand flow activities decrease significantly. These findings are consistent with the conclusions of Sevink et al. (2023) [
15], which suggest that vegetation coverage is a crucial factor affecting sand transport by wind-blown sand flow at the same wind speed.
4.3. Analysis of Wind and Sand Fluxes
The variation of wind erosion content was found to be closely related to the shifting of wind erosion material movement across different height ranges. However, the distribution of wind and sand fluxes near the surface of different underlying surfaces is still inconclusive. Liu Fang et al. (2014) [
16] conducted a study on five typical underlying surfaces at the northeastern edge of the Ulanbuh desert, where they fitted the sand transport rate as a function of height within 0–100 cm and found that the power function yielded the best correlation. Wu et al. (2010) [
17] investigated the structure of wind and sand flow in Mu Us Sandy land, where they discovered that the sand transport rate on the top of flat flowing sand, flowing sand dunes, and fixed sand dunes exhibited a power function distribution with height. Meanwhile, the sand transport rate on the top of semi-fixed sand dunes showed an exponential distribution with height.
The sand transport flux of wind-blown sand flow on different underlying surfaces in the tributary is positively correlated with wind speeds greater than 5.0 m/s, following an exponential fitting curve. This suggests that as wind speeds and energy increase, the amount of sand transported by the airflow increases rapidly. This finding aligns with the exponential function relation between sand transport flux and the wind speed at 0~40 cm height observed in the Ulan Buh Desert studied by Xu et al. (2013) [
18], but differs from the power function relation between sand transport flux and the wind speed at 0 ~ 10 cm height studied by He et al. (1993) [
19]. The difference is that the functional relation between wind speed and sand flux can be attributed to different wind speeds, underlying surface characteristics, and monitoring height range of sand flux. In this study, different underlying surface types are classified into three categories, and the sand flux of each surface is influenced by different wind speeds to different degrees. The wind speed is higher for the fixed and semi-fixed sandy land, while relatively lower for the moving sandy land.
4.4. Characterization of Size Composition of Wind Erosion Sand Particle
The particle size of wind-sand flow is a crucial factor in the investigation of the physicochemical properties of wind erosion materials. It provides a valuable reference for analyzing the characteristics of the ground surface in different substrates as potential dust source areas [
20]. Furthermore, it is the fundamental information for verifying the initiation of wind erosion materials. The west bank of the watershed (upwind direction) has predominantly fine sand and very fine sand as wind erosion transport material. Although the proportion of sand transport’s primary grain size components gradually decreases due to increased vegetation cover, surface wetness, and other factors, very fine sand and coarse powder sand remain the main components. These findings indicate that fine sand is the primary constituent of wind-eroded sand transport in desert and sandy regions [
21]. The Kubuqi Desert is located on the west side of the Xiliugou tributary, indicating that the desert is the main source of wind-sand on the west bank of the Xiliugou tributary, consistent with the findings of Yang et al. (2003) [
22].
Owning to the distinctive geography of the watershed and the impact of human activities, the wind erosion transport materials on the east bank of the watershed (downwind) are chiefly composed of powder and clay particles. Suspended fine particles dominate the wind erosion materials, resulting in the depletion of crucial plant growth nutrients in the riverbed. This compounded wind-water erosion problem poses a formidable challenge for effective management in the study area, thus adding to the complexity of wind and sand management along the Yellow River watershed.
This study also found a segmented relationship between sand transport rate and height. Between the height of 0~10, it followed an exponential function distribution, and in the range of 10~20 cm height, a power function law was observed. The height segmentation in this paper was at 10 cm, different from Has’ et al. (1997) [
23] 20-cm height segmentation. The distinction may be attributed to differences in underlying surface properties in the study area. Using an exponential function governed by saltation alone to simulate the connection between total sand transport rate and height is inadequate for accurately quantifying the suspended load content. Therefore, a piecewise function is used in this study to calculate the total sand transport rate of dunes in the tributary, resulting in a value closer to the actual situation.
4.5. Protective Measures
The root cause of the wind-blown sand into the ten tributaries of the Yellow River lies in the absence of fundamental windbreak and sand stabilization techniques on the bare dunes flanking the river, especially during dry and windy winter and spring seasons. Therefore, a diligent focus on the conservation and administration of both sides of the river is necessary. This paper presents a comprehensive analysis of the research findings in conjunction with prior studies to suggest some fundamental protective measures. First, existing protective measures must be preserved, and the adverse impact of human activities such as grazing and sand mining must be contained. It is incumbent on regional governments to place great emphasis on river management while not endangering the environment to facilitate development.
Secondly, a scientifically designed windbreak and sand-fixing belt should be established in the around infrastructure and dunes on both sides of the river (Salix psammophila sand barrier, PLA sand barrier, etc.). In the upwind direction, where erodible materials are abundant, the content of wind erosion increases exponentially with increasing wind speed. Therefore, reducing wind speed around the river dunes is a necessary means to address the problem of wind erosion. Various measures should be implemented based on existing protection strategies. Increasing the roughness of the dune surface, altering airflow conditions near the earth’s surface, while blocking sand sediment loss, can slow the speed of dune movement, thereby reducing the amount of sand transport in the river channel. Finally, during the governance in the Yellow River Basin, we should actively conduct environmental monitoring and protection, prohibiting all types of environmental hazards and ensuring the proper protection of the ecological environment of the Yellow River Basin.
5. Conclusions
The wind-sand area in the middle reaches of the Xiliugou tributary is a major contributor of sand material to the Yellow River anually and is classified as an area of intense erosion according to soil erosion standards. The sand source mainly originates from the Kubuqi Desert in the upper reaches of the watershed, where the wind and sand contribution from the large exposed moving sandy land area accounts for 77%. By analyzing the vertical changes in sand transport rate within 0~50 cm height from the surface and quantifying the amount of wind and sand entering the river channel using the difference in sand transport between the east and west banks, it is estimated that the annual contribution of wind and sand into the Yellow River basin from the Xiliugou tributary is approximately 8.09 × 10⁵ t. Due to the unique geographical unit and the influence of human activities, the composition ratio of wind-eroded sand particles differs between the east and west banks of the watershed. Consequently, treatment measures should be tailored to the specific characteristics of wind and sand erosion and accumulation on riverbeds and riverbanks, respectively, in order to reduce the loss of nutrients and minimize the amount of wind and sand erosion. In addition, based on the existing experience of wind and sand management, human activities that cause disturbances should be strictly controlled to ensure the ecological security along the Yellow River basin.
Author Contributions
Conceptualization, Y.G. and X.D.; methodology, H.Z.; software, S.F.; validation, Z.M., Z.C. and H.Z.; formal analysis, Y.G.; investigation, H.Z.; resources, Z.C.; data curation, H.Z.; writing—original draft preparation, H.Z.; writing—review and editing, H.Z.; visualization, X.D.; supervision, Y.G.; project administration, S.F.; funding acquisition, Z.C. All authors have read and agreed to the published version of the manuscript.
Funding
This research was funded by [Water Conservancy Technology Project of Inner Mongolia Autonomous Region] grant number [NSK202102] And The APC was funded by Water Conservancy Technology Project of Inner Mongolia Autonomous Region].
Institutional Review Board Statement
The study did not require ethical approval.
Informed Consent Statement
Not applicable.
Data Availability Statement
Since the project is not completed and the data obtained is related to privacy, no data set will be established after consultation by all authors.
Conflicts of Interest
All authors declare no conflict of interest.
References
- Omer, A.; Elagib, N.A.; Zhuguo, M.; Saleem, F.; Mohammed, A. Water scarcity in the Yellow River Basin under future climate change and human activities. Sci. Total Environ. 2020, 749, 141446. [Google Scholar] [CrossRef]
- Yang, H.; Shi, C. Spatial and temporal variations of aeolian sediment input to the tributaries (the Ten Kongduis) of the upper Yellow River. Aeolian Res. 2018, 30, 1–10. [Google Scholar] [CrossRef]
- Yao, H.; Shi, C.; Shao, W.; Bai, J.; Yang, H. Changes and influencing factors of the sediment load in the Xiliugou basin of the upper Yellow River, China. Catena 2016, 142, 1–10. [Google Scholar] [CrossRef]
- Sebastian, T.; Nath, B.; Mascarenhas-Pereira, M.B.L.; Venkateshwarlu, M.; Mungekar, T.; Rodrigues, D.; Suresh, K.; Linsy, P. A 50 kyr record of eolian sedimentation in the Eastern Arabian Sea–Dust deposition changes synchronous with the Northern Hemisphere Climatic Oscillations. Mar. Geol. 2023, 459, 107046. [Google Scholar] [CrossRef]
- Nazari Samani, A.; Biabani, L.; Khosravi, H.; Fathabadi, A.; Wasson, R.; Borji Hassangavyar, M. The role of new-emerging lands on sources of aeolian sand deposits driven by shrinking of the Urmia salt lake. Nat. Hazards 2021, 267, 113546. [Google Scholar] [CrossRef]
- Chen, Z.; Gao, X.; Lei, J. Dust emission and transport in the Aral Sea region. Geoderma 2022, 428, 116177. [Google Scholar] [CrossRef]
- Zhang, Z.; Daly, J.S.; Tian, Y.; Tyrrell, S.; Sun, X.; Badenszki, E.; Qin, Y.; Cheng, Z.; Guo, R. Sedimentary provenance perspectives on the evolution of the major rivers draining the eastern Tibetan Plateau. Earth-Sci. Rev. 2022, 232, 104151. [Google Scholar] [CrossRef]
- Ma, S.; Wang, H.; Wang, L.; Jiang, J.; Gong, J.; Wu, S.; Luo, G. Evaluation and simulation of landscape evolution and its ecological effects under vegetation restoration in the northern sand prevention belt, China. Catena 2022, 218, 106555. [Google Scholar] [CrossRef]
- Li, W.; Yuan, Y.; Wang, S.; Liu, X. Occurrence, spatiotemporal variation, and ecological risks of organophosphate esters in the water and sediment of the middle and lower streams of the Yellow River and its important tributaries. J. Hazard. Mater. 2023, 443, 130153. [Google Scholar] [CrossRef]
- Tominaga, Y.; Okuyama, T. Investigating threshold wind velocity for movement of sparsely distributed gravels in a wind tunnel, Effect of surface coarseness. Aeolian Res. 2022, 54, 100775. [Google Scholar] [CrossRef]
- Swanson, T.; Mohrig, D.; Kocurek, G. Aeolian dune sediment flux variability over an annual cycle of wind. Sedimentology 2016, 63, 1753–1764. [Google Scholar] [CrossRef]
- Richards, J.; Smesrud, J.; Williams, D.; Schmid, B.; Dickey, J.; Schreuder, M. Vegetation, hydrology, and sand movement interactions on the Slate Canyon alluvial fan-Keeler Dunes Complex, Owens Valley, California. Aeolian Res. 2022, 54, 100773. [Google Scholar] [CrossRef]
- Touré, A.A.; Tidjani, A.; Rajot, J.; Marticorena, B.; Bergametti, G.; Bouet, C.; Ambouta, K.; Garba, Z. Dynamics of wind erosion and impact of vegetation cover and land use in the Sahel, A case study on sandy dunes in southeastern Niger. Catena 2019, 177, 272–285. [Google Scholar] [CrossRef]
- Yu, P.; Chen, Y.; Li, Y.; Yan, Z.; Wang, X.; Niu, Y.; Gong, X. Influence of Vegetation Coverage on Sand Flow Structure and Wind Erosion Yield with Wind Tunnel Experiment as a Case. J. Desert Res. 2019, 39, 29–36. (In Chinese) [Google Scholar]
- Sevink, J.; Wallinga, J.; Reimann, T.; van Geel, B.; Brinkkemper, O.; Jansen, B.; Romar, M.; Bakels, C. A multi-staged drift sand geo-archive from the Netherlands: New evidence for the impact of prehistoric land use on the geomorphic stability, soils, and vegetation of aeolian sand landscapes. Catena 2023, 224, 106–169. [Google Scholar] [CrossRef]
- Liu, F.; Hao, Y.; Xin, Z.; Chen, H.; Xu, J.; Zhao, Y. The surface acolian-sand flow structure in the northeastern margin of the Ulanbuh Desert. J. Desert Res. 2014, 34, 1200–1207. [Google Scholar]
- Wu, X.; Zou, X. Analysis of Landscape Pattern Change and Its Driving Factors based on 3S Technology. J. Desert Res. 2010, 30, 763–769. (In Chinese) [Google Scholar]
- Xu, J.; Hao, Y.; Liu, F.; Chen, H.; Xin, Z.; Sun, F.; Desert Forest Experimental Centre; Chinese Academy of Forestry. Wind-Sand Flow Structure and Its Variation under Different Surface Conditions in the Ulanbuh Desert. Res. Soil Water Conserv. 2013, 20, 95–98. [Google Scholar]
- He, D.L. Several Problem on tire Relation between Sand Transport Rate and Wind Velocity. J. Desert Res. 1993, 2, 17–21. (In Chinese) [Google Scholar]
- Fryrear, D.W.; Saleh, A. Field wind erosion-vertical distribution. Soil Sci. 1993, 155, 294–300. [Google Scholar] [CrossRef]
- Vories, E.D.; Fryrear, D.W. Vertical-distribution of wind-eroded soil over a smooth, bara field. Trans. ASAE 1991, 34, 1763–1768. [Google Scholar] [CrossRef]
- Yang, G.; Tuo, W.; Dai, F.; Liu, Y.; Jing, K.; Li, B.; Zhang, O.; Lv, R.; Hu, L.; Tao, Y. Contribution in Inner of Sand Sources to the Silting of Riverbed Mongolia Section of Huanghe River. J. Desert Res. 2003, 2, 54–61. [Google Scholar]
- Ha, S. Preliminary study on the vertical distributions of wind dust over Bashang Plateau, Hebei Province. J. Desert Res. 1997, 17, 9–14, (In Chinese with English Abstract). [Google Scholar]
Figure 1.
Location of the Xiliugou Tributary.
Figure 1.
Location of the Xiliugou Tributary.
Figure 2.
Observation point location layout and underlying surface feature diagram. ① Schematic layout of sample site; ② Vegetation cover characteristics of underlying surface; ③ Fixed sand; ④ Semi-fixed sand; ⑤ Mobile sand.
Figure 2.
Observation point location layout and underlying surface feature diagram. ① Schematic layout of sample site; ② Vegetation cover characteristics of underlying surface; ③ Fixed sand; ④ Semi-fixed sand; ⑤ Mobile sand.
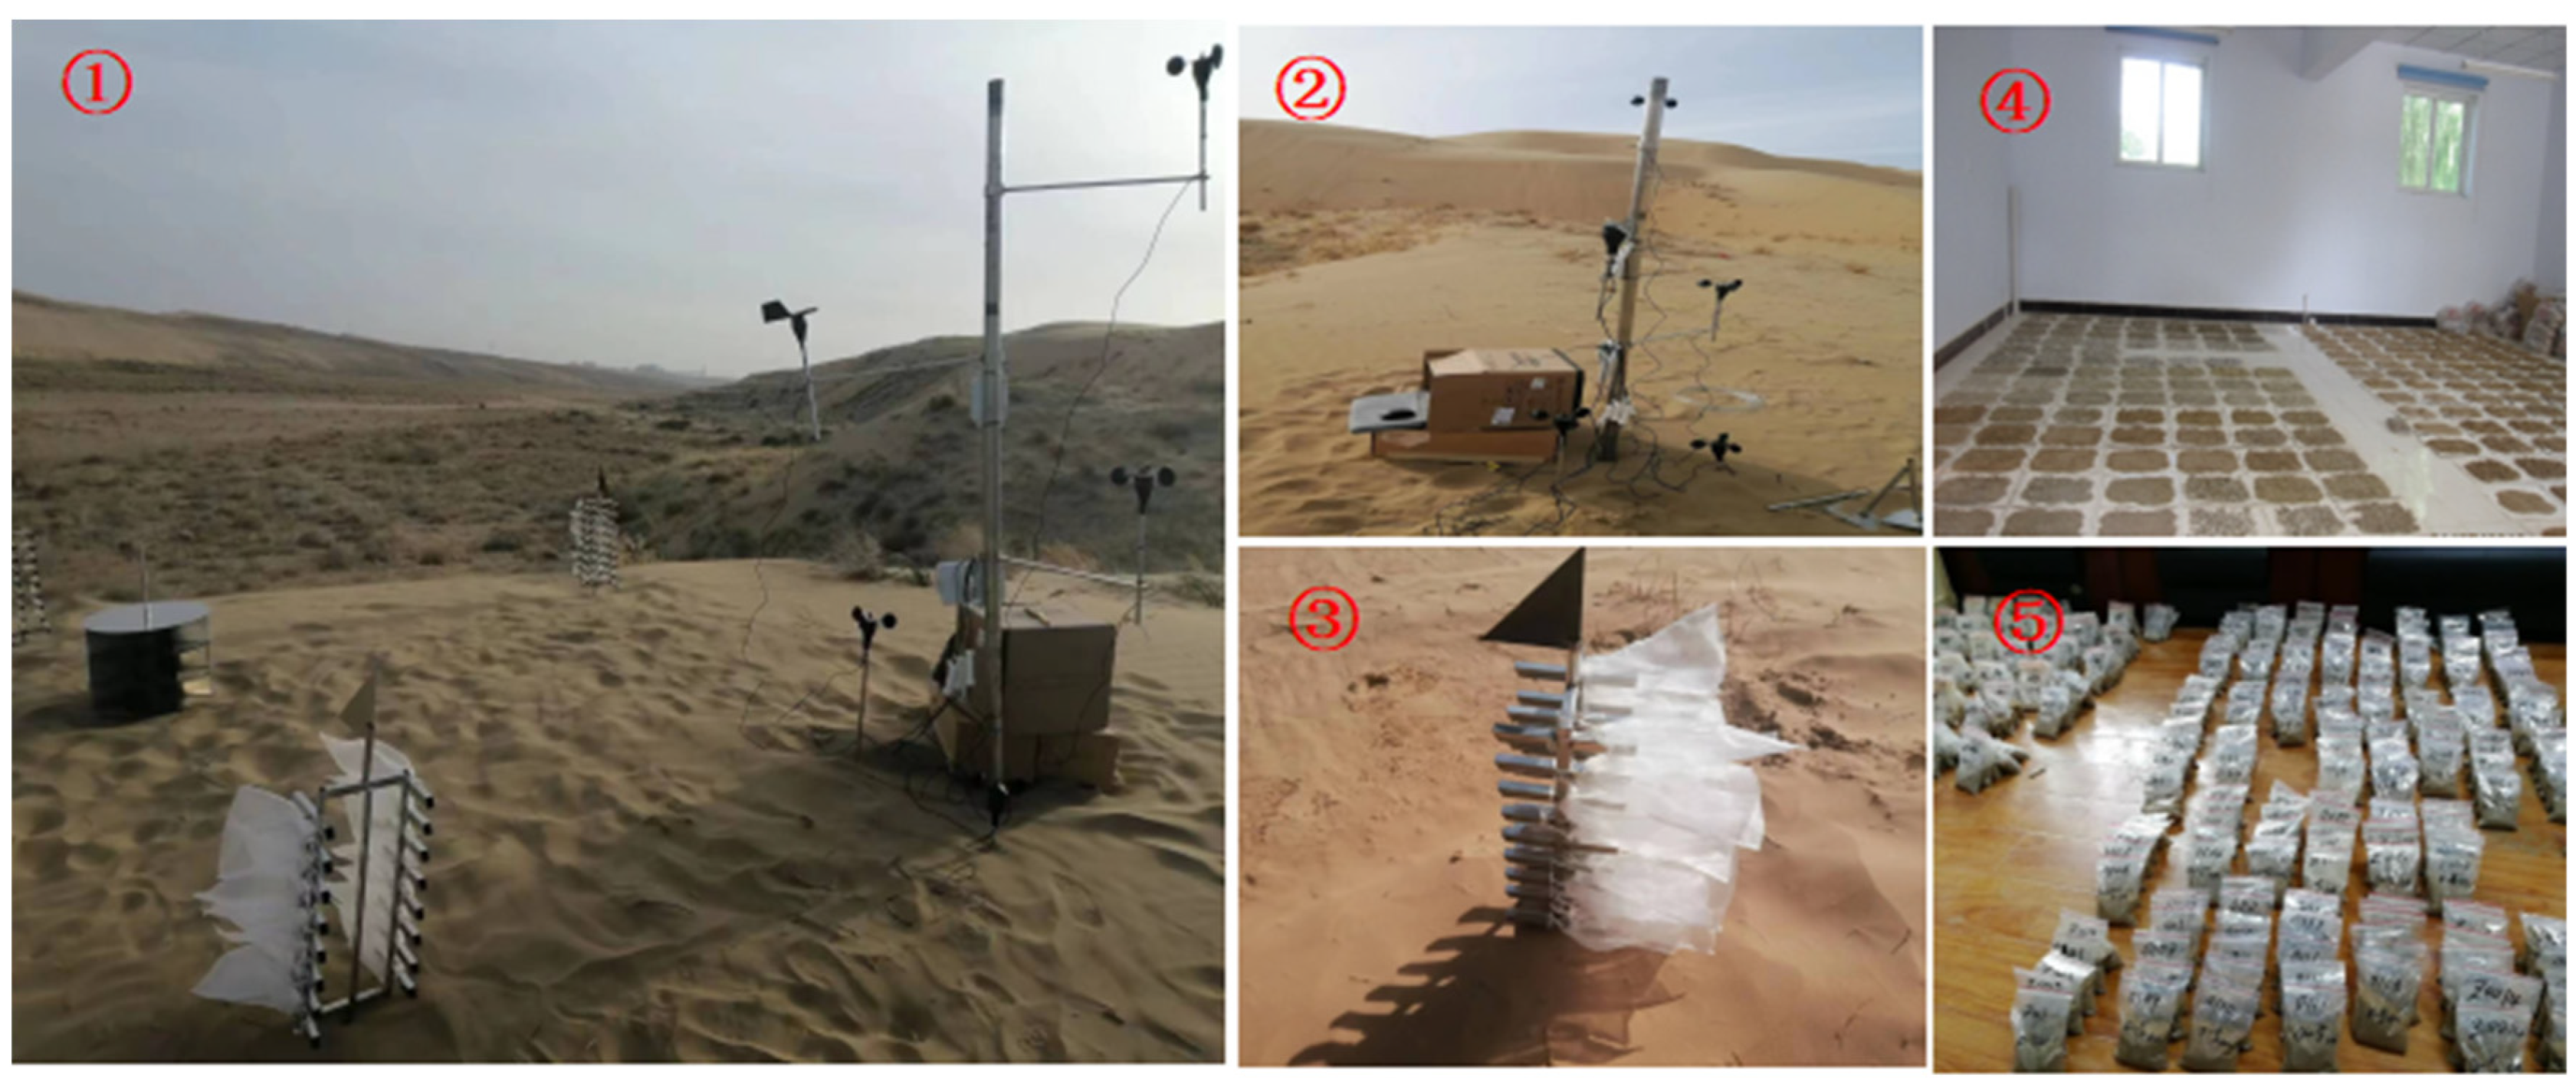
Figure 3.
Schematic diagram of instrument layout in observation site. ① Observation field instrument layout; ② Weather station (HOBO); ③ Sand collector; ④~⑤ Soil sample.
Figure 3.
Schematic diagram of instrument layout in observation site. ① Observation field instrument layout; ② Weather station (HOBO); ③ Sand collector; ④~⑤ Soil sample.
Figure 4.
Operational monitoring indicators of automatic weather stations.
Figure 4.
Operational monitoring indicators of automatic weather stations.
Figure 5.
Plot layout and survey. ① Diagram of quadrat ((C1–9: Herbaceous quadrat; G1–5 Shrub quadrat)); ② Sample selection; ③ Herb quadrat; ④ Shrub quadrat.
Figure 5.
Plot layout and survey. ① Diagram of quadrat ((C1–9: Herbaceous quadrat; G1–5 Shrub quadrat)); ② Sample selection; ③ Herb quadrat; ④ Shrub quadrat.
Figure 6.
Chart of sand driving wind speed and wind direction variation in the study area.
Figure 6.
Chart of sand driving wind speed and wind direction variation in the study area.
Figure 7.
Rose charts of annual and seasonal sand-driving wind conditions in the study area.
Figure 7.
Rose charts of annual and seasonal sand-driving wind conditions in the study area.
Figure 8.
Variation characteristics of sediment flux on unit section of different underlying surfaces. Note: Different lowercase letters a, b, c indicate differences; the capital letters A, B, C, D indicate the monitoring site number (the same below).
Figure 8.
Variation characteristics of sediment flux on unit section of different underlying surfaces. Note: Different lowercase letters a, b, c indicate differences; the capital letters A, B, C, D indicate the monitoring site number (the same below).
Figure 9.
Vertical line variation of pore conversion and sediment transport rate within 0~50 cm height.
Figure 9.
Vertical line variation of pore conversion and sediment transport rate within 0~50 cm height.
Figure 10.
Vertical line variation of pore conversion and transport rate within 0~10 cm height.
Figure 10.
Vertical line variation of pore conversion and transport rate within 0~10 cm height.
Figure 11.
Vertical variation of pore conversion and sediment transport rate within 10 to 50 cm height.
Figure 11.
Vertical variation of pore conversion and sediment transport rate within 10 to 50 cm height.
Figure 12.
Variation trend of downwind sediment transport rate on different underlying surfaces.
Figure 12.
Variation trend of downwind sediment transport rate on different underlying surfaces.
Figure 13.
Characteristics of wind-eroded sand particle size on different underlying surfaces.
Figure 13.
Characteristics of wind-eroded sand particle size on different underlying surfaces.
Figure 14.
Factors affecting human activities.
Figure 14.
Factors affecting human activities.
Figure 15.
Schematic diagram of wind-eroded sand deposition process in the channel.
Figure 15.
Schematic diagram of wind-eroded sand deposition process in the channel.
Table 1.
The underlying surface characteristics of the study area.
Table 1.
The underlying surface characteristics of the study area.
| Characteristic | Site Type | Fixed Sandy Land | Semi-Fixed Sandy | Moving Sandy Land |
|---|
| Community characteristics | Community type | Unit | Caragana korshinskii + Artemisia ordosica-Corispermum hyssopifolium | Artemisia ordosica-Psammochloa villosa | - |
| Quantity | Strain | 14~23 | 16~23 | - |
| Height | m | 0.55~1.76 | 0.37~0.71 | 0.55~0.73 |
| Major axis | m | 0.77~4.12 | 0.31~1.16 | 0.74~1.48 |
| Minor axis | m | 0.69~3.18 | 0.28~1.01 | 0.54~1.38 |
| Coverage | % | 30.81~44.42 | 19.37~27.52 | - |
| Riverbed characteristics | Width | m | 0.35 | 0.38 | 0.52 |
| Length | m | 2.27 | 5.49 | 10.37 |
| Area | km2 | 0.99 | 0.97 | 5.37 |
Table 2.
The fitting function of total sediment transport rate and wind speed on different underlying surfaces.
Table 2.
The fitting function of total sediment transport rate and wind speed on different underlying surfaces.
| Type of Underlying Surface | Point | Formula | Correlation Coefficient R2 |
|---|
| Fixed sandy land | A1 | y = 0.065e0.4778x | R2 = 0.9619 |
| A2 | y = 0.0002e0.9792x | R2 = 0.9656 |
| Semi-fixed sand | B1 | y = 0.1294e0.3987x | R2 = 0.9653 |
| B2 | y = 0.0016e0.7539x | R2 = 0.9216 |
| Moving sand | Low dune | C1 | y = 0.6421e0.267x | R2 = 0.9506 |
| C2 | y = 0.0201e0.5644x | R2 = 0.9845 |
| High dune | D1 | y = 0.714e0.2867x | R2 = 0.9317 |
| D2 | y = 0.0071e0.5955x | R2 = 0.9849 |
| Disclaimer/Publisher’s Note: The statements, opinions and data contained in all publications are solely those of the individual author(s) and contributor(s) and not of MDPI and/or the editor(s). MDPI and/or the editor(s) disclaim responsibility for any injury to people or property resulting from any ideas, methods, instructions or products referred to in the content. |
© 2023 by the authors. Licensee MDPI, Basel, Switzerland. This article is an open access article distributed under the terms and conditions of the Creative Commons Attribution (CC BY) license (https://creativecommons.org/licenses/by/4.0/).


