
Spatial Distribution and Accessibility Evaluation of National Water Parks in China


Abstract
:1. Introduction
- (1)
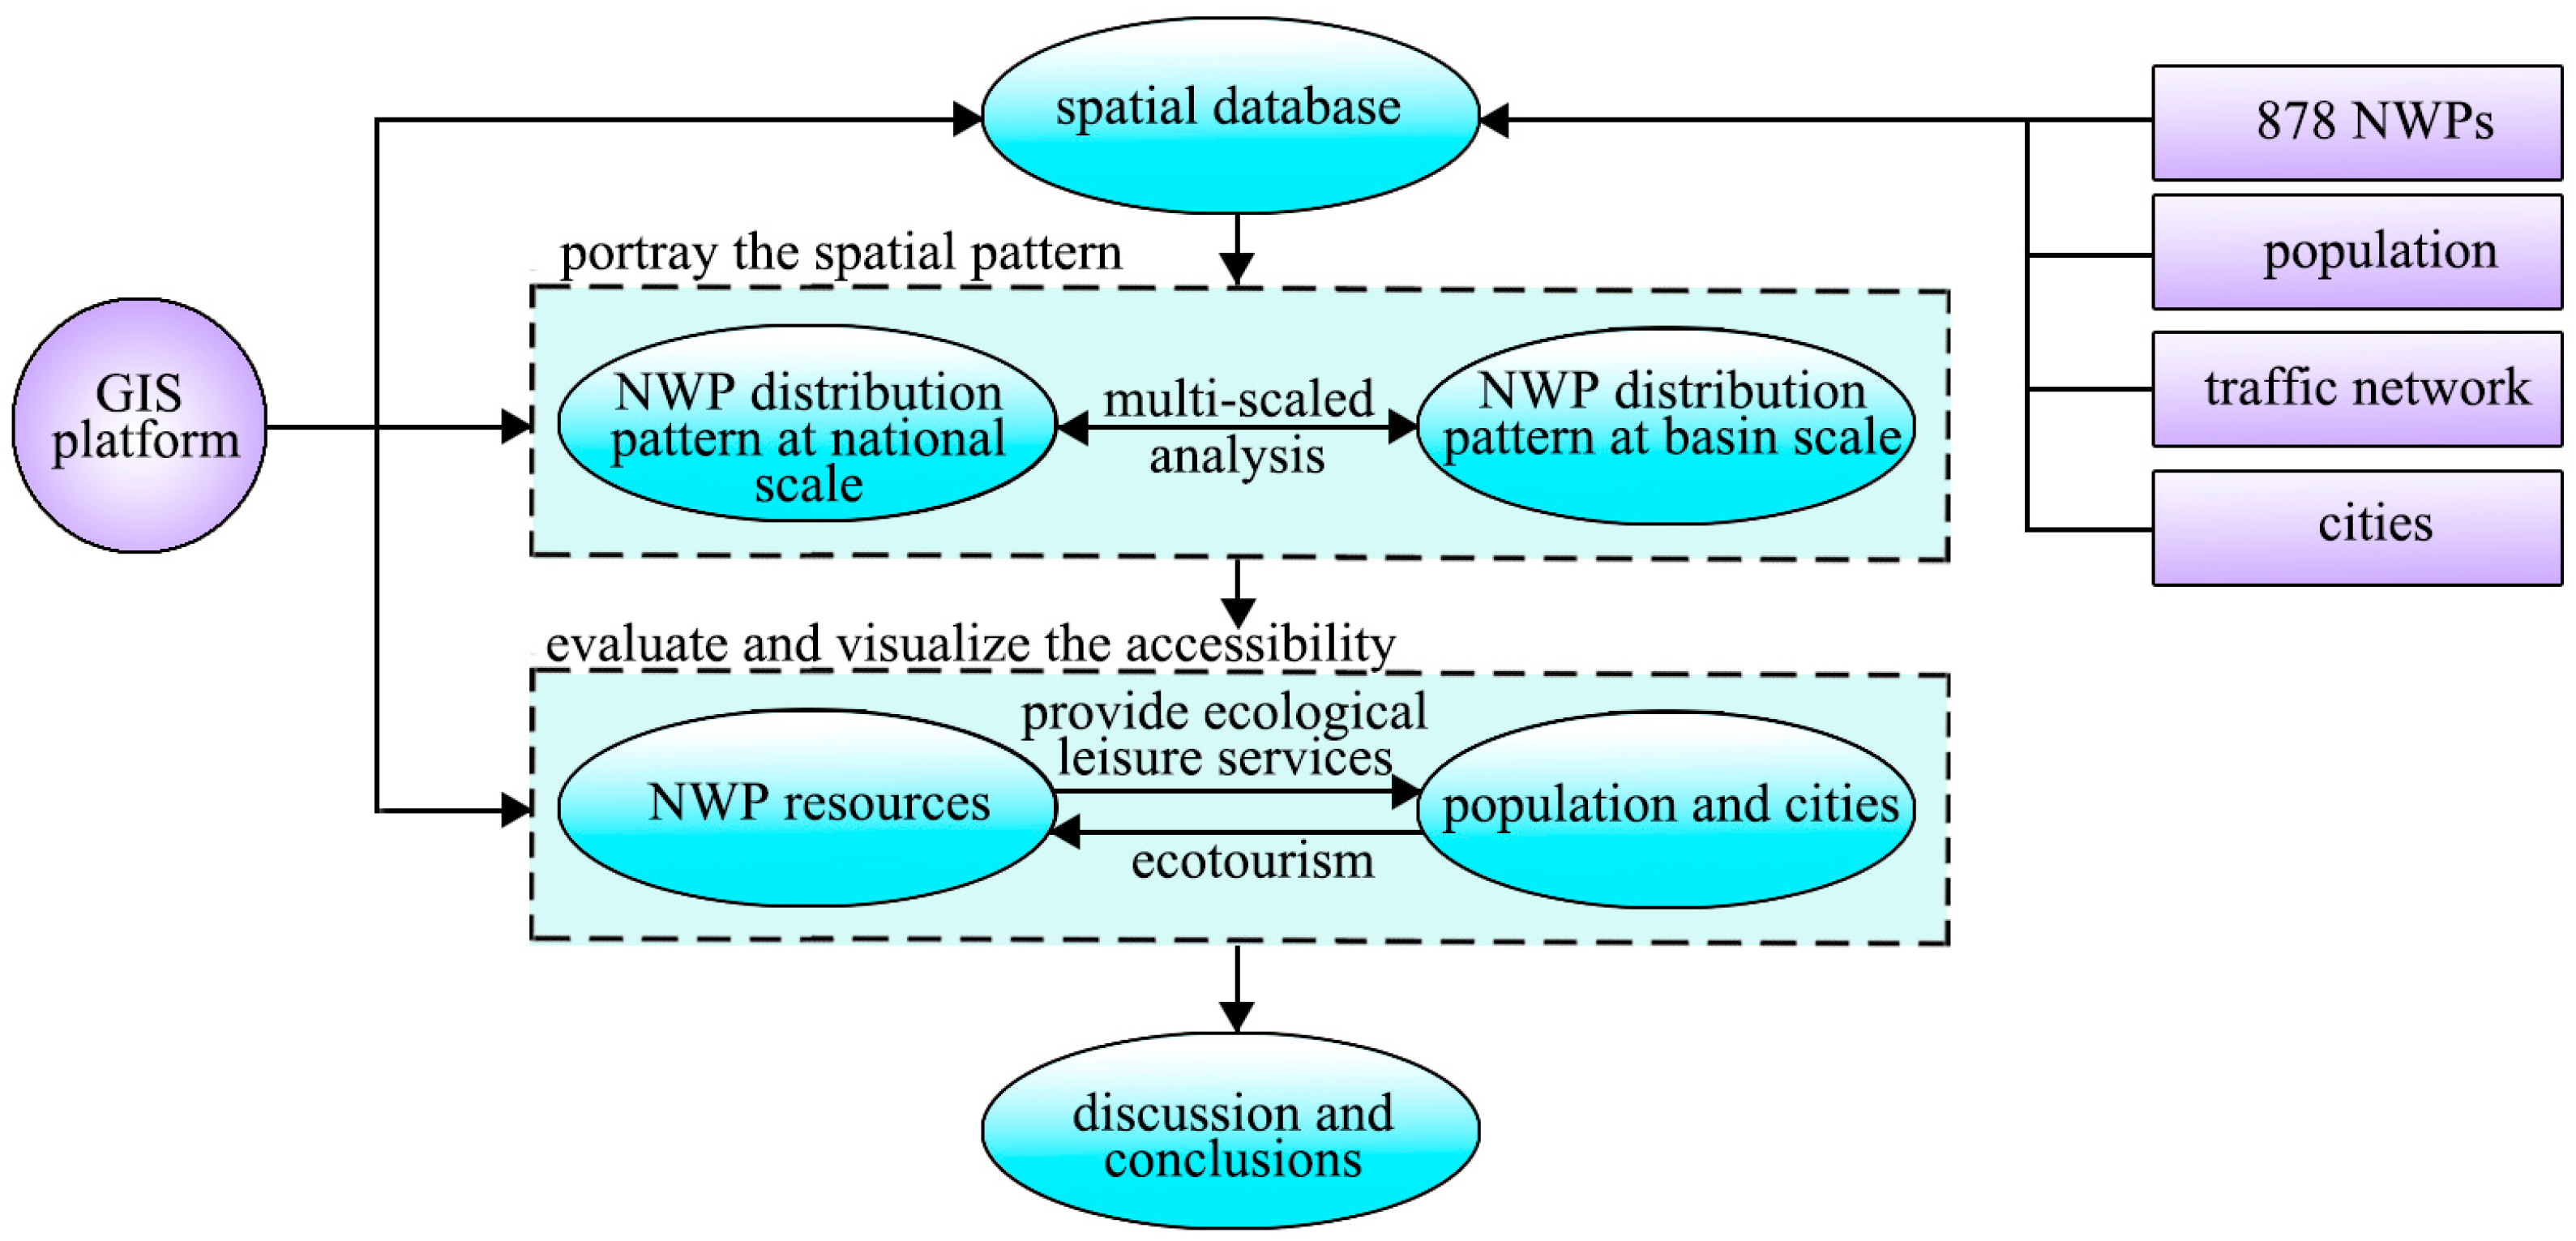
- The multi-scaled portrait of water facilities for ecotourism and recreation has not been illustrated. There are various research values at various scales. The watershed scale is suitable for comprehending the relationship between water park categories and locations [43]. The national dimension is more suitable for revealing the spatial disparities between water parks, traffic networks, populations, and cities. However, multi-scale investigations have received considerably less attention.
- (2)
- The water facilities for ecotourism and recreation have not been considered simultaneously as “sources” and “sinks”. The majority of previous studies [44,45] regarded water-based scenic locations as tourist destinations, i.e., a “sink” that attracts visitors. Few studies have examined the dialectical relationship between “sources” and “sinks” in both directions, and scenic areas have been identified as water resource “sources”.
- (3)
- The interaction between various locations of supply (water ecotourism and recreation resources) and population demands has not yet been investigated. Regional studies have traditionally calculated the per capita value of resources using the so-called “container approach”. For this method, the study area is divided into distinct spatial “containers” with specific boundaries, and the per capita resources accessed in each container are estimated without taking visitor movement across the boundary [46] into account. In actuality, people are not restricted to visiting the water park closest to them, and each water park may receive visitors from various neighborhoods. The many-to-many relationship necessitates a more thorough analysis of spatial accessibility.
- (4)
- The current accessibility evaluation for water parks is insufficient to support the coordinated sustainable development of WNPs with traffic, population, and cities. On the one hand, case studies for accessibility have not included the visualization and agglomerative patterns of hotspots as a further analysis pertinent to NWPs planning. On the other hand, there is a lack of comparative studies and general regulations for various regions or nations that incorporate accessibility into the ecological and socioeconomic values of water parks.
2. Data Process and Research Methods
2.1. Data Process
2.2. Research Methods
2.2.1. Kernel Density
2.2.2. Standard Deviation Ellipse
2.2.3. Distance-Decay Improved Two-Step Floating Catchment Area
2.2.4. Exploratory Spatial Data Analysis (ESDA)
- (1)
- Global Spatial Autocorrelation
- (2)
- Local Spatial Autocorrelation
3. Patterns of Spatial Distribution of NWPs
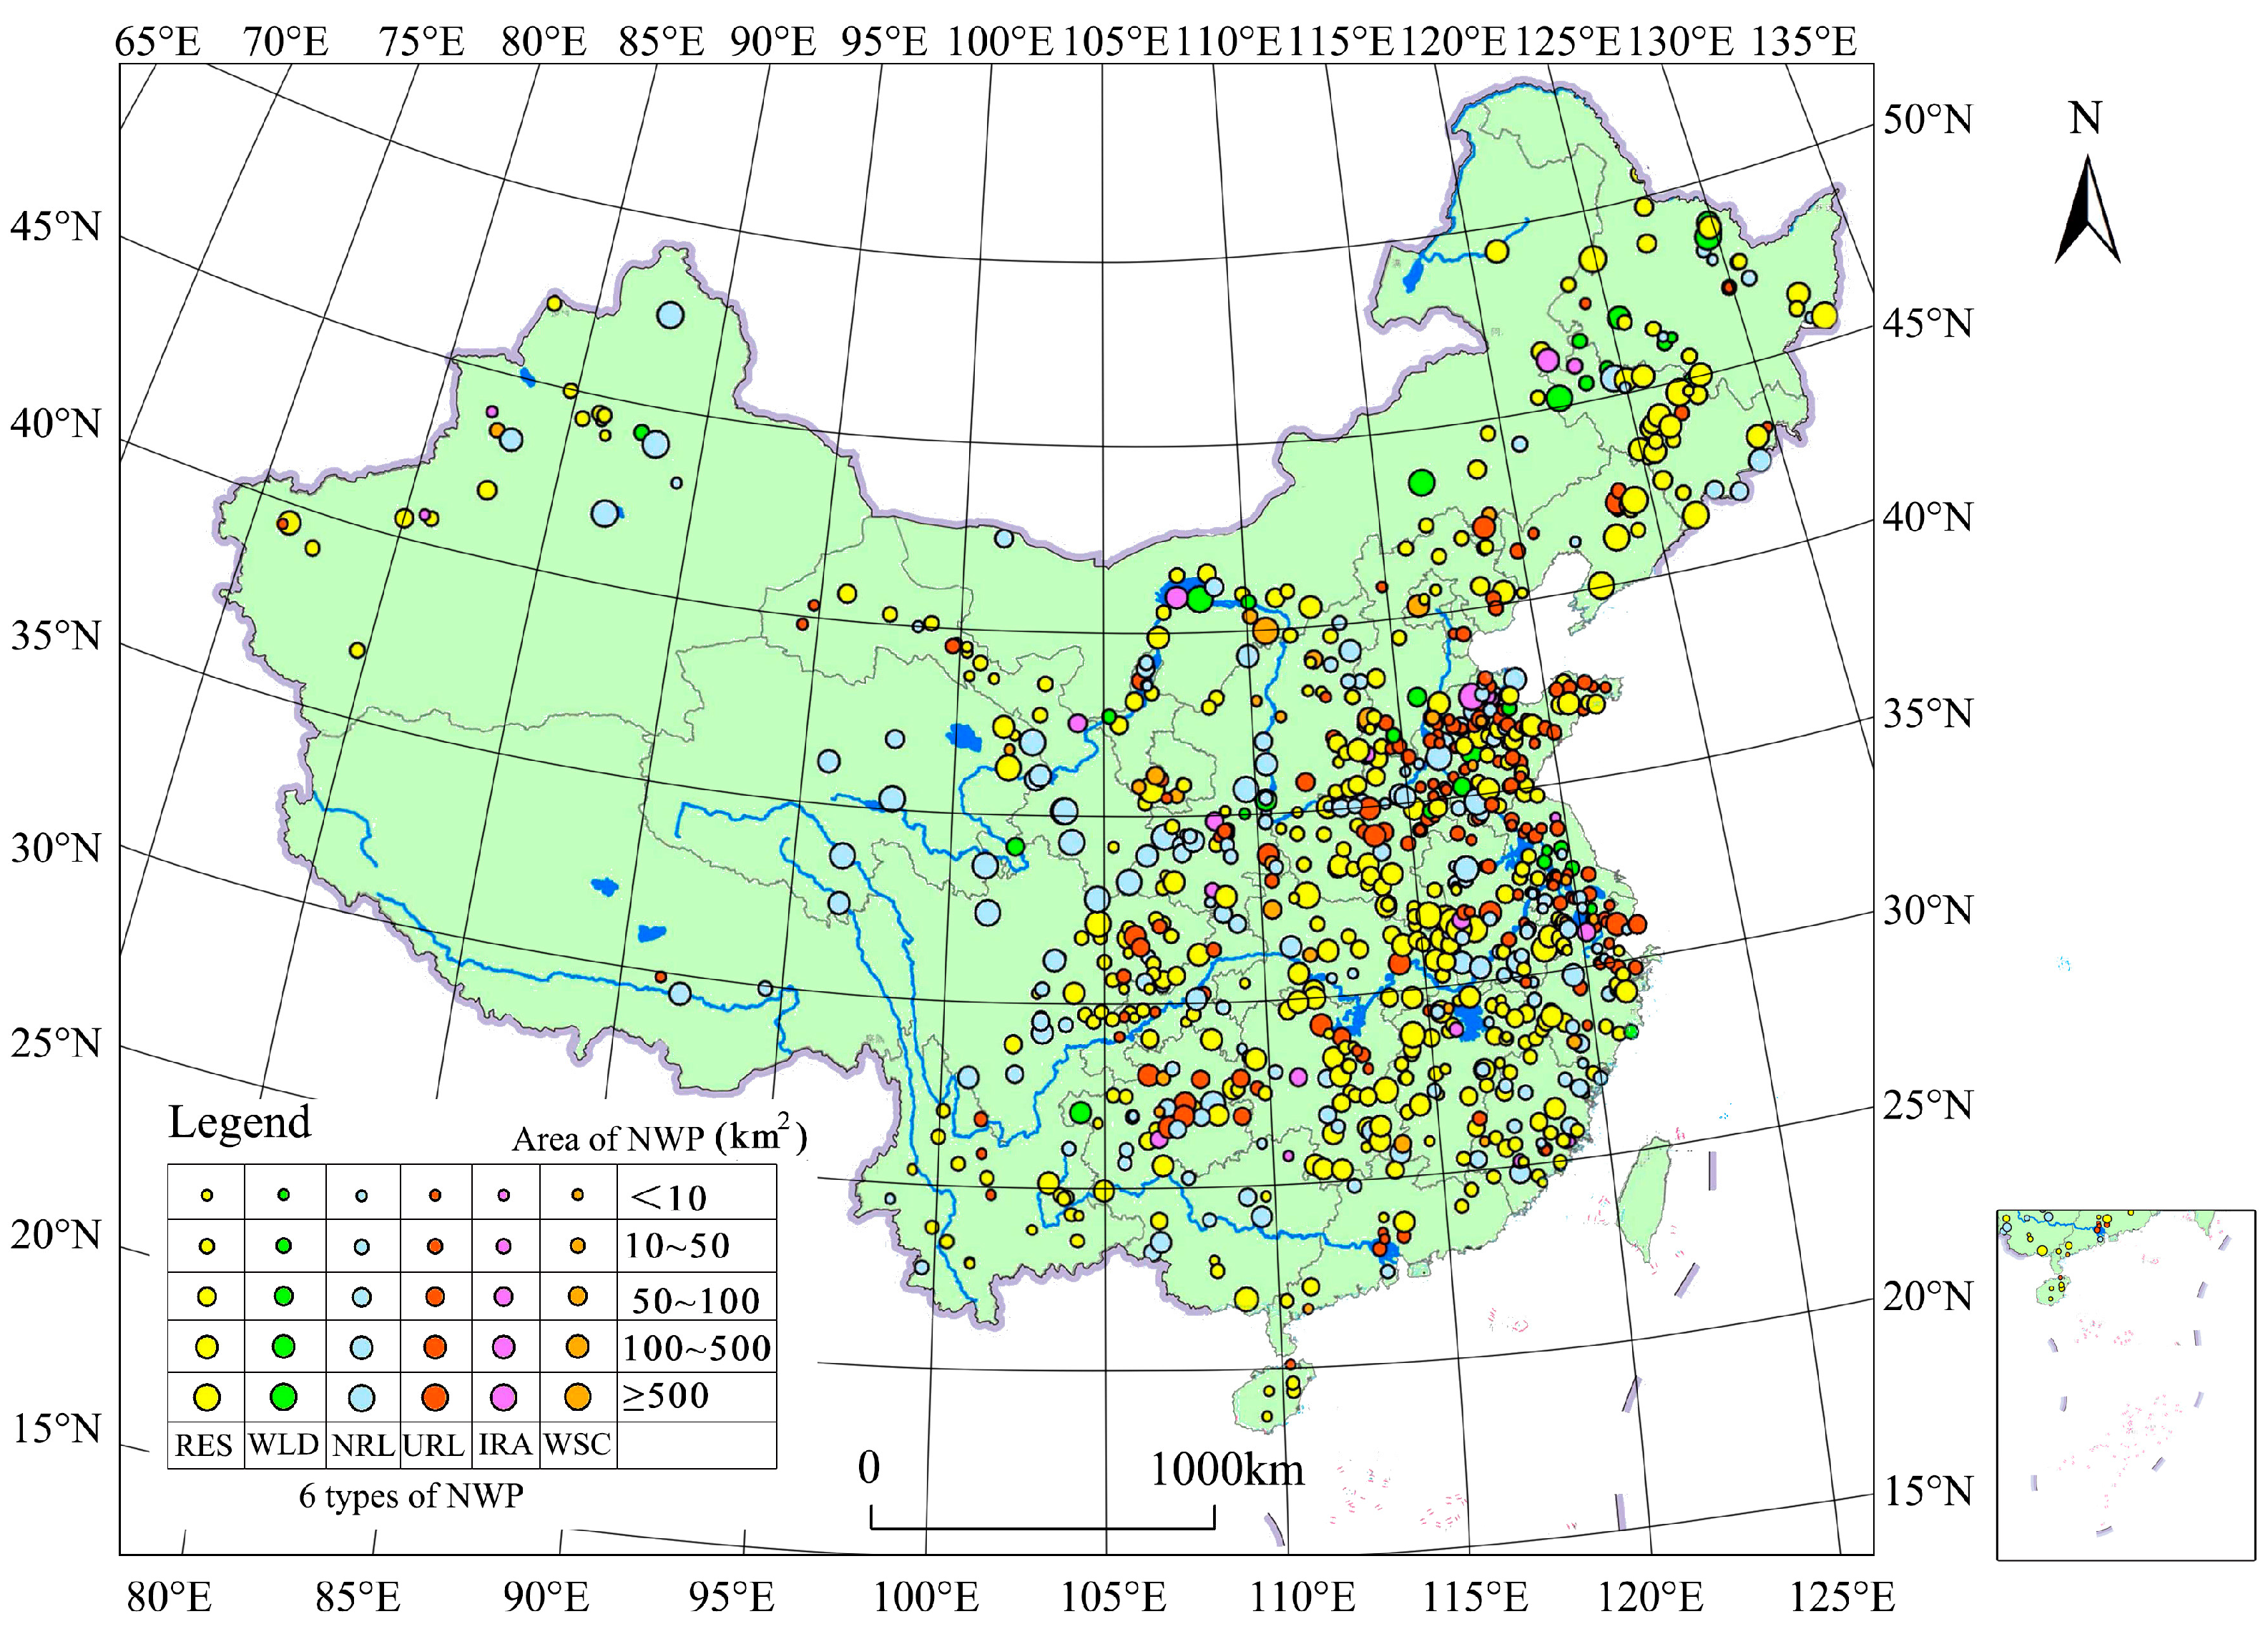
3.1. Distribution Pattern of National-Scale NWPs
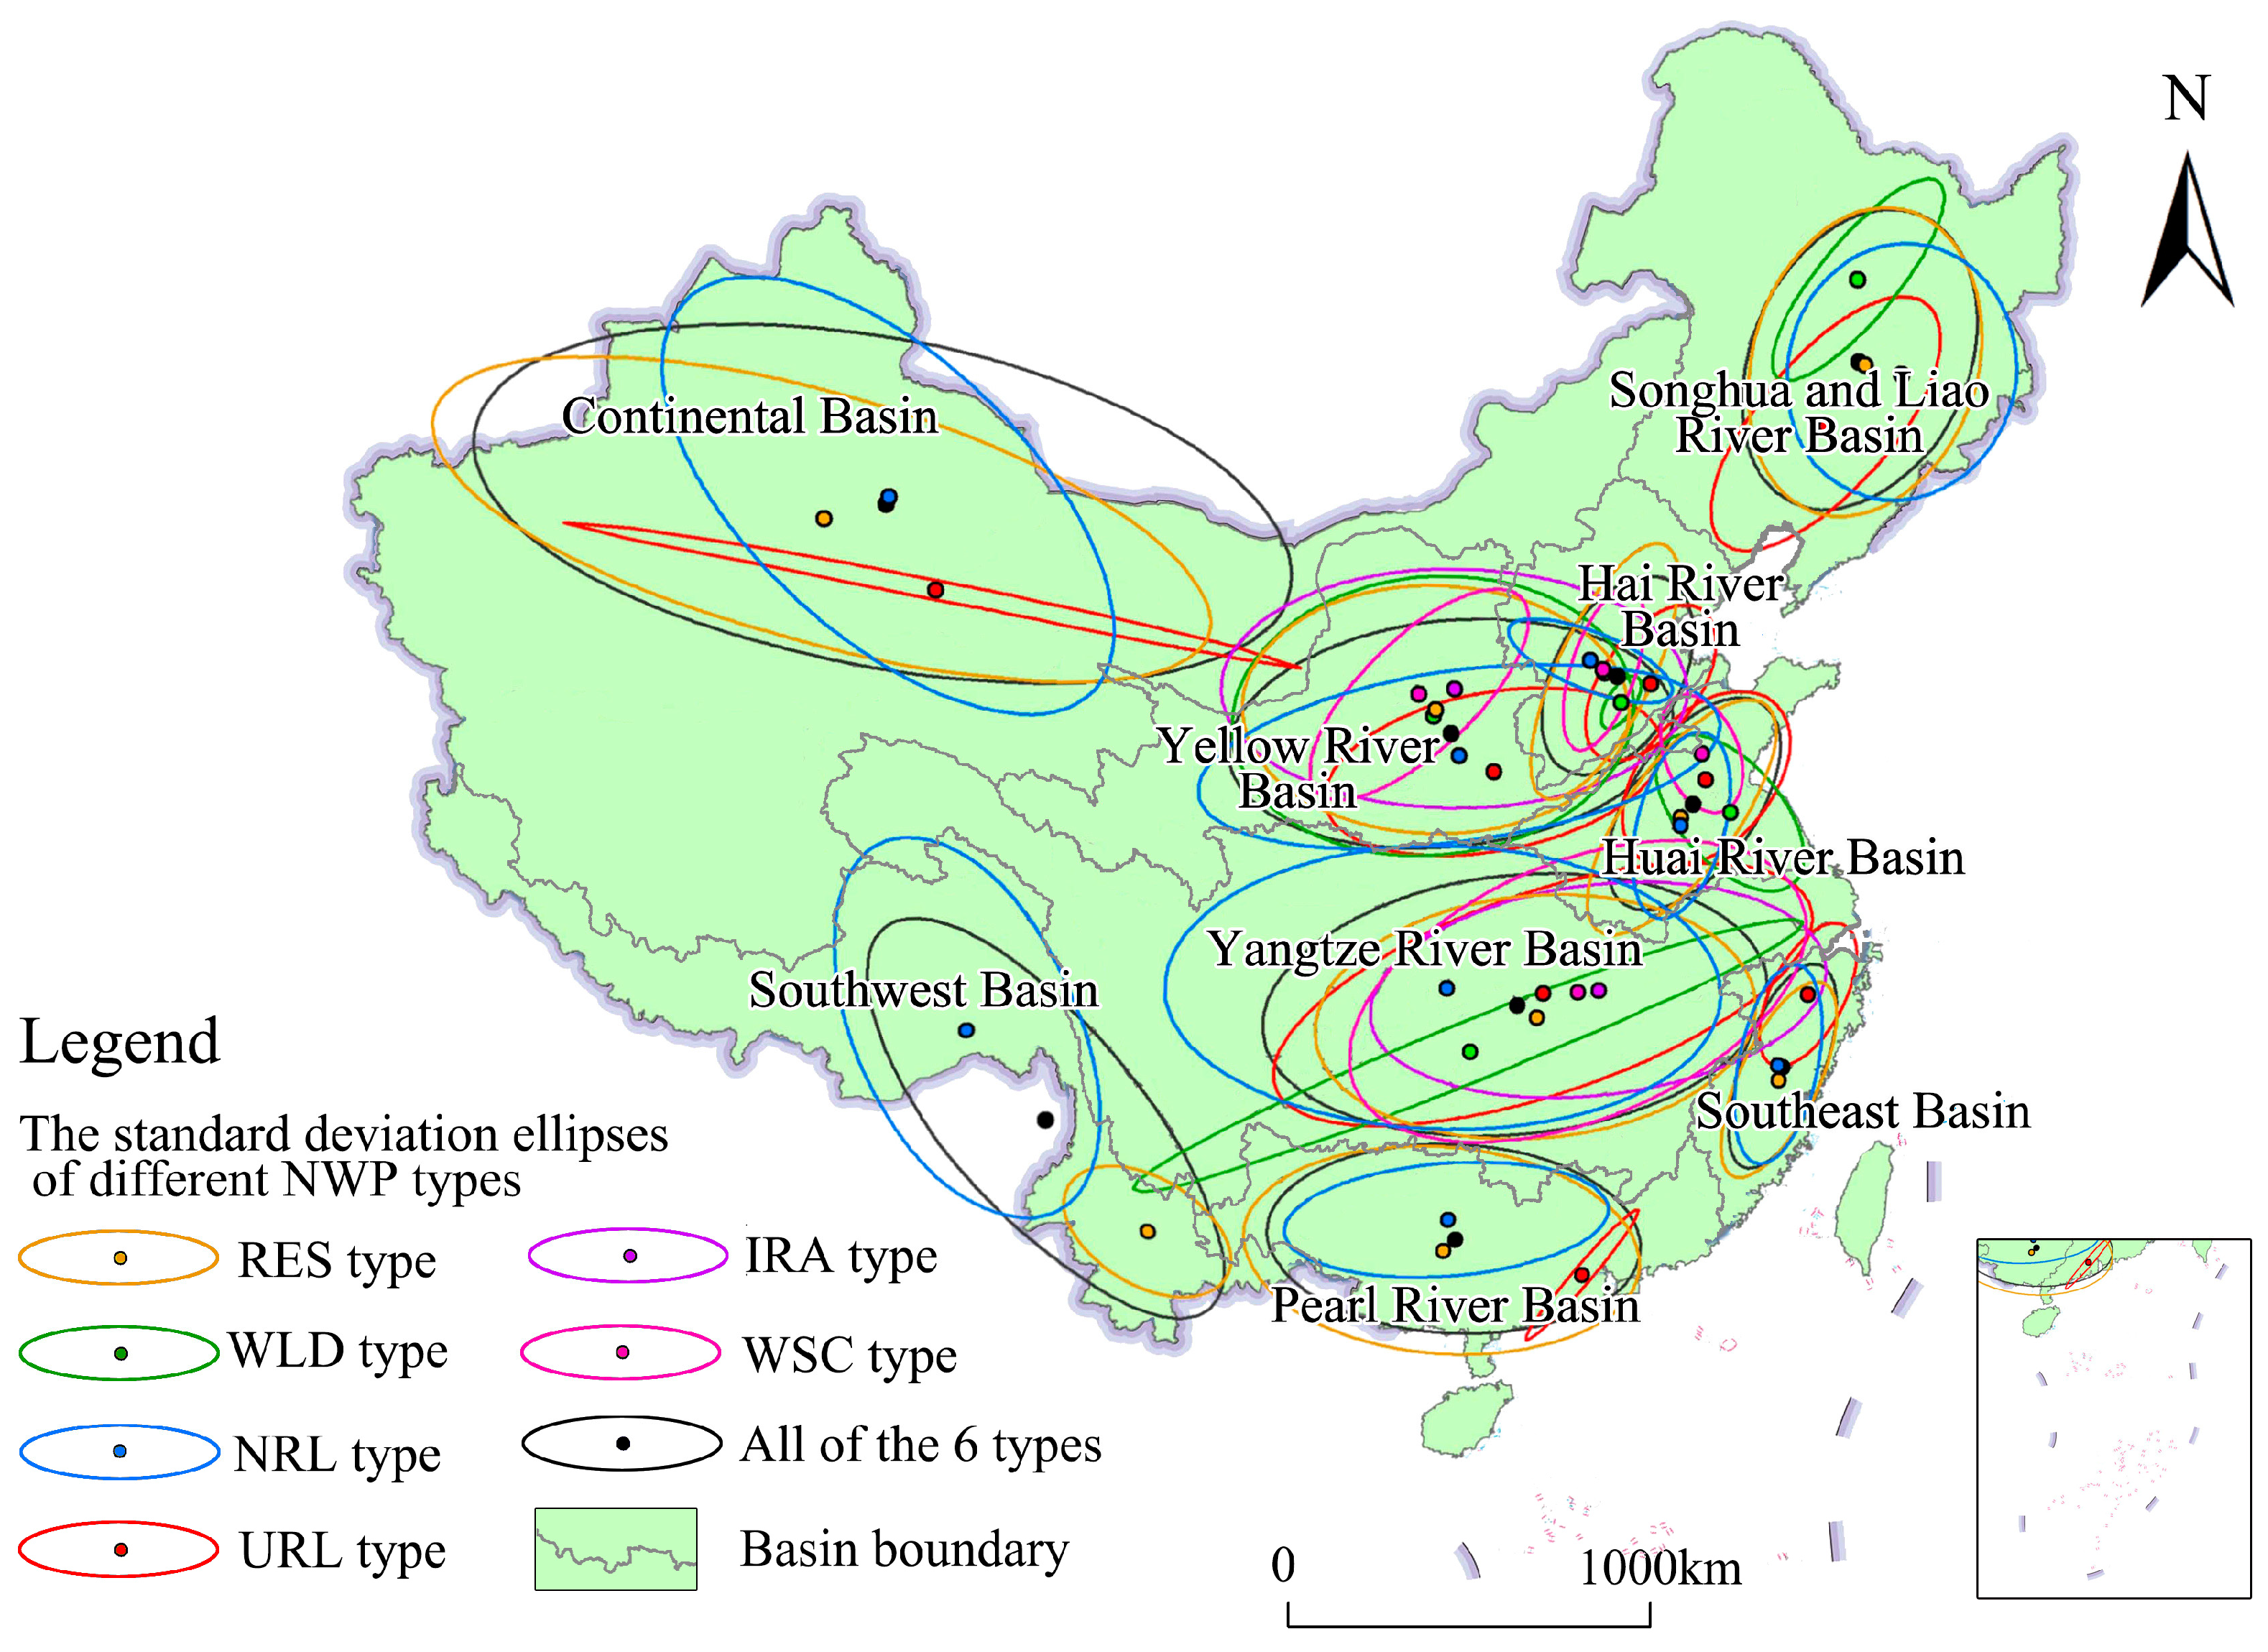
3.2. Pattern of NWP Distribution at the Basin Scale
4. Accessibility of NWPs Resources Based on Transportation, Population, and Cities
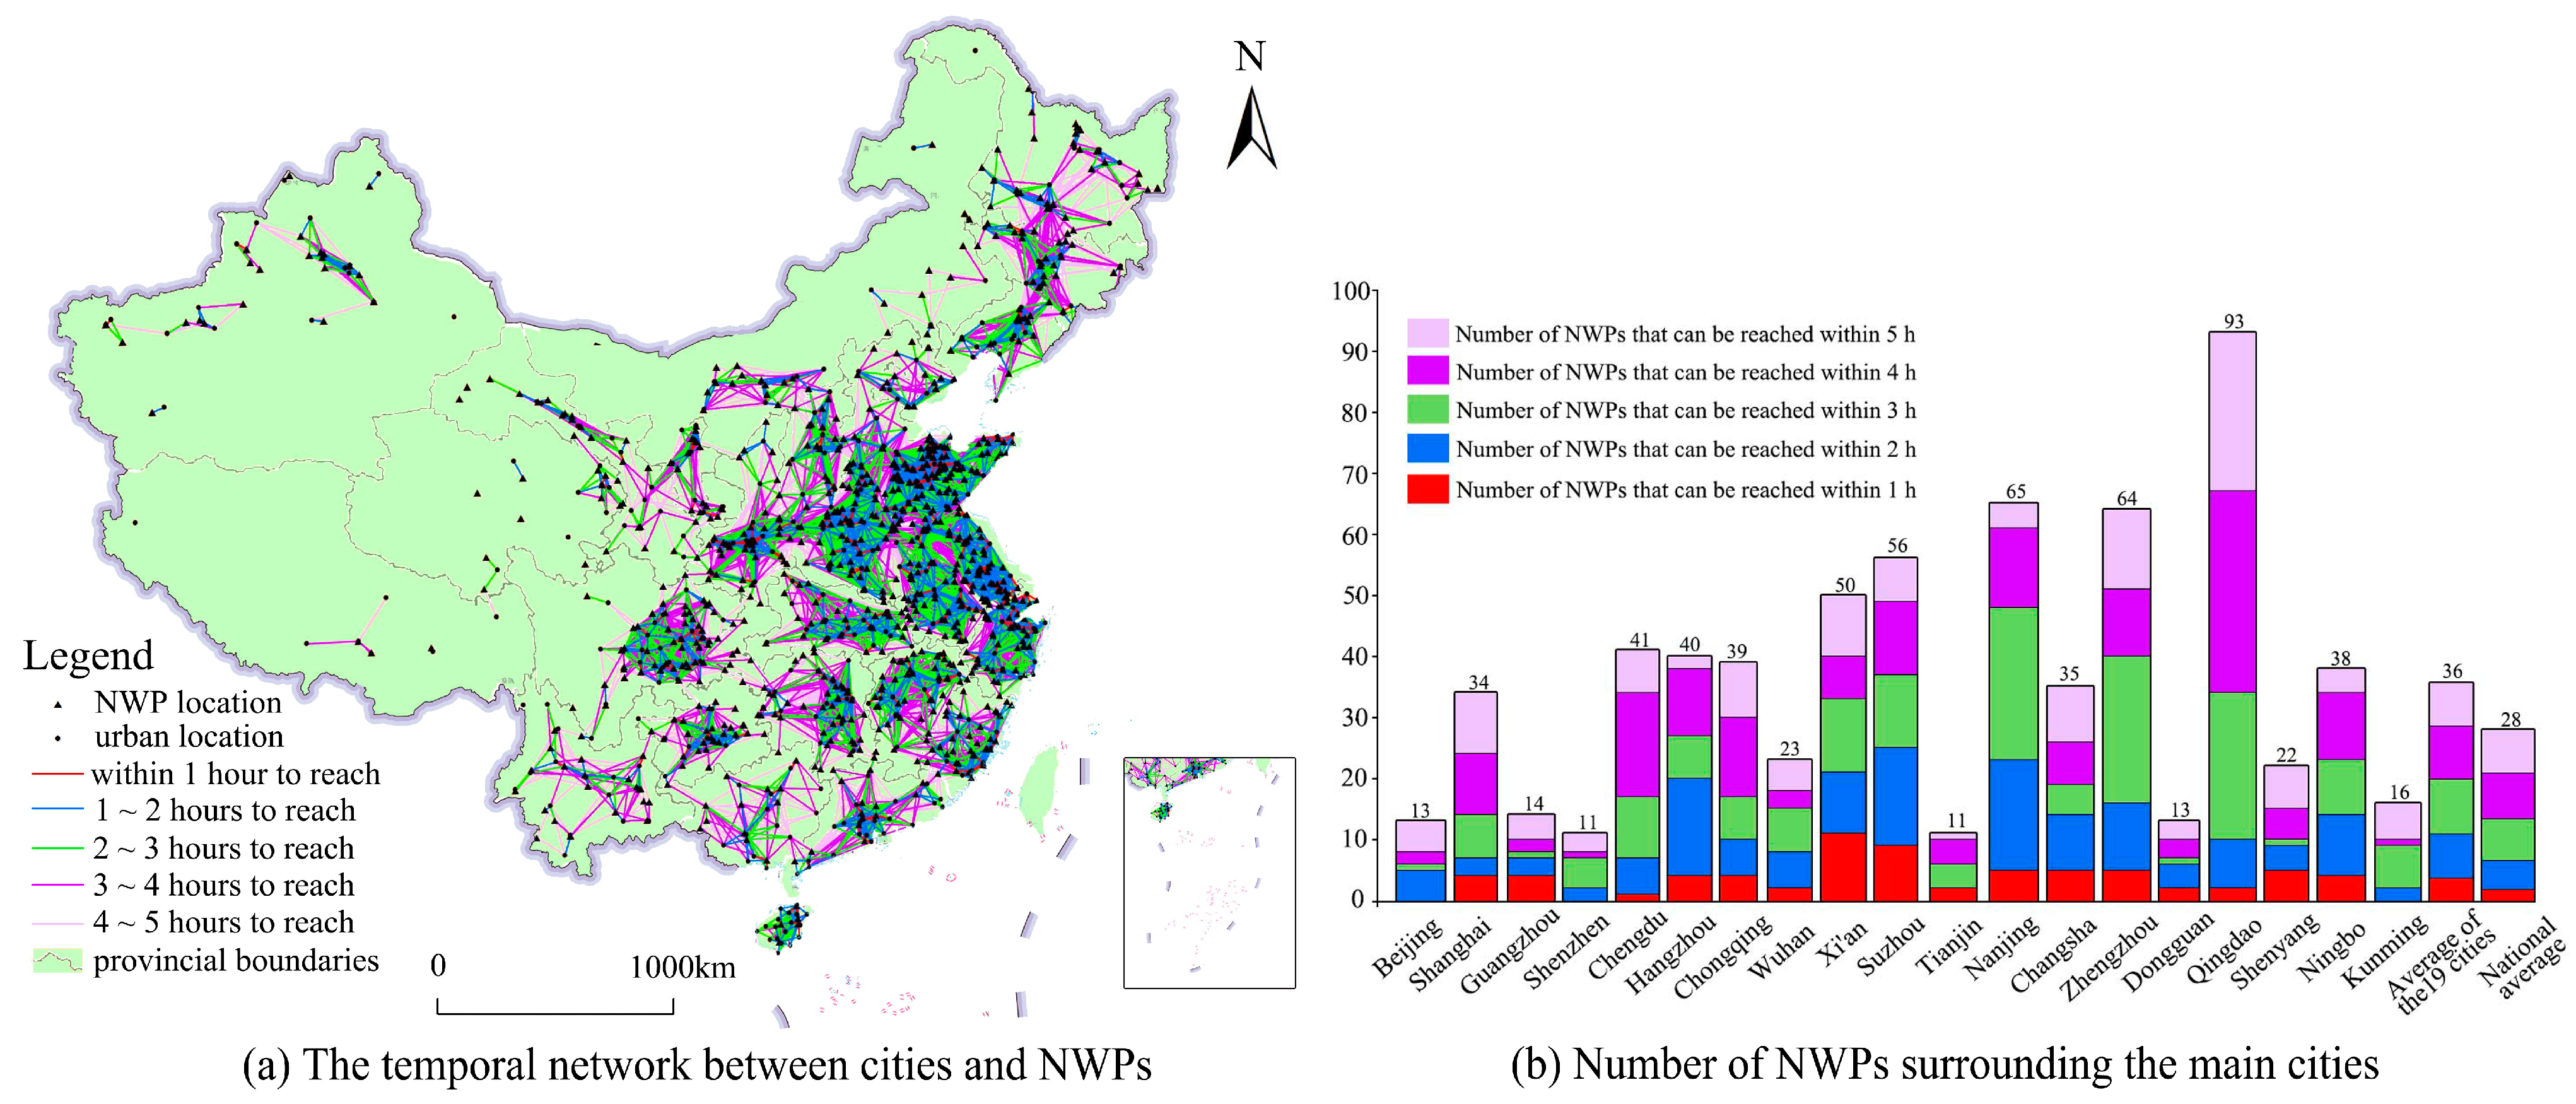
4.1. Road Network Connecting NWPs and Urban Centres
4.2. Mapping the Accessibility of NWPs and Measuring Its Spatial Autocorrelation
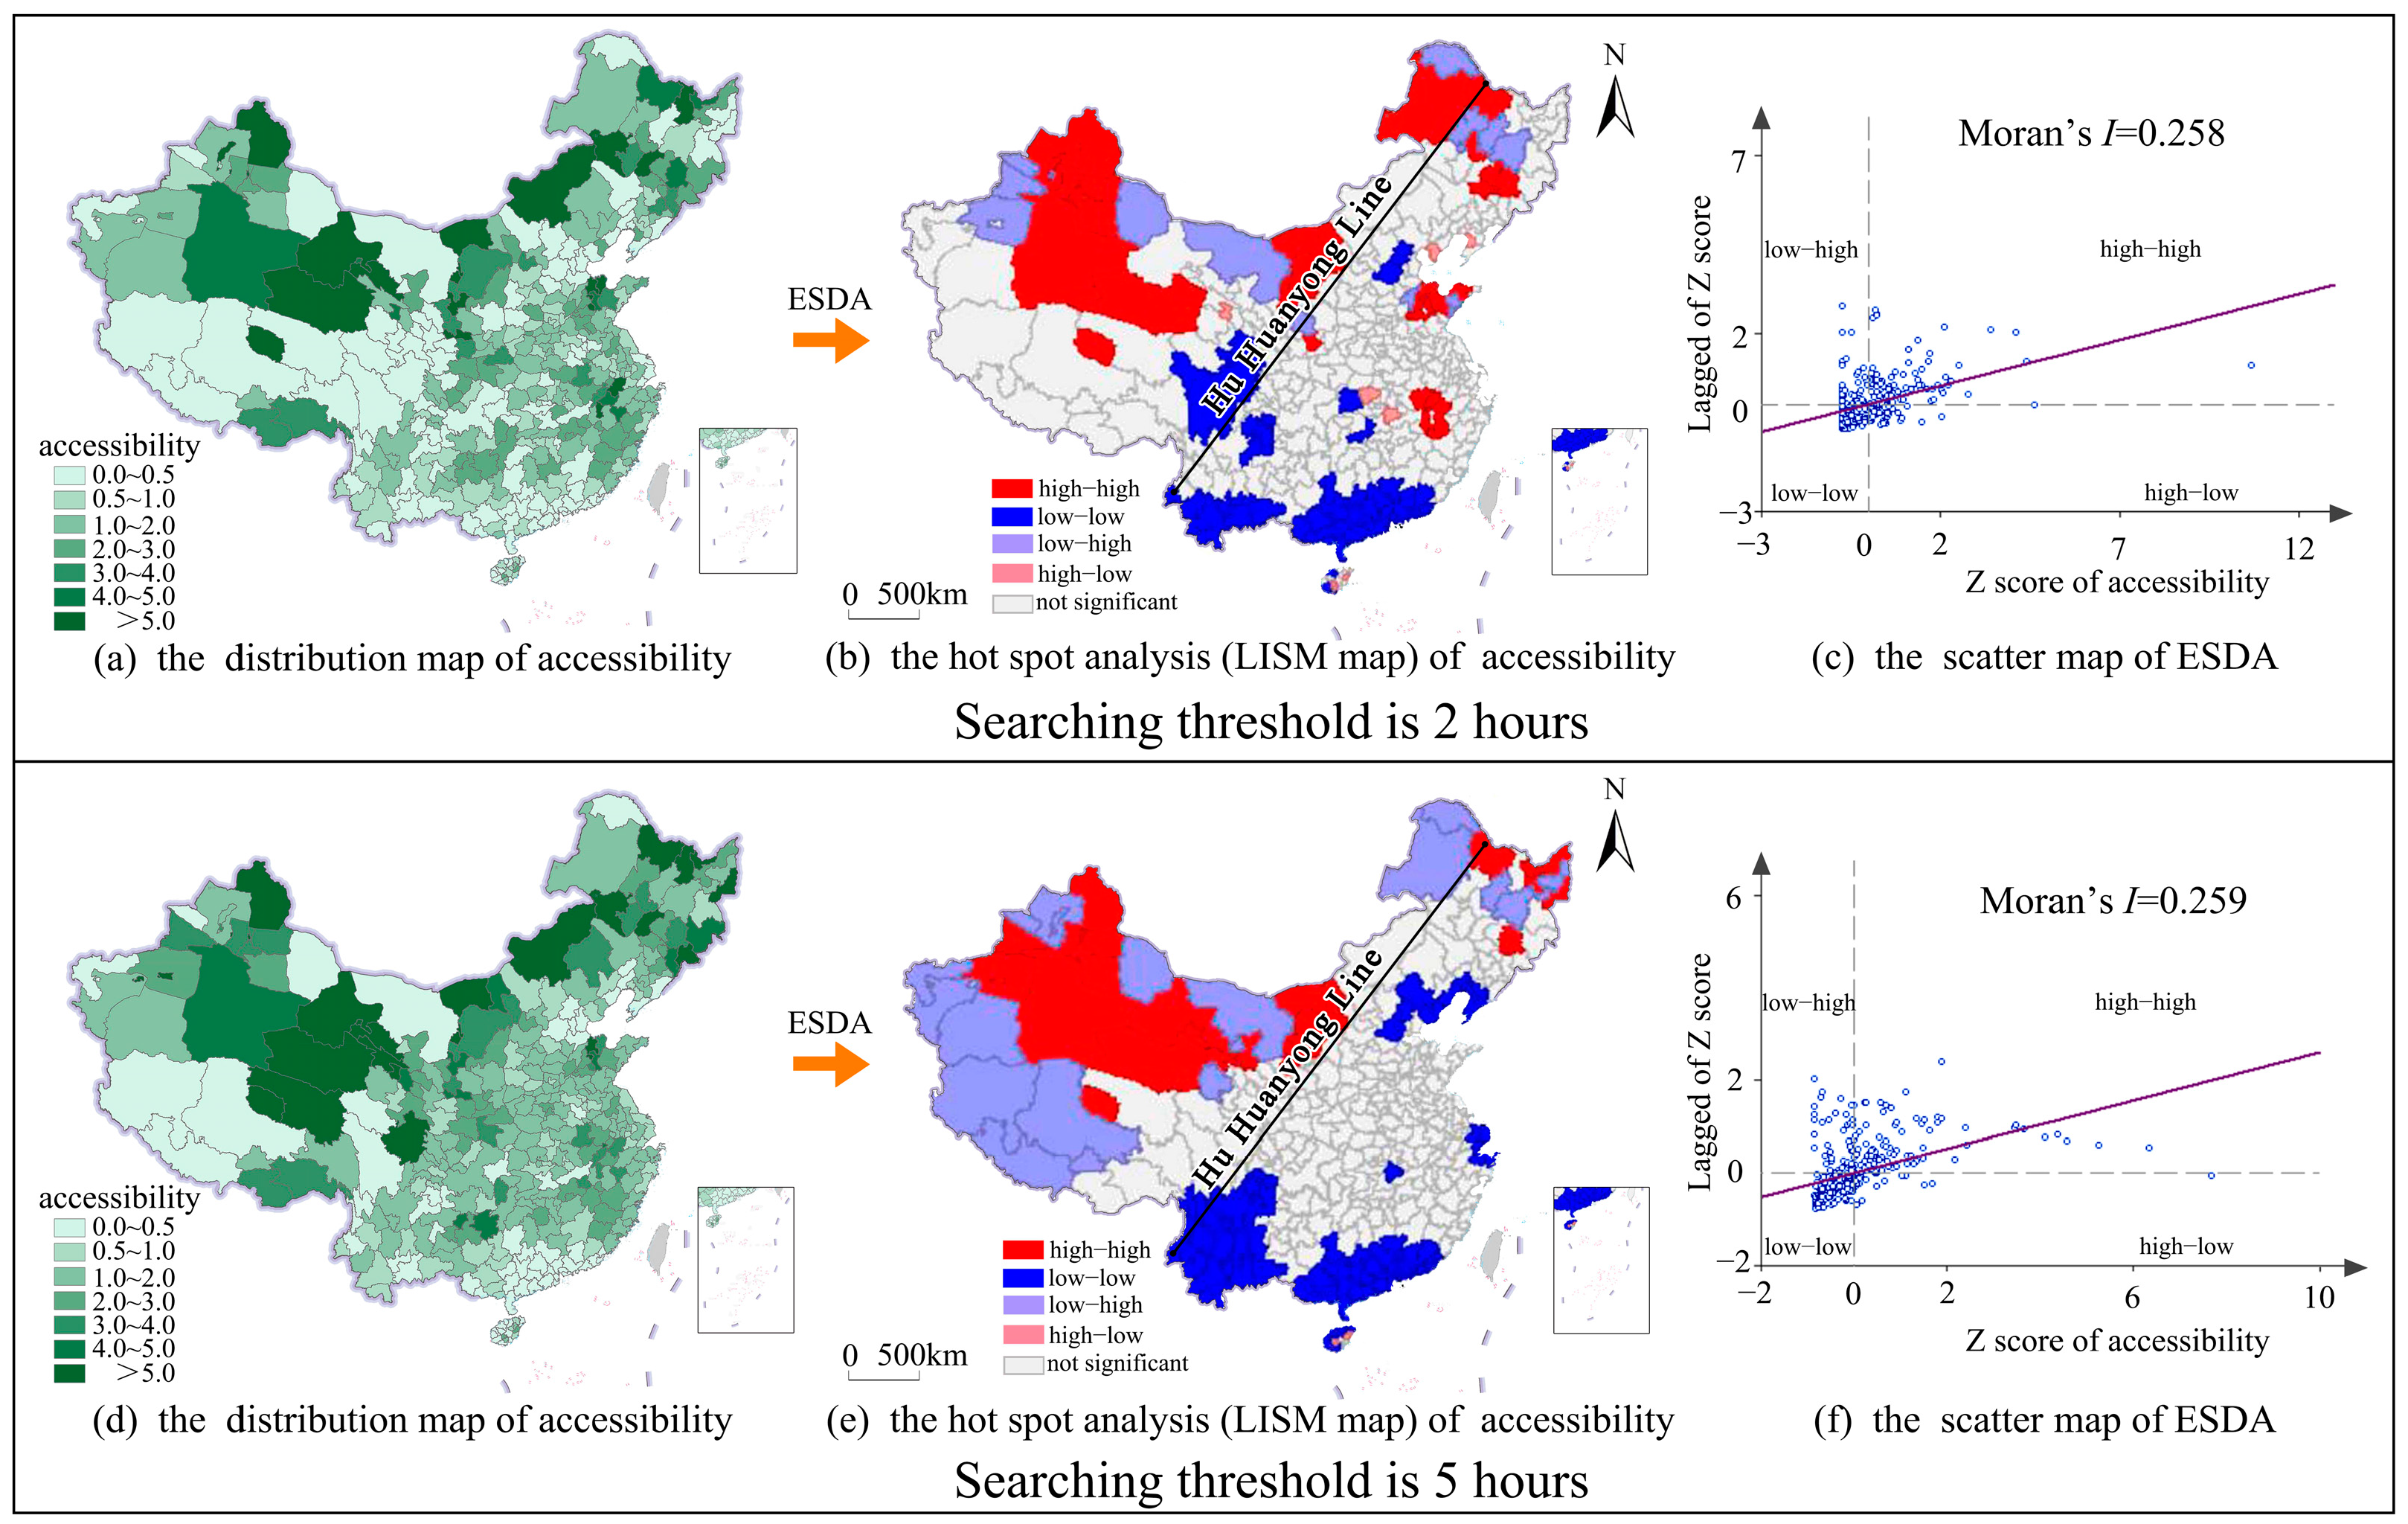
- (1)
- In the map of 2 h, both the hot spot areas (high–high significance) and cold spot areas (low–low significance) are dispersed. Meanwhile, in the map of 5 h, both the hot and cold spot areas are more connected and agglomerated. Detailed changes of the spatial features can be observed when the searching threshold increased from 2 to 5 h: the high–high agglomeration areas in the northwest extend eastward to Jiuquan, and westward to Aksu; the low–low clustering area surrounding Beijing–Tianjin–Hebei extended north along the Bohai Bay to Dalian; the low–low clustering area in southern Yunnan reached Sichuan.
- (2)
- In the map of 2 h, there exists an intermixed trend between hot spot clusters and cold spot clusters. Meanwhile, in the map of 5 h, there is a spatial separation trend from hot-spot clusters to cold-spot clusters. From the 2 h map to the 5 h map, some local spatial clustered phenomenon disappeared, indicating that high–high or low–low characteristics were no longer significant (p > 0.05). For example, Shandong, southern Anhui, northern Jiangxi, and eastern Inner Mongolia experienced the disappearance of significance from high–high areas, while western Sichuan and western Hubei experienced it from low–low areas.
- (3)
- As for the overall spatial differences between the northwest and the southeast, the map of 5 h reveals the overall differences more strongly than that of 2 h. From the 2 h map to the 5 h map, the high–high clustered areas tend to be distributed in the northwest rather than the southeast, whereas the low–low clustered areas present an opposite trend. The boundary zone between high–high clustered areas and low–low clustered areas becomes clearer, with more areas in the central region not being substantially agglomerated. In particular, several new high–high clusters emerged in Xinjiang and Gansu, and a new low–low clustered group emerged around Shanghai.
5. Discussion and Concluding Remarks
5.1. Discussion
5.1.1. Types and Distributions of NWPs
5.1.2. Spatial Compatibility of NWP Resource and Population
5.1.3. The Influence of the Search Threshold on the Availability of NWP Resources
5.1.4. The Limitations
5.2. Conclusions
- (1)
- Measuring the distribution of NWPs is an efficient method for determining the spatial pattern of typical water projects with high ecotourism value and the degree of comprehensive utilization of water resources at the national scale. Rich in water resources with enhanced regulations for water management, densely populated, highly urbanized, and with a convenient transportation network, the NWP agglomeration areas share similar regional characteristics. The spatial consistency between NWPs, river morphology, population, cities, and transportation is a consequence of the interaction between natural geographical factors and social-economic geographical factors, and will serve as a guide for sustainable regional planning.
- (2)
- NWPs can function as detectors of various endowment and management modes of basin-scale water resources. As each category of NWPs developed from the corresponding water project, it became crucial to determine which water projects should be prioritized for upgrading to new NWPs and where. The optimal arrangement of the six categories of NWPs can not only optimize the allocation of water management resources, but also promote regional growth. Using existing examples as a guide, WLD-Type NWPs should be located in the middle or lower portions of rivers for optimal wetland utilization. URL-Type NWPs should concentrate around major cities along the regional development axis to coordinate urbanization; NRL-Type NWPs should be located near primary streams to serve as critical protecting nodes for important rivers and to generate sufficient ecological flow; RES-Type NWPs should be located in secondary main streams or tributaries to achieve the multipurpose utilization of medium- or small-sized reservoirs. The distribution patterns of WSC-Type and IRA-Type NWPs are not readily apparent and require additional investigation.
- (3)
- The accessibility of NWPs is an effective indicator of the degree to which scenic water resources and population distribution are spatially matched. The map of accessibility values is spatially auto-correlated and unevenly agglomerated, which can be identified by the ESDA-generated LISA map and quantitatively evaluated by Moran’s I. According to the characteristics of the map of accessibility, the NWPs should be viewed as a series of systematic source locations that provide both ecological and socioeconomic benefits for the surrounding area. Universal suggestions can be made in order to achieve equity in the allocation of NWP resources and to prevent the overdevelopment of water tourism. In areas where accessibility is high–high, there is little need to create new NWPs; however, the socioeconomic benefits can be enhanced by increasing the popularity and capacity of existing NWPs as tourist destinations to attract out-of-town visitors. Both the content and quantity of NWP must be enhanced in the low-accessibility regions. In addition, some typical water facilities near urban areas can be transformed into new NWPs to attract local and short-distance visitors. In regions with high–low, low–high, or insignificant accessibility characteristics, the NWP systems should adopt a more diversified development strategy and form alliances with other types of natural scenic areas, aiming for a balance between social, economic, and environmental objectives.
Author Contributions
Funding
Institutional Review Board Statement
Informed Consent Statement
Data Availability Statement
Conflicts of Interest
References
- Francois, B.; Schlef, K.E.; Wi, S.; Brown, C. Design considerations for riverine floods in a changing climate—A review. J. Hydrol. 2019, 574, 557–573. [Google Scholar] [CrossRef]
- Jiang, Y. China’s water scarcity. J. Environ. Manag. 2009, 90, 3185–3196. [Google Scholar] [CrossRef] [PubMed]
- Wang, M.; Zhang, D.; Su, J.; Dong, J.; Tan, S. Assessing hydrological effects and performance of low impact development practices based on future scenarios modeling. J. Clean. Prod. 2018, 179, 12–23. [Google Scholar] [CrossRef]
- Xu, X.; Tan, Y.; Yang, G. Environmental impact assessments of the Three Gorges Project in China: Issues and interventions. Earth-Sci. Rev. 2013, 124, 115–125. [Google Scholar] [CrossRef] [Green Version]
- Sun, X.; Xiong, S.; Zhu, X.; Zhu, X.; Li, Y.; Li, B. A new indices system for evaluating ecological-economic-social performances of wetland restorations and its application to Taihu Lake Basin, China. Ecol. Model. 2015, 295, 216–226. [Google Scholar] [CrossRef]
- Branche, E. The multipurpose water uses of hydropower reservoir: The SHARE concept. Comptes Rendus Phys. 2017, 18, 469–478. [Google Scholar] [CrossRef]
- Averitt, E.; Steiner, F.; Yabes, R.A.; Patten, D. An assessment of the Verde River Corridor Project in Arizona. Landsc. Urban Plan. 1994, 28, 161–178. [Google Scholar] [CrossRef]
- Reynaud, A.; Lanzanova, D. A global meta-analysis of the value of ecosystem services provided by lakes. Ecol. Econ. 2017, 137, 184–194. [Google Scholar] [CrossRef]
- Armatas, C.; Venn, T.; Watson, A. Understanding social–Ecological vulnerability with q-methodology: A case study of water-based ecosystem services in wyoming, USA. Sustain. Sci. 2017, 12, 105–121. [Google Scholar] [CrossRef]
- Shao, J.; Zhou, Y.; Luo, H.; Wang, J.; Zhang, Q. Comparative analysis of visual amenity services valuation: A nationwide assessment through propensity scoring matching and hedonic regression. J. Environ. Manag. 2023, 325, 116564. [Google Scholar] [CrossRef]
- Meyerhoff, J.; Klefoth, T.; Arlinghaus, R. The value artificial lake ecosystems provide to recreational anglers: Implications for management of biodiversity and outdoor recreation. J. Environ. Manag. 2019, 252, 109580. [Google Scholar] [CrossRef] [PubMed]
- Mácová, K.; Kozáková, Z. How Important for Society Is Recreation Provided by Multi-PurposeWater Reservoirs Welfare Analysis of the Vltava River Reservoir System. Water 2023, 15, 1966. [Google Scholar] [CrossRef]
- Li, T.; Gao, X. Ecosystem Services Valuation of Lakeside Wetland Park beside Chaohu Lake in China. Water 2016, 8, 301. [Google Scholar] [CrossRef]
- Satz, D.; Gould, R.K.; Chan, K.M.A.; Guerry, A.; Norton, B.; Satterfield, T.; Halpern, B.S.; Levine, J.; Woodside, U.; Hannahs, N.; et al. The challenges of incorporating cultural ecosystem services into environmental assessment. AMBIO 2013, 42, 675–684. [Google Scholar] [CrossRef] [PubMed] [Green Version]
- Santarém, F.; Campos, J.C.; Pereira, P.; Hamidou, D.; Saarinen, J.; Brito, J.C. Using multivariate statistics to assess ecotourism potential of water-bodies: A case-study in mauritania. Tour. Manag. 2018, 67, 34–46. [Google Scholar] [CrossRef]
- Liu, J.; Zang, C.; Tian, S. Water conservancy projects in China: Achievements, challenges and way forward. Glob. Environ. Chang. 2013, 23, 633–643. [Google Scholar] [CrossRef] [Green Version]
- Ministry of Water Resources. The Evaluation Standard of Water Park SL 300—2013; China WaterPower Press: Beijing, China, 2013. [Google Scholar]
- Li, W.; Qi, J.; Huang, S.; Fu, W.; Zhong, L.; He, B.-J. A pressure-state-response framework for the sustainability analysis of water national parks in China. Ecol. Indic. 2021, 131, 108127. [Google Scholar] [CrossRef]
- Perry, D.; Harrison, I.; Fernandes, S.; Burnham, S.; Nichols, A. Global Analysis of Durable Policies for Free-Flowing River Protections. Sustainability 2021, 13, 2347. [Google Scholar] [CrossRef]
- Liu, W.; Chen, W.; Cao, Y. The Evolution of theWaterfront Utilization and Sustainable Development of the Container Ports in the Yangtze River: A Case Study of the Yangtze River Delta. Land 2023, 12, 778. [Google Scholar] [CrossRef]
- Cheung, D.; Tang, B. Social order, leisure, or tourist attraction? The changing planning missions for waterfront space in Hong Kong. Habitat Int. 2015, 47, 231–240. [Google Scholar] [CrossRef]
- Qi, J.; Ding, L.; Lim, S. Application of a decision-making framework for multi-objective optimisation of urban heat mitigation strategies. Urban Clim. 2023, 47, 101372. [Google Scholar] [CrossRef]
- Zhang, M.; Huang, Y.; Shen, S.; Ye, Y.; Liao, Q.; Wang, W.; Liu, L.; Zhu, X.; Guo, J. Study on the protection and sustainable development of scenic resources-a case study of Qingxiushan scenic spot in Nanning city. J. Nat. Conserv. 2023, 72, 126348. [Google Scholar] [CrossRef]
- Yuan, D.; Wu, R.; Li, D.; Zhu, L.; Pan, Y. Spatial PatternsCharacteristics and InfluencingFactors of Cultural Resources in theYellow River National Cultural Park, China. Sustainability 2023, 15, 6563. [Google Scholar] [CrossRef]
- Scott, D.; Lemieux, C. Climate change and protected area policy and planning in Canada. For. Chron. 2005, 81, 696–703. [Google Scholar] [CrossRef] [Green Version]
- Lin, J.; Yang, W.; Yu, K.; Geng, J.; Liu, J. Construction of Water Corridors for Mitigation of Urban Heat Island Effect. Land 2023, 12, 308. [Google Scholar] [CrossRef]
- Zheng, W.; Dong, W.; Lin, G. Adaptive management of estuarine resource utilization and wetland conservation based on multi-temporal remote sensing: A case study of Minjiang Estuary, China. J. Nat. Conserv. 2022, 70, 126286. [Google Scholar] [CrossRef]
- Cheng, S.; Zhai, Z.; Sun, W.; Wang, Y.; Yu, R.; Ge, X. Research on the Satisfaction of Beijing Waterfront Green Space Landscape Based on Social Media Data. Land 2022, 11, 1849. [Google Scholar] [CrossRef]
- Elomri, A.; Mazzoni, A.; Triki, C. ALiterature Review on SystemDynamics Modeling for SustainableManagement of Water Supply and Demand. Sustainability 2023, 15, 6826. [Google Scholar]
- Wang, H. Preliminary investigation of waterfront redevelopment in Chinese coastal port cities: The case of the eastern Dalian port areas. J. Transp. Geogr. 2014, 40, 29–42. [Google Scholar] [CrossRef]
- Qi, J.; Ding, L.; Lim, S. A decision-making framework to support urban heat mitigation by local governments. Resour. Conserv. Recycl. 2022, 184, 106420. [Google Scholar] [CrossRef]
- Yang, Y.; Yao, C.; Xu, D. Ecological compensation standards of national scenic spots in western China: A case study of Taibai Mountain. Tour. Manag. 2020, 76, 103950.1–103950.17. [Google Scholar] [CrossRef]
- Nesticò, A.; Maselli, G. Sustainability indicators for the economic evaluation of tourism investments on islands. J. Clean. Prod. 2020, 248, 119217. [Google Scholar] [CrossRef]
- Meyer, N.; Schafft, M.; Wegner, B.; Wolter, C.; Arlinghaus, R.; Venohr, M.; von Oheimb, G. A day on the shore: Ecological impacts of non-motorised recreational activities in and around inland water bodies. J. Nat. Conserv. 2021, 64, 126073. [Google Scholar] [CrossRef]
- Alic, E.; Trottier, L.; Twardek, W.M.; Bennett, L.L.; Chisholm, S.; Tremblay, P.; Tuononen, E.; Bennett, J.R.; Bower, S.D.; Lennox, R.J.; et al. Recreational fisheries activities and management in national parks: A global perspective. J. Nat. Conserv. 2021, 59, 125948. [Google Scholar] [CrossRef]
- Scheepens, A.; Vogtländer, J.; Brezet, J. Two life cycle assessment (LCA) based methods to analyse and design complex (regional) circular economy systems. Case: Making water tourism more sustainable. J. Clean. Prod. 2016, 114, 257–268. [Google Scholar] [CrossRef]
- Robledano, F.; Esteve, M.; Calvo, J.; Martínez-Paz, J.M.; Farinós, P.; Carreño, M.F.; Soto, I.; Avilés, M.; Ballesteros, G.A.; Martínez-Baños, P.; et al. Multi-criteria assessment of a proposed ecotourism, environmental education and research infrastructure in a unique lagoon ecosystem: The Encanizadas del Mar Menor (Murcia, SE Spain). J. Nat. Conserv. 2018, 43, 201–210. [Google Scholar] [CrossRef]
- Qi, J.; Lin, E.S.; Tan, P.Y.; Roger, C.M.H.; Sia, A.; Olszewska-Guizzo, A.; Zhang, X.; Waykool, R. Development and application of 3D spatial metrics using point clouds for landscape visual quality assessment. Landsc. Urban Plan. 2022, 228, 104585. [Google Scholar] [CrossRef]
- Jalilian, M.; Salmanmahiny, A.; Danehkar, A.; Shayesteh, K. Developing a method for calculating conservation targets in systematic conservation planning at the national level. J. Nat. Conserv. 2021, 64, 126091. [Google Scholar] [CrossRef]
- Rylands, A.; Brandon, K. Brazilian protected areas. Conserv. Biol. 2005, 19, 612–618. [Google Scholar] [CrossRef]
- Abell, R.; Harrison, I.J. A boost for freshwater conservation. Science 2020, 370, 38–39. [Google Scholar] [CrossRef]
- Li, P.; Shen, M.; Perry, D.; Li, C.; Zhao, M.; Yang, P. A comparative study on the spatial distribution characteristics and the driving factors of protected river systems between China and the United States of America. Ecol. Indic. 2022, 135, 108505. [Google Scholar] [CrossRef]
- Duan, T.; Feng, J.; Chang, X.; Li, Y. Evaluation of the effectiveness and effects of long-term ecological restoration on watershed water quality dynamics in two eutrophic river catchments in Lake Chaohu Basin, China. Ecol. Indic. 2022, 145, 109592. [Google Scholar] [CrossRef]
- Chu, C.; Chou, Y. Using cellular data to analyze the tourists’ trajectories for tourism destination attributes: A case study in Hualien, Taiwan. J. Transp. Geogr. 2021, 96, 103178. [Google Scholar] [CrossRef]
- Reitsamer, B.; Brunner-Sperdin, A.; Stokburger-Sauer, N. Destination attractiveness and destination attachment: The mediating role of tourists’ attitude. Tour. Manag. Perspect. 2016, 19, 93–101. [Google Scholar] [CrossRef]
- Wen, C.; Albert, C.; Haaren, C.V. Equality in access to urban green spaces: A case study in hannover, germany, with a focus on the elderly population. Urban For. Urban Green. 2020, 55, 126820. [Google Scholar] [CrossRef]
- Furze, J.N.; Eslamian, S.; Raafat, S.; Swing, K. Mathematical Advances towards Earth Systems Protection and Sustainability; Springer: Cham, Switzerland, 2022; Volume 1, 337p. [Google Scholar]
- Li, W.; He, B.; Qi, J. Water Conservation Scenic Spots in China:Developing the Tourism Potential of Hydraulic Projects and Water Resources. Sustainability 2018, 10, 4509. [Google Scholar] [CrossRef] [Green Version]
- Chen, Y.; Jin, F.; Lu, Y.; Chen, Z.; Yang, Y. Development history and accessibility evolution of landtransportation network in Beijing-Tianjin-Hebei region. J. Geogr. Sci. 2018, 28, 1500–1518. [Google Scholar] [CrossRef] [Green Version]
- Brunsdon, C. Estimating probability surfaces for geographical point data: An adaptive kernel algorithm. Comput. Geosci. 1995, 21, 877–894. [Google Scholar] [CrossRef]
- Dong, J.; Peng, J.; Liu, Y.; Qiu, S.; Han, Y. Integrating spatial continuous wavelet transform and kernel density estimation to identify ecological corridors in megacities. Landsc. Urban Plan. 2020, 199, 103815. [Google Scholar] [CrossRef]
- Korpilo, S.; Virtanen, T.; Saukkonen, T.; Lehvävirta, S. More than A to B: Understanding and managing visitor spatial behaviour in urban forests using public participation GIS. J. Environ. Manag. 2018, 207, 124–133. [Google Scholar] [CrossRef] [Green Version]
- Xing, L.; Liu, Y.; Liu, X.; Wei, X.; Mao, Y. Spatio-temporal disparity between demand and supply of park green space service in urban area of Wuhan from 2000 to 2014. Habitat Int. 2018, 71, 49–59. [Google Scholar] [CrossRef]
- Cao, Y.; Guo, Y.; Zhang, M. Research on the Equity of Urban Green Park Space Layout Based on Ga2SFCA Optimization Method—Taking the Core Area of Beijing as an Example. Land 2022, 11, 1323. [Google Scholar] [CrossRef]
- Wang, F. Measurement, optimization, and impact of health care accessibility: A methodological review. Ann. Am. Assoc. Geogr. 2012, 102, 1104–1112. [Google Scholar] [CrossRef] [Green Version]
- Tobler, W.R. A Computer Movie Simulating Urban Growth in the Detroit Region. Econ. Geogr. 1970, 46, 234–240. [Google Scholar] [CrossRef]
- Zhang, X.; Geng, Y.; Tong, Y.W.; Kua, H.W.; Tian, X.; Wu, R.; Zhao, X.; Chiu, A.S. Spatial characteristics and its driving factors of low-carbon energy technology innovation in China: A gravity movement and exploratory spatial data analysis. J. Clean. Prod. 2021, 295, 126481. [Google Scholar] [CrossRef]
- Anselin, L.; Rey, S. Properties of Tests for Spatial Dependence in Linear Regression Models. Geogr. Anal. 1991, 23, 112–131. [Google Scholar] [CrossRef]
- Ma, H.; Zou, J. Impacts of official high-standard scenic spots on environment and growth—Evidence from China’s 5A scenic spots at the city level. Ecol. Econ. 2022, 201, 107555. [Google Scholar] [CrossRef]
- Xu, J.; Wei, J.; Zhao, D. Influence of social media on operational efficiency of national scenic spots in china based on three-stage DEA model. Int. J. Inform. Manag. 2016, 36, 374–388. [Google Scholar] [CrossRef]
- Huang, Y.; Lin, T.; Xue, X.; Zhang, G.; Liu, Y.; Zeng, Z.; Zhang, J.; Sui, J. Spatial patterns and inequity of urban green space supply in China. Ecol. Indic. 2021, 132, 108275. [Google Scholar] [CrossRef]
- Page, N.; Langford, M.; Higgs, G. An evaluation of alternative measures of accessibility for investigating potential ‘deprivation amplification’ in service provision. Appl. Geogr. 2018, 95, 19–33. [Google Scholar] [CrossRef]
- Knap, E.; Ulak, M.B.; Geurs, K.T.; Mulders, A.; van der Drift, S. A composite X-minute city cycling accessibility metric and its role in assessing spatial and socioeconomic inequalities—A case study in Utrecht, the Netherlands. J. Urban Mobil. 2023, 3, 100043. [Google Scholar] [CrossRef]
- Wu, J.; Chen, H.; Wang, H.; He, Q.; Zhou, K. Will the opening community policy improve the equity of green accessibility and in what ways?—Response based on a 2-step floating catchment area method and genetic algorithm. J. Clean. Prod. 2020, 263, 121454. [Google Scholar] [CrossRef]


| RES-Type | WLD-Type | NRL-Type | URL-Type | IRA-Type | WSC-Type | Superposition of the Six Types | |
|---|---|---|---|---|---|---|---|
| Yangtze River Basin | 1.85 (151) | 12.02 (4) | 1.99 (66) | 2.84 (51) | 2.23 (7) | 1.91 (13) | 1.99 (292) |
| Yellow River Basin | 1.59 (39) | 1.48 (9) | 3.16 (43) | 2.22 (17) | 1.99 (5) | 2.56 (10) | 2.02 (123) |
| Huai River Basin | 2.59 (43) | 1.86 (8) | 2.13 (16) | 1.60 (68) | / (2) | 1.61 (5) | 1.93 (142) |
| Hai River Basin | 2.93 (26) | 2.23 (3) | 3.07 (8) | 1.87 (23) | / (2) | 2.62 (4) | 1.71 (66) |
| Pearl River Basin | 1.93 (26) | / (0) | 2.86 (12) | 9.23 (5) | / (2) | / (2) | 1.98 (47) |
| Songliao River Basin | 1.40 (45) | 3.30 (11) | 1.13 (12) | 2.37 (14) | / (2) | / (1) | 1.46 (85) |
| Continental River Basin | 3.23 (24) | / (2) | 2.02 (9) | 39.28 (4) | / (2) | / (1) | 2.53 (42) |
| Southeastern Rivers Basin | 2.63 (30) | / (2) | 2.48 (22) | 2.09 (10) | / (2) | / (1) | 2.56 (67) |
| Southwestern Rivers Basin | 1.62 (7) | / (0) | 1.90 (5) | / (2) | / (0) | / (0) | 2.69 (14) |
| Weighted average | 2.07 | 3.41 | 2.36 | 3.08 | 2.13 | 2.15 | 1.99 |
Disclaimer/Publisher’s Note: The statements, opinions and data contained in all publications are solely those of the individual author(s) and contributor(s) and not of MDPI and/or the editor(s). MDPI and/or the editor(s) disclaim responsibility for any injury to people or property resulting from any ideas, methods, instructions or products referred to in the content. |
© 2023 by the authors. Licensee MDPI, Basel, Switzerland. This article is an open access article distributed under the terms and conditions of the Creative Commons Attribution (CC BY) license (https://creativecommons.org/licenses/by/4.0/).
Share and Cite
Zhang, C.; He, B.; Li, W.; Guo, C. Spatial Distribution and Accessibility Evaluation of National Water Parks in China. Sustainability 2023, 15, 11621. https://doi.org/10.3390/su151511621
Zhang C, He B, Li W, Guo C. Spatial Distribution and Accessibility Evaluation of National Water Parks in China. Sustainability. 2023; 15(15):11621. https://doi.org/10.3390/su151511621
Chicago/Turabian StyleZhang, Chenming, Bei He, Wei Li, and Chunyang Guo. 2023. "Spatial Distribution and Accessibility Evaluation of National Water Parks in China" Sustainability 15, no. 15: 11621. https://doi.org/10.3390/su151511621