Article

The Impact of Green Finance Pilot Policy on Carbon Intensity in Chinese Cities—Based on the Synthetic Control Method

1
School of Finance, Southwestern University of Finance and Economics, Chengdu 611130, China
2
School of Finance, Yunnan University of Finance and Economics, Kunming 650221, China
*
Author to whom correspondence should be addressed.
Sustainability 2023, 15(15), 11571; https://doi.org/10.3390/su151511571
Submission received: 16 June 2023 / Revised: 16 July 2023 / Accepted: 19 July 2023 / Published: 26 July 2023
(This article belongs to the Special Issue Energy Transitions and Green Finance towards Sustainability)

Abstract

:
As an innovative and efficient approach, green finance unlocks the potential to achieve China’s carbon peak and neutrality goals. This study takes China’s Green Finance Pilot Scheme as a quasi-natural experience and adopts the synthetic control method to evaluate the carbon intensity reduction effects of the Green Finance Pilot Policy (GFPP) based on the city-level panel data in China from 2008 to 2019. We find that the GFPP significantly reduces the carbon intensity of pilot cities in eastern China, such as Guangzhou, Huzhou, and Quzhou. However, implementing GFPP does not achieve the desired reduction effect in Nanchang and Guiyang situated in central and western China. After multiple robustness tests, it can be proved that the preceding conclusions are robust. The mechanism analysis results show that the GFPP can promote carbon intensity reduction through financial agglomeration and green innovation. This study is conducive to assessing the policy effectiveness of China’s GFPP and provides empirical evidence for promoting green finance system construction in China.

1. Introduction

Environmental degradation caused by global warming has become increasingly serious in recent years. In addition to sea level rise, glacier melting, and other surface effects, global warming has also led to species extinction, land desertification, crop reduction, and other derivative fatal problems, which are mainly caused by a surge in carbon emissions [1]. According to data from the World Bank, China has been the world’s largest carbon emitter since 2005. To increase national contribution to climate change mitigation, the Chinese government announced that “China will adopt more powerful policies and measures, strive to achieve the peak of carbon emissions before 2030 and achieve carbon neutrality before 2060” in September 2020. Therefore, we chose Chinese cities as research subjects to investigate an innovative approach to reducing carbon emissions.
As a pioneer in green finance, the Chinese government has promulgated a quantity of preemptive green finance policies. In August 2016, the People’s Bank of China (PBC) issued “Guiding Opinions on Building a Green Finance System”, stating that green finance is an institutional arrangement to support the transition to a green economy through various financial instruments such as green loans, bonds, and insurance. In June 2017, the Chinese government introduced the Green Finance Pilot Policy (GFPP) in eight areas across five provinces: Guangzhou, Guangdong Province; Guian New Area (consisting of Guiyang and Anshun), Guizhou Province; Ganjiang New Area (consisting of Nanchang and Jiujiang), Jiangxi Province; Huzhou and Quzhou, Zhejiang Province; and Karamay, Hami, and Changji, Xinjiang Uygur Autonomous Region. Following the first batch of pilot cities, Lanzhou New Area and Chongqing were designated as pilot cities in November 2019 and August 2022, respectively.
The GFPP is a good example of “bottom-up” innovation-driven [2]. As a pilot policy, the GFPP exhibits characteristics of experimental and flexibility. The Chinese government encourages the pilot cities to develop different tasks for green finance innovation based on the local economic conditions. Since the implementation of GFPP, the pilot cities’ progress in green finance innovation has attracted wide concern from the government and researchers. The existing literature concerning the GFPP mostly focuses on corporate investment efficiency [3], green innovation [4,5,6], as well as regional green development [7,8]. Most studies assess the policy effect of all pilot cities in their entirety using the difference-in-differences (DID) method [9,10,11]. However, few studies have directly discussed the effect of GFPP on carbon intensity. The powerful green finance policies can result in a virtuous cycle of carbon emission reduction, a stable financial sector, and high economic growth [12]. Therefore, this study uses the synthetic control method (SCM) to accurately evaluate the carbon intensity reduction effect of a single pilot city. It is helpful to obtain inspiration from the implementation effect of GFPP and guide other cities to develop green finance.
The main contributions of this study are as follows. First, this study is the first to introduce the SCM to examine the effect of GFPP on carbon intensity. Compared with previous research concerning GFPP, which assesses the policy effect of all pilot cities in their entirety, this study applies the SCM to accurately evaluate the carbon intensity reduction effect of a single pilot city. Second, we find that the effect of GFPP on carbon intensity has regional heterogeneity, which is overlooked in previous research. Specifically, the GFPP significantly reduces the carbon intensity in pilot cities situated in eastern China, such as Guangzhou, Huzhou, and Quzhou. However, the carbon intensity reduction effect of GFPP is insignificant in Nanchang and Guiyang situated in central and western China. Multiple robustness tests prove that the preceding conclusions are robust. Third, this study deeply discusses the mechanism by which GFPP affects carbon intensity. The findings show that GFPP significantly reduces carbon intensity via financial agglomeration and green innovation. The remainder of this paper is organized as follows: Section 2 is a literature review. Section 3 contains theoretical analysis and hypotheses. Section 4 describes the data and model building. Section 5 contains the empirical results, the robustness tests, and the mechanism analysis. Section 6 shows the discussion. Section 7 presents conclusions.

2. Literature Review

2.1. Green Finance and Carbon Intensity

Several studies have explored the impact of green finance on carbon intensity. Most researchers believe green finance is adversely and significantly correlated with carbon intensity. Kapa et al. [13] investigated six countries that account for 61% of global carbon emissions and discovered that green finance contributes to a remarkable reduction in carbon intensity. Zhang and Ke [14] found that every 1% increase in green finance development results in a 2% decrease in carbon intensity. Du [15] confirmed that both short and long-term estimates of green finance significantly reduce carbon intensity using the quantile autoregressive distributed lag (QARDL) model. However, Li and Fan [16] found that green finance development curbs the carbon intensity in local areas, while raises the carbon intensity of surrounding areas.
Some studies have focused on the impact of different green financial instruments on carbon intensity. Wang et al. [17] revealed that green credit has a stronger impact on reducing carbon intensity than green equity investments. According to Zhang et al. [18], implementing the green credit policy has a significant impact on carbon intensity reduction in heavily polluting industries. Similarly, Xu et al. [19] proved that the green credit policy can effectively reduce the carbon intensity of enterprises by strengthening environmental supervision. Xu and Li [20] found that issuing green bonds significantly reduces the carbon intensity of cities, especially in economy-developed cities. Huang et al. [21] constructed a comprehensive index of green financial development and found that all components of green finance have a significant impact on decreasing carbon intensity, except for green investment tools.

2.2. The Effect of GFPP

Researchers have gradually explored the effect of GFPP in recent years. The GFPP can effectively eliminate information asymmetry, thus guiding capital flows and promoting the agglomeration of financial resources [22]. Yan et al. [23] found that raising the levels of financial agglomeration is accompanied by the law of marginal decreasing carbon intensity tendency. After implementing GFPP, Lv et al. [24] found that pilot areas such as Zhejiang, Jiangxi, and Xinjiang, have a higher degree of green finance development than other non-pilot provinces. Yuan et al. [25] believed that financial agglomeration improves environmental quality by expanding the financial scale, optimizing the financial structure, and improving financial technology levels. Implementing GFPP also leads to a more adequate supply of capital to green industries, thus contributing to a reduction in carbon intensity [26].
Several studies have investigated the impact of GFPP on green innovation. The implementation of GFPP drives the demand of enterprises for green technology innovation [27]. Irfan et al. [5] found that the number of green patents in pilot areas is much higher than that in non-pilot areas. By raising loan requirements and decreasing the investment willingness of external investors, implementing GFPP forces high-polluting enterprises to carry out technological innovation [28], thus decreasing carbon intensity [29]. Another aspect, the GFPP motivates green enterprises to engage in green innovation by strengthening talent support and increasing government subsidies [30]. Ge et al. [31] found that the GFPP promotes environmentally friendly technological progress, which contributes to improving energy efficiency and reducing carbon emissions. Su et al. [32] also confirmed that implementing GFPP has a significant energy-saving effect on enterprises in pilot areas. The findings showed that the GFPP significantly lowers enterprises’ energy intensity through green innovation.
In summary, studies on the relationship between green finance and carbon intensity suggest the carbon reduction effect of green finance. However, the literature in this area still leaves room for expansion. Almost no literature directly focuses on the effect of green finance on carbon intensity from a policy perspective. On the other hand, previous studies concerning GFPP mostly assess the policy effect using the DID method, which does not allow for an accurate evaluation of the impact of GFPP on a single pilot city. This sets the stage for further research in this study with the help of the exogenous shock from policy as well as the SCM model. Therefore, this study adopts China’s prefectural-level panel data to accurately evaluate the effect of GFPP on carbon intensity by using the SCM model, making the research results more credible.

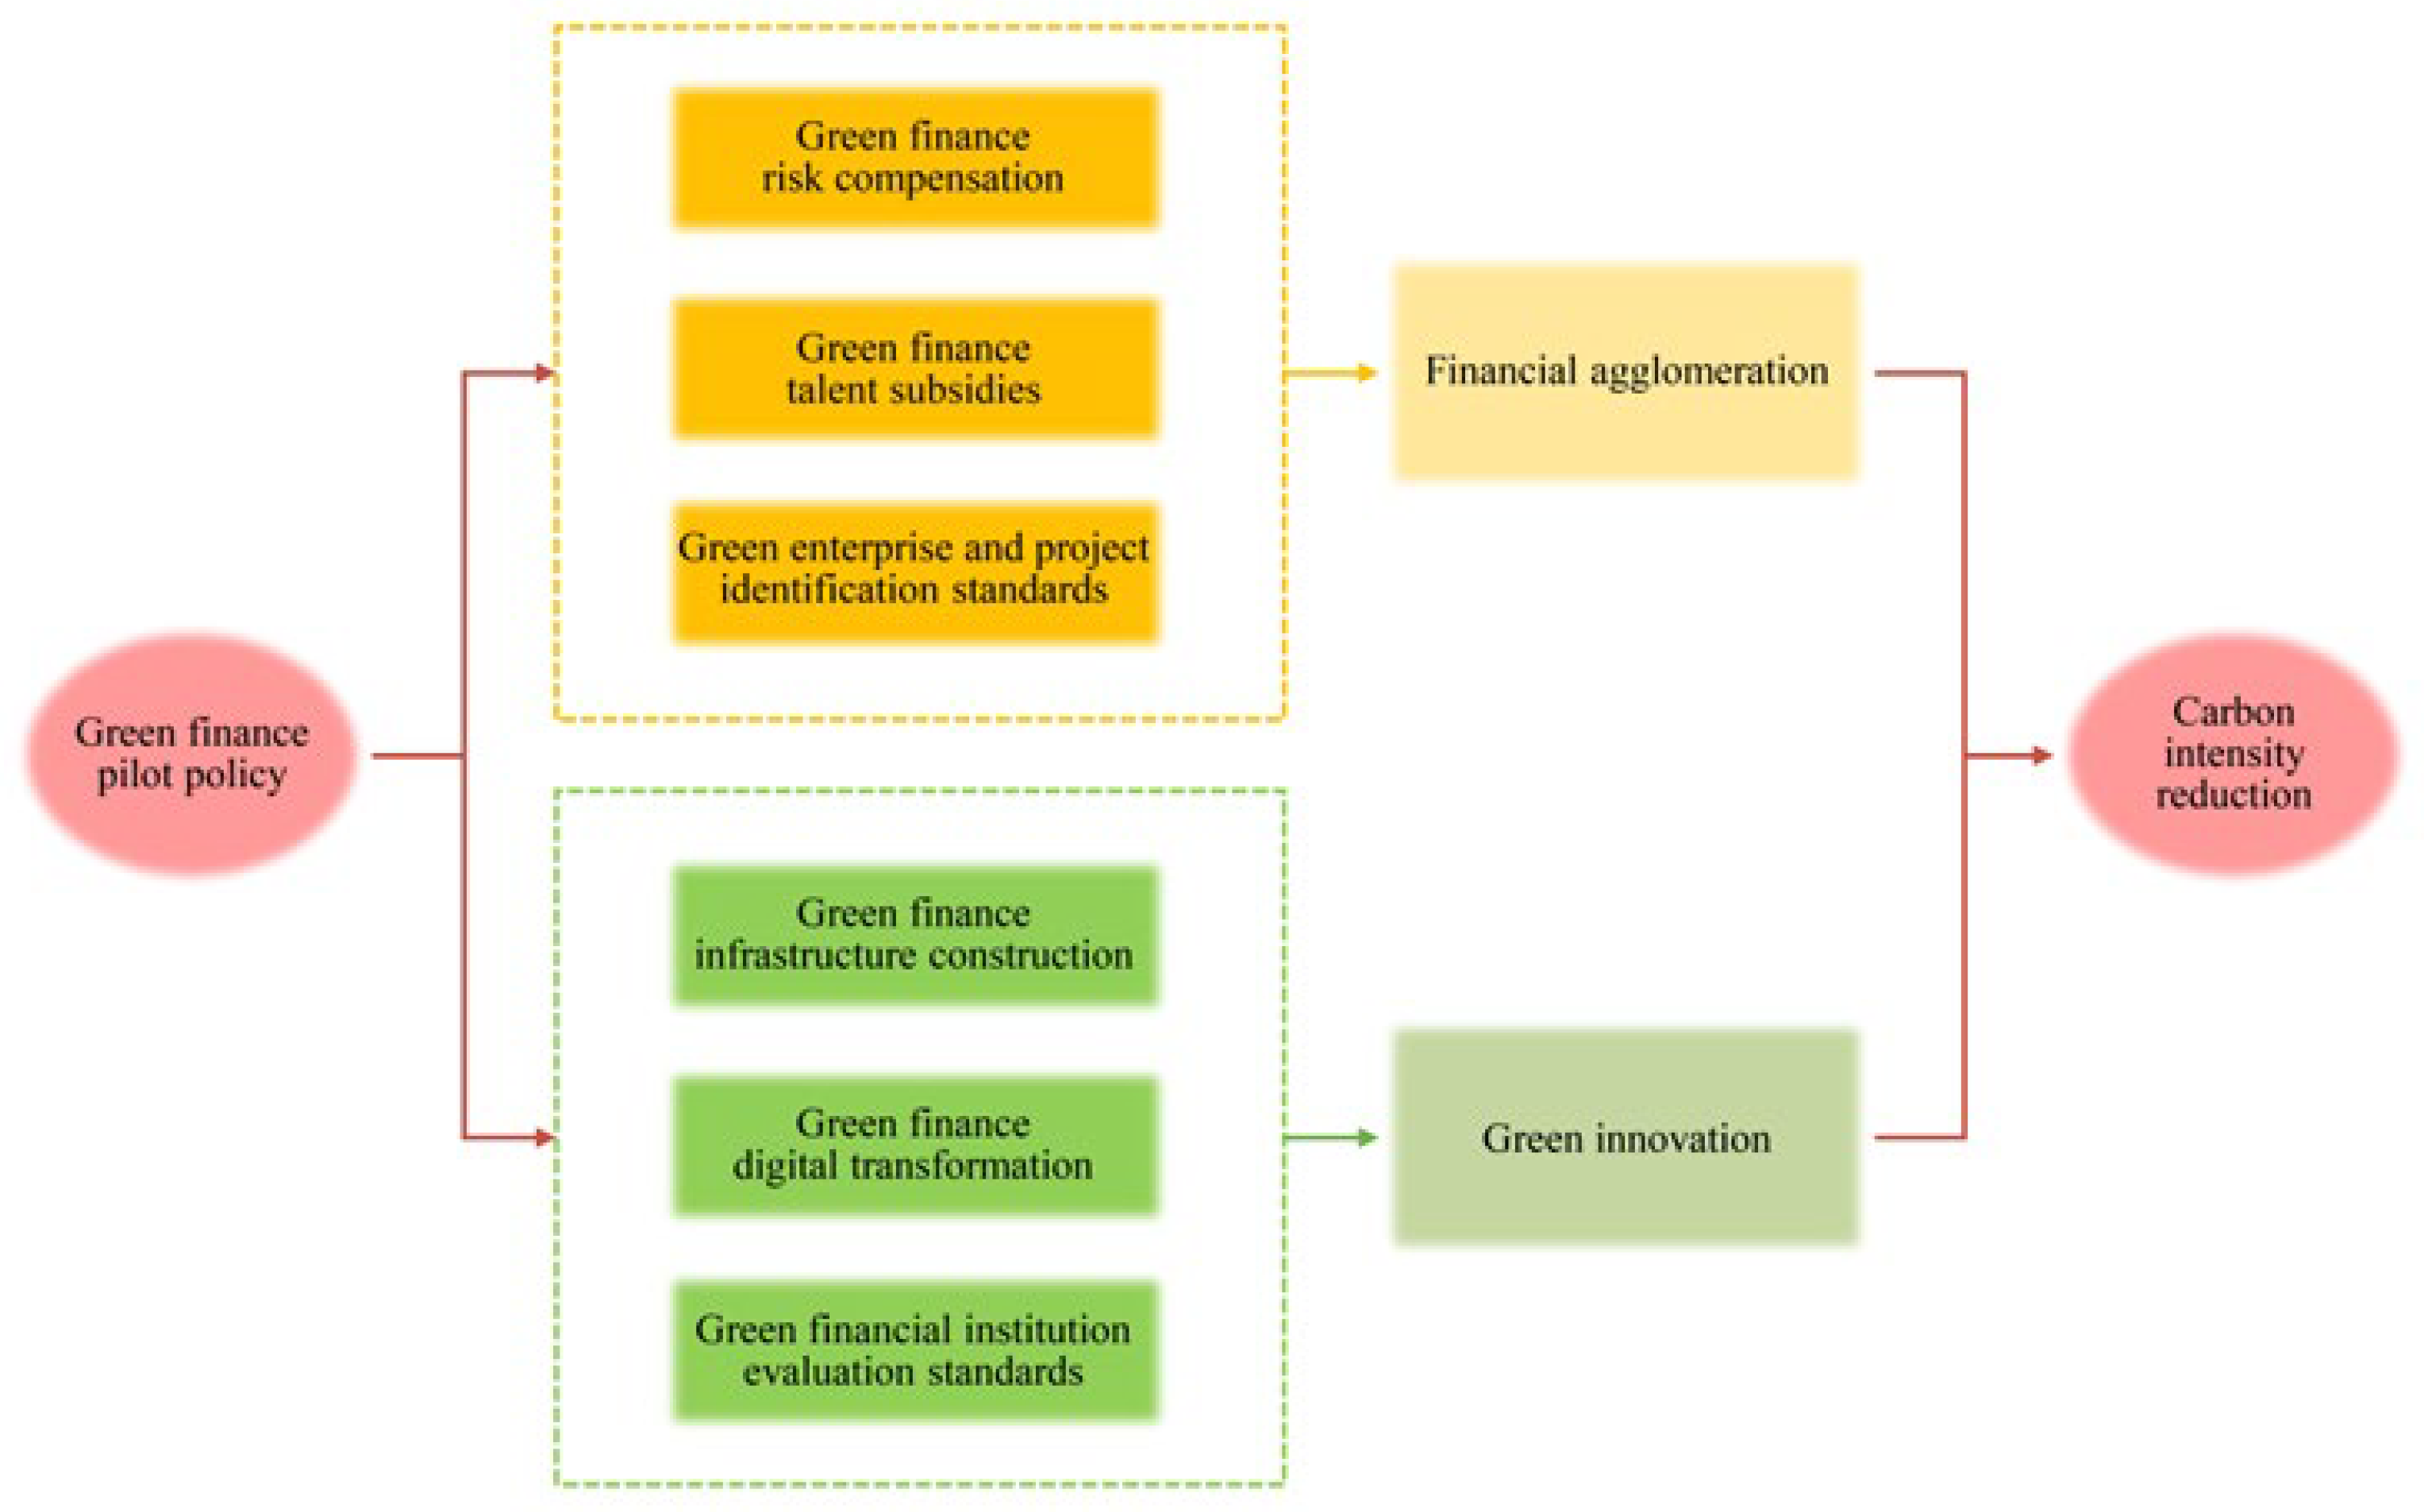
3. Theoretical Analysis and Hypotheses

The pilot cities take institutional innovation as their core task and reshape green finance policies depending on the local economic conditions. Instead of releasing a policy package directly, the Chinese government encourages pilot cities to explore innovative measures for green finance reform. Therefore, we summarize six types of innovative measures for the GFPP: green finance risk compensation, talent subsidies, infrastructure construction, digitalization transformation, green enterprise and project identification standards, and green financial institution evaluation standards. Table 1 presents the specific innovation measures in pilot cities.
From the perspective of promotion incentives for local officials, being designated as a pilot city for the GFPP unlocks the possibility of promotion for local government officials. Local government is always required to achieve targets for both economic growth and carbon emissions reduction. Carbon intensity, as a prominent assessment criterion, reflects the dependence of economic development on energy consumption. The effect of environmental competition motivates local officials to strengthen environmental regulation [33], thus effectively reducing carbon intensity [34]. Accordingly, Hypothesis 1 is proposed as follows:
Hypothesis 1 (H1).
GFPP can reduce the carbon intensity of pilot cities.
Figure 1 shows the theoretical mechanism by which GFPP affects carbon intensity. Furthermore, this study argues that the GFPP reduces carbon intensity through financial agglomeration and green innovation. First, GFPP can promote financial agglomeration in the following ways.
(1)
Pilot cities such as Guangzhou have created a risk compensation mechanism for green finance, indicating that the government provides risk compensation for 20% of the loss to financial institutions that engage in green financial business. Before the implementation of GFPP, financial institutions were not actively expanding the green finance business, since investments in green projects entail a long payback period and are unable to provide stable returns. In addition, pilot cities have established “the green enterprise and project identification standards”, avoiding additional identification procedures by financial institutions. This is conducive to reducing the operating costs of financial institutions and improving their economic benefits, thus encouraging financial institutions to set up green finance divisions in pilot cities.
(2)
Pilot cities have introduced talent subsidies and preferential policies, attracting the agglomeration of green finance professionals. Developing green finance businesses requires professional support, such as green finance product pricing, and quantitative analysis of green projects’ environmental costs. The scarcity of professionals makes it difficult for financial institutions to carry out the green finance business. Consequently, pilot cities provide a favorable institutional environment for the agglomeration of financial resources, such as capital and labor forces, thus promoting the development of green finance. Furthermore, this study proposes Hypothesis 2.
Hypothesis 2 (H2).
GFPP can reduce carbon intensity through financial agglomeration.
Second, the GFPP can reduce carbon intensity by enhancing enterprises’ green innovation ability. The specific analysis is as follows:
(1)
Pilot cities have strengthened the infrastructure construction of green finance. For example, pilot cities have built green industrial demonstration parks, attracting clusters of green enterprises including electronic information, renewable energy, and high-tech industries. In addition, pilot cities have strengthened the digital construction of green finance, such as the green project database and green enterprise financing platform. Strengthening the digital construction of green finance can help emerging enterprises make technological advancements and enhance innovation abilities, thereby reduce the carbon intensity [35,36]. This innovative green financing mode combines online and offline financing, thus reducing transaction costs on both the supply and demand sides.
(2)
Pilot cities have formulated “green financial institution evaluation standards”, encouraging financial institutions to provide various green finance products, such as green credit, bonds, and insurance, thus motivating enterprises’ green technology innovation [29]. Due to the long R&D cycle and great capital demand, it is challenging to gain direct economic benefits in a short time, which makes green enterprises often face the problem of “difficult and costly financing” [37]. However, implementing the green credit policy decreases loan interest rates for green enterprises, which can reduce their debt costs, thus leading to an incentive effect on green innovation activities [38]. Simultaneously, to enrich financing ways for enterprises, pilot cities encourage enterprises to issue a range of green debt instruments, such as directional financing instruments and asset-backed notes. Issuing green bonds can provide stable and long-term financial support to emerging enterprises and improve their technological innovation ability [39,40].
In addition, pilot cities such as Guangzhou, have issued a green insurance subsidy policy that provides 30% premium subsidies to encourage enterprises to buy green insurance. The technological innovation activities carried out by enterprises are accompanied by high risks. The complexity of R&D technology and uncertainty in the research environment may lead to technological innovation failure [41]. Owning insurance enables enterprises to maintain a low amount of liquid capital and concentrate on research on emission reduction technologies, enhancing their capital productivity and technological innovation ability [42]. Therefore, Hypothesis 3 is proposed based on the preceding analysis.
Hypothesis 3 (H3).
GFPP can reduce carbon intensity through green innovation.

4. Methodology

4.1. Model Building

The SCM was first proposed by Abadie and Gardeazabal [43], and has recently been used to evaluate the carbon reduction effect of low-carbon policies [44,45]. Compared to other policy evaluation methods, the SCM has clear advantages in identifying the policy effects. First, the SCM adopts a transparent data-driven procedure for creating a counterfactual group, which effectively solves the endogeneity problem. Second, the effect of implementing the policy can be demonstrated by comparing the differences between the treatment and synthetic counterfactual groups.
Import the relevant data of the N + 1 city in the time t ϵ 1 , T , assuming that there is only one city ( i = 1 ) designated as a pilot city of the GFPP at the time T 0 , this city is defined as the treatment group. The other cities comprise the control group. Y i t represents the real carbon intensity observed by city i at time t . Y i t N represents the indicator observation value of city i i = 1 , , N + 1 at time t when the GFPP is not implemented. Y i t I represents the indicator observation value of city i i = 1 , , N + 1 at time t when the GFPP is implemented, and we formulate the following model:
Y i t = Y i t N + α i t D i t
D i t is the dummy variable. If city i is designated as a pilot city at time t , D i t = 1 ; otherwise, D i t = 0 . For all i , the carbon intensity in this city is not affected by the GFPP during t ϵ 1 , T 0 , that is, Y i t = Y i t N = Y i t I . When i = 1 and t > T 0 , α 1 t = Y 1 t Y i t N = Y i t I Y i t N , indicating a treatment effect in the analysis. Y 1 t N is a counterfactual indicator that cannot be observed. To estimate the Y 1 t N of the pilot cities when the GFPP is not implemented, this study used the factor model proposed by Abadie and Gardeazabal [43].
Y 1 t N = δ t + θ t Z i + λ t μ i + ε i t
δ t is the time fixed effect, Z i is a group of predictor variables, θ t is the unknown vector of parameters, μ i is an unobservable individual fixed effect, λ t is the unobservable vector of the public factor, and ε i t is an error term, E ε i t = 0 . Assuming a K × 1 dimensional vector weights W = w 2 , w 3 , , w j + 1 , satisfied w j 0 and w 2 + w 3 + + w j + 1 = 1 . Thus, the outcome variable of the synthetic control group can be formulated as follows:
j = 2 N + 1 w j Y j t = δ t + θ t j = 2 N + 1 w j Z j + λ t j = 2 N + 1 w j μ j + j = 2 N + 1 w j ε i t
Suppose there is a weight vector group W * = w 2 * , , w N + 1 * , the following can be formulated:
j = 2 N + 1 w j * Y j 1 = Y 11 , j = 2 N + 1 w j * Y j 2 = Y 12 , , j = 2 N + 1 w j * Y j T 0 = Y 1 T 0 , j = 2 N + 1 w j * Z j = Z 1
If t = 1 T 0 λ t λ t is non-singular, then
Y 1 t N j = 2 N + 1 W t * Y j t = j = 2 N + 1 W t * s = 1 T 0 λ t n = 1 T 0 λ n λ n 1 λ s ε j s ε 1 s j = 2 N + 1 W t * ε j t ε 1 t
Abadie et al. [46] demonstrated that the right side of the mean general formula converges to zero, that is, Formula (4) approaches zero. We use j = 2 N + 1 w j * Y j t as the unbiased estimation of Y 1 t N . Therefore, the estimator of the policy treatment effect is as follows:
α ^ 1 t = g a p ^ 1 t = Y 1 t j = 2 N + 1 w j * Y j t
We can define X 1 = Z 1 , Y 1 1 , , Y 1 m as a feature vector before implementing GFPP. X 0 is a matrix that combines the feature vectors of all non-pilot cities before implementing GFPP. V is a symmetric positive semidefinite matrix that can be obtained using a data-driven approach. By minimizing the distance function ( X 1 X 0 W ) V X 1 X 0 W , we can obtain the solution of W * , and then the processing effect estimator α ^ 1 t can be determined.
By calculating the Root Mean Square Prediction Error (RMSPE), we can evaluate the difference between the real and synthetic carbon intensities. Before implementing GFPP, if RMSPE is close to zero, it indicates that the synthetic carbon intensity Y 1 t N is reliable:
R M S P E = 1 T 0 1 + 1 t = 1 T 0 Y 1 t Y 1 t N 2 1 2 = 1 m t = 1 T 0 g a p ^ 1 t 2 1 2

4.2. Data and Variable Description

Depending on the first batch of “China’s green finance reform and innovation pilot scheme” issued in June 2017, Guangzhou, Huzhou, Quzhou, Guiyang, and Nanchang are designated as the treatment groups. This study uses Guiyang and Nanchang to represent the Guian New Area (consisting of Guiyang and Anshun) and Ganjiang New Area (consisting of Nanchang and Jiujiang), respectively. And Karamay, Changji, and Hami are excluded due to data availability.
Carbon intensity is the outcome variable, which is the ratio of carbon emissions to real gross domestic product (GDP) (at 2000 constant prices). The data on carbon emissions are derived from the China Carbon Emission Accounting Data (CEADs). Referring to Shan et al. [47], this data is calculated using the energy supply statistics of 17 fossil fuels. Moreover, by taking the GDP of 2000 as the base period, real GDP is used to eliminate the impact of inflation. We divided nominal GDP by the GDP deflator, then we obtained the real GDP of each city. The GDP deflators are derived from the China Statistical Yearbook for each city. As the data on carbon emissions are up to 2019, the sample period used in this study is from 2008 to 2019.
Abadie et al. [46] believed that a prerequisite of the SCM is that the control group should not interfere with similar policies after implementing the policy. After implementing the GFPP, many Chinese cities issued local green finance policies to follow it, thus we excluded cities that issued local green finance policies from the control group during the period of implementing GFPP (i.e., 2017–2019). The data on these local green finance policies were hand-collected and arranged based on the announcements obtained from the local government’s official website. Finally, the control group contains 62 cities, and the list of cities in the control group is presented in Table A1 (Appendix A).
As illustrated in Figure 2, the treatment and control groups exhibit a declining trend in average carbon intensity. Before implementing the GFPP, the decline rate of emission intensity in the treatment group was slower than that of the control group. However, the trends rapidly shift after implementing the GFPP, the decline rate of emission intensity in the treatment group is markedly faster than that of the control group.
According to existing literature, the carbon intensity of cities is influenced by economic level, industrial structure, urbanization level, population size, and market development. Therefore, the predictor variables are selected from five dimensions as follows. In terms of economic level [48], there is real GDP per capita (PGDP). In terms of economic structure [49], there is a proportion of secondary industry (ES). In terms of urbanization level [50], there is urbanization rate (UB); In term of population size [51], there is urban population density (POP); In term of market development [52,53,54,55,56], there are industrial enterprise structure (IE), service industry level (SI), fiscal dependence (FS) and opening level (OP). Additionally, the pre-intervention carbon intensity for five years in the period 2008-2016 is designed as predictor variables. The data on these predictor variables are derived from the China City Statistical Yearbook and the China Statistical Yearbook for each city.
The mechanism variables are selected as follows. (1) financial agglomeration is measured by the ratio of the year-end loan balances of financial institutions to GDP [57]; (2) green innovation is measured by the number of green invention patents granted per 10,000 individuals [58]. The data are derived from the China City Statistical Yearbook and Chinese Research Data Services Platform (CNRDS). The details of all variables are shown in Table 2.

5. Empirical Results

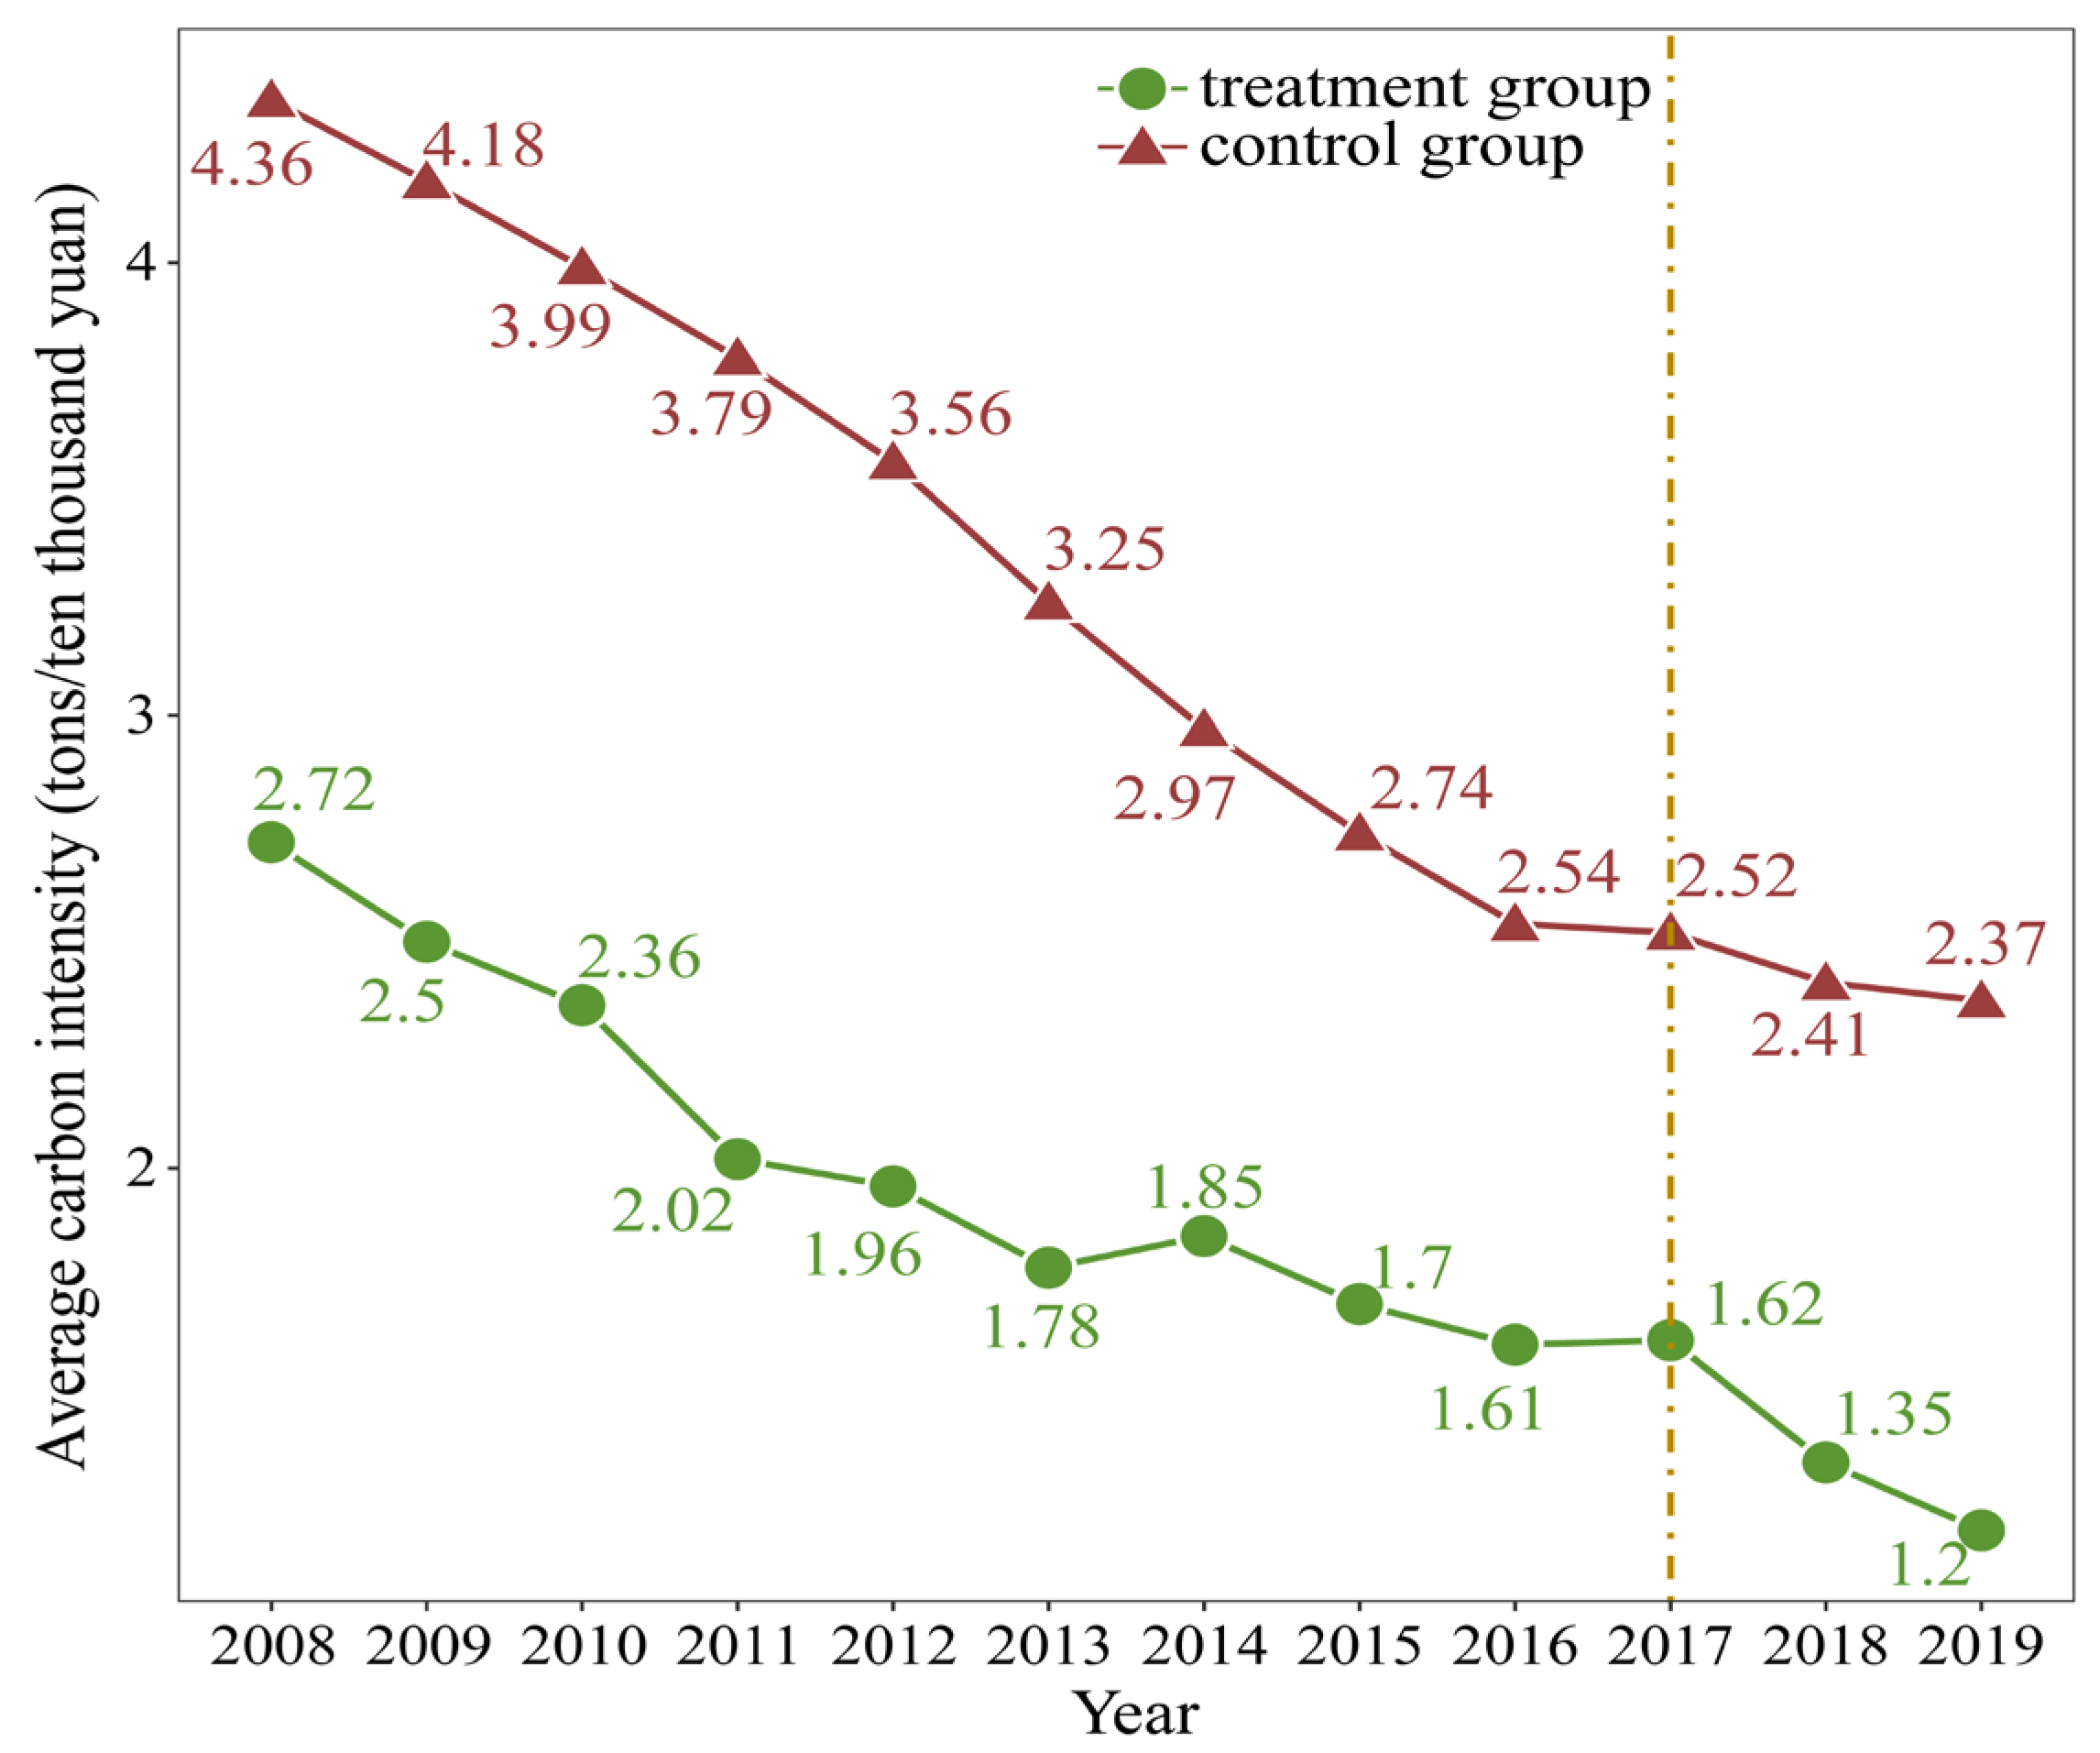
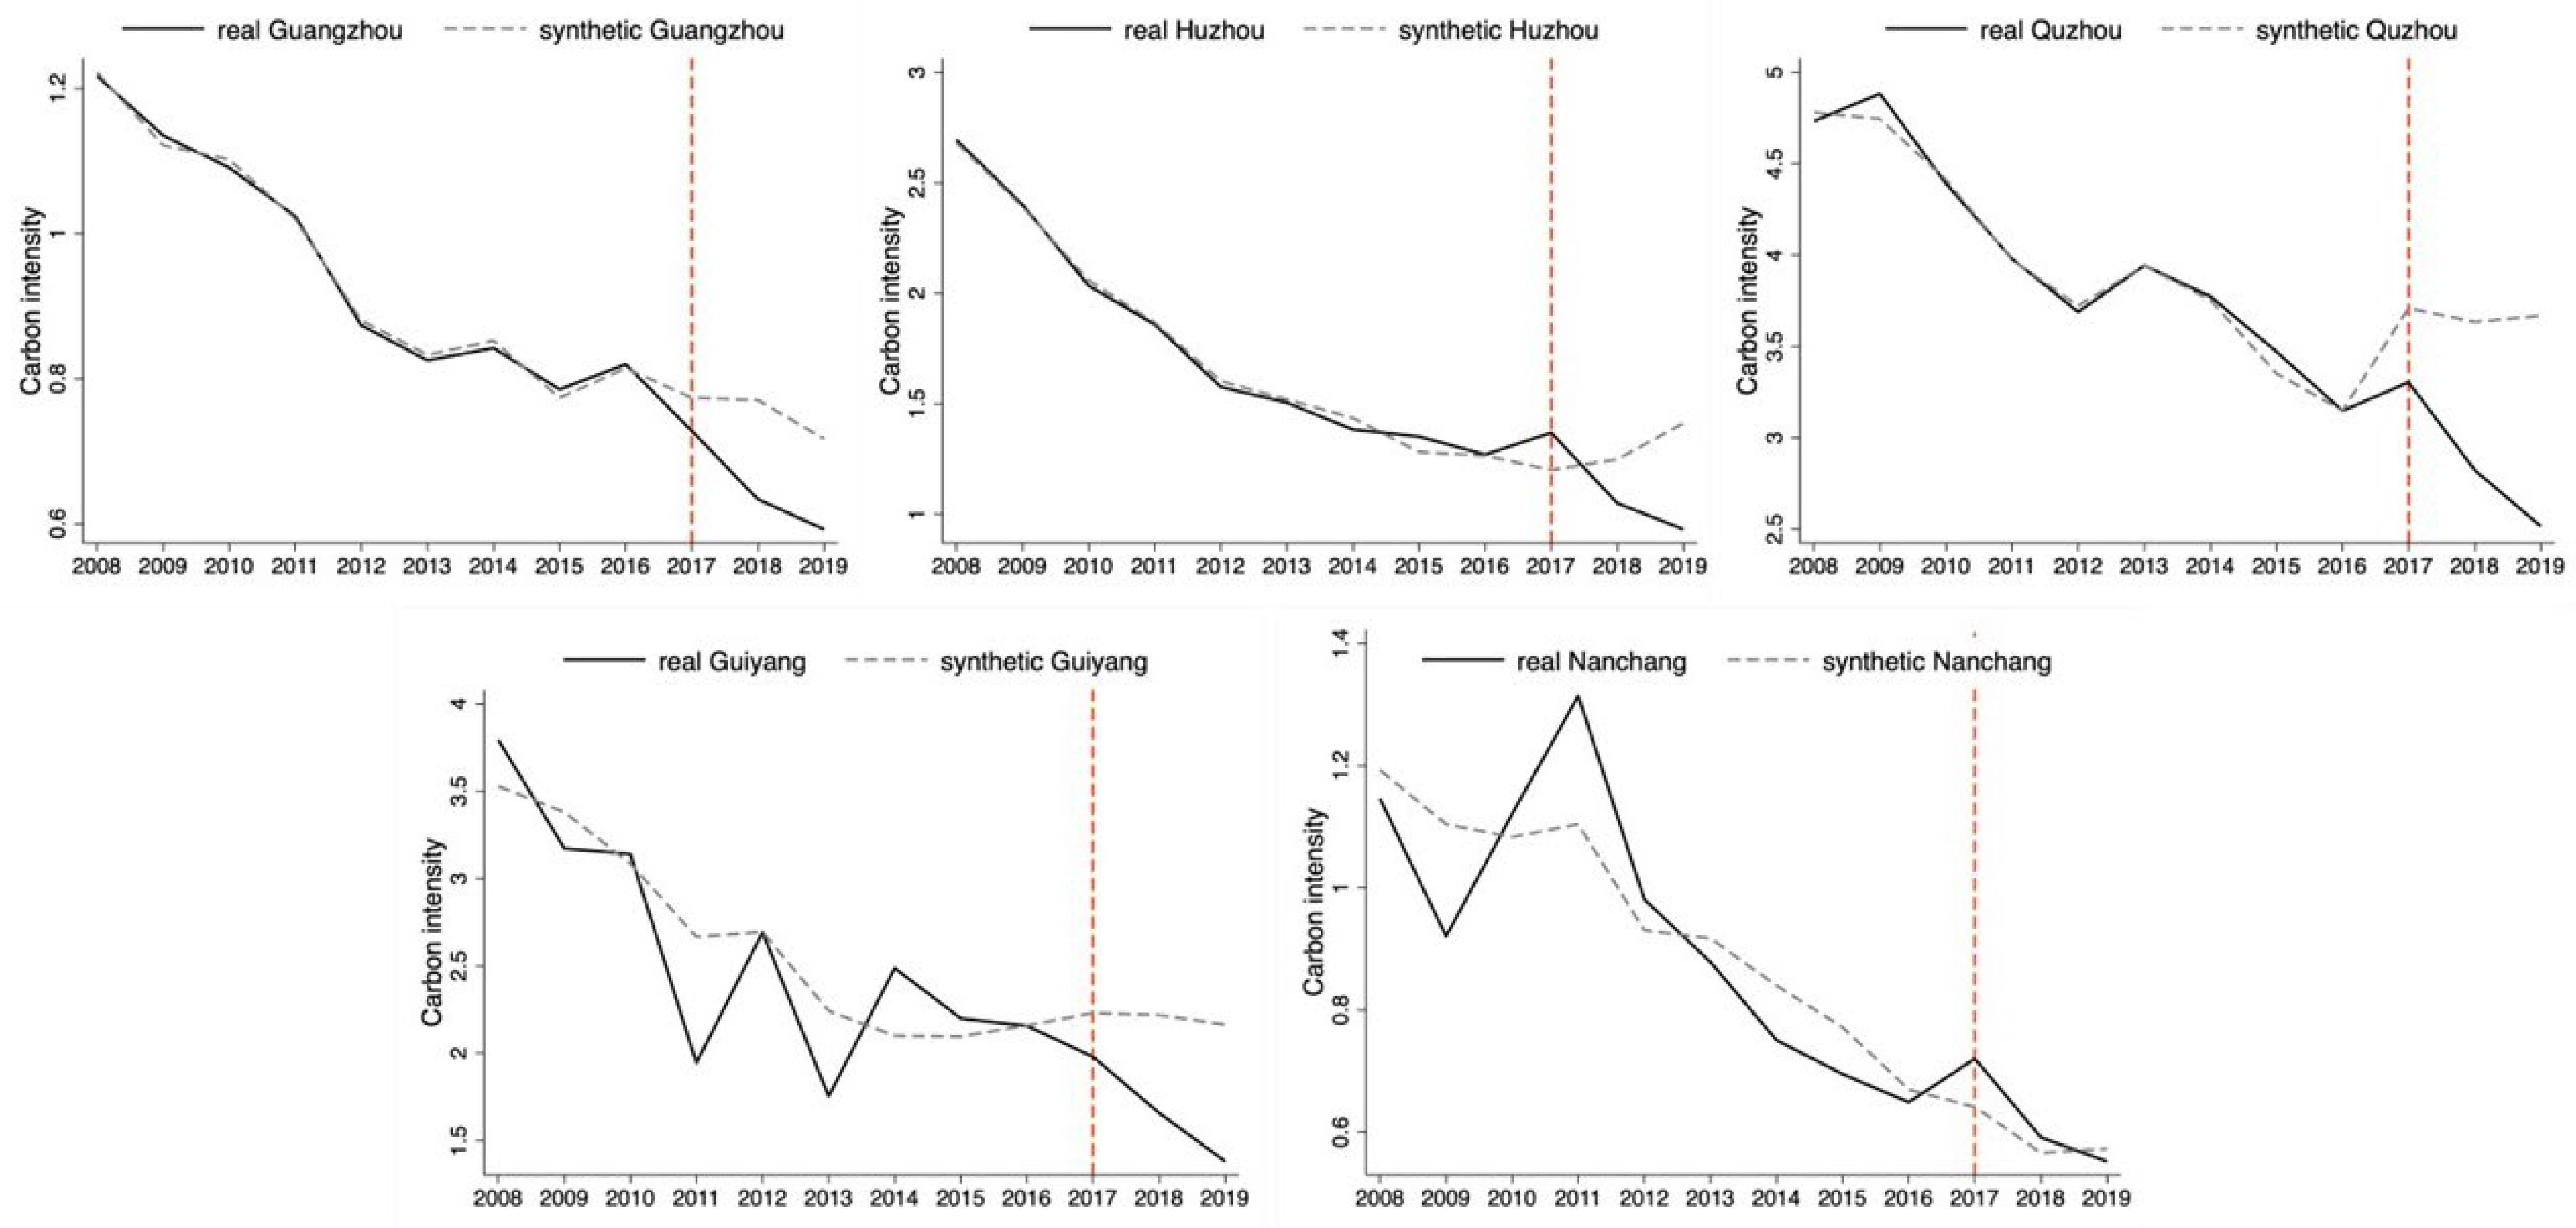
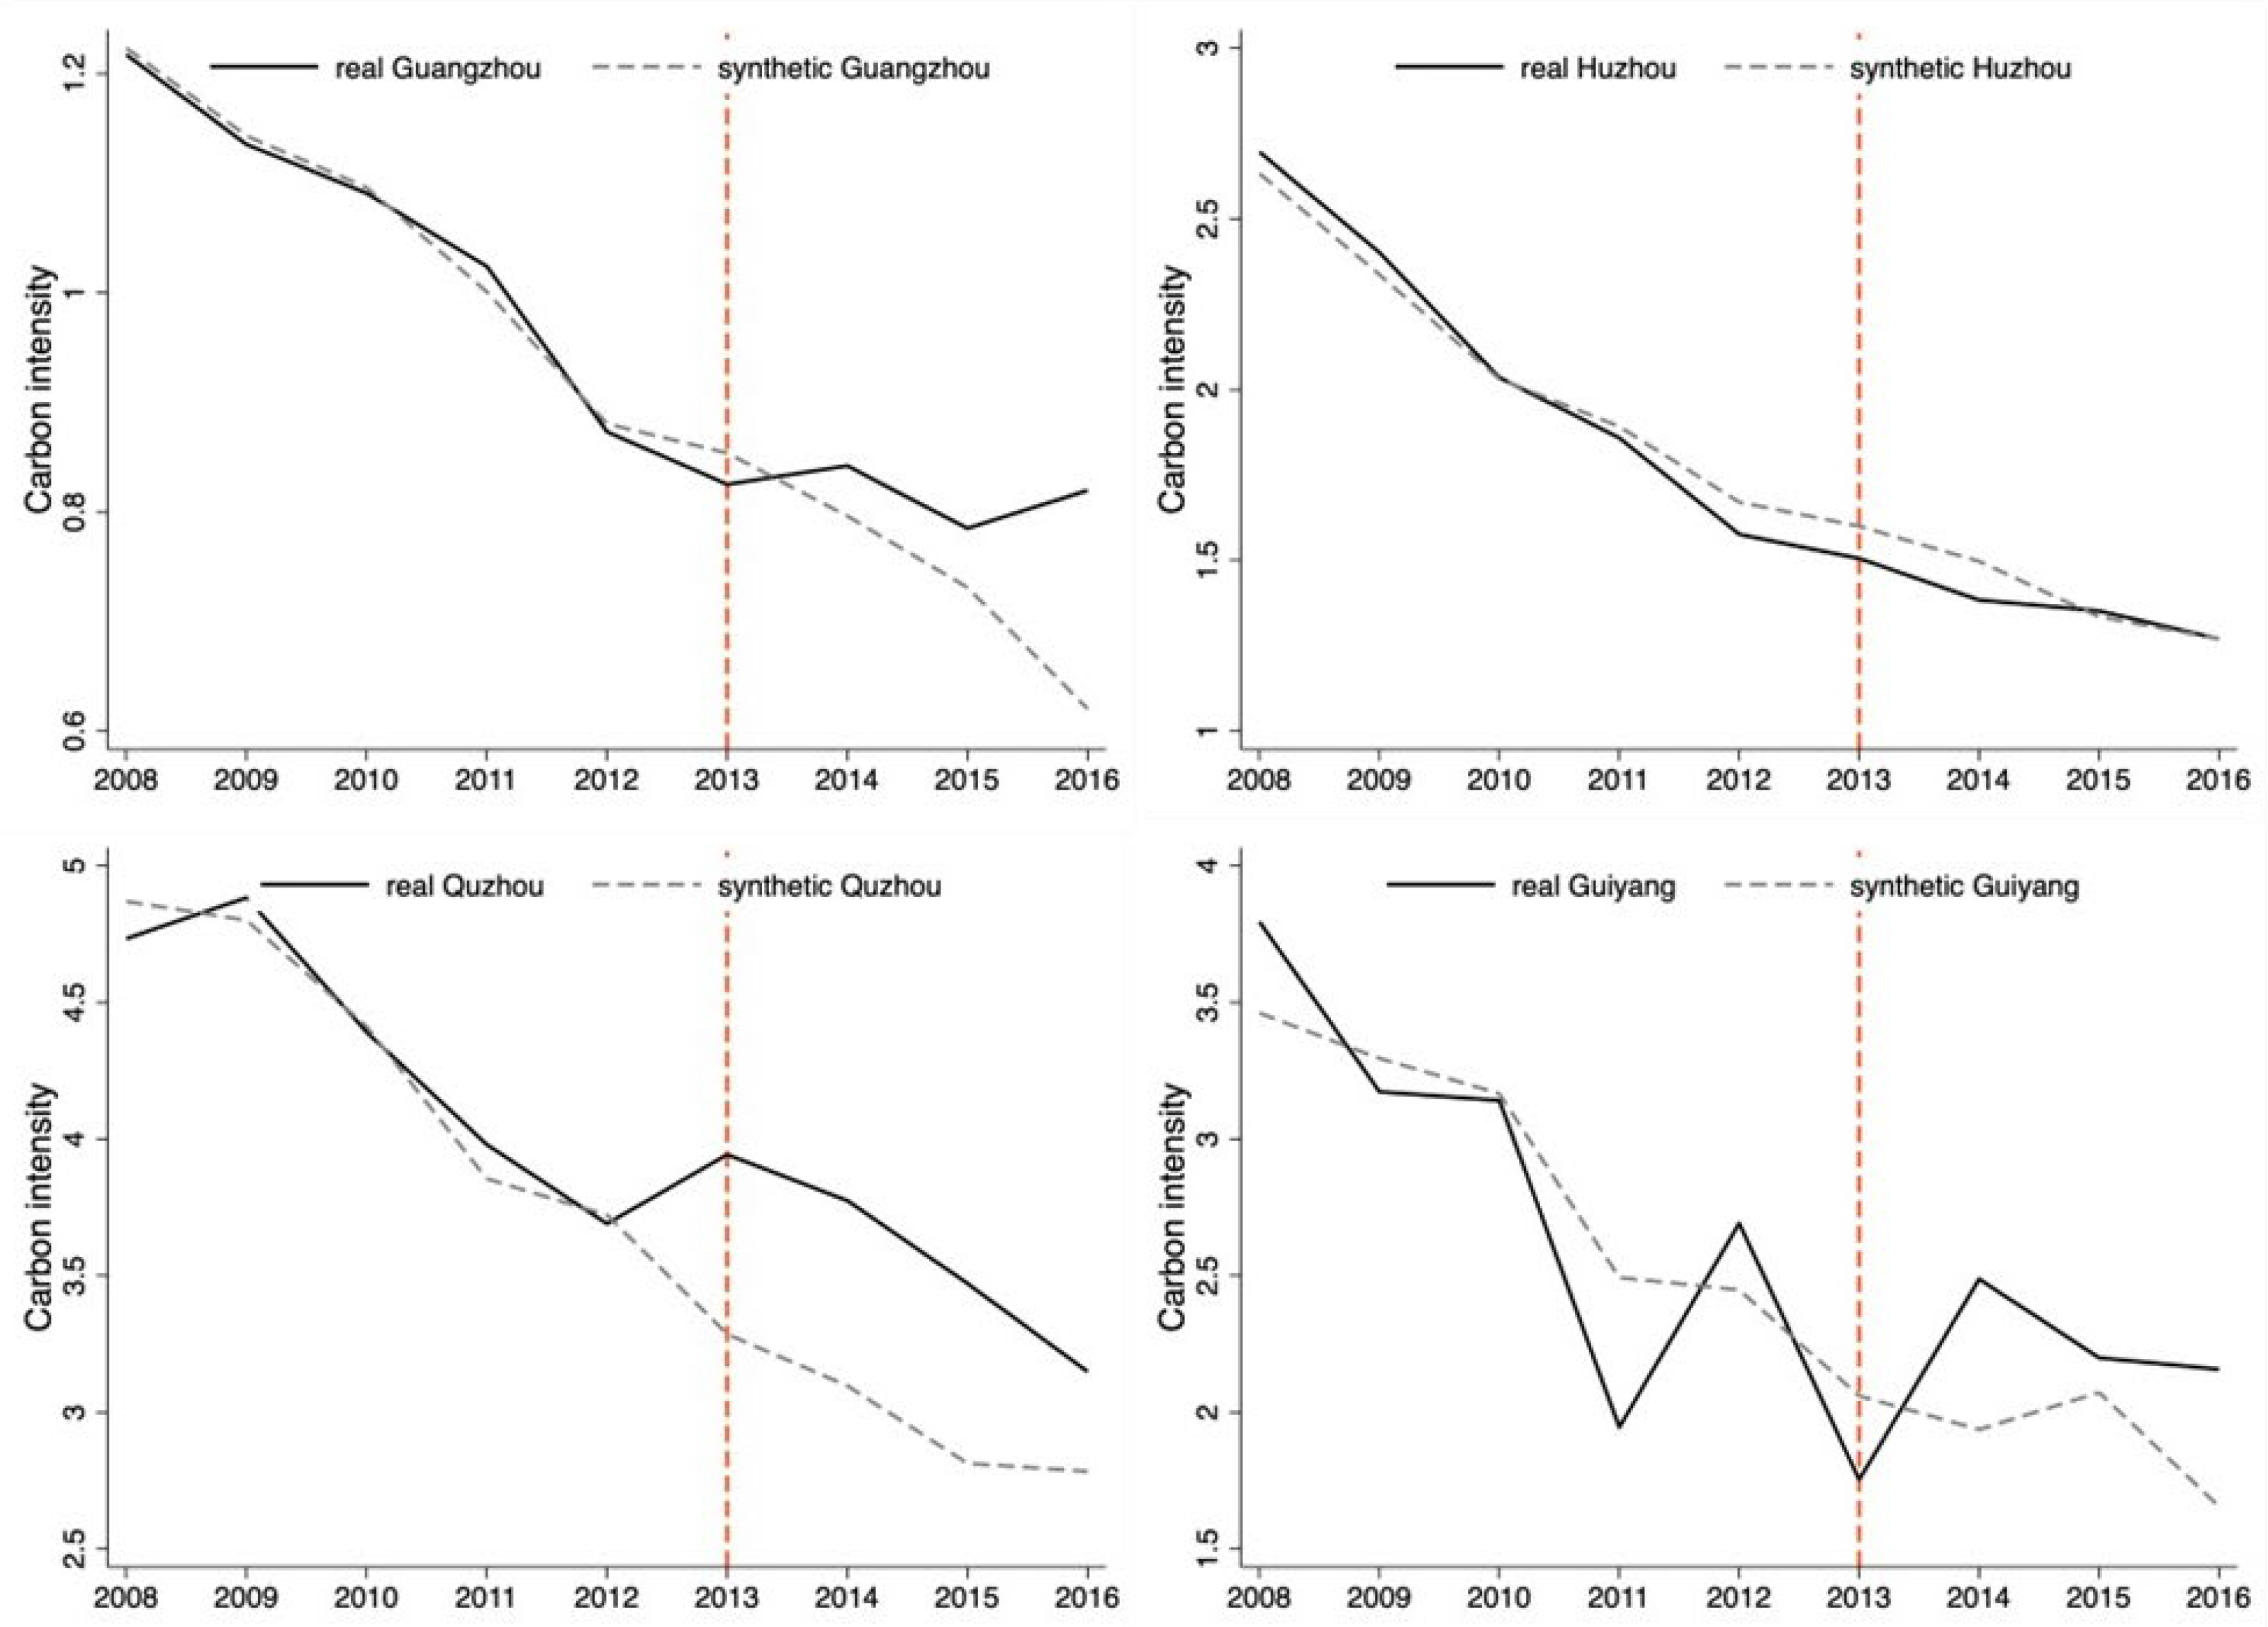
5.1. The Impact of GFPP on Carbon Intensity

Differing from the previous studies that evaluate the policy effects of all pilot cities in their entirety, we construct a corresponding synthetic control group for pilot cities that reflects the policy effect of GFPP in a single pilot city. As illustrated in Table 3, most of the synthetic values of predictors are close to the real values of predictors, indicating that synthetic control groups can effectively simulate the real values of pilot cities before implementing GFPP.
Figure 3 shows the paths of carbon intensity between real and synthetic pilot cities. The vertical dashed line represents the year when each pilot city takes to implement GFPP. The solid black and dashed gray lines represent the real and synthetic carbon intensities from 2008 to 2019, respectively. As shown in Figure 3, the solid and dashed lines of Guangzhou, Huzhou, and Quzhou almost overlap before implementing GFPP, indicating that the synthetic control group can effectively simulate the real carbon intensity of these pilot cities. However, the solid and dashed lines of Guiyang and Nanchang exhibit significant differences before implementing GFPP, indicating that the simulation results of corresponding synthetic control groups are undesirable.
For a few years after implementing GFPP, the solid lines of Guangzhou, Huzhou, Quzhou, and Guiyang were remarkably lower than the corresponding dashed line. This indicates that implementing GFPP leads to a significant decrease in carbon intensity in Guangzhou, Huzhou, Quzhou, and Guiyang. However, the solid line of Nanchang is higher than the dashed line, indicating that the performance of GFPP does not achieve the desired effect in Nanchang. As a result, we conclude that the GFPP leads to a remarkable reduction in carbon intensity in Guangzhou, Huzhou, Quzhou, and Guiyang, but not in Nanchang.

5.2. Validity Test

According to Abadie et al. [49], we used a ranking method to test the significance of the carbon intensity reduction effect in Guangzhou, Huzhou, Quzhou, and Guiyang. The basic idea of this test is as follows: a non-pilot city in the control group is assumed to as a pilot city, and a placebo test is conducted using the SCM. After conducting the placebo test on all non-pilot cities in the control group, we can compare the differences between the treatment effect and placebo effect. If the placebo effect is smaller than the treatment effect or their signs (positive or negative) are opposite, indicating the policy effect of GFPP is significant. If the fitting effect of the synthetic control unit is not good before implementing GFPP, it will show a large pre-RMSPE, where pre-RMSPE represent the value of RMSPE before the implementing GFPP. This indicating the placebo effect is unreliable, therefore, this study excluded control cities whose pre-RMSPE is more than twice that of the treatment group according to Olper et al. [59].
Figure 4 presents the result of the validity test. The solid orange line represents the treatment effect of pilot cities (i.e., the difference between the real and synthetic carbon intensity of pilot cities). The dashed gray line represents the placebo effect of cities in the control group (i.e., the difference between the real and synthetic carbon intensity of cities in the control group). As illustrated in Figure 4, suppose that a control unit is randomly selected for estimation, the probability that the placebo effect of the control unit is no less than the treatment effect of Quzhou is 1/37 (2.70%), indicating that the GFPP significantly impacts the reduction in carbon intensity in Quzhou at the 5% level. Similarly, the probabilities that the placebo effect of the control unit is no less than the treatment effect of Guangzhou, Huzhou, and Guiyang are 0/1(0%), 1/22(4.55%), and 6/52(11.54%), respectively. Therefore, the GFPP significantly impacts the reduction in the carbon intensity of Guangzhou and Huzhou at the 1% and 5% levels, respectively. However, Guiyang does not pass the significance test at the 10% level.
By conducting the validity test, we find that the carbon intensity reduction of the GFPP has regional heterogeneity. GFPP significantly affects the decline in carbon intensity in Guangzhou, Huzhou, and Quzhou. However, implementing GFPP in Nanchang and Guiyang does not achieve a significant carbon intensity reduction effect. Therefore, this conclusion partially confirms Hypothesis 1.

5.3. Robustness Test

5.3.1. In-Time Placebo Test

To ensure the credibility of the preceding conclusions, we conducted the “in-time placebo test” according to Abadie et al. [60]. Specifically, this study sets policy shock times to 2013, then we reran the SCM using the same sample of cities in the control group. Figure 5 presents the results of the “in-time placebo test”. For 2008–2016, the solid black and dashed gray lines represent the real and synthetic carbon intensities, respectively. The vertical dashed line represents the time for implementing GFPP. After implementing the GFPP, the solid line is higher than the dashed line, indicating that the assumption of implementing the GFPP in 2013 does not lead to a reduction in carbon intensity. Therefore, we believe that implementing the GFPP in 2017 has a significant impact on carbon intensity, rather than any other unexpected factor.

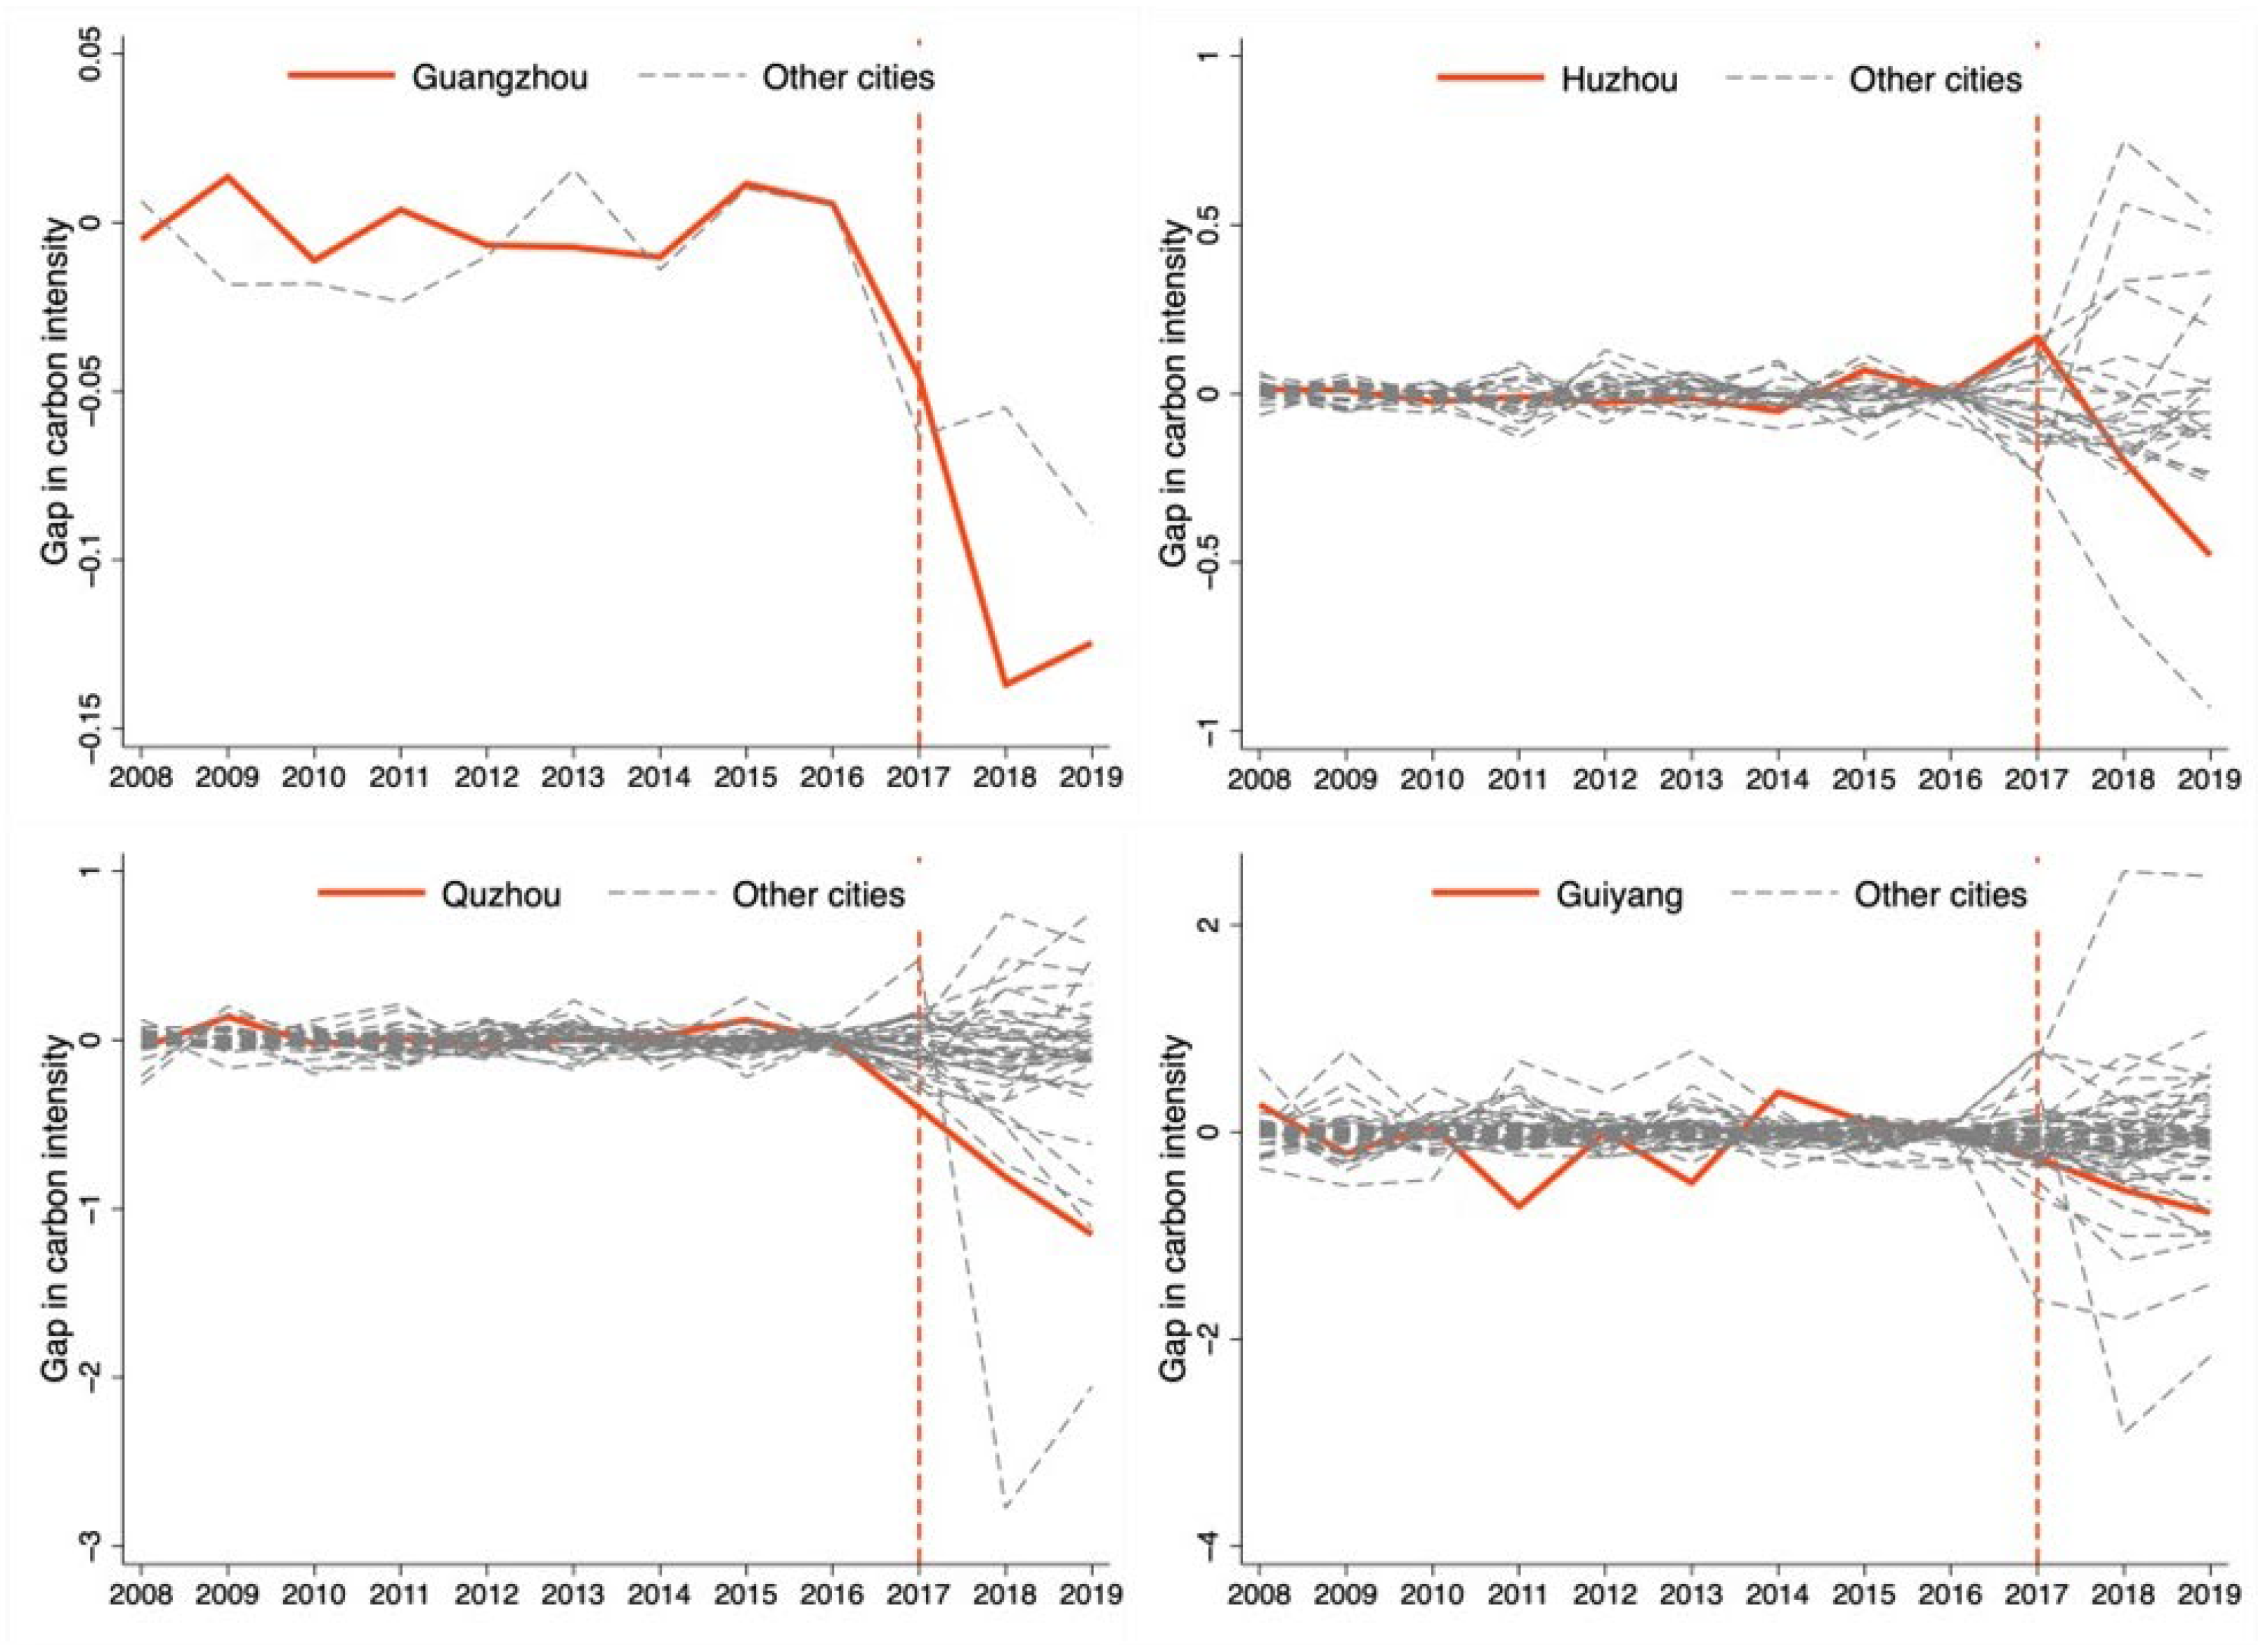
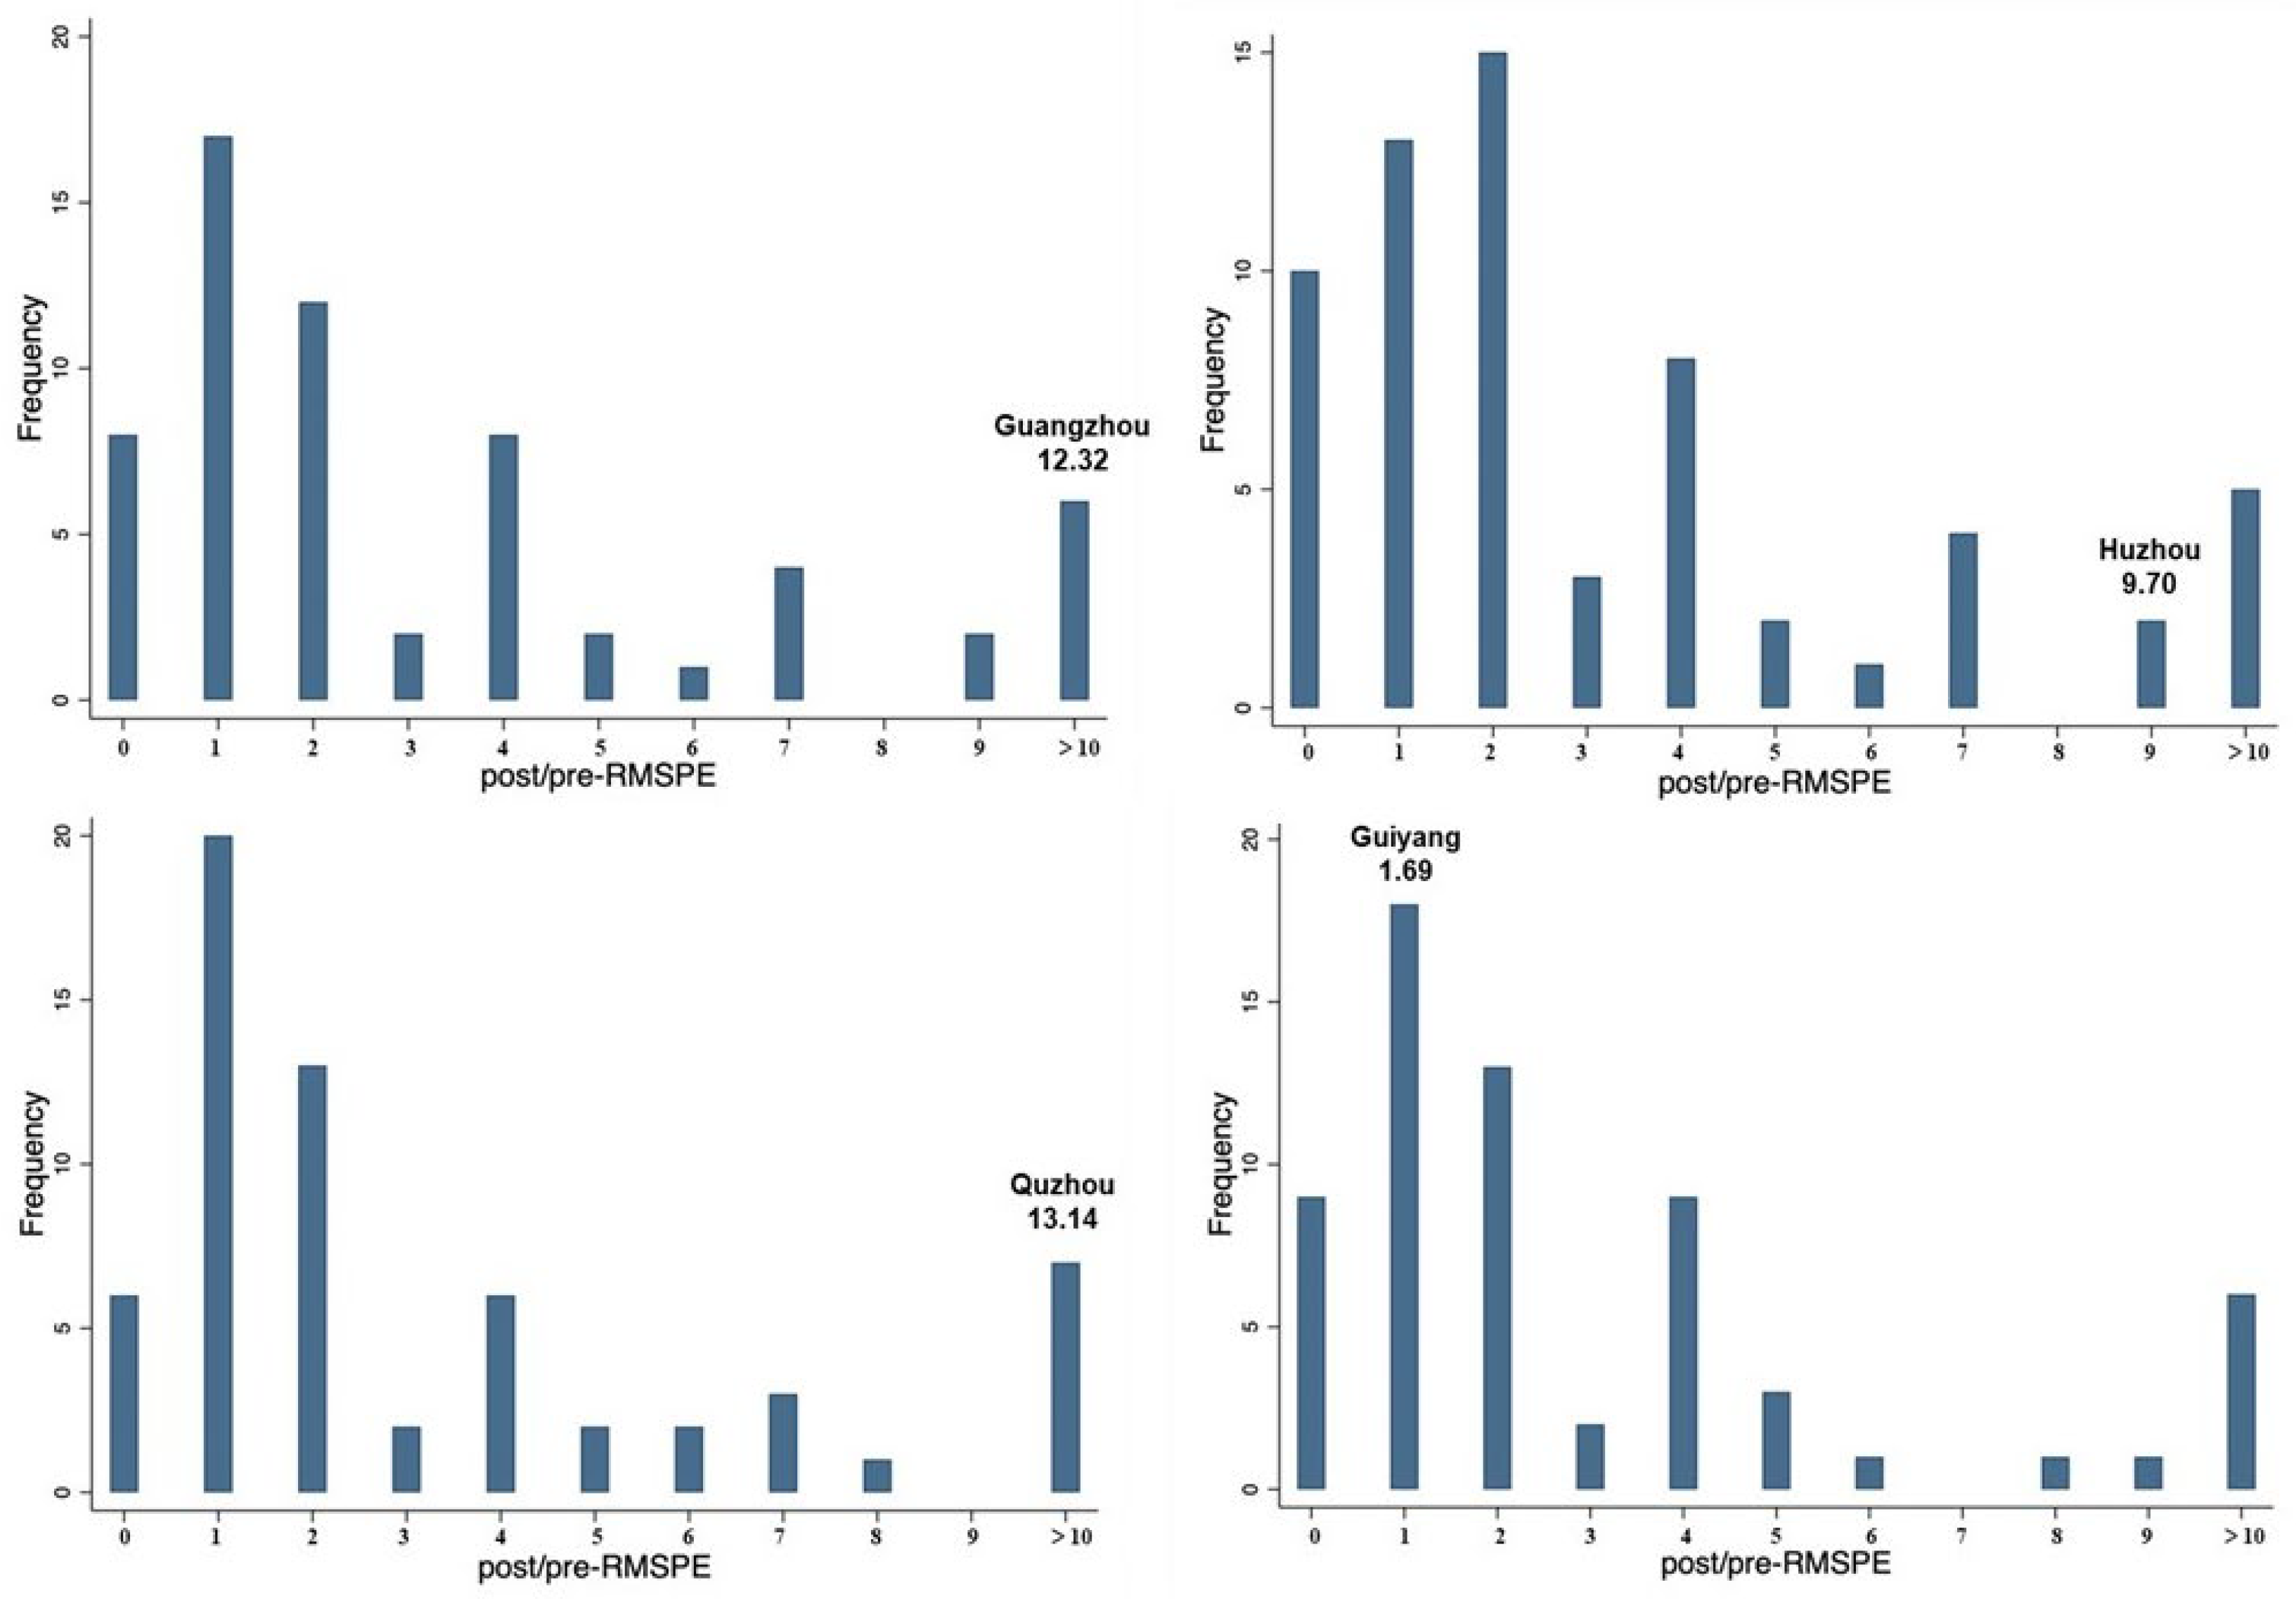
5.3.2. Compare the Ratios of the Post-RMSPE to Pre-RMSPE

Further, we define ratio = post-RMSPE/pre-RMSPE, where pre-RMSPE and post-RMSPE represent the values of RMSPE before and after implementing the GFPP, respectively. If this ratio of the treatment group is larger than that of cities in the control group, it indicates that the GFPP significantly impacts carbon intensity for pilot cities. As illustrated in Figure 6, the ratio of the post-RMSPE to pre-RMSPE for Guangzhou is 12.32, much higher than most of the control cities. If a city is randomly chosen as a pilot city, the probability that the policy effect of this control unit is not less than that of the treatment group is 3/62 (4.84%). Similarly, the ratios of the post-RMSPE to pre-RMSPE for Huzhou, Quzhou, and Guiyang are 9.70, 13.14, and 1.69, respectively, if a city is randomly designated as a pilot city, the probabilities that the policy effect of the control unit is not less than that of the treatment group are 5/62 (8.06%), 4/62 (6.45%), and 38/62 (61.29%), respectively. Therefore, we conclude that the GFPP significantly affects the decline in carbon intensity in Guangzhou, Huzhou, and Quzhou at the 5%,10% and 10% level, respectively. However, Guizhou does not pass the significance test at the 10% level.

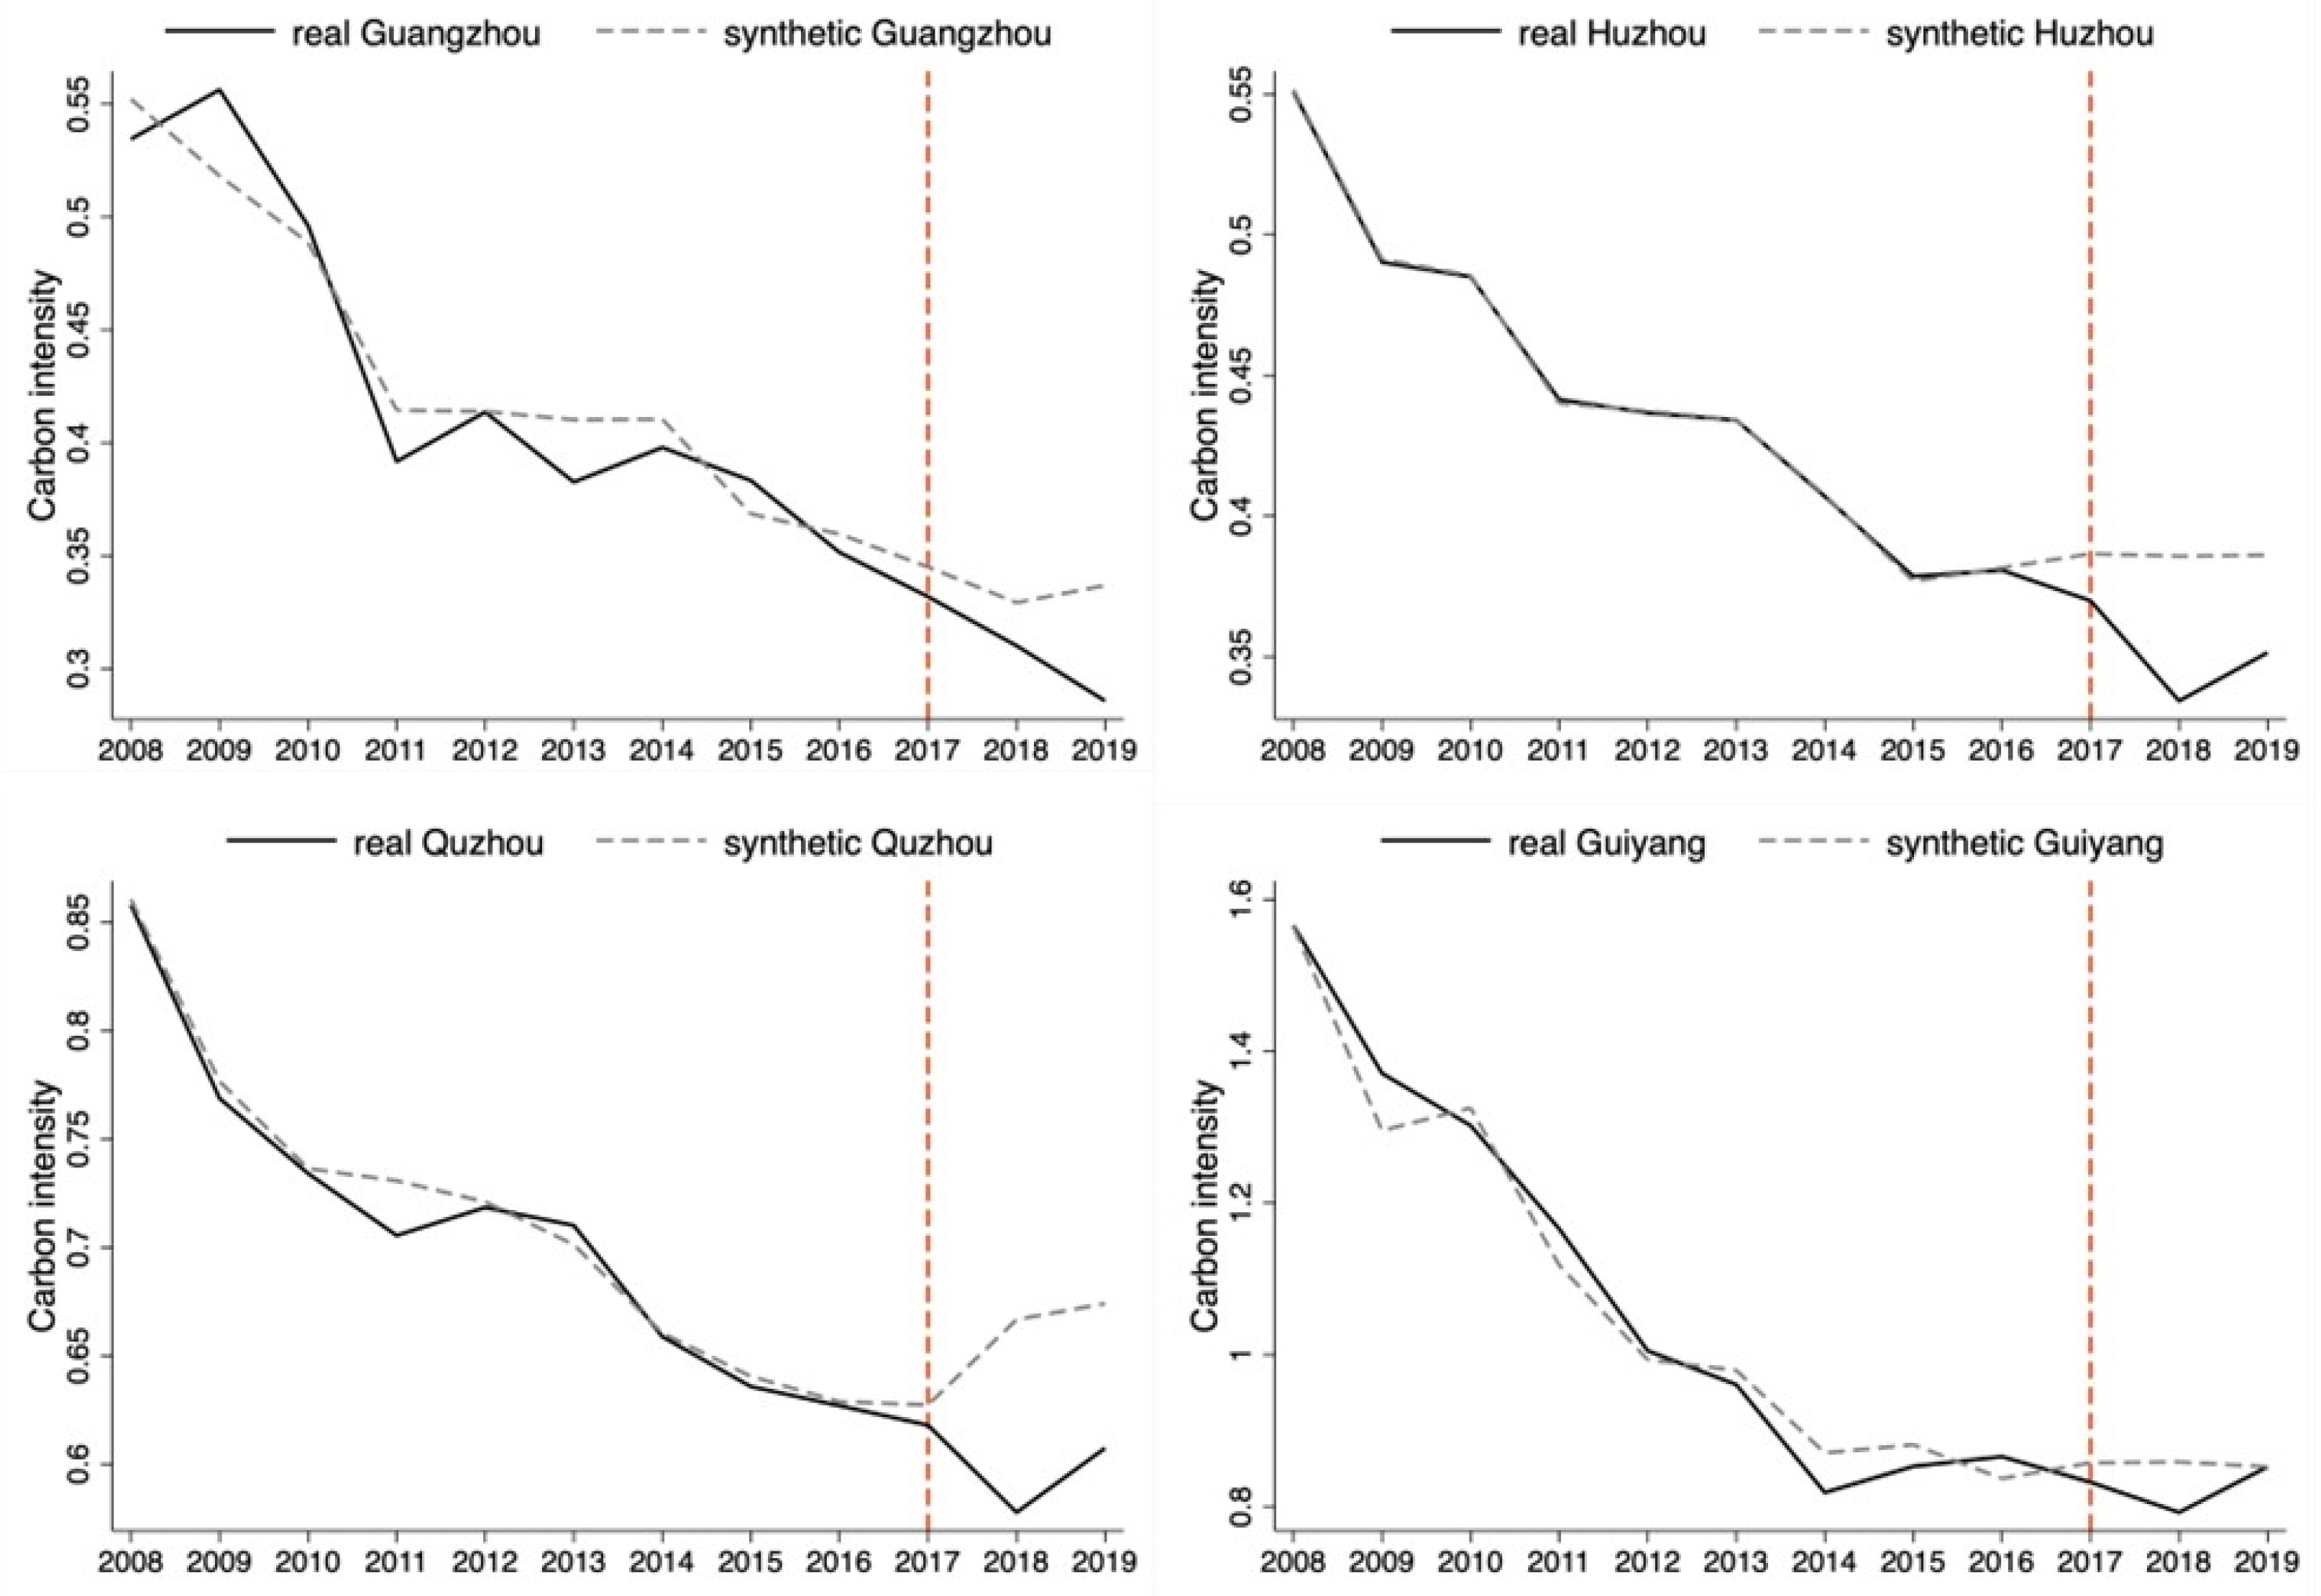
5.3.3. Replace the Carbon Intensity Calculation Method

According to Xu et al. [61], we recalculate the cities’ carbon emissions by using the consumption data of natural gas, liquefied petroleum gas, electricity, and heat. The specific is as follows:
C E i = α E n i + β E p i + γ E e i + δ E h i  
C E i represents the carbon emissions of city i . E n i , E p i , E e i , E h i , which represent the consumption of natural gas, liquefied petroleum gas, electric energy, and heat energy in city i , respectively. α , β , γ , and δ are the relevant carbon emission calculation factors provided by the Intergovernmental Panel on Climate Change (IPCC). The data on energy consumption are derived from the China Energy Statistics Yearbook and China City Statistical Yearbook. Carbon intensity is measured as the ratio of carbon emissions to real GDP (at constant 2000 prices).
As shown in Figure 7, the vertical orange line represents the year in which the GFPP was implemented. The solid black and dashed gray lines represent carbon intensity paths between real and synthetic pilot cities from 2008 to 2019, respectively. Before implementing the GFPP, the solid and dashed lines almost overlap, indicating that the synthetic control units have a good fit for the corresponding treatment group. The solid lines of Guangzhou, Huzhou, and Quzhou are lower than their dashed lines after implementing GFPP. However, the solid and dashed lines of Guiyang do not diverge gradually during the policy implementation period. Therefore, we conclude that GFPP significantly reduces carbon intensity in Guangzhou, Huzhou, and Quzhou, whereas Guiyang does not achieve a desirable reduction effect. After we replace the carbon intensity calculation method, this conclusion remains valid.

5.3.4. The SCM-DID Method

According to Arkhangelsky et al. [62], this study uses the SCM-DID method to test the robustness. This method combines the advantages of SCM and DID, avoiding the strict conditions of the DID method and effectively solving the endogeneity problem [63]. The specific is as follows. First, this study applies the SCM to calculate the weights of each pilot city. Second, we can obtain the variable values of the synthetic pilot cities by using the weights. Third, we use the DID model to assess the treatment effects by calculating the difference between real pilot cities and synthetic pilot cities. This model is formulated as follows.
C I = β 0 + β 1 d i d i t + β 2 c o n t r o l i t + μ i + λ t + ε i t
In Formula (9), CI is the explained variable that represent the value of carbon intensity of a city. d i d i t is a core explanatory variable that represents t r e a t i × p o s t t . i and t represent the city and year, respectively. The coefficient β 1 represents the policy effect of GFPP. p o s t t is a time dummy variable, if t represents 2017 and subsequent years, it equals 1; otherwise, it equals 0. t r e a t i is a group dummy variable, if i represents Guangzhou, Huzhou, Quzhou, or Guiyang, it equals 1; and the corresponding synthetic pilot cities use the value of 0. c o n t r o l i t is a vector of control variables. μ i represents the city fixed effect and λ t represents the year fixed effect. ε i t is the error term.
Table 4 presents the regression results of the SCM-DID method. First, the coefficient of d i d i t in Column (1) without considering control variables is −0.754 and is significant at the 1% level. After adding control variables, the coefficient of d i d i t in Column (2) is −0.425 and is significant at the 1% level, indicating that GFPP significantly reduces the carbon intensity of the pilot cities. After using the SCM-DID method, we can confirm that the effect of GFPP on carbon intensity reduction is robust.

5.4. Mechanism Analysis

Further, this study uses the DID model to examine the mechanism by which the GFPP promotes carbon intensity reduction. This model is formulated as follows.
M i t = β 0 + β 1 d i d i t + β 2 c o n t r o l i t + μ i + λ t + ε i t
i and t represent the city and year, respectively. M i t are mechanism variables that represent financial agglomeration and green innovation. d i d i t is a core explanatory variable that represents t r e a t i × p o s t t . t r e a t i is a dummy variable; if i represents Guangzhou, Huzhou, Quzhou, Guiyang, or Nanchang, it equals 1; otherwise, it equals 0. p o s t t is a dummy variable for the implementation of GFPP, which takes the value of 1 for the current and subsequent years (i.e., 2017–2019) and 0 for the years before GFPP implementation (i.e., 2008–2016). c o n t r o l i t is a vector of control variables. μ i and λ t represent the city and year fixed effects, respectively. ε i t is the error term.
Table 5 shows the results of testing the effects of GFPP on financial agglomeration and green innovation. First, the coefficient of d i d i t in Column (1) without considering control variables is 0.221 and is significant at the 5% level. After adding control variables, the coefficient of d i d i t in Column (2) is 0.292 and remains significant at the 1% level, indicating that the GFPP has a significant impact on promoting the level of financial agglomeration in pilot cities. The pilot cities have introduced various policy tools, such as government subsidies, risk compensation, and tax deductions [2], attracting the agglomeration of financial institutions, thus promoting green finance development and reducing carbon intensity. Therefore, this study confirms Hypothesis 2.
Second, the coefficient of d i d i t in Column (3) without control variables is 0.919 and is significantly positive at the 1% level. After adding the control variables, the coefficient of d i d i t in Column (4) is 0.749 and remains significantly positive at the 1% level, indicating that the GFPP significantly increases the green patents of pilot cities by 74.9%. Liu and Wang [64] also conclude that green patents of enterprises in pilot cities have a faster growth rate than those in non-pilot cities. The regression results show that the green innovation ability of enterprises in the pilot cities has been rapidly improved since implementing GFPP, thus decreasing carbon intensity. Therefore, this study verifies Hypothesis 3.

6. Discussion

According to the empirical analysis presented above, we conclude that the GFPP significantly reduces the carbon intensity of pilot cities in eastern China, such as Guangzhou, Huzhou, and Quzhou. However, implementing GFPP in Nanchang and Guiyang situated in central and western China does not achieve the desired reduction effect. The reasons for the preceding conclusions can be summarized as follows.
First, the pilot cities in eastern China pay more attention to attracting more financial institutions to set up green finance divisions. As is shown in Table 6, the number of green finance divisions in Huzhou and Quzhou in eastern China is much higher than that in Nanchang and Guiyang in central and west China. The pilot cities in eastern China have a higher level of economic development, the municipal government is more likely to implement diversified policy tools to reach the target of reducing carbon intensity. For instance, in Guangzhou, policy tools such as government subsidies and tax deductions are frequently used to incentivize the engagement of green enterprises and financial institutions in green finance development. Chen and Zhao [65] found that pilot cities in eastern China concentrate on the construction of digitalization systems, effectively improving the risk management level of green finance. In contrast, the pilot cities in central and western China have fewer economic incentives, which makes them difficult to attract the agglomeration of financial resources. Qu et al. [66] found that financial agglomeration significantly improves urban energy efficiency, especially in eastern China.
Second, the pilot cities are committed to developing different tasks for green innovation. For the developed eastern region, the pilot cities pay more attention to supporting the structural transformation of the local economy to reach the targets of high-quality economic development. For instance, Guangzhou strives to explore the innovation of financial products for new energy automobiles [67]. Huzhou and Quzhou focus on promoting the transformation of traditional high-polluting industries [68].
By comparison, for the underdeveloped pilot cities in central and western regions, the municipal governments put more emphasis on the development of green agriculture due to their abundant agricultural resources. As an example, Nanchang and Guiyang focus on exploring innovative green agricultural financial products, supporting agricultural projects such as organic ecological agriculture, modern urban agriculture, and agricultural sewage treatment [2]. Several studies indicated that the transformation of industrial structure significantly reduces the carbon intensity in the eastern region, but has limited contribution to the central and western regions in China [69].

7. Conclusions

7.1. Main Conclusions and Policy Recommendations

Climate change has becoming one of the most prominent global problems. As the largest carbon emitter, the Chinese government has introduced powerful green finance policies to achieve the carbon peak and neutrality goals. Considering the heterogeneity of pilot cities, this study adopts the SCM model to accurately assess the carbon intensity reduction effect of GFPP in five pilot cities based on China’s prefecture-level panel data from 2008 to 2019.
The major conclusions of this study are as follows. We find that the significantly reduces carbon intensity in pilot cities situated in eastern China, such as Guangzhou, Huzhou, and Quzhou. However, the implementation of GFPP does not have a significant effect in Nanchang and Guiyang situated in central and western China. We conduct multiple robustness tests; all of the results prove that the preceding conclusions are robust. The mechanism analysis shows that financial agglomeration and green innovation are two channels by which GFPP promotes carbon intensity reduction.
This study proposes the following policy recommendations. First, the implementation effect of GFPP in eastern China is significant; therefore, the Chinese government should continue to expand the scope of pilot cities in the eastern region to promote the transformation and upgradation of traditional industries. On the other hand, to improve the carbon intensity reduction effect of pilot cities in the central and western regions, the government can develop a communication and cooperation system to help them learn successful experiences from other pilot cities.
Second, the pilot cities should emphasize the importance of financial agglomeration and green innovation in promoting GFPP. The mechanism analyses indicate that they are key in releasing the policy effect of GFPP. The pilot cities should strengthen policy support for financial institutions, such as direct subsidies, and tax breaks, to encourage them to innovate green financial products. In addition, the pilot cities can provide subsidies to green enterprises through investment subsidies, loan discount interest, and insurance subsidies to improve their technological innovation ability.
Third, the Chinese government should take the initiative to engage in international cooperation in green finance. In many developing countries, such as Brazil and India, the development of green finance is highly policy-driven [2]. The success of GFPP is a good example of innovation-driven. Therefore, the Chinese government should take full advantage of GFPP’s successful experiences, to help other developing countries promote the development of green finance and solve climate change problems.

7.2. Limitations and Further Research

This study has some limitations that may lead to further research. First, due to data limitations, we only focus on the first batch of pilot cities for GFPP. Subsequent studies can further explore the effects in the second and third batches of pilot cities for GFPP. Second, as enterprises are the main agents in green innovation, future research can concentrate on the micro firm level, to explore the impact of the GFPP on enterprises’ environmental, social, and governance (ESG) performance. Third, more detailed data on green credit, insurance, and bonds can help us to better investigate the effects of GFPP, which is the direction of our study in the future.

Author Contributions

Conceptualization, L.F. and Z.S.; methodology, L.F.; Software, L.F.; Data curation, L.F.; Investigation, L.F. and Z.S.; Validation, L.F.; formal analysis, L.F. and Z.S.; Writing—original draft, L.F.; Writing—review & editing, L.F. and Z.S.; Supervision, Z.S.; All authors have read and agreed to the published version of the manuscript.

Funding

This research was funded by National Natural Science Foundation of China (71964035), China Postdoctoral Science Foundation (2021M702702), and Financial Innovation Center, SWUFE (NO. FIC2021C0012).

Institutional Review Board Statement

Not applicable.

Informed Consent Statement

Not applicable.

Data Availability Statement

All data that support the findings of this study are available from the corresponding author upon reasonable request.

Conflicts of Interest

The authors declare no conflict of interest.

Appendix A

Table A1. The sample of cities in the control group.
BaotouHangzhouLianyungangShangraoXiangyang
BengbuHarbinLinyiShenyangXianning
BinzhouHefeiLishuiSipingYancheng
ChangchunHohhotLiupanshuiSuqianYangquan
ChangdeHuaihuaLongyanSuzhouYantai
ChangshaHuangshiLuoyangTaiyuanYuncheng
ChangzhiJiaxingMudanjiangTaizhouZhengzhou
ChangzhouJinanNanningTangshanZhenjiang
ChifengJingmenNingboTongliaoZhoushan
DalianJingzhouPingdingshanTonglingZibo
DezhouJiningQiqiharWeihai
GanzhouJinzhongSanmenxiaWuhan
HaikouJixiShanghaiWuhu

References

  1. Intergovernmental Panel on Climate Change. Climate Change 2014: Synthesis Report: Longer Report; IPCC: Geneva, Switzerland, 2014. [Google Scholar]
  2. Shao, J.; Huang, P. The Policy Mix of Green Finance in China: An Evolutionary and Multilevel Perspective. Clim. Policy 2023, 1–15. [Google Scholar] [CrossRef]
  3. Yan, C.; Mao, Z.; Ho, K.C. Effect of Green Financial Reform and Innovation Pilot Zones on Corporate Investment Efficiency. Energy Econ. 2022, 113, 106185. [Google Scholar] [CrossRef]
  4. Huang, H.; Mbanyele, W.; Wang, F.; Song, M.; Wang, Y. Climbing the Quality Ladder of Green Innovation: Does Green Finance Matter? Technol. Forecast Soc. Chang. 2022, 184, 122007. [Google Scholar] [CrossRef]
  5. Irfan, M.; Razzaq, A.; Sharif, A.; Yang, X. Influence Mechanism between Green Finance and Green Innovation: Exploring Regional Policy Intervention Effects in China. Technol. Forecast Soc. Chang. 2022, 182, 121882. [Google Scholar] [CrossRef]
  6. Zhang, W.; Dong, J. The Polarization Effect and Mechanism of China’s Green Finance Policy on Green Technology Innovation. Sustainability 2023, 15, 10114. [Google Scholar] [CrossRef]
  7. Wang, Y.; Zhao, N.; Lei, X.; Long, R. Green Finance Innovation and Regional Green Development. Sustainability 2021, 13, 8230. [Google Scholar] [CrossRef]
  8. Zhang, H.; Wang, Y.; Li, R.; Si, H.; Liu, W. Can Green Finance Promote Urban Green Development? Evidence from Green Finance Reform and Innovation Pilot Zone in China. Environ. Sci. Pollut. Res 2023, 30, 12041–12058. [Google Scholar] [CrossRef]
  9. Zhang, Z.; Wang, J.; Feng, C.; Chen, X. Do Pilot Zones for Green Finance Reform and Innovation Promote Energy Savings? Evidence from China. Energy Econ. 2023, 124, 106763. [Google Scholar] [CrossRef]
  10. Cheng, Z.; Kai, Z.; Zhu, S. Does Green Finance Regulation Improve Renewable Energy Utilization? Evidence from Energy Consumption Efficiency. Renew. Energy 2023, 208, 63–75. [Google Scholar] [CrossRef]
  11. Liu, C.; Xiong, M. Green Finance Reform and Corporate Innovation: Evidence from China. Financ. Res. Lett. 2022, 48, 102993. [Google Scholar] [CrossRef]
  12. Lamperti, F.; Bosetti, V.; Roventini, A.; Tavoni, M.; Treibich, T. Three Green Financial Policies to Address Climate Risks. J. Financ. Stab. 2021, 54, 100875. [Google Scholar] [CrossRef]
  13. Kapa, M.M.J.; Nalle, A.A.; Tamelan, P.G.; Wisetsri, W. The Impact of Green Finance, Agriculture Growth and Creativity on Carbon Emissions of High Carbon Emissions Producing Countries. Int. J. Energy Econ. Policy 2022, 12, 432–440. [Google Scholar] [CrossRef]
  14. Zhang, J.; Ke, H. The Moderating Effect and Threshold Effect of Green Finance on Carbon Intensity: From the Perspective of Capital Accumulation. Complexity 2022, 2022, 4273691. [Google Scholar] [CrossRef]
  15. Du, G. Nexus between Green Finance, Renewable Energy, and Carbon Intensity in Selected Asian Countries. J. Clean. Prod. 2023, 405, 136822. [Google Scholar] [CrossRef]
  16. Li, W.; Fan, Y. Influence of Green Finance on Carbon Emission Intensity: Empirical Evidence from China Based on Spatial Metrology. Environ. Sci. Pollut. Res. 2023, 30, 20310–20326. [Google Scholar] [CrossRef]
  17. Wang, F.; Cai, W.; Elahi, E. Do Green Finance and Environmental Regulation Play a Crucial Role in the Reduction of CO2 Emissions? An Empirical Analysis of 126 Chinese Cities. Sustainability 2021, 13, 13014. [Google Scholar] [CrossRef]
  18. Zhang, A.; Deng, R.; Wu, Y. Does the Green Credit Policy Reduce the Carbon Emission Intensity of Heavily Polluting Industries? —Evidence from China’s Industrial Sectors. J. Environ. Manag. 2022, 311, 114815. [Google Scholar] [CrossRef]
  19. Xu, P.; Ye, P.; Jahanger, A.; Huang, S.; Zhao, F. Can Green Credit Policy Reduce Corporate Carbon Emission Intensity: Evidence from China’s Listed Firms. Corp. Soc. Responsib. Environ. Manag. 2023. [Google Scholar] [CrossRef]
  20. Xu, X.; Li, J. Can Green Bonds Reduce the Carbon Emissions of Cities in China? Econ. Lett. 2023, 226, 111099. [Google Scholar] [CrossRef]
  21. Huang, J.; An, L.; Peng, W.; Guo, L. Identifying the Role of Green Financial Development Played in Carbon Intensity: Evidence from China. J. Clean. Prod. 2023, 408, 136943. [Google Scholar] [CrossRef]
  22. Lee, C.C.; Lee, C.C. How Does Green Finance Affect Green Total Factor Productivity? Evidence from China. Energy Econ. 2022, 107, 105863. [Google Scholar] [CrossRef]
  23. Yan, B.; Wang, F.; Liu, J.; Fan, W.; Chen, T.; Liu, S.; Ning, J.; Wu, C. How Financial Geo-Density Mitigates Carbon Emission Intensity: Transmission Mechanisms in Spatial Insights. J. Clean. Prod. 2022, 367, 133108. [Google Scholar] [CrossRef]
  24. Lv, C.; Bian, B.; Lee, C.C.; He, Z. Regional Gap and the Trend of Green Finance Development in China. Energy Econ. 2021, 102, 105476. [Google Scholar] [CrossRef]
  25. Yuan, H.; Zhang, T.; Hu, K.; Feng, Y.; Feng, C.; Jia, P. Influences and Transmission Mechanisms of Financial Agglomeration on Environmental Pollution. J. Environ. Manag. 2022, 303, 114136. [Google Scholar] [CrossRef]
  26. Ren, Y.; Yu, J.; Xu, S.; Tang, J.; Zhang, C. Green Finance and Industrial Low-Carbon Transition: Evidence from a Quasi-Natural Experiment in China. Sustainability 2023, 15, 4827. [Google Scholar] [CrossRef]
  27. Yu, C.H.; Wu, X.; Zhang, D.; Chen, S.; Zhao, J. Demand for Green Finance: Resolving Financing Constraints on Green Innovation in China. Energy Policy 2021, 153, 112255. [Google Scholar] [CrossRef]
  28. Shi, J.; Yu, C.; Li, Y.; Wang, T. Does Green Financial Policy Affect Debt-Financing Cost of Heavy-Polluting Enterprises? An Empirical Evidence Based on Chinese Pilot Zones for Green Finance Reform and Innovations. Technol. Forecast. Soc. Chang. 2022, 179, 121678. [Google Scholar] [CrossRef]
  29. Xu, A.; Zhu, Y.; Wang, W. Micro Green Technology Innovation Effects of Green Finance Pilot Policy—From the Perspectives of Action Points and Green Value. J. Bus. Res. 2023, 159, 113724. [Google Scholar] [CrossRef]
  30. Sun, X.; Zhang, A.; Zhu, M. Impact of Pilot Zones for Green Finance Reform and Innovations on Green Technology Innovations: Evidence from Chinese Manufacturing Corporates. Environ. Sci. Pollut. Res. 2023, 30, 43901–43913. [Google Scholar] [CrossRef]
  31. Ge, P.; Liu, T.; Huang, X. The Effects and Drivers of Green Financial Reform in Promoting Environmentally-Biased Technological Progress. J. Environ. Manag. 2023, 339, 117915. [Google Scholar] [CrossRef]
  32. Su, Z.; Guo, Q.; Lee, H.T. Green Finance Policy and Enterprise Energy Consumption Intensity: Evidence from a Quasi-Natural Experiment in China. Energy Econ. 2022, 115, 106374. [Google Scholar] [CrossRef]
  33. Yin, L.; Wu, C. Promotion Incentives and Air Pollution: From the Political Promotion Tournament to the Environment Tournament. J. Environ. Manag. 2022, 317, 115491. [Google Scholar] [CrossRef] [PubMed]
  34. Xia, S.; You, D.; Tang, Z.; Yang, B. Analysis of the Spatial Effect of Fiscal Decentralization and Environmental Decentralization on Carbon Emissions under the Pressure of Officials’ Promotion. Energies 2021, 14, 1878. [Google Scholar] [CrossRef]
  35. Lee, C.C.; Wang, F. How Does Digital Inclusive Finance Affect Carbon Intensity? Econ. Anal. Policy 2022, 75, 174–190. [Google Scholar] [CrossRef]
  36. Yu, H.; Wei, W.; Li, J.; Li, Y. The Impact of Green Digital Finance on Energy Resources and Climate Change Mitigation in Carbon Neutrality: Case of 60 Economies. Resour. Policy 2022, 79, 103116. [Google Scholar] [CrossRef]
  37. Wang, M.X.; Huang, L.; Chen, Z.M. The Impact of Green Financial Policy on the Regional Economic Development Level and AQI—Evidence from Zhejiang Province, China. Sustainability 2023, 15, 4068. [Google Scholar] [CrossRef]
  38. Tan, X.; Yan, Y.; Dong, Y. Peer Effect in Green Credit Induced Green Innovation: An Empirical Study from China’s Green Credit Guidelines. Resour. Policy 2022, 76, 102619. [Google Scholar] [CrossRef]
  39. Wang, J.; Chen, X.; Li, X.; Yu, J.; Zhong, R. The Market Reaction to Green Bond Issuance: Evidence from China. Pac. Basin Financ. J. 2020, 60, 101294. [Google Scholar] [CrossRef]
  40. Zeng, Y.; Wang, F.; Wu, J. The Impact of Green Finance on Urban Haze Pollution in China: A Technological Innovation Perspective. Energies 2022, 15, 801. [Google Scholar] [CrossRef]
  41. Roper, S.; Tapinos, E. Taking Risks in the Face of Uncertainty: An Exploratory Analysis of Green Innovation. Technol. Forecast. Soc. Chang. 2016, 112, 357–363. [Google Scholar] [CrossRef] [Green Version]
  42. Wang, C.; Nie, P.Y.; Peng, D.H.; Li, Z. hui Green Insurance Subsidy for Promoting Clean Production Innovation. J. Clean. Prod. 2017, 148, 111–117. [Google Scholar] [CrossRef]
  43. Abadie, A.; Gardeazabal, J. The economic costs of conflict: A case study of the Basque Country. Am. Econ. Rev. 2003, 93, 113–132. [Google Scholar] [CrossRef] [Green Version]
  44. Wang, X.; Huang, J.; Liu, H. Can China’s Carbon Trading Policy Help Achieve Carbon Neutrality?—A Study of Policy Effects from the Five-Sphere Integrated Plan Perspective. J. Environ. Manag. 2022, 305, 114357. [Google Scholar] [CrossRef]
  45. Xingang, Z.; Wenjie, L.; Wei, W.; Shuran, H. The Impact of Carbon Emission Trading on Green Innovation of China’s Power Industry. Environ. Impact. Assess. Rev. 2023, 99, 107040. [Google Scholar] [CrossRef]
  46. Abadie, A.; Diamond, A.; Hainmueller, A.J. Synthetic Control Methods for Comparative Case Studies: Estimating the Effect of California’s Tobacco Control Program. J. Am. Stat. Assoc. 2010, 105, 493–505. [Google Scholar] [CrossRef] [Green Version]
  47. Shan, Y.; Guan, D.; Zheng, H.; Ou, J.; Li, Y.; Meng, J.; Mi, Z.; Liu, Z.; Zhang, Q. China CO2 Emission Accounts 1997–2015. Sci. Data 2018, 5, 170201. [Google Scholar] [CrossRef] [Green Version]
  48. Sufyanullah, K.; Ahmad, K.A.; Sufyan Ali, M.A. Does Emission of Carbon Dioxide Is Impacted by Urbanization? An Empirical Study of Urbanization, Energy Consumption, Economic Growth and Carbon Emissions—Using ARDL Bound Testing Approach. Energy Policy 2022, 164, 112908. [Google Scholar] [CrossRef]
  49. Lin, B.; Wang, C. Does Industrial Relocation Affect Regional Carbon Intensity? Evidence from China’s Secondary Industry. Energy Policy 2023, 173, 113339. [Google Scholar] [CrossRef]
  50. Zhang, P.; Duan, M.; Yin, G. The Periodic Characteristics of China’s Economic Carbon Intensity Change and the Impacts of Economic Transformation. Energies 2018, 11, 961. [Google Scholar] [CrossRef] [Green Version]
  51. De Freitas, L.C.; Kaneko, S. Decomposition of CO2 Emissions Change from Energy Consumption in Brazil: Challenges and Policy Implications. Energy Policy 2011, 39, 1495–1504. [Google Scholar] [CrossRef]
  52. Xu, X.; Yang, G.; Tan, Y.; Zhuang, Q.; Tang, X.; Zhao, K.; Wang, S. Factors Influencing Industrial Carbon Emissions and Strategies for Carbon Mitigation in the Yangtze River Delta of China. J. Clean. Prod. 2017, 142, 3607–3616. [Google Scholar] [CrossRef]
  53. Su, Y.; Liu, X.; Ji, J.; Ma, X. Role of Economic Structural Change in the Peaking of China’s CO2 Emissions: An Input–Output Optimization Model. Sci. Total Environ 2021, 761, 143306. [Google Scholar] [CrossRef] [PubMed]
  54. Yuan, L.; Li, R.; He, W.; Wu, X.; Kong, Y.; Degefu, D.M.; Ramsey, T.S. Coordination of the Industrial-Ecological Economy in the Yangtze River Economic Belt, China. Front. Environ. Sci. 2022, 10, 451. [Google Scholar] [CrossRef]
  55. Wang, J.; Li, H. The Mystery of Local Fiscal Expenditure and Carbon Emission Growth in China. Environ. Sci. Pollut. Res. 2019, 26, 12335–12345. [Google Scholar] [CrossRef] [PubMed]
  56. Auffhammer, M.; Sun, W.; Wu, J.; Zheng, S. The Decomposition and Dynamics of Industrial Carbon Dioxide Emissions for 287 Chinese Cities in 1998–2009. J. Econ. Surv. 2016, 30, 460–481. [Google Scholar] [CrossRef] [Green Version]
  57. Han, Z.; Li, X.; Yan, Z.; Zhong, K. Interaction and Spatial Effects of Green Technology Innovation and Financial Agglomeration: Empirical Evidence from China under the Goal of “Double Carbon”. Front. Environ. Sci. 2022, 10, 984815. [Google Scholar] [CrossRef]
  58. Feng, Y.; Chen, Z.; Nie, C. The Effect of Broadband Infrastructure Construction on Urban Green Innovation: Evidence from a Quasi-Natural Experiment in China. Econ. Anal. Policy 2023, 77, 581–598. [Google Scholar] [CrossRef]
  59. Olper, A.; Curzi, D.; Swinnen, J. Trade Liberalization and Child Mortality: A Synthetic Control Method. World Dev. 2018, 110, 394–410. [Google Scholar] [CrossRef]
  60. Abadie, A.; Diamond, A.; Hainmueller, J. Comparative Politics and the Synthetic Control Method. Am. J. Pol. Sci. 2015, 59, 495–510. [Google Scholar] [CrossRef]
  61. Xu, L.; Yang, J.; Cheng, J.; Dong, H. How Has China’s Low-Carbon City Pilot Policy Influenced Its CO2 Abatement Costs? Analysis from the Perspective of the Shadow Price. Energy Econ. 2022, 115, 106353. [Google Scholar] [CrossRef]
  62. Arkhangelsky, D.; Athey, S.; Hirshberg, D.A.; Imbens, G.W.; Wager, S. Synthetic Difference-in-Differences. Am. Econ. Rev. 2021, 111, 4088–4118. [Google Scholar] [CrossRef]
  63. Bai, D.; Hu, J.; Irfan, M.; Hu, M. Unleashing the Impact of Ecological Civilization Pilot Policies on Green Technology Innovation: Evidence from a Novel SC-DID Model. Energy Econ. 2023, 125, 106813. [Google Scholar] [CrossRef]
  64. Liu, S.; Wang, Y. Green Innovation Effect of Pilot Zones for Green Finance Reform: Evidence of Quasi Natural Experiment. Technol. Forecast. Soc. Chang. 2023, 186, 122079. [Google Scholar] [CrossRef]
  65. Chen, H.; Zhao, X. Green Financial Risk Management Based on Intelligence Service. J. Clean. Prod. 2022, 364, 132617. [Google Scholar] [CrossRef]
  66. Qu, C.; Shao, J.; Shi, Z. Does Financial Agglomeration Promote the Increase of Energy Efficiency in China? Energy Policy 2020, 146, 111810. [Google Scholar] [CrossRef]
  67. Zhang, A.; Wang, S.; Liu, B. How to Control Air Pollution with Economic Means? Exploration of China’s Green Finance Policy. J. Clean. Prod. 2022, 353, 131664. [Google Scholar] [CrossRef]
  68. Sun, X.; Zhou, C.; Gan, Z. Green Finance Policy and ESG Performance: Evidence from Chinese Manufacturing Firms. Sustainability 2023, 15, 6781. [Google Scholar] [CrossRef]
  69. Xu, R.; Xu, B. Exploring the Effective Way of Reducing Carbon Intensity in the Heavy Industry Using a Semiparametric Econometric Approach. Energy 2022, 243, 123066. [Google Scholar] [CrossRef]
Figure 1. The theoretical analysis of GFPP on carbon intensity reduction.
Sustainability 15 11571 g001
Figure 2. Comparison of average carbon intensity trends of cities in the treatment and control groups.
Sustainability 15 11571 g002
Figure 3. Comparison of carbon intensity paths between real and synthetic pilot cities.
Sustainability 15 11571 g003
Figure 4. Annual carbon intensity gaps in pilot cities and placebo gaps in control group cities.
Sustainability 15 11571 g004
Figure 5. Placebo implementing the GFPP in 2013—comparison of carbon intensity paths between real and synthetic pilot cities.
Sustainability 15 11571 g005
Figure 6. Ratios of post-RMSPE to pre-RMSPE for pilot cities and control group cities.
Sustainability 15 11571 g006
Figure 7. Comparison of carbon intensity paths between real and synthetic pilot cities after replacing the carbon intensity calculation method.
Sustainability 15 11571 g007
Table 1. Innovative measures in pilot cities for GFPP.
Green Finance ReformInnovative Measures of Pilot Cities
Green finance
risk compensation
  • Guangzhou provides risk compensation for 20% of the loss to financial institutions that engage in green financial business.
Green finance
talent subsidies
  • The pilot cities introduce talent subsidies and preferential policies related to green finance, attracting the agglomeration of professional talents.
Green finance
infrastructure construction
  • The pilot cities build green industrial demonstration parks, attracting clusters of green enterprises.
Green finance
digital transformation
  • Huzhou establishes a green financial credit information platform, effectively reducing the transaction costs of both supply and demand.
  • Huzhou and Quzhou establish green finance data statistics regulations, including green credit, insurance and bonds.
Green enterprise and project identification standards
  • The pilot cities issue “the green enterprises and projects identification standards”, avoiding the additional identification procedures by financial institution.
Green financial institution evaluation standards
  • Huzhou and Quzhou develop “green financial institution evaluation standards”, encouraging financial institutions to innovate green financial products,
Table 2. Descriptive statistics.
VariableAbbreviationDefinitionObsMeanSDMinMax
Carbon intensityCIRatio of carbon emissions to real GDP (tons/ 10 4 yuan)8043.133.040.4225.03
Economic levelPGDPReal GDP per capita ( 10 4 yuan)8044.142.350.7712.41
Economic structureESProportion of secondary industry in the GDP (%)80447.309.4916.5174.73
Urbanization rateUBRatio of urban population to total population (%)80457.7513.5222.3289.6
Population densityPOPRatio of year-end total population to urban area (person/ km 2 )804498.04337.2045.872316.67
Fiscal dependenceFSRatio of general public budgetary expenditure to GDP8040.080.030.030.24
Industrial enterprise structureIENatural logarithm of number of industrial enterprises (pcs)8047.121.024.749.84
Service industry levelSIProportion of tertiary industry in the GDP (%)80443.379.9623.0979.23
Opening levelOPRatio of actual use of foreign direct investment to GDP8040.020.020.000.13
Financial agglomerationFIRatio of the year-end loan balances of financial institutions to GDP8041.120.700.127.45
Green innovationGIGreen invention patents granted per 10,000 individuals (pcs)8040.610.730.005.24
Table 3. Comparison of real values and synthetic values of predictors before implementing GFPP.
Predictor
Variable
GuangzhouHuzhouQuzhouGuiyangNanchang
Real ValueSynthetic ValueReal ValueSynthetic ValueReal ValueSynthetic ValueReal ValueSynthetic ValueReal ValueSynthetic Value
PGDP8.764.694.454.453.182.592.532.744.714.82
ES34.8438.3252.8648.1451.7449.3041.0840.8955.2353.09
UB84.6671.6455.0156.4046.4746.9370.4856.5268.3168.85
POP1109.1594.8449.7450.1286.3311.0466.3469.7687.2577.3
FS0.080.090.080.080.070.060.130.100.080.08
IE8.546.787.947.706.956.636.317.057.027.79
SI63.5956.4240.0640.1039.9434.8554.2747.7939.7442.37
FDI0.020.040.040.040.000.010.020.020.050.03
CI (2008)1.221.222.702.684.734.783.793.531.151.19
CI (2010)1.091.102.042.064.394.413.143.091.121.08
CI (2012)0.870.881.581.603.693.722.692.690.980.93
CI (2014)0.840.851.381.443.773.752.492.100.750.84
CI (2016)0.820.811.271.263.153.152.162.160.650.67
Table 4. Robustness testing using the SCM-DID method.
Variables(1)(2)
CICI
did−0.754 ***−0.425 ***
(0.163)(0.093)
PGDP 0.182 ***
(0.044)
ES -0.132
(0.087)
UB 0.000
(0.038)
POP 0.001
(0.002)
FS 1.426
(1.093)
IE −0.498
(0.400)
SI −0.166
(0.107)
FDI −7.546
(4.474)
_cons2.295 ***19.051
(0.020)(11.268)
Year FENoYes
City FENoYes
Observations9696
Adj. R-Square0.2070.874
Notes: *** indicates significance at 1%.
Table 5. Mechanism analysis: the effects of GFPP on financial agglomeration and green innovation.
VariablesFinancial AgglomerationGreen Innovation
(1)(2)(3)(4)
did0.221 **0.292 ***0.919 ***0.749 ***
(0.109)(0.104)(0.253)(0.197)
PGDP −0.070 *** 0.318 ***
(0.020) (0.062)
ES −0.019 ** −0.002
(0.008) (0.011)
UB 0.005 0.002
(0.004) (0.005)
POP 0.000 0.001
(0.001) (0.001)
FS −0.462 −1.238
(0.891) (1.209)
IE −0.063 0.027
(0.085) (0.095)
SI −0.014 0.000
(0.009) (0.014)
FDI −2.538** −3.228
(1.009) (2.461)
cons1.114 ***3.075 ***0.590 ***−1.074
(0.002)(0.832)(0.005)(1.038)
Year FEYesYesYesYes
City FEYesYesYesYes
Observations804804804804
Adj. R-Square0.8240.8290.7670.836
Notes: *** and ** indicate significance at 1% and 5%, respectively.
Table 6. Green finance divisions in the pilot city.
Pilot CityThe Number of Green Finance Divisions
Huzhou34 banks set up green finance division and 1 insurance company set up green insurance division.
Quzhou47 banks set up green finance division and 8 insurance companies set up green insurance division.
Guangzhou10 banks set up green finance division and 1 insurance company set up green insurance division.
Guiyang12 banks set up green finance division and 1 insurance company set up green insurance division.
Nanchang8 banks set up green finance division and 3 insurance companies set up green insurance division.
Notes: Collected from public new reports, data are up to 2019.
Disclaimer/Publisher’s Note: The statements, opinions and data contained in all publications are solely those of the individual author(s) and contributor(s) and not of MDPI and/or the editor(s). MDPI and/or the editor(s) disclaim responsibility for any injury to people or property resulting from any ideas, methods, instructions or products referred to in the content.

