Article

Numerical Analysis of Natural Ventilation on One Side of a Room with Two Different Opening Configurations

School of Architecture and Engineering, Xinjiang University, Urumqi 830047, China
*
Author to whom correspondence should be addressed.
Sustainability 2023, 15(14), 11456; https://doi.org/10.3390/su151411456
Submission received: 9 June 2023 / Revised: 14 July 2023 / Accepted: 15 July 2023 / Published: 24 July 2023
(This article belongs to the Topic Building Energy Efficiency)

Abstract

:
Single-side natural ventilation is a commonly used means of ventilation to effectively regulate the thermal environment in building interiors without any fossil energy consumption. To achieve most of the potential for the efficiency of single-side natural ventilation, research needs to be undertaken into the forces that drive single-side natural ventilation. This paper examines the single-side natural ventilation of a single vertical single opening (SSO) and a vertical double opening (SDO) in a freestanding building under wind and thermal pressure. The change in the trajectory of vortex shedding when the building is leeward as well as the frequency of vortex shedding in square buildings was investigated by large eddy simulation (LES), and computational fluid dynamics was used to analyze the difference in the air exchange rate of single-side natural ventilation of SSO and SDO in the windward and leeward conditions of the building. Both of these methods were used in conjunction with one another. According to the findings, the creation of vortices at SSO and SDO in the presence of low wind speeds reduces the ventilation effect of thermal pressure under windward circumstances. Consequently, the influence of thermal stress and wind stress ultimately cancel each other out, and this phenomenon finally disappears as the wind blowing from the outside of the structure increases. The shedding of vortices in the leeward state accomplishes a form of air supply pumping with a particular periodicity of airflow fluctuations in the lateral direction. The Strouhal number computed using the LES simulation acts in a manner consistent with the experimental findings.

1. Introduction

The requirements that must be met for the internal environment of buildings are becoming increasingly demanding as people’s living standards continue to rise [1]. With the emergence of the energy crisis, many countries continuously optimize their buildings’ airtightness [2]. This contributes to the reduction of part of the building’s overall energy consumption but also causes issues with the building’s interior air quality to some degree [3]. When finding a middle ground between high energy costs and poor internal air quality, buildings most benefit from natural ventilation [4]. Natural ventilation in buildings is typically accomplished by varying the opening and closing of doors and windows. This can help enhance the interior air quality and dilute the concentration of polluting gases that are dangerous to humans without requiring additional energy expenditure on the building’s part [5]. Furthermore, during the transitional season, natural ventilation may significantly enhance the thermal climate of the building’s interior, increasing the comfort of the people who live there [6].
Wind pressure, thermal pressure, and the interaction of wind and thermal strain are the primary forces that drive natural ventilation on a single side of a building [7]. In the vast majority of instances, the wind’s power is the determining element in terms of whether or not the inside of a building receives natural ventilation [8]. This occurs when there is a pressure differential on the windward or leeward side of the building, allowing air to flow from the outside to the interior of the structure [9]. The difference in air temperature between the interior and exterior of a structure creates a pressure gradient vertically across the walls of the building, which is one of the primary causes of natural ventilation [10]. This difference in air temperature is what is known as thermal pressure. Despite this, wind and temperature forces often work together to cause natural ventilation by driving the airflow in a coordinated fashion [11].
According to the findings of studies undertaken over the past few decades, the investigation of single-sided natural ventilation with wind or thermal pressure acting alone is a well-established field of study [12]. Studies of unilateral natural ventilation under temperature pressure, for instance, are often carried out via gas-tracing methods, numerical models, and field tests [13]. Gan et al. estimated the adequate depth of fresh air distribution in single-sided naturally ventilated rooms by employing CFD methodologies, and the study’s findings showed that the proper depth of thermal comfort was not consistent with the effective depth of air quality [14]. Researchers Favarolo et al. used CFD methods and experimental comparisons to investigate the flow coefficient of a single-sided naturally ventilated rectangular hole [15]. Their findings showed that the aperture’s flow coefficient impacted the opening’s width and the wall’s thickness [16]. In addition, thermal pressure as the only driver was reported in detail in the design of building ventilation apertures and indoor environmental studies [2].
It is far more difficult to explore wind pressure as the main driver for single-sided natural ventilation than using thermal pressure as the primary driver for single-sided natural ventilation. The ambiguity of external wind speed and direction makes it difficult to obtain correct values for practical analysis in many investigations [15,17]. At the same time, the problem of turbulence caused by external winds further exacerbates the depth of this problem [18]. In recent years, new methods and tools have made it possible to address wind pressure as the sole driver of natural ventilation on one side. Larsen proposed a new computational model by testing 159 different cases in a wind tunnel and analyzing the experimental data, which can predict the airflow through the window more conservatively [19]. A two-opening model for single-sided ventilation was investigated using wind tunnel studies by Chu et al. A semi-empirical predictive model was also utilized to determine the time-averaged pressure difference and the fluctuations in pressure generation, and the results of the predictive model were in error with the wind tunnel test results by just 13% for various wind speeds and wind directions [17]. King et al. explored the association between the air exchange rate and wind angle in single-sided natural ventilation by utilizing CFD simulations, whereas in the simulations, they observed that vortex shedding from upwind buildings supplied pulsating ventilation to the windows [20].
Actually, for single-sided natural ventilation in practice, it is almost always difficult for air pressure and temperature pressure to function separately to drive circulation. In the vast majority of cases, both air and thermal pressures function together to drive the airflow and generate natural ventilation in the building [3]. Allocca researched single-sided natural ventilation with air and thermal pressure using CFD methods. As a result of this research, an empirical model was built to forecast the ventilation flow via a single aperture [21]. The fundamental model for single-sided natural ventilation was improved by Freire et al. by employing the computation of pressure coefficients to raise the accuracy of the prediction model. This was done to enhance the model’s performance. In each of the experiments, as indicated above, primary attention was given to forecasting the ventilation capacity of single-side natural ventilation, and a considerable quantity of empirical models were created [22]. Less research has been done on the opening configurations; Wang et al. utilized CFD to investigate the distribution of heat flow profiles in the room with various actual window designs. After their findings, they compared the airflow profiles’ driving forces [23].
It is difficult to obtain reliable results for single-sided natural ventilation by conventional experiments or data analysis, as the airflow in single-sided natural ventilation is considerably impacted by turbulence fluctuations [24,25]. Applying computational fluid dynamics to natural ventilation allows the most reliable results to be obtained at the most reasonable computational cost. Additionally, the technique of computational fluid dynamics has an unanticipated impact on the study of flow field changes and airflow exchange in single-sided ventilation systems, and the visualization of the findings of numerical analysis may replicate complicated flow features [26,27]. Jiang et al. were the first to adopt a computational fluid dynamics approach to investigate single-opening, single-side natural ventilation driven by buoyancy. They validated two models in computational fluid dynamics, the Reynolds-averaged Navier–Stokes equation model and the large vortex model, with research data from full-scale experiments [28,29,30]. The results disclose that LES is more accurate than RANS in estimating airflow temperatures, velocities, and the influence of single-sided natural ventilation; however, LES demands greater computer power and has accompanying computational expenses [31]. As shown in Figure 1, in Urumqi, we investigated 16 buildings with SSO and SDO openings. Although there are design differences with the ventilation windows used in engineering applications, there is a mutual unity in terms of the ventilation mechanism and the form of airflow.
In summary, the overall analysis of the research on single-sided natural ventilation shows that most of the research focuses on predicting natural ventilation in single-sided natural ventilation with a single opening pattern. There is less detailed research on the form of the driving force of airflow in single-sided natural ventilation and the development trend of airflow. To fill this gap, the main research objectives of this study include the following four main points:
  • To analyze the consequences of natural ventilation on one side of a building equipped with SSO and SDO apertures when facing in a windward and leeward direction;
  • To investigate the primary factors contributing to air movement through the two distinct types of openings, SSO and SDO;
  • To identify the primary propelling forces of natural ventilation in unilateral natural ventilation when wind pressure, thermal pressure, and wind pressure and thermal pressure work together;
  • To investigate the frequency of vortex shedding at different external wind speeds for a leeward condition and predict the Strouhal number for a square building.
This paper aims to investigate the form of action of the driving force of airflow in single-sided natural ventilation and the development of airflow by means of numerical simulation. Specifically, this paper is divided into four parts: model building, meshing and validation, analysis and discussion of results, and conclusions. Firstly, in the modelling section, the physical airflow model in unilateral natural ventilation is introduced, including the flow equations, boundary conditions, and initial conditions of the airflow. Then, the numerical methods and algorithms required in the numerical simulation are discussed in detail in this paper. Secondly, in the section on meshing and verification, this paper describes how the physical model is transformed into a numerical model and how meshing and validation are carried out. The article details the methods and guidelines for meshing and how the accuracy and reliability of the model can be verified through numerical experiments. Then, in the Results Analysis and Discussion section, the results of the numerical simulations are presented, analyzed, and discussed. The paper explores the characteristics and patterns of airflow and the effects of different parameters on airflow. In addition, comparisons with experimental results will be made to verify the accuracy and reliability of the numerical simulations. Finally, in the conclusion section, the paper summarizes the results of the numerical simulations and gives knowledge and understanding of the form of airflow driving-force action and development in single-sided natural ventilation. In addition, the paper discusses the directions and challenges for future research. In-depth research on the form of the driving-force action of airflow and the development of airflow in unilateral natural ventilation provides a valuable reference for research in related fields.

2. Methodology

2.1. Calculation of Domain and Boundary Conditions

In this study, two independent buildings were developed as the computational models for the simulation to better and more precisely represent the airflow and development features of single-side natural ventilation when the openings are facing windward and leeward. As demonstrated in Figure 2, the dimensions of the various buildings are 3.5 m × 3 m × 3 m. Single and double openings perpendicular to the XY neutral side of the building are given on the XY side of the individual structures. A calculation domain for external airflow is presented on the exterior of the building. The design dimension of the computational domain is 18a × 6b × 13c. The resulting blockage rate is 0.93%, and according to the literature, if the blockage rate of the computational domain is not larger than 3%, the airflow may be thoroughly developed, and the computational convergence problem can be considerably optimized [4,32]. The study employed the positive temperature difference method because the thermal pressure responsible for pushing the airflow is primarily derived from the temperature difference between the air inside and outside the building. This indicates that the air temperature inside the building is higher than the air temperature outside the building. The temperature inside was fixed at 22 °C, while the temperature outside was set at 15 °C. Table 1 contains a description of the specific parameters. The external wind speed determines the magnitude of the wind pressure, while the inlet wind speed is determined using the exponential equation of the wind profile (1).
U h U g = ( h h g ) a
where U h is the wind speed at height h , U g is the wind speed at the reference height, h g is the reference height, and a is the terrain factor.

2.2. Grids and Validation

As shown in Figure 3, the geometric model meshes using an extremely structured grid; LES simulations require high-resolution grids. Structured meshes are often used in LES because of their regular grid cells, good connectivity, a relatively small number of meshes, and better ability to capture and describe vortices [21,33].
Structured meshes are highly reliable and maintainable, with a uniform grid distribution that facilitates the development of numerical solution formulas, thus enabling the more accurate simulation of flow properties and meeting the requirements of LES, which necessitate high-resolution meshes [34,35]. In addition, the structured grid can quickly provide boundary conditions, numerical discretization, and numerical solutions [36,37]. The grid division is shown in Figure 3. For the model used in this simulation study, a hexahedral structured mesh was used with a growth rate of 1.15. The smallest mesh in the body mesh refers to 3.4 × 10⁻⁶ m3, with the most significant body mesh being 8 × 10⁻³ m3, according to Celik’s index formula for assessing the quality of LES meshes [38].
L E S i q = 1 1 + α v ( v S G S + v v ) n
where v S G S is SGS turbulent viscosity, α v is the calculation constant, v is the molecular viscosity, and n is the model constant. When the L E S i q is between 0.75 and 0.85, the computational grid is in the range of the minimum computational grid quality required. When the L E S i q is above 0.85, the quality of the computational grid is entirely adequate for this calculation. The mean value of the LES of the computational grid in the study is 0.87, while more than 99% of the computational grid area meets the minimum quality requirements.

2.3. Simulation

The large eddy simulation (LES) feature found in the commercial computational fluid dynamics software package Ansys Fluent was utilized in this work to accomplish this goal effectively. Compared to the traditional Reynolds averaging method (RANS), the large eddy simulation (LES) has the following advantages: (1) It gives more accurate simulation results. Since LES only simulates larger turbulent structures, smaller turbulent structures are usually difficult to simulate accurately. Therefore, sometimes, the simulation results from LES can be more accurate than RANS. (2) It obtains better physical description. LES can directly simulate turbulent mesoscale vortex structures, whereas RANS has to use vortex macro-averaging, thus losing some detailed information. As a result, LES can describe physical phenomena better. (3) It has controllable computational errors. Using high-resolution meshes allows for more minor errors in LES, and subgrid models can also control the errors in LES. (4) It shows better adaptation to complex flow fields. Traditional RANS methods for calculating complex turbulent phenomena usually require using complex vortex models to obtain accurate solutions. On the other hand, LES can usually adapt to more complex flow fields and obtain more accurate results by increasing the grid scale and time step, etc. [39,40]. Extensive eddy simulations offer higher computational accuracy and better physical descriptions than the traditional Reynolds averaging method but are more computationally expensive. The basic idea of LES simulations is to directly calculate large-scale pulsations [41]. A mathematical filtering function must first be constructed to implement a large eddy simulation. The subgrid-scale closure method devised by Smagorinsky should be utilized for filtering operations. The established filtering function filters out small eddies that do not meet the scale requirements of the turbulent transient equations of motion [42,43]. The set of LES control equations after processing through the filter function is shown in Equations (3) and (4). The pressure and velocity coupling method uses the iteration-free transient calculation program PISO. The pressure and momentum discretization methods use second-order discretization and bounded central difference, respectively, and second-order implicit discretization methods for the time terms. The time step for the computation is set at 0.0003 s, and there are 40,000 total time steps. Twelve seconds are spent running through the entire computational model. The continuity residuals in the computational zone are controlled to a value of 10−6, and the last four seconds are used as the data for the computational analysis.
t ( ρ u i ¯ ) + x j ( ρ u i ¯ u j ¯ ) = p ¯ x i + x j ( μ u i ¯ x j ) τ i j x j
ρ t + x i ( ρ u i ¯ ) = 0
where τ i j is defined as the subgrid-scale stress SGS, representing the effect of small-scale vortex motion on solving the equations of motion. According to Smagorinsky’s basic SGS model, the assumed stress form is shown in Equation (5).
τ i j 1 3 τ k k δ i j = 2 μ t S i j ¯
μ t is the subgrid-scale turbulent dynamic viscosity, and S i j is the symmetric tensor of the velocity gradient, which is calculated as follows:
μ t = ( C s Δ ) 2 / S ¯ /
/ S ¯ / = 2 S i j ¯ S i j ¯
Δ = ( Δ x Δ y Δ z ) 1 3
Δ denotes the grid size in the i-axis direction, and C s is the Smagorinsky constant.

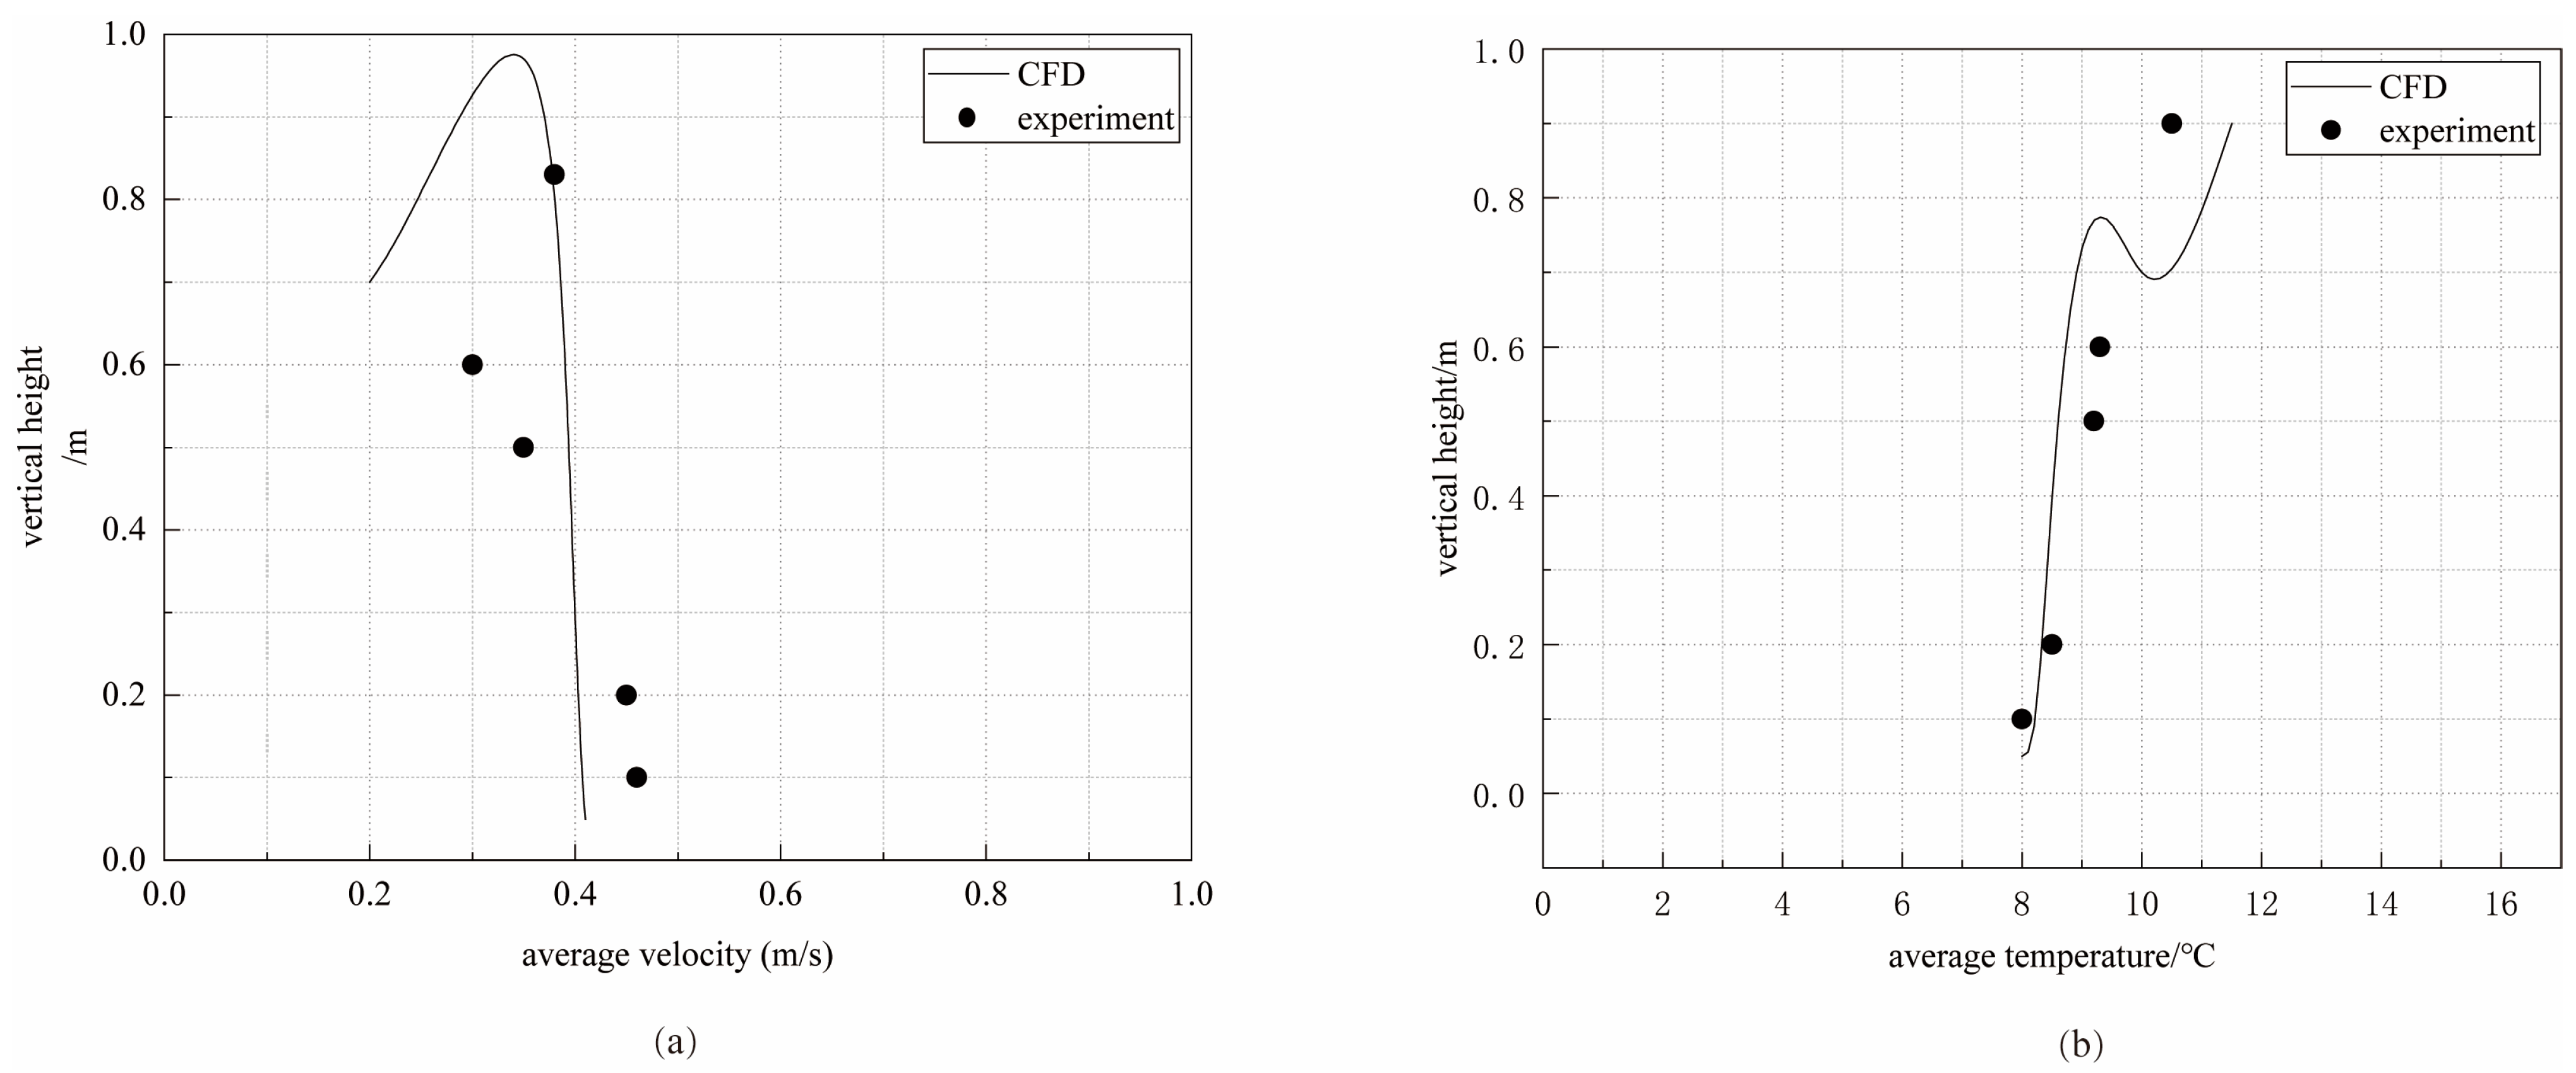
2.4. CFD Model Validation

Before utilizing CFD simulations, verifying the accuracy of the data obtained from the CFD model calculations is essential. In the relevant literature, Caiolo provides full-scale experiments on unilateral ventilation with detailed studies of velocity profiles and temperature profiles at the openings [39]. We compared the expected results from CFD simulations with the actual experimental data using the model experimentally validated in prior research. Figure 4 depicts the results obtained by conducting the comparison. The CFD simulation predicts that the mean airflow velocity at the opening is generally consistent with the experimental airflow velocity distribution, and the error remains small. At the same time, the error in preheating the average temperature at the opening remains within 5–18% of the experimental data. Therefore, the results of using CFD to predict data from simulated single-sided natural ventilation are very accurate and have some application value.

3. Results and Discussion

3.1. Effect of External Air On Air Exchange Rate

The degree to which air flows outside the structure is referred to as the external wind variation, and wind outside the structure makes the circulation of air between the indoors and outside a more relevant process. The air change rate (ACH) of a building is the measure used to express the number of times in a certain amount of time that the air contained within the building is completely replaced:
A C H = Q v V
CFD calculations obtain the airflow velocities of the SSO and SDO. Also, to avoid errors in selecting a single point for velocity measurement, the total area of the flow field at the opening is intercepted for area-weighted averaging in the CFD calculation. This makes the simulated airflow rates of the openings more accurate. The numerical results that were produced for the ACH of the building under various scenarios are depicted in Figure 5. These results include the external wind speed and the wind-blowing direction. The analysis of the findings reveals that the ventilation conditions for single and double openings undergo considerable changes whenever there is a change in the external wind speed or direction. This is the case regardless of whether the openings are single or double. Even though the single and double apertures were planned to have the same total surface area from the beginning, the single and double openings’ ventilation performance is substantially different. Figure 5a demonstrates that the ventilation performance of double openings in open windward conditions is substantially superior to that of single openings in these conditions. When there is a gradual but consistent increase in wind speed outside, the ventilation rate within buildings with double openings increases significantly to 3.4 times the ventilation rate at U = 5 m/s compared to static wind speed, but the single opening under the same conditions does not significantly increase the ventilation rate in the building with a change in external wind speed.
Before analyzing the changes in the indoor and outdoor CFD simulation flow fields, it is essential to note that the effective windward area of the larger single opening is greater than that of the smaller double openings. On the other hand, the external wind forces propel the airflow perpendicular to the single opening. As a result of the temperature difference between the indoor and outdoor air, the thermal pressure forces the external circulation to enter the building at an angle. The two distinct driving forces converge in opposite directions in the flow plane of the single opening, and the impact pulsation of the airflow creates a vortex in the flow plane. The vortex-caused backflow of air drastically reduces the theoretically calculated ventilation capacity of the single opening.
Figure 5b shows the building window with the wind at its back. The ventilation performance of both SSO and SDO improves well as the wind speed outside the building increases, with SDO ventilation outperforming SSO at low wind speeds. After U ≥ 2 m/s, the ventilation performance of SSO improves significantly and gradually outperforms that of SDO.

3.2. Vortex Shedding on the Leeward Side-Pumping Air Supply

According to the SSO and SDO studies, the air exchange rate gradually increases with rising external wind speed when the building is leeward. To further investigate this phenomenon’s causes, when the building was leeward, a series of interacting vortices were observed to form on the SSO and SDO sides. A shedding event occurs when the vortices produced on the windward side of the building collide with one another on the structure’s surface. As shown in Figure 6a,c, in states of low external wind speed, the vortices formed on either side of the building are smaller, and the degree of impact is correspondingly lower as the external wind speed increases. As shown in Figure 6b,d, the vortices of the airflow gradually increase and create a series of highly asymmetrical pressure distributions along the flow path of the airflow. The airflow at the high-pressure point crosses the central axis and moves towards the airflow at the low-pressure point. As the airflow moves, the pressure at the high-pressure point drops to the same value as the low-pressure point, at which point the vortex falls off. The low-pressure point is officially interchanged with the high-pressure point. Due to the continuity of the airflow, the vortex shedding at both ends keeps happening over and over again. This erratic oscillation enhances the ventilation effect of the SSO and SDO during backdraft. According to Daniel’s research, this oscillation has a certain periodicity.
As shown in Figure 7, for the corresponding incoming flow velocity, vortex shedding and surface forces occur at a fixed frequency, according to the analysis proposed by Strouhal regarding such an oscillatory mechanism, as shown in Equation (10), where f is the vortex shedding frequency, w is the characteristic size of the geometry, and U o u t is the transverse free-flow velocity.
S t = f s w U o u t
When S t < 1, the contact between the flow and the structure is minor, the flow state is stable, and small local vortices dominate the flow field. When S t > 1, the interaction between the airflow and the building object is strong, the flow state of the fluid is unstable, and large-scale vortices and vortex streets dominate the flow field.
The frequency of vortex shedding was determined in the simulation study by monitoring the variation of the curved power coefficient adjacent to the inflexion point. As shown in Figure 8a, the vortex-scattering frequency increases linearly with increasing wind speed when the building is leeward. Figure 8b depicts the corresponding Strouhal number and the experimental Strouhal number for a square structure based on the calculation of the preceding equation; comparing the results of Daniel’s experimental test, the relative error of the number derived from the LES simulation is within 4% [15].

3.3. SSO and SDO Central Profile Speed Analysis

The variation of the ventilation rate under various external air velocities reveals a conversion effect between wind and thermal pressure as the driving force of airflow. To investigate further the impact of this conversion effect. At various wind speeds, we analyzed the velocity distribution on the central surfaces of the SSO and SDO. Figure 9 primarily depicts the velocity variation with height for wind speeds of 1 m/s and the axis of the apertures at 3 m/s. For higher external wind speeds of U = 3 m/s, it is evident that the variation in the axial velocity of the apertures is more pronounced regardless of whether the openings are windward or leeward and that the average velocity of the central axis is greater than the effect of U = 1 m/s.
In the open windward condition, the axial velocity of the SSO at U = 1 m/s decreases after a certain distance in height, probably due to the drag caused by the local disturbance. In the windward condition, the central axis velocity of the upper opening of the SDO at U = 3 m/s is much greater than the central axis velocity of its lower opening. In the opener against the wind, there is a zero value point in the central axis of the SSO opening, and its corresponding transverse section is a neutral surface with a linear distribution of pressure on both sides. In this case, the velocities of the central axes of the upper and lower openings of the SDO increase almost simultaneously and show numerical consistency.

3.4. Analysis of the Effect of Combined Air and Thermal Pressure Drive on the Air Exchange Rate

In engineering applications, air and thermal pressures are frequently present concurrently. The Archimedes and flow rate numbers are introduced before analyzing the effect of combined wind and thermal pressure driving air exchange rates. Warren introduced this dimensionless number in his study of the impact of external airflow on air exchange rates [44]. Archimedes’ number is the proportion between buoyancy force and inertial force. Based on conventional fluid mechanics calculations, Archimedes’ number is frequently employed to analyze the phenomenon of fluids’ mixed convection. The flow number represents the ratio of ventilation volume driven by the coupled wind and thermal pressure to ventilation volume driven by wind pressure alone. The corresponding phrases are listed below.
A r = g Δ T H T a v e U w i n d
F = Q v A U w i n d
where A r is the Archimedes number, F is the flow rate, H is the height of the opening, Δ T is the temperature difference between the inside and outside of the opening, U w i n d is the air velocity, Q v is the volumetric flow rate of the air, and A is the area of the airflow through the opening.
The above equation strongly connects the flow and Archimedes’ numbers. It is crucial to derive expressions related to the ventilation rate Q. The following mathematical model for natural ventilation of SSO and SDO under thermal pressure is thus derived.
As shown in Figure 10a, a single side in a building has two openings, M and N of the same area: both of area A. The difference in static pressure between the inside and outside of opening M is P M , and the difference in static pressure between the inside and outside of opening N is P N . The difference in height between M and N is H .
P N = P M + g H ( ρ o u t ρ i n )
Δ P = P N P M = g H ( ρ o u t ρ i n )
where ρ i n and ρ o u t represent the air density inside and outside the opening.
Δ P = ρ o u t g H T o u t T i n T o u t
Q v = A C s , d 2 Δ P ρ o u t
Q v = A C s , d 2 g H T o u t T i n T o u t
T o u t is the average temperature on the outside of the opening, T i n is the average temperature on the inside of the opening, and C s , d is the opening flow coefficient. The relevant equation for the ventilation rate of SDO under thermal pressure can be obtained as follows:
Q v = A C s , d 2 g H T o u t T i n T o u t
Figure 10b depicts the physical model of thermal pressure ventilation of the SSO, assuming that the SSO neutralization surface is at the middle height of its aperture and that the pressure is distributed linearly. The lower portion of the neutralizing surface serves as the airflow inlet, while the upper portion functions as the airflow outlet, with integration of Equation (19) in the direction of the opening’s height.
Q v = 1 2 A C s , d 0 0.5 H 2 Δ P ρ o u t = 1 2 A C s , d 0.5 H H 2 Δ P ρ o u t
We then derive the thermal pressure ventilation Equations (20) and (21) for SSO and SDO.
Q v = A C s , d 2 g H Δ T T o u t
Q v = 1 3 A C s , d 2 g H Δ T T o u t
Based on the above-derived equations, the following correlation between the Archimedes number and the flow number in SSO and SDO can be derived from the joint vertical.
F c s = Q v A U o u t = 1 3 C s , d A r 0.5
where F c s is the critical flow number, and according to Warren’s formulation, in a straight line, the driving force for the ventilation rate depends mainly on the thermal pressure created by the temperature difference [45]. In the region below the straight line, the wind pressure caused by the external wind balances the thermal pressure caused by the temperature difference, resulting in a meager ventilation rate. In the upper region, the wind-pressure effect augments the thermal-pressure effect, resulting in an increased ventilation rate.
By analyzing the results of CFD calculations, the SSO and SDO ventilation exchange rates are influenced by different driving forces, as shown in Figure 11. When the SSO and SDO are in the windward state, they are subject to a more significant amount of influence from the wind coming from the outside. With a gradual increase in external wind speed, the influence of wind pressure on ventilation increases. This gradually counteracts the effect of the thermal pressure, which reduces the ventilation rate at this point. However, this counteracting effect does not continue to increase as the effect of wind pressure reaches the counteracting point. The external air’s wind pressure will synergize with the thermal pressure to enhance the ventilation rate, corresponding to F > F c s in the diagram. It is worth noting that when the SSO and SDO are in the leeward condition, different external air velocities enhance the ventilation exchange rate of the thermal pressure to some extent, with the vast majority being in the F > F c s range.
The synergistic effect of wind and thermal pressure drives the ventilation of the SSO and SDO in the leeward condition. Therefore the effect of wind pressure offsetting thermal pressure cannot be studied visually in the leeward condition. The vertical center surface temperature distribution under windward conditions is illustrated in Figure 12. The wind speed on the left side of Figure 12 is 1 m/s outside, and the wind speed on the right side of Figure 12 is 3 m/s; because it was specified at the beginning of this study that the indoor temperature would be higher than the outdoor temperature, the interior of the building is in the form of a positive temperature difference about the external environment. Temperature stratification is produced on the interior of the building due to the dense, low-temperature air that is forced into the room through the apertures in the structure by the airflow. Forced convective heat exchange is located at the base of the structure, and the air circulation is far more turbulent than at the top levels of the building. At an exterior velocity of wind of 1 m/s, the inlet airflow of the SSO and SDO enters the room at an angle very close to the inner wall of the building, with its central flow line at an acute angle to the entrance. The principal factor propelling the airflow at this point is the buoyancy effect of the thermal pressure rise. However, when the external wind speed climbs to 3 m/s, the angle of the inlet airflow of the SSO and SDO rises dramatically and enters the building at an approximate angle of 90° to the entrance. In this situation, the ventilation impact of the thermal pressure effect gradually declines as the wind speed increases. The increase in wind speed creates a significant disruption effect on the airflow entering the SSO and SDO. This disturbance effect increases the creation of vortices, which decreases the influence of temperature differences in the SSO and the SDO air inlets, proving why a specific range of external wind speed fluctuations counteracts the effect of thermal pressure ventilation.
Comparing the performance of SSO and SDO at different airspeeds, SDO has a higher uniformity of indoor temperature distribution at low and high air speeds and is more stable than SSO at high air speeds. Although the SDO performance remains stable at low wind speeds, the SDO has a more insufficient improvement in room temperature than the SSO at the same wind speed. This lays a solid foundation for maximizing the beneficial effects that natural ventilation can have on one side. The windows of the building can be created with acceptable opening fans according to the climate and environment of the building; alternatively, the opening fans of the windows can be opened in various ways according to the external wind speed.

4. Conclusions

A numerical study of the ventilation provided to a room in a freestanding, square building is presented here. The study was carried out using a computer. CFD methodologies were utilized to analyze the influence that two opening configurations, SSO and SDO, have on the ventilation effect in the building room when subjected to leeward and windward situations, respectively. In this study, the effects of two different airflow drivers, namely wind pressure and heat pressure, were analyzed, and the primary airflow drivers for natural ventilation in windward conditions were determined. Vortex shedding was discovered to be a unique form of airflow drive that was active in the leeward state. The following is a summary of the primary conclusions reached in this study.
  • The ambient wind speed plays a crucial function in a building’s ventilation. In windward conditions, a building’s ventilation rate is not always proportional to the ambient wind speed. As the external wind speed increases, the air exchange rate of a building will decrease until the wind and thermal pressure offset point is attained. Beyond the airflow drive offset point, the building’s air exchange rate will increase with an increasing ambient wind speed;
  • When the leeward condition is present, the primary force that drives the airflow is vortex shedding at the vent located on the leeward side. This causes periodic airflow oscillations to appear in the lateral direction. The measured Strouhal number is 0.104, which is consistent with the test results, with a relative error rate of 4%;
  • With two distinct aperture configurations for SSO and SDO, the windward ventilation rate for SDO is greater than that of SSO. In leeward conditions, the ventilation rate of SDO is still more significant than that of SSO, even at low wind velocities. At higher external wind speeds, the ventilation rate of SSO progressively intensifies, and the overall ventilation rate gradually surpasses that of SDO as external wind speeds increase. In engineering applications in the real world, the arrangement of openings for natural ventilation on a single side of a building should consider the building’s location, the weather patterns that occur throughout the year, and the changes in wind direction on the ventilation side.
It is worth noting that in practical engineering applications, the above findings, despite their informative value, still face challenges and specific limitations that cannot be ignored. Single-sided natural ventilation is widely used in the building sector, and various types of opening designs offer more possibilities for its practical application. However, this study only analyzed the airflow state and driving force variations for square-opening SSO and SDO, while the case of non-square openings has yet to be explored in depth. Future research should therefore build on the existing studies of square openings and expand further into the design of different shapes of openings. This includes a comprehensive analysis of the effects of varying opening shapes on airflow status, driving force variations, and ventilation effects in single-sided natural ventilation. Such research will provide a more comprehensive design reference for building designers and help improve the efficiency of building ventilation and air exchange, reduce energy consumption, and contribute to green building and sustainable development. In conclusion, future research should focus on the impact of different shapes of openings in single-sided natural ventilation. Through in-depth analysis of the airflow state, driving force changes, and ventilation effects, we aim to provide building designers with more scientific and reasonable ventilation solutions to meet people’s needs for indoor environmental quality and comfort as well as to respond to the global challenge of energy saving and emission reduction.

Author Contributions

Methodology, Z.F. and W.W.; numerical simulation, Z.F. and Y.C.; manuscript writing, Z.F.; picture editing, Z.F., Y.C., R.D. and D.P.; conceptualization, Z.F. and J.S. and H.F. All authors have read and agreed to the published version of the manuscript.

Funding

This study was supported by the Natural Science Foundation of Xinjiang Uygur Autonomous Region under Grant No. 2022D01C412.

Institutional Review Board Statement

Not applicable.

Informed Consent Statement

Not applicable.

Data Availability Statement

The data presented in this study are available upon request from the first author.

Conflicts of Interest

The authors declare no conflict of interest.

Nomenclature

a Terrain factor
A C H Air change rate per hour (1/h)
A Area (m2)
C s Calculation constants
C s , d Flow coefficient
f s Eddy current shedding frequency
F Number of flows
h Building outdoor height (m)
h g Reference height (m)
H Opening height (m)
Q v Volume flow rate of air (m3/h)
S S O   S S O Single-side single opening
S D O Single-side double opening
U External wind velocity (m/s)

References

  1. Malkawi, A.; Yan, B.; Chen, Y.J.; Tong, Z.M. Predicting thermal and energy performance of mixed-mode ventilation using an integrated simulation approach. Build. Simul. 2016, 9, 335–346. [Google Scholar] [CrossRef]
  2. Wang, J.; Wang, S.; Zhang, T.; Battaglia, F. Assessment of single-sided natural ventilation driven by buoyancy forces through variable window configurations. Energy Build. 2017, 139, 762–779. [Google Scholar] [CrossRef]
  3. Carrilho da Graça, G.; Linden, P. Ten questions about natural ventilation of non-domestic buildings. Build. Environ. 2016, 107, 263–273. [Google Scholar] [CrossRef] [Green Version]
  4. Díaz-Calderón, S.F.; Castillo, J.A.; Huelsz, G. Evaluation of different window heights and facade porosities in naturally cross-ventilated buildings: CFD validation. J. Wind Eng. Ind. Aerodyn. 2023, 232, 105263. [Google Scholar] [CrossRef]
  5. Sun, S.; Wang, H.; Zhang, W. Analysis of numerical factors affecting large eddy simulation of pollutant diffusion around buildings. J. Wind Eng. Ind. Aerodyn. 2023, 232, 105244. [Google Scholar] [CrossRef]
  6. Yang, C.; Luo, W.; Li, A.; Gao, X.; Che, L.; Qiao, L.; Gao, T.; Liu, Y. Natural ventilation driven by a restricted heat source elevated to different levels. Build. Simul. 2021, 15, 281–289. [Google Scholar] [CrossRef]
  7. Evola, G.; Popov, V. Computational analysis of wind driven natural ventilation in buildings. Energy Build. 2006, 38, 491–501. [Google Scholar] [CrossRef]
  8. Gan, V.J.L.; Wang, B.; Chan, C.M.; Weerasuriya, A.U.; Cheng, J.C.P. Physics-based, data-driven approach for predicting natural ventilation of residential high-rise buildings. Build. Simul. 2021, 15, 129–148. [Google Scholar] [CrossRef]
  9. Larsen, T.S.; Heiselberg, P. Single-sided natural ventilation driven by wind pressure and temperature difference. Energy Build. 2008, 40, 1031–1040. [Google Scholar] [CrossRef]
  10. von Grabe, J.; Svoboda, P.; Bäumler, A. Window ventilation efficiency in the case of buoyancy ventilation. Energy Build. 2014, 72, 203–211. [Google Scholar] [CrossRef]
  11. Castillo, J.A.; Huelsz, G.; van Hooff, T.; Blocken, B. Natural ventilation of an isolated generic building with a windward window and different windexchangers: CFD validation, sensitivity study and performance analysis. Build. Simul. 2019, 12, 475–488. [Google Scholar] [CrossRef]
  12. Fang, Z.C.; Wang, W.J.; Chen, Y.H.; Song, J.K. Structural and Heat Transfer Model Analysis of Wall-Mounted Solar Chimney Inlets and Outlets in Single-Story Buildings. Buildings 2022, 12, 1790. [Google Scholar] [CrossRef]
  13. Zhong, H.-Y.; Sun, Y.; Shang, J.; Qian, F.-P.; Zhao, F.-Y.; Kikumoto, H.; Jimenez-Bescos, C.; Liu, X. Single-sided natural ventilation in buildings: A critical literature review. Build. Environ. 2022, 212, 108797. [Google Scholar] [CrossRef]
  14. Gan, G. Effective depth of fresh air distribution in rooms with single-sided natural ventilation. Energy Build. 2000, 31, 65–73. [Google Scholar] [CrossRef]
  15. Albuquerque, D.P.; Sandberg, M.; Linden, P.F.; Carrilho da Graça, G. Experimental and numerical investigation of pumping ventilation on the leeward side of a cubic building. Build. Environ. 2020, 179, 106897. [Google Scholar] [CrossRef]
  16. Favarolo, P.A.; Manz, H. Temperature-driven single-sided ventilation through a large rectangular opening. Build. Environ. 2005, 40, 689–699. [Google Scholar] [CrossRef]
  17. Chu, C.-R.; Chiu, Y.H.; Tsai, Y.-T.; Wu, S.-L. Wind-driven natural ventilation for buildings with two openings on the same external wall. Energy Build. 2015, 108, 365–372. [Google Scholar] [CrossRef]
  18. Chaplin, G.C.; Randall, J.R.; Baker, C.J. The turbulent ventilation of a single opening enclosure. J. Wind Eng. Ind. Aerodyn. 2000, 85, 145–161. [Google Scholar] [CrossRef]
  19. Larsen, T.S.; Plesner, C.; Leprince, V.; Carrié, F.R.; Bejder, A.K. Calculation methods for single-sided natural ventilation: Now and ahead. Energy Build. 2018, 177, 279–289. [Google Scholar] [CrossRef]
  20. King, M.-F.; Gough, H.L.; Halios, C.; Barlow, J.F.; Robertson, A.; Hoxey, R.; Noakes, C.J. Investigating the influence of neighbouring structures on natural ventilation potential of a full-scale cubical building using time-dependent CFD. J. Wind Eng. Ind. Aerodyn. 2017, 169, 265–279. [Google Scholar] [CrossRef]
  21. Allocca, C.; Chen, Q.; Glicksman, L.R. Design analysis of single-sided natural ventilation. Energy Build. 2003, 35, 785–795. [Google Scholar] [CrossRef]
  22. Freire, R.Z.; Abadie, M.O.; Mendes, N. On the improvement of natural ventilation models. Energy Build. 2013, 62, 222–229. [Google Scholar] [CrossRef]
  23. Wang, J.; Zhang, T.; Wang, S.; Battaglia, F. Numerical investigation of single-sided natural ventilation driven by buoyancy and wind through variable window configurations. Energy Build. 2018, 168, 147–164. [Google Scholar] [CrossRef]
  24. Carrilho da Graça, G. A technical note on simplified modeling of turbulent mixing in wind-driven single sided ventilation. Build. Environ. 2018, 131, 12–15. [Google Scholar] [CrossRef]
  25. Wang, J.; Huo, Q.; Zhang, T.; Wang, S.; Battaglia, F. Numerical investigation of gaseous pollutant cross-transmission for single-sided natural ventilation driven by buoyancy and wind. Build Env. 2020, 172, 106705. [Google Scholar] [CrossRef] [PubMed]
  26. Martins, N.R.; da Graca, G.C. Validation of numerical simulation tools for wind-driven natural ventilation design. Build. Simul. 2016, 9, 75–87. [Google Scholar] [CrossRef]
  27. van Hooff, T.; Blocken, B.; Tominaga, Y. On the accuracy of CFD simulations of cross-ventilation flows for a generic isolated building: Comparison of RANS, LES and experiments. Build. Environ. 2017, 114, 148–165. [Google Scholar] [CrossRef]
  28. Jiang, Y.; Chen, Q. Buoyancy-driven single-sided natural ventilation in buildings with large openings. Int. J. Heat Mass Transf. 2003, 46, 973–988. [Google Scholar] [CrossRef]
  29. Fan, S.; Wykes, M.S.D.; Lin, W.E.; Jones, R.L.; Robins, A.G.; Linden, P.F. A full-scale field study for evaluation of simple analytical models of cross ventilation and single-sided ventilation. Build. Environ. 2021, 187, 107386. [Google Scholar] [CrossRef]
  30. Chew, L.W.; Chen, C.; Gorle, C. Improving thermal model predictions for naturally ventilated buildings using large eddy simulations. Build. Environ. 2022, 220, 109241. [Google Scholar] [CrossRef]
  31. Zhang, X.Q.; Zhou, F.Y.; Zou, J.X. Numerical Simulation of Gas Extraction in Coal Seam Strengthened by Static Blasting. Sustainability 2022, 14, 12484. [Google Scholar] [CrossRef]
  32. Zhang, X.Q.; Pan, Y.Y. Preparation, Properties and Application of Gel Materials for Coal Gangue Control. Energies 2022, 15, 557. [Google Scholar] [CrossRef]
  33. Liu, J.; Niu, J. CFD simulation of the wind environment around an isolated high-rise building: An evaluation of SRANS, LES and DES models. Build. Environ. 2016, 96, 91–106. [Google Scholar] [CrossRef]
  34. Ramponi, R.; Blocken, B. CFD simulation of cross-ventilation flow for different isolated building configurations: Validation with wind tunnel measurements and analysis of physical and numerical diffusion effects. J. Wind Eng. Ind. Aerodyn. 2012, 104–106, 408–418. [Google Scholar] [CrossRef]
  35. Arinami, Y.; Akabayashi, S.-i.; Tominaga, Y.; Sakaguchi, J. Performance evaluation of single-sided natural ventilation for generic building using large-eddy simulations: Effect of guide vanes and adjacent obstacles. Build. Environ. 2019, 154, 68–80. [Google Scholar] [CrossRef]
  36. Kobayashi, T.; Sandberg, M.; Kotani, H.; Claesson, L. Experimental investigation and CFD analysis of cross-ventilated flow through single room detached house model. Build. Environ. 2010, 45, 2723–2734. [Google Scholar] [CrossRef]
  37. Tominaga, Y.; Stathopoulos, T. CFD simulations of near-field pollutant dispersion with different plume buoyancies. Build. Environ. 2018, 131, 128–139. [Google Scholar] [CrossRef]
  38. Celik, I.B.; Cehreli, Z.N.; Yavuz, I. Index of resolution quality for large eddy simulations. J. Fluids Eng.-Trans. Asme 2005, 127, 949–958. [Google Scholar] [CrossRef]
  39. Caciolo, M.; Stabat, P.; Marchio, D. Numerical simulation of single-sided ventilation using RANS and LES and comparison with full-scale experiments. Build. Environ. 2012, 50, 202–213. [Google Scholar] [CrossRef]
  40. Park, J.; Sun, X.; Choi, J.-I.; Rhee, G.H. Effect of wind and buoyancy interaction on single-sided ventilation in a building. J. Wind Eng. Ind. Aerodyn. 2017, 171, 380–389. [Google Scholar] [CrossRef]
  41. Zou, J.X.; Zhang, R.; Zhou, F.Y.; Zhang, X.Q. Hazardous Area Reconstruction and Law Analysis of Coal Spontaneous Combustion and Gas Coupling Disasters in Goaf Based on DEM-CFD. ACS Omega 2023, 8, 2685–2697. [Google Scholar] [CrossRef] [PubMed]
  42. Ai, Z.T.; Mak, C.M. Analysis of fluctuating characteristics of wind-induced airflow through a single opening using LES modeling and the tracer gas technique. Build. Environ. 2014, 80, 249–258. [Google Scholar] [CrossRef]
  43. Ricci, M.; Patruno, L.; Kalkman, I.; de Miranda, S.; Blocken, B. Towards LES as a design tool: Wind loads assessment on a high-rise building. J. Wind Eng. Ind. Aerodyn. 2018, 180, 1–18. [Google Scholar] [CrossRef] [Green Version]
  44. Caciolo, M.; Stabat, P.; Marchio, D. Full scale experimental study of single-sided ventilation: Analysis of stack and wind effects. Energy Build. 2011, 43, 1765–1773. [Google Scholar] [CrossRef]
  45. Warren, P.R. Ventilation through openings on one wall only, Energy conservation in heating, cooling, and ventilating buildings. In Heat and Mass Transfer Techniques and Alternatives; CiNii: Tokyo, Japan, 1978. [Google Scholar]
Figure 1. (a) SSO window, (b) SDO window.
Sustainability 15 11456 g001
Figure 2. Geometric model.
Sustainability 15 11456 g002
Figure 3. Mesh division.
Sustainability 15 11456 g003
Figure 4. CFD model validation. (a) the average velocity comparison, (b) the average temperature comparison.
Sustainability 15 11456 g004
Figure 5. Air exchange rate of buildings in windward and leeward conditions. (a) windward, (b) leeward.
Sustainability 15 11456 g005
Figure 6. Airflow on the open side of the building in leeward condition (left side U o u t = 3   m / s ; right side U o u t = 4   m / s ). (a) airflow pattern, (b) airflow pattern, (c) airflow pattern, (d) airflow pattern.
Sustainability 15 11456 g006
Figure 7. Airflow at the YZ side of the building in the leeward condition, left side U o u t = 3   m / s ; right side U o u t = 4   m / s , (a) SSO, (b) SSO, (c) SDO, (d) SDO.
Sustainability 15 11456 g007
Figure 8. (a) Frequency of eddy current shedding. (b) comparison with Strouhal number with experimental data.
Sustainability 15 11456 g008
Figure 9. Variation of the velocity of the central axis of the opening for U = 3 m/s and U = 1 m/s. (a) Windward, (b) Leedward, (c) Windward, (d) Leedward.
Sustainability 15 11456 g009
Figure 10. (a) Schematic diagram of the SDO models, (b) Schematic diagram of the SSO models.
Sustainability 15 11456 g010
Figure 11. Discrimination of airflow driving force at different external wind speeds. (a) SSO windward (b) SSO Leedward (c) SDO windward (d) SDO Leedward.
Sustainability 15 11456 g011
Figure 12. Heat flow profile in the center of YZ, left side U o u t = 1   m / s ; right side U o u t = 3   m / s , (a) SSO, (b) SSO, (c) SDO, (d) SDO.
Sustainability 15 11456 g012
Table 1. Relevant simulation parameters and physical model dimensions.
External Wind DirectionMainstream Wind SpeedΔtOpening SizeSimulation Scheme Diagram
Windward U o u t = 0   ( m / s ) U o u t = 1   ( m / s ) U o u t = 2   ( m / s ) U o u t = 3   ( m / s ) U o u t = 4   ( m / s ) U o u t = 5   ( m / s ) Δ t = 7   ° C SSO: 0.5 m × 0.6 m
SDO: 0.5 m × 0.3 m
Sustainability 15 11456 i001
Leeward U o u t = 0   ( m / s ) U o u t = 1   ( m / s ) U o u t = 2   ( m / s ) U o u t = 3   ( m / s ) U o u t = 4   ( m / s ) U o u t = 5   ( m / s ) Δ t = 7   ° C SSO: 0.5 m × 0.6 m
SDO: 0.5 m × 0.3 m
Sustainability 15 11456 i002
Disclaimer/Publisher’s Note: The statements, opinions and data contained in all publications are solely those of the individual author(s) and contributor(s) and not of MDPI and/or the editor(s). MDPI and/or the editor(s) disclaim responsibility for any injury to people or property resulting from any ideas, methods, instructions or products referred to in the content.

