
Can the Digital Economy Accelerate “Carbon Neutrality”?—An Empirical Analysis Based on Provincial Data in China


Abstract
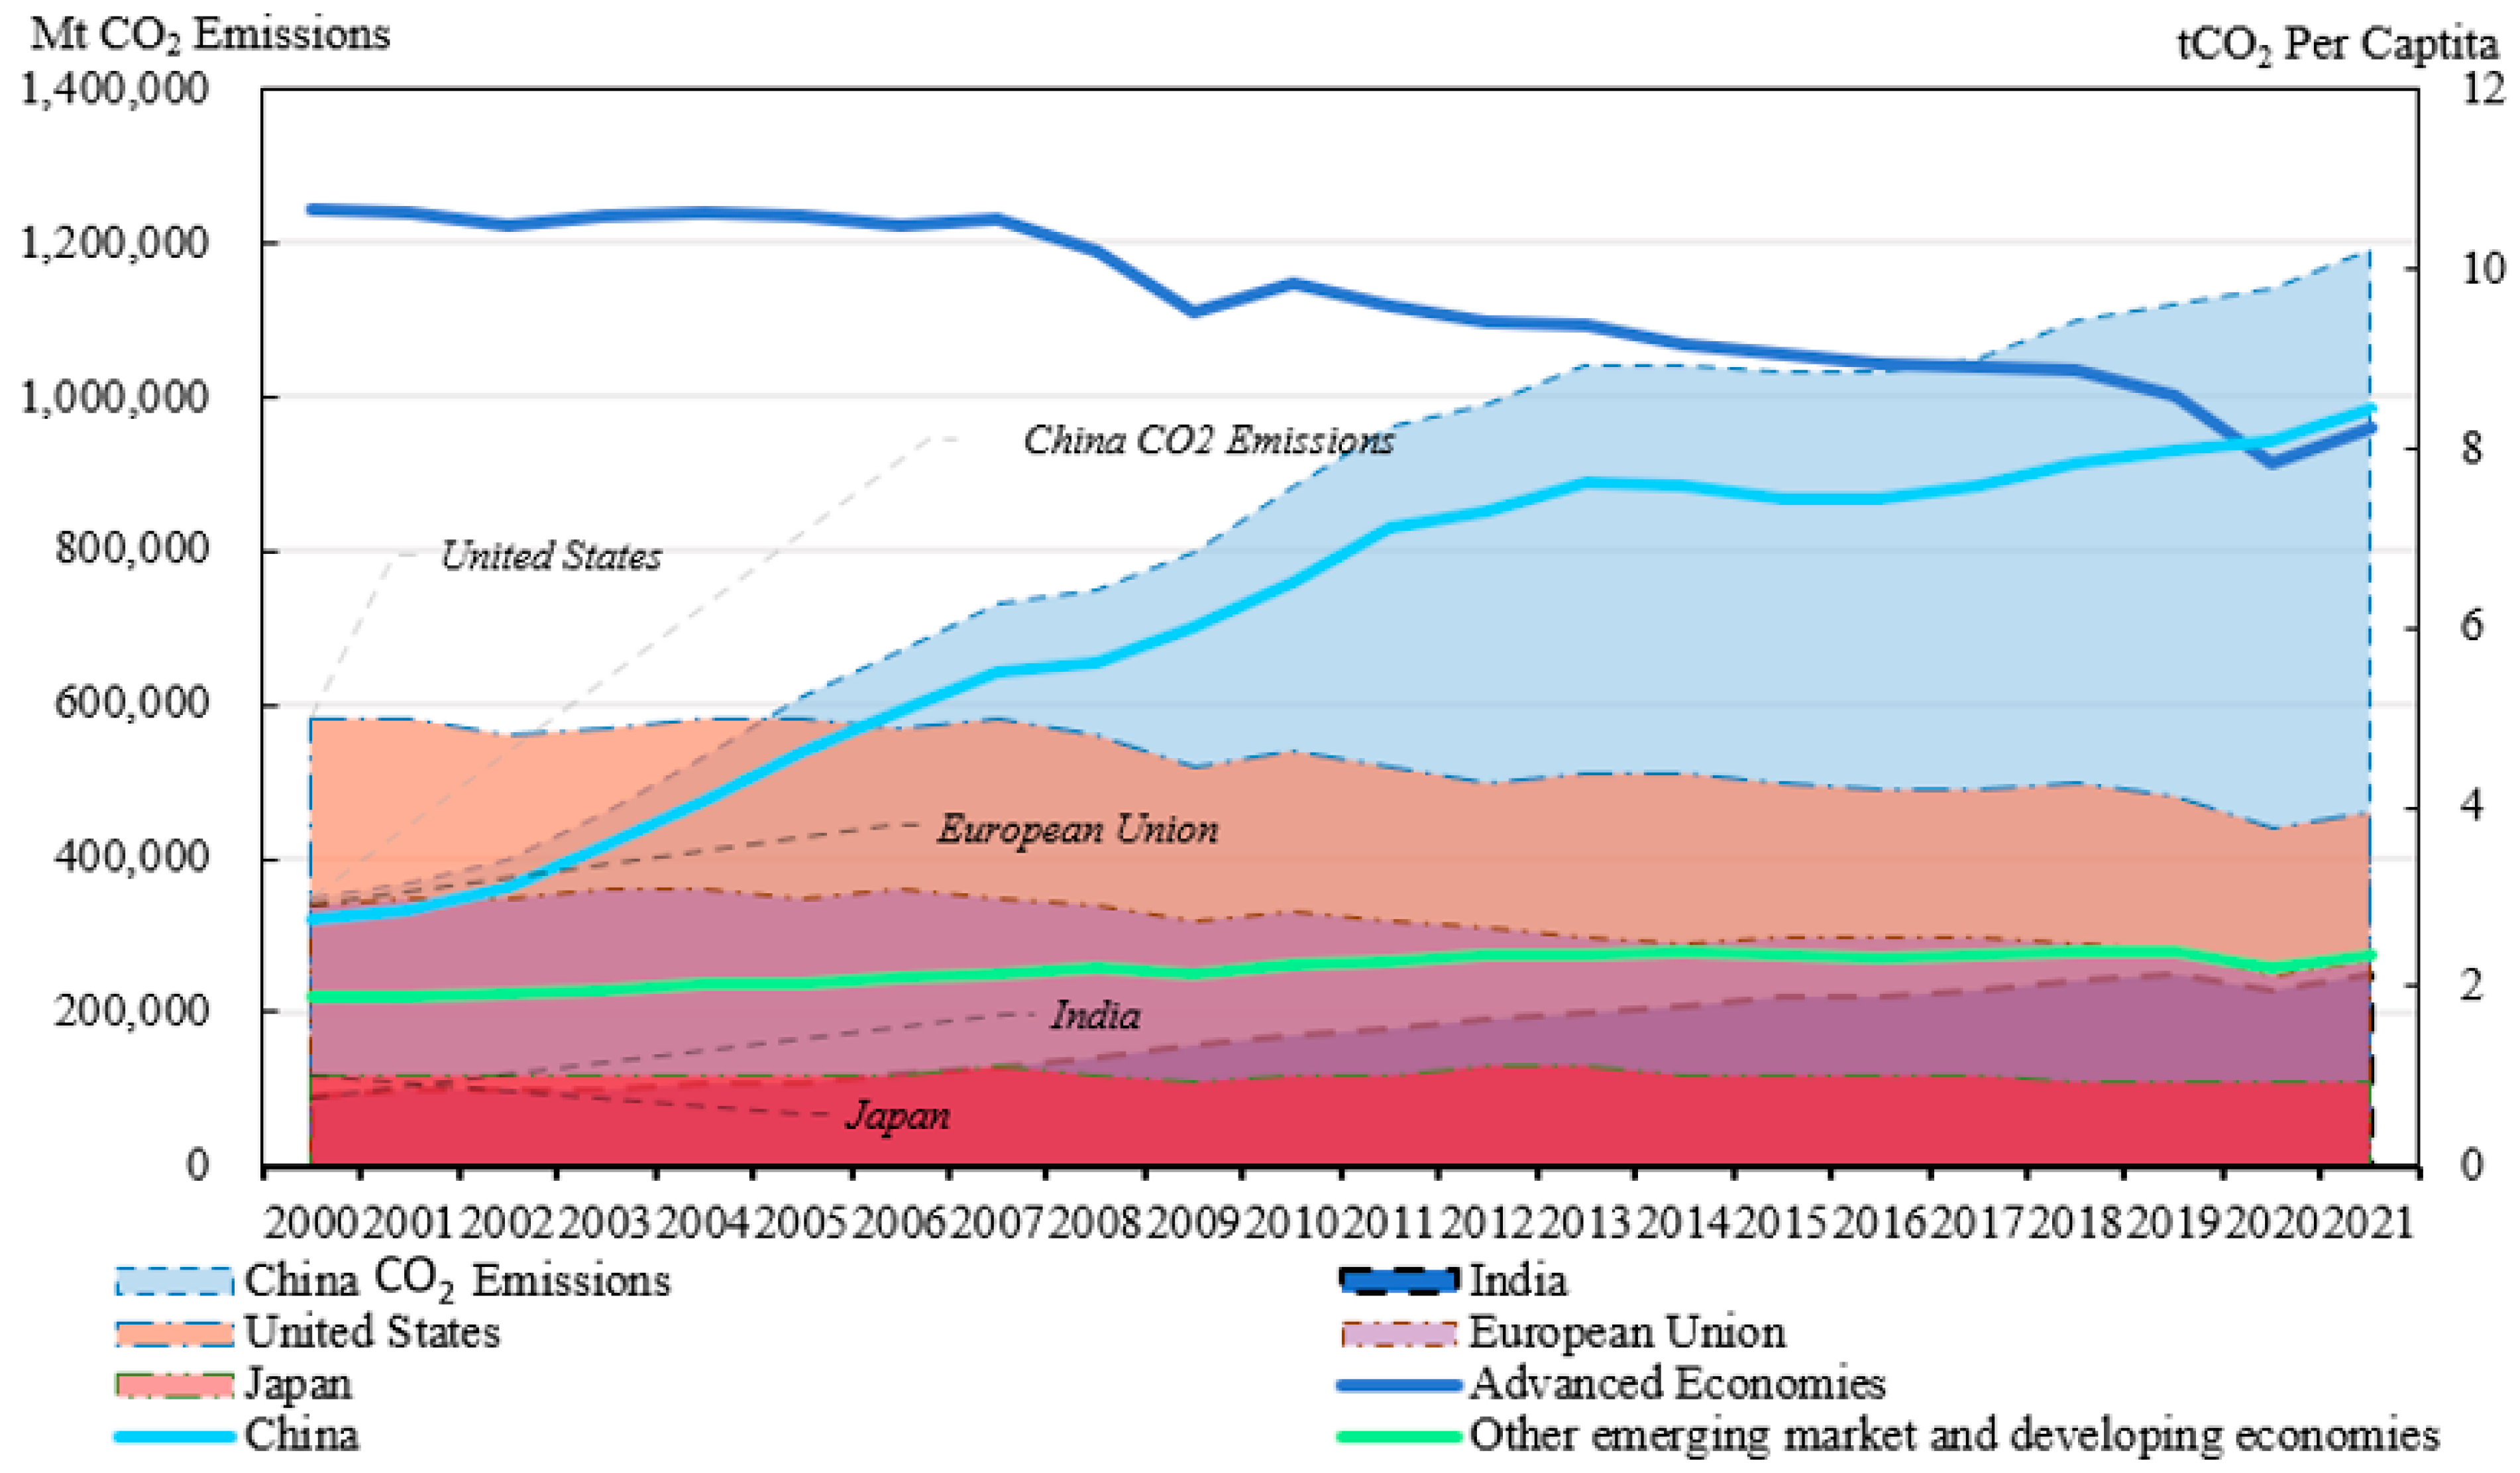
:1. Introduction
2. Literature Review
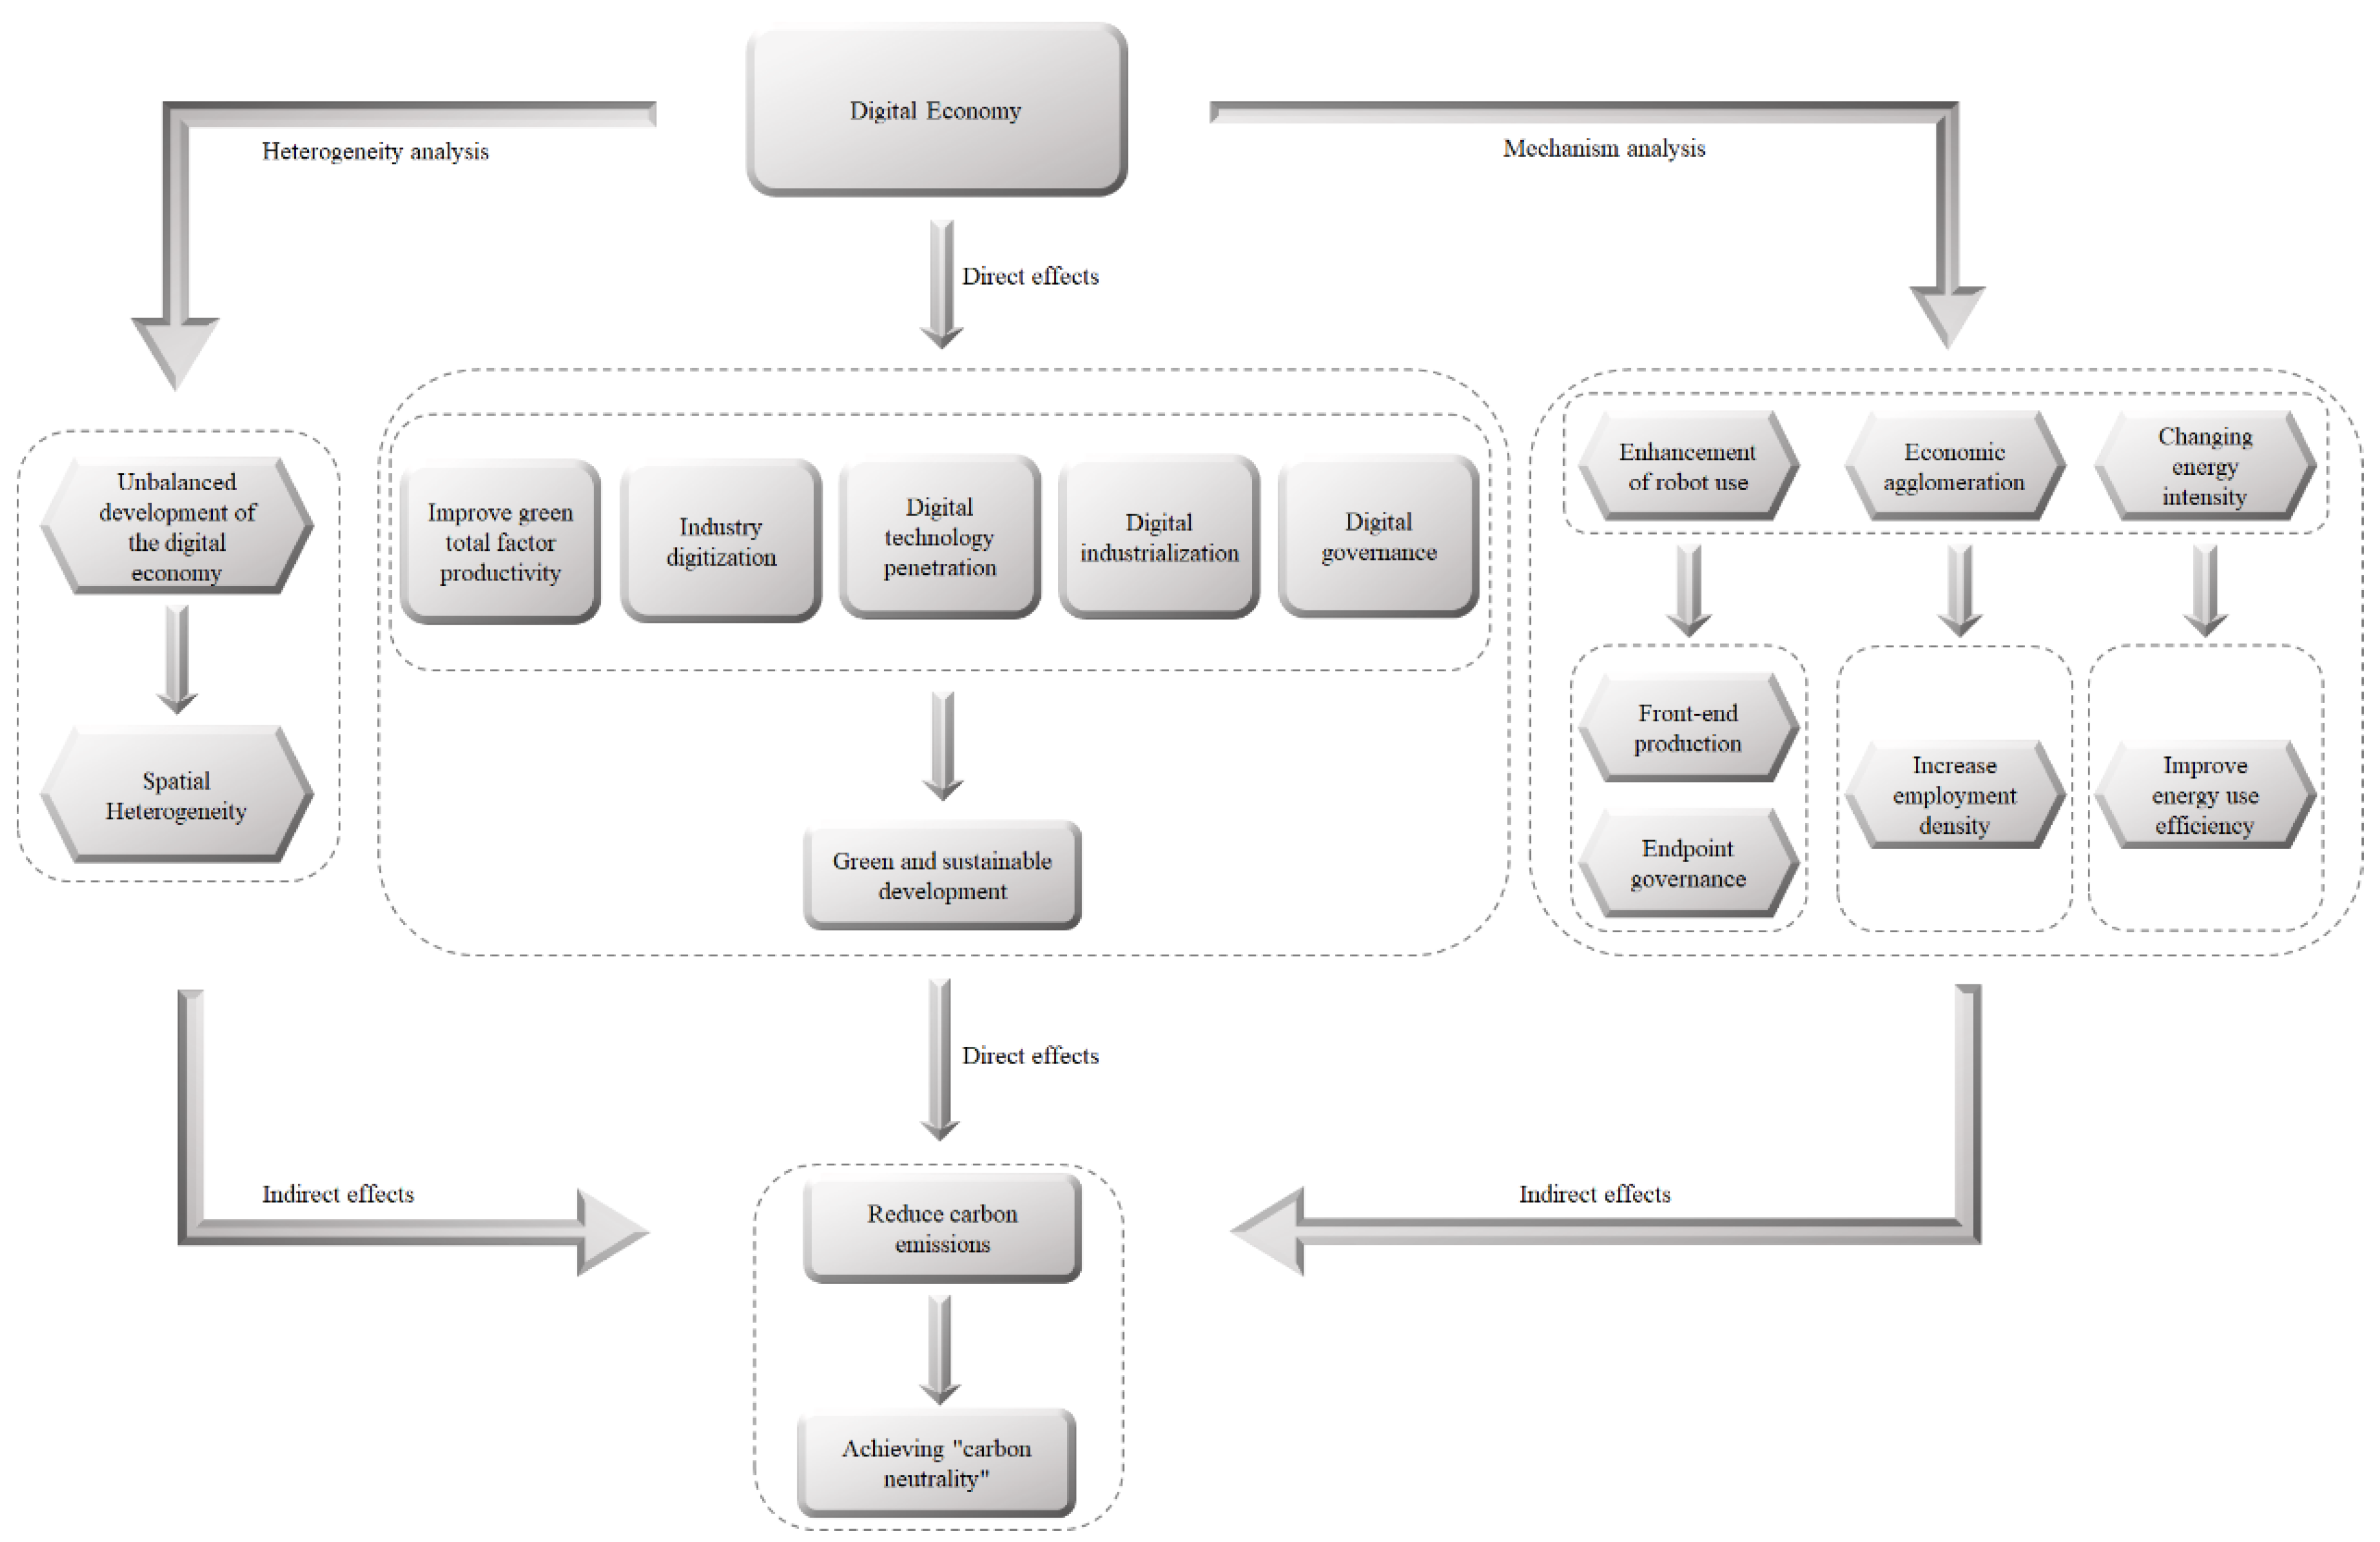
3. Theoretical Analysis and Research Hypotheses
3.1. The Direct Impact of the Digital Economy on Carbon Emissions
3.2. The Indirect Impact of the Digital Economy on Carbon Emissions
3.3. Analysis of Spatial Heterogeneity
4. Data and Models
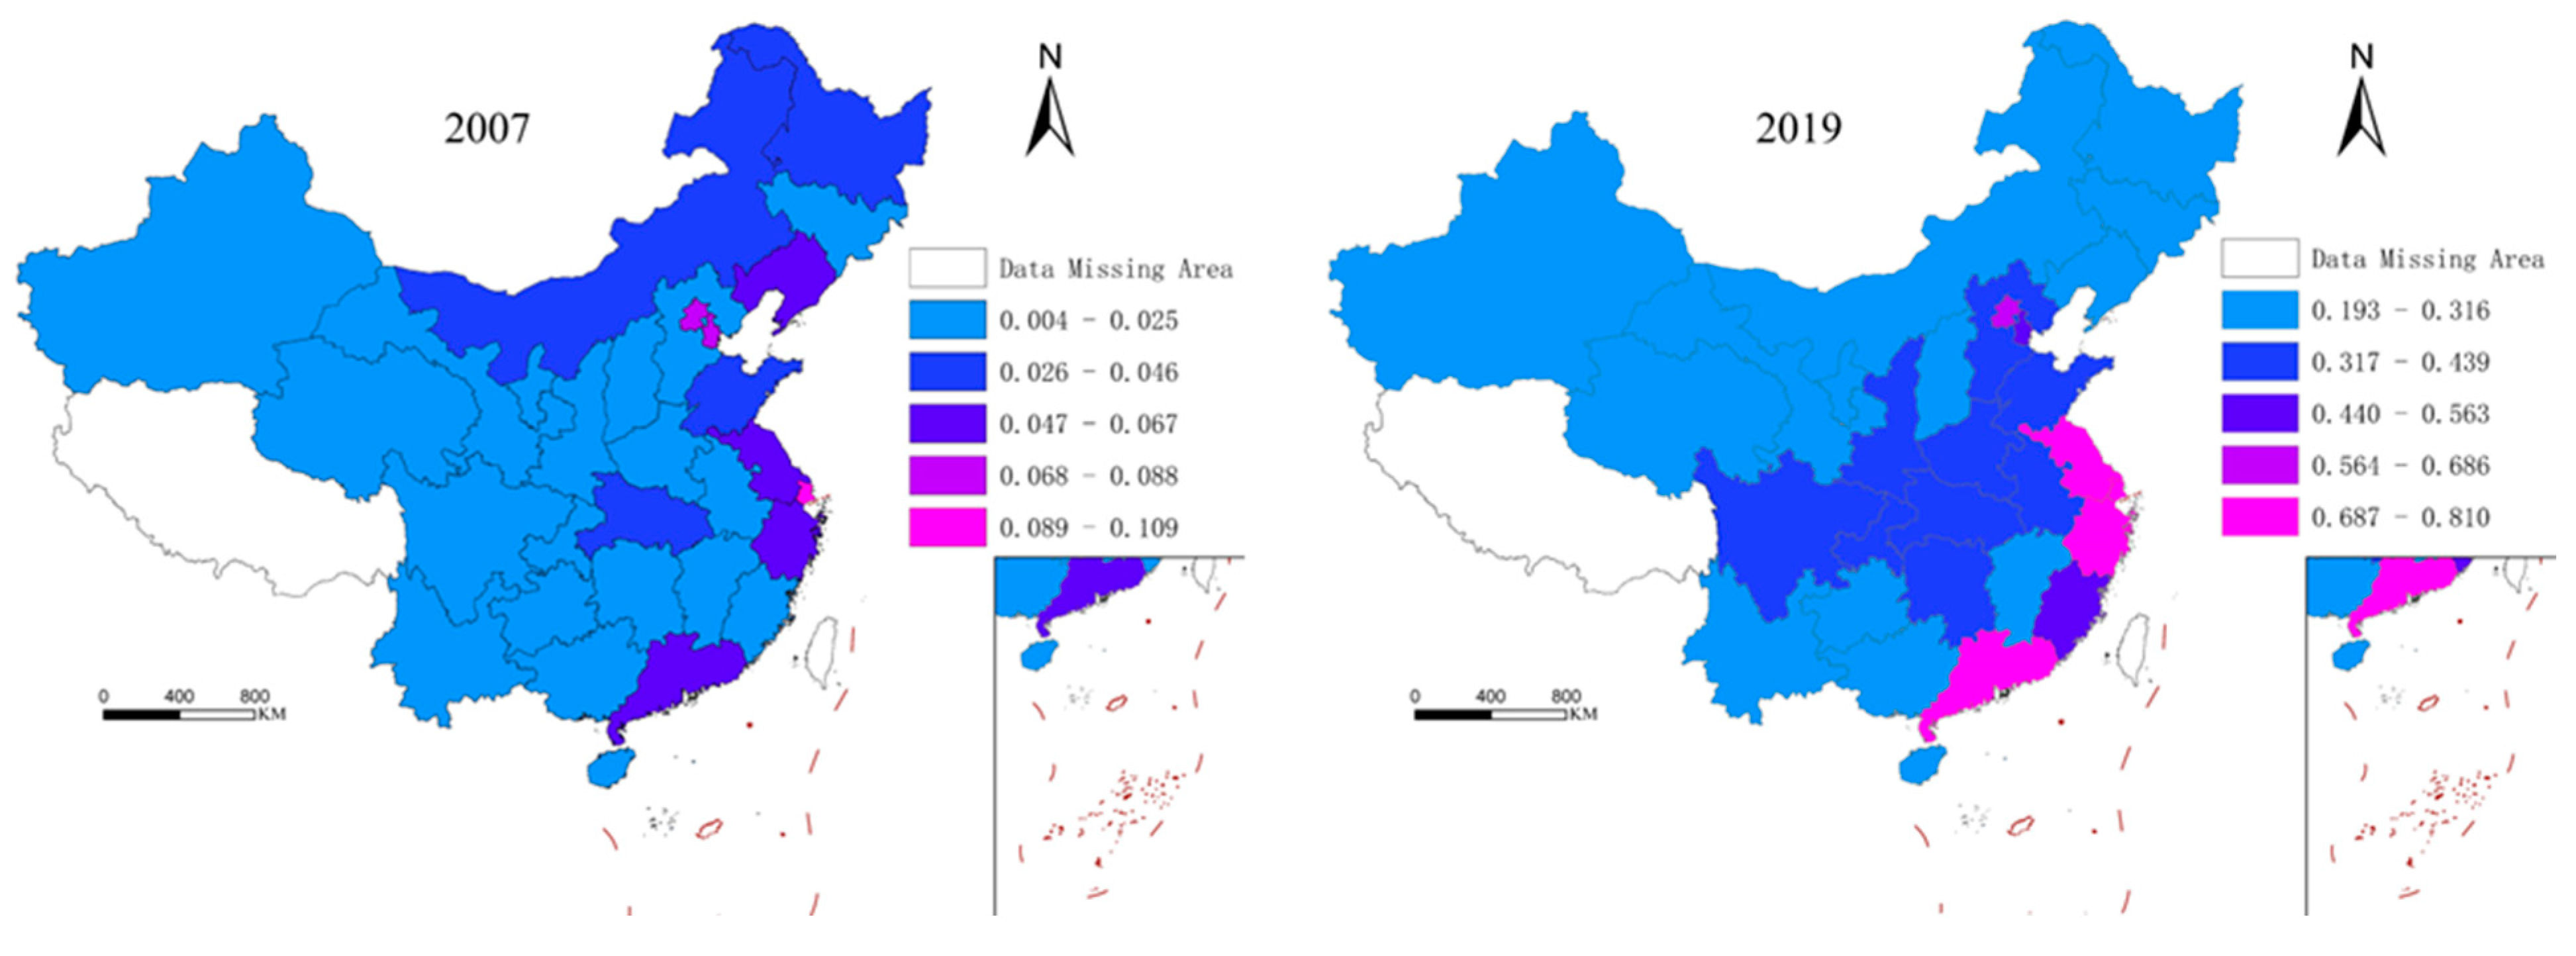
4.1. Construction and Measurement of Digital Economy Evaluation System
4.2. Variable Selection and Baseline Model Setting
5. Empirical Results Discussion
5.1. Regression Results of the Baseline Model
5.2. Robustness Tests
5.2.1. Substitution of Independent Variables and Core Independent Variables
5.2.2. Endogenous Discussion
5.3. Mechanism Analysis
6. Further Discussion
Heterogeneity Analysis
7. Conclusion and Policy Implications
8. Limitations and Future Improvement
Author Contributions
Funding
Institutional Review Board Statement
Informed Consent Statement
Data Availability Statement
Acknowledgments
Conflicts of Interest
References
- International Energy Agency (IEA). Global Energy Review: CO2 Emissions in 2021. Available online: https://www.iea.org/reports/global-energy-review-co2-emissions-in-2021-2 (accessed on 6 March 2023).
- Xinhua News Agency, China-US Joint Glasgow Declaration on Enhancing Climate Action in the 2020s. Available online: https://www.gov.cn/xinwen/2021-11/11/content_5650318.htm (accessed on 7 March 2023).
- Li, Y.; Yang, X.D.; Ran, Q.Y.; Wu, H.T.; Irfan, M.; Ahmad, M. Energy structure, digital economy, and carbon emissions: Evidence from China. Environ. Sci. Pollut. Res. 2021, 28, 64606–64629. [Google Scholar] [CrossRef]
- She, Q.Z.; Wu, L.; Zheng, J. Digital economy, economic aggregation and carbon emissions. Stat. Decis. Mak. 2022, 38, 5–10. (In Chinese) [Google Scholar]
- Li, Z.G.; Wang, J. The dynamic impact of digital economy on carbon emission reduction: Evidence city-level empirical data in China. J. Clean. Prod. 2022, 351, 131570. [Google Scholar] [CrossRef]
- Han, J.; Chen, X.; Feng, X.H. Realistic challenges and path options of digital economy-enabled green development. Reform 2022, 9, 11–23. (In Chinese) [Google Scholar]
- China Academy of Information and Communications Technology (CAICT), China Digital Economy Development Research Report (2023). Available online: http://www.caict.ac.cn/kxyj/qwfb/bps/202304/t20230427_419051.htm (accessed on 7 May 2023).
- Tapscott, D. The Digital Economy: Promise and Peril in the Age of Networked Intelligence; McGraw-Hill: New York, NY, USA, 1996. [Google Scholar]
- Mesenbourg, T.L. Measuring the Digital Economy; US Bureau of the Census: Washington, DC, USA, 2001; Volume 1, pp. 1–19. [Google Scholar]
- Negroponte, N.; Harrington, R.; McKay, S.R.; Christian, W. Being digital. Comput. Phys. 1997, 11, 261–262. [Google Scholar] [CrossRef] [Green Version]
- Kim, B.; Barua, A.; Whinston, A.B. Virtual field experiments for a digital economy: A new research methodology for exploring an information economy. Decis. Support Syst. 2002, 32, 215–231. [Google Scholar] [CrossRef]
- Knickrehm, M.; Berthon, B.; Daugherty, P. Digital disruption: The growth Multiplier, Accenture, Dublin. Available online: https://www.accenture.com/_acnmedia/PDF-4/Accenture-Strategy-Digital-Disruption-Growth-Multiplier.pdf (accessed on 23 March 2023).
- Carlsson, B. The Digital Economy: What is new and what is not? Struct. Chang. Econ. Dynam. 2004, 15, 245–264. [Google Scholar] [CrossRef]
- Xu, G.Y.; Xue, D.; Hafizur, R. Dynamic scenario analysis of CO2 emission in China’s cement industry by 2100 under the context of cutting overcapacity. Mitig. Adapt. Strateg. Glob. Change 2022, 27, 53. [Google Scholar] [CrossRef]
- Gharaie, M.; Zhang, N.; Jobson, M.; Smith, R.; Panjeshahi, M.H. Simultaneous optimization of CO2 emissions reduction strategies for effective carbon control in the process industries. Chem. Eng. Res. Design 2013, 91, 1483–1498. [Google Scholar] [CrossRef]
- Wang, A.L.; Lin, B.Q. Structural optimization and carbon taxation in China’s commercial sector. Energy Policy 2020, 140, 111442. [Google Scholar] [CrossRef]
- Kristoffersen, E.; Blomsma, F.; Mikalef, P.; Li, J. The smart circular economy: A digital-enabled circular strategies framework for manufacturing companies. J. Bus. Res. 2020, 120, 241–261. [Google Scholar] [CrossRef]
- Yi, M.; Liu, Y.F.; Sheng, M.S.; Wen, L. Effects of digital economy on carbon emission reduction: New evidence from China. Energy Policy 2022, 171, 113271. [Google Scholar] [CrossRef]
- Wang, L.L.; Chen, L.Y.; Li, Y.S. Digital economy and urban low-carbon sustainable development: The role of innovation factor mobility in China. Environ. Sci. Pollut. Res. 2022, 29, 48539–48557. [Google Scholar] [CrossRef]
- Zhao, T.; Zhang, Z.; Liang, S.K. Digital economy, entrepreneurial activity and high-quality development-empirical evidence from Chinese cities. Manag. World 2020, 10, 65–76. (In Chinese) [Google Scholar]
- Fan, J.; Wang, J.; Qiu, J.; Li, N. Stage effects of energy consumption and carbon emissions in the process of urbanization: Evidence from 30 provinces in China. Energy 2023, 276, 127655. [Google Scholar] [CrossRef]
- Zaidi, S.A.H.; Zafar, M.W.; Shahbaz, M.; Hou, F. Dynamic linkages between globalization, financial development and carbon emissions: Evidence from Asia Pacific Economic Cooperation countries. J. Clean. Prod. 2019, 228, 533–543. [Google Scholar] [CrossRef]
- Wang, Q.; Wang, S. Decoupling economic growth from carbon emissions growth in the United States: The role of research and development. J. Clean. Prod. 2019, 234, 702–713. [Google Scholar] [CrossRef]
- Du, Y.; Liu, H.; Huang, H.; Li, X. The carbon emission reduction effect of agricultural policy—Evidence from China. J. Clean. Prod. 2023, 406, 137005. [Google Scholar] [CrossRef]
- Li, X.; Xu, H. The Energy-conservation and Emission-reduction Paths of Industrial sectors: Evidence from Chinas 35 industrial sectors. Energy Econ. 2019, 86, 104628. [Google Scholar] [CrossRef]
- Hou, H.; Wang, J.; Yuan, M.; Liang, S.; Liu, T.; Wang, H.; Bai, H.; Xu, H. Estimating the mitigation potential of the Chinese service sector using embodied carbon emissions accounting. Environ. Impact Assess. Rev. 2020, 86, 106510. [Google Scholar] [CrossRef]
- Wang, R.; Liu, W.; Xiao, L.; Liu, J.; Kao, W. Path towards achieving of China’s 2020 carbon emission reduction target—A discussion of low-carbon energy policies at province level. Energy Policy 2011, 39, 2740–2747. [Google Scholar] [CrossRef]
- Shi, B.B.; Li, N.; Gao, Q.; Li, G.Q. Market incentives, carbon quota allocation and carbon emission reduction: Evidence from China’s carbon trading pilot policy. J. Environ. Manag. 2022, 319, 115650. [Google Scholar] [CrossRef]
- Zhang, W.; Li, G.X.; Guo, F.Y. Does carbon emissions trading promote green technology innovation in China? Appl. Energy 2022, 315, 119012. [Google Scholar] [CrossRef]
- Zhang, S.L.; Wang, Y.; Hao, Y.; Liu, Z.W. Shooting two hawks with one arrow: Could China’s emission trading scheme promote green development efficiency and regional carbon equality? Energy Econ. 2021, 101, 105412. [Google Scholar] [CrossRef]
- Dong, F.; Dai, Y.J.; Zhang, S.N.; Zhang, X.Y.; Long, R.Y. Can a carbon emission trading scheme generate the Porter effect? Evidence from pilot areas in China. Sci. Total Environ. 2019, 653, 565–577. [Google Scholar] [CrossRef] [PubMed]
- Haseeb, A.; Xia, E.; Saud, S.; Ahmad, A.; Khurshid, H. Does information and communication technologies improve environmental quality in the era of globalization? An empirical analysis. Environ. Sci. Pollut. Res. 2019, 26, 8594–8608. [Google Scholar] [CrossRef]
- Jayaprakash, P.; Radhakrishna, R.P. The role of ICT for sustainable development: A cross-country analysis. Eur. J. Dev. Res. 2022, 34, 225–247. [Google Scholar] [CrossRef]
- Ulucak, R.; Danish; Khan, S.U.D. Does information and communication technology affect CO2 mitigation under the pathway of sustainable development during the mode of globalization? Sustain. Dev. 2020, 28, 857–867. [Google Scholar] [CrossRef]
- Malecki, E.J.; Moriset, B. Splintering the economic space: The offshoring of corporate services. In The Digital Economy; Routledge: Abingdon, UK, 2020; pp. 137–167. [Google Scholar] [CrossRef]
- Avom, D.; Nkengfack, H.; Fotio, H.K.; Totouom, A. ICT and environmental quality in Sub-Saharan Africa: Effects and transmission channels. Technol. Forecast. Soc. Chang. 2020, 155, 120028–120040. [Google Scholar] [CrossRef]
- Zhou, X.; Zhou, D.; Wang, Q.; Su, B. How information and communication technology drives carbon emissions: A sec-tor-level analysis for China. Energy Econ. 2018, 81, 380–392. [Google Scholar] [CrossRef]
- Hamdi, H.; Sbia, R.; Shahbaz, M. The nexus between electricity consumption and economic growth in Bahrain. Econ. Model. 2014, 38, 227–237. [Google Scholar] [CrossRef] [Green Version]
- Salahuddin, M.; Alam, K. Internet usage, electricity consumption and economic growth in Australia: A time series evidence. Telemat. Inform. 2015, 32, 862–878. [Google Scholar] [CrossRef]
- Longo, S.B.; York, R. How does information communication technology affect energy use? Hum. Ecol. Rev. 2015, 22, 55–72. Available online: https://www.jstor.org/stable/24875148 (accessed on 6 May 2023). [CrossRef]
- Higón, D.A.; Gholami, R.; Shirazi, F. ICT and environmental sustainability: A global perspective. Telemat. Inform. 2017, 34, 85–95. [Google Scholar] [CrossRef]
- Faisal, F.; Azizullah, T.T.; Pervaiz, R. Does ICT lessen CO2 emissions for fast-emerging economies? An application of the heterogeneous panel estimations. Environ. Sci. Pollut. Res. 2020, 27, 10778–10789. [Google Scholar] [CrossRef] [PubMed]
- Han, J.; Chen, X. Digital economy-enabled green development: Intrinsic mechanisms and empirical evidence. Comp. Econ. Soc. Syst. 2022, 2, 73–84. (In Chinese) [Google Scholar]
- Guo, J.T.; Luo, P.L. Does the Internet contribute to total factor productivity in China? Manag. World 2016, 10, 34–49. (In Chinese) [Google Scholar]
- Aghion, P.; Howitt, P. A model of growth through creative destruction. Econometrica 1992, 60, 323–351. [Google Scholar] [CrossRef]
- Xu, X.C.; Zhang, Z.W.; Guan, H.J. China’s new economy: Role, characteristics and challenges. Financ. Trade Econ. 2020, 1, 5–20. (In Chinese) [Google Scholar]
- Salahuddin, M.; Gow, J.; Ozturk, I. Is the long-run relationship between economic growth, electricity consumption, carbon dioxide emissions and financial development in Gulf Cooperation Council Countries robust? Renew. Sustain. Energy Rev. 2015, 51, 317–326. [Google Scholar] [CrossRef] [Green Version]
- Ren, S.; Hao, Y.; Xu, L.; Wu, H.; Ba, N. Digitalization and energy: How does internet development affect China’s energy consumption? Energy Econ. 2021, 98, 105220. [Google Scholar] [CrossRef]
- Ma, S.Z.; Hu, Z.X. Does digital finance affect labor mobility?—Based on a micro perspective of China’s mobile population. China Econ. Q. 2022, 1, 303–322. (In Chinese) [Google Scholar]
- Cheng, Y.J.; Duan, X. Can the digital economy promote urban haze reduction and carbon reduction? Quasi-natural empirical analysis based on eight national big data pilot zones. Soft Sci. 2023, 1–12. Available online: https://kns.cnki.net/kcms/detail/51.1268.G3.20230313.1050.004.html (accessed on 6 May 2023). (In Chinese).
- Luo, C.Y.; Zhang, J. An economic explanation for the decline of labor income share--an analysis based on provincial panel data in China. Manag. World 2009, 5, 25–35. (In Chinese) [Google Scholar]
- Han, C.; Chen, Z.; Wang, Z. Research on the mechanism of pollution reduction effect of enterprises under energy saving target constraint. China Ind. Econ. 2020, 10, 43–61. (In Chinese) [Google Scholar]
- Sujarwoto, S.; Tampubolon, G. Spatial inequality and the Internet divide in Indonesia 2010–2012. Telecommun. Policy 2015, 40, 602–616. [Google Scholar] [CrossRef]
- Liu, C.; Wang, L. Does national broadband plan narrow regional digital divide? Evidence from China. Chin. J. Commun. 2019, 12, 449–466. [Google Scholar] [CrossRef]
- Katircioglu, S.; Katircioglu, S. Testing the role of fiscal policy in the environmental degradation: The case of Turkey. Environ. Sci. Pollut. Res. 2018, 25, 5616–5630. [Google Scholar] [CrossRef]
- Mahadevan, R.; Sun, Y. Effects of foreign direct investment on carbon emissions: Evidence from China and its Belt and Road countries. J. Environ. Manag. 2020, 276, 111321. [Google Scholar] [CrossRef]
- Disli, M.; Ng, A.; Askari, H. Culture, income, and CO2 emission. Renew. Sustain. Energy Rev. 2016, 62, 418–428. [Google Scholar] [CrossRef]
- Bano, S.; Zhao, Y.H.; Ahmad, A.; Wang, S.; Liu, Y. Identifying the impacts of human capital on carbon emissions in Pakistan. J. Clean. Prod. 2018, 183, 1082–1092. [Google Scholar] [CrossRef]
- Sheraz, M.; Deyi, X.; Ahmed, J.; Ullah, S.; Ullah, A. Moderating the effect of globalization on financial development, energy consumption, human capital, and carbon emissions: Evidence from G20 countries. Environ. Sci. Pollut. Res. 2021, 28, 35126–35144. [Google Scholar] [CrossRef] [PubMed]
- Kao, C. Spurious regression and residual-based tests for cointegration in panel data. J. Econom. 1999, 90, 1–44. [Google Scholar] [CrossRef]
- Chen, Q. Advanced Econometrics and Stata Applications; Higher Education Press: Beijing, China, 2014; p. 644. [Google Scholar]
- Shahbaz, M.; Nasreen, S.; Abbas, F.; Anis, O. Does foreign direct investment impede environmental quality in high-, middle-, and low-income countries? Energy Econ. 2015, 51, 275–287. [Google Scholar] [CrossRef]
- Seker, F.; Ertugrul, H.M.; Cetin, M. The impact of foreign direct investment on environmental quality: A bounds testing and causality analysis for Turkey. Renew. Sustain. Energy Rev. 2015, 52, 347–356. [Google Scholar] [CrossRef]
- Jiang, X.; Ding, Z.; Li, X.; Sun, J.; Jiang, Y.; Liu, R.; Wang, D.; Wang, Y.; Sun, W. How cultural values and anticipated guilt matter in Chinese residents’ intention of low carbon consuming behavior. J. Clean. Prod. 2019, 246, 119069. [Google Scholar] [CrossRef]
- Ozturk, I.; Acaravci, A. The long-run and causal analysis of energy, growth, openness and financial development on carbon emissions in Turkey. Energy Econ. 2013, 36, 262–267. [Google Scholar] [CrossRef]
- Zhou, Y.; Lin, B. The impact of fiscal transfer payments on energy conservation and emission reduction in China: Does the development stage matter? J. Environ. Manag. 2023, 339, 117795. [Google Scholar] [CrossRef]
- Huang, Q.H.; Yu, Y.Z.; Zhang, S.L. Internet development and manufacturing productivity improvement: Intrinsic mechanisms and China’s experience. China Ind. Econ. 2019, 8, 5–23. (In Chinese) [Google Scholar] [CrossRef]
- Nunn, N.; Qian, N. US food aid and civil conflict. Am. Econ. Rev. 2014, 10, 1630–1666. [Google Scholar] [CrossRef] [Green Version]
- Yu, H.; Zhu, Q. Impact and mechanism of digital economy on China’s carbon emissions: From the perspective of spatial heterogeneity. Environ. Sci. Pollut. Res. 2023, 30, 9642–9657. [Google Scholar] [CrossRef] [PubMed]


| Primary Indicator | Secondary Indicator | |
|---|---|---|
| Digital infrastructure | Fiber optic cable density | |
| Internet port access density | ||
| Internet penetration rate | ||
| Digital economy index evaluation system for provinces in China | Digital transaction | Telecommunications service volume |
| Depth of digital financial usage | ||
| Breadth of digital financial coverage | ||
| Degree of digitalization of digital finance | ||
| Digital application degree | Number of internet domain names | |
| Mobile phone penetration rate | ||
| Innovation activity |
| Variable | Symbol | Definition | Source | UoM |
|---|---|---|---|---|
| Dependent variable | CO2 | China’s CO2 emissions by province in 2007–2019 | Carbon Emission Accounts & Datasets | million tons |
| Independent variables | Digital | China’s digital economy development level by provinces in 2007–2019, calculated according to the digital economy index system | <Yearbook of China Information Industry>; <Yearbook of China Communications>; <China Statistical Yearbook>; Digital Inclusive Finance Index of Institute of Digital Finance Peking University | |
| Intermediary variable | EI | The energy intensity of each province in China is represented by the ratio of the total energy use converted into the amount of standard coal used to the total local GDP for each region from 2007–2019 | <China Energy Statistical Yearbook> | tons per yuan |
| EA | The degree of economic agglomeration in China’s provinces, is represented by the ratio of the number of employed people to the area of the administrative region in each region from 2007–2019 | <China Population & Employment Statistical Yearbook>; <China Labour Statistical Yearbook> | People/square kilometer | |
| Robot | The number of robots installed in China by the province during 2007–2019 | International Federation of Robotics (IFR) | ||
| Control variables | City | China’s urbanization rate by province in 2007–2019 | <China Statistical Yearbook> | % |
| Ind | The industrial structure of China’s provinces is represented by the ratio of tertiary sector output to total GDP for each region from 2007–2019 | <China Statistical Yearbook> | % | |
| pGDP | China’s per capita GDP by province in 2007–2019 | <China Statistical Yearbook> | RMB (yuan) | |
| Open | The degree of openness to foreign trade in each province of China is represented by the total import value from 2007–2019 | <China Statistical Yearbook> | ten thousand US dollars | |
| HC | The level of human capital in each province of China is represented by the average years of education from 2007–2019. The calculation formula is as follows: Average years of education = (number of illiterate individuals × 1 + number of individuals with primary education × 6 + number of individuals with junior high school education × 9 + number of individuals with high school and technical school education × 12 + number of individuals with college and above education × 16)/total population aged 6 and above. | <China Statistical Yearbook> | years | |
| Cul | The cultural atmosphere of each province in China is represented by the per capita number of books held in public libraries from 2007–2019. | <China Library Yearbook>; <China Cultural Heritage and Tourism Statistical Yearbook> | volumes | |
| FiscPres | The fiscal pressure of each province in China is represented by the ratio of general budget expenditure to general budget revenue from 2007–2019 | <China Statistical Yearbook> | % |
| Variable | Obs | Mean | Max | Min | Std. Dev. |
|---|---|---|---|---|---|
| 390 | 330.271 | 1700.044 | 24.983 | 274.122 | |
| 390 | 0.214 | 0.809 | 0.004 | 0.155 | |
| 390 | 0.916 | 3.315 | 0.070 | 0.505 | |
| 390 | 79.761 | 1136.601 | 0.628 | 172.075 | |
| 390 | 29,644.112 | 308,734 | 184.086 | 43,836.250 | |
| 390 | 0.552 | 0.942 | 0.282 | 0.135 | |
| 390 | 0.446 | 0.835 | 0.286 | 9.748 | |
| 390 | 44,172.79 | 164,563 | 6915 | 26,487.52 | |
| 390 | 5,457,700 | 45,500,000 | 15,914 | 9,317,580 | |
| 390 | 9.039 | 12.701 | 6.928 | 0.929 | |
| 390 | 0.632 | 3.40 | 0.16 | 0.537 | |
| 390 | 2.304 | 6.745 | 1.052 | 0.995 |
| Variables | FE | RE |
|---|---|---|
| −0.827 *** | −0.791 *** | |
| (0.189) | (0.188) | |
| 0.497 | 0.440 | |
| (0.447) | (0.412) | |
| −0.006 * | −0.007 ** | |
| (0.003) | (0.003) | |
| −0.143 *** | −0.154 *** | |
| (0.051) | (0.051) | |
| −0.031 | −0.009 | |
| (0.028) | (0.027) | |
| −0.550 | −0.450 | |
| (0.452) | (0.449) | |
| 0.108 | 0.061 | |
| (0.106) | (0.098) | |
| −0.090 ** | −0.123 *** | |
| (0.042) | (0.041) | |
| 8.293 *** | 8.050 *** | |
| (1.031) | (0.991) | |
| Hausman | 20.620 *** | |
| 0.0082 | ||
| Estimation (1) | Estimation (2) | Estimation (3) | Estimation (4) | Estimation (5) | Estimation (6) | Estimation (7) | Estimation (8) | |
|---|---|---|---|---|---|---|---|---|
| −0.868 *** | −0.790 *** | −0.802 *** | −0.725 *** | −0.726 *** | −0.723 *** | −0.827 *** | −0.827 *** | |
| (0.149) | (0.180) | (0.180) | (0.179) | (0.179) | (0.179) | (0.189) | (0.189) | |
| 0.346 | 0.355 | 0.355 | 0.403 | 0.481 | 0.497 | 0.497 | ||
| (0.445) | (0.444) | (0.438) | (0.441) | (0.447) | (0.447) | (0.447) | ||
| −0.004 | −0.008 ** | −0.008 ** | −0.008 ** | −0.006 * | −0.006 * | |||
| (0.003) | (0.003) | (0.003) | (0.003) | (0.003) | (0.003) | |||
| −0.155 *** | −0.147 *** | −0.134 *** | −0.143 *** | −0.143 *** | ||||
| (0.048) | (0.049) | (0.051) | (0.051) | (0.051) | ||||
| −0.028 | −0.029 | −0.031 | −0.031 | |||||
| (0.028) | (0.028) | (0.028) | (0.028) | |||||
| −0.464 | −0.550 | −0.550 | ||||||
| (0.447) | (0.452) | (0.452) | ||||||
| 0.108 | 0.108 | |||||||
| (0.106) | (0.106) | |||||||
| −0.090 ** | ||||||||
| (0.421) | ||||||||
| 5.703 *** | 5.496 *** | 5.694 *** | 7.482 *** | 7.773 *** | 8.624 *** | 8.626 *** | 9.007 *** | |
| (0.033) | (0.269) | (0.303) | (0.633) | (0.694) | (1.073) | (1.073) | (1.083) | |
| 0.969 | 0.969 | 0.970 | 0.970 | 0.971 | 0.971 | 0.971 | 0.971 | |
| Individual fixed effect | YES | YES | YES | YES | YES | YES | YES | YES |
| Time fixed effect | YES | YES | YES | YES | YES | YES | YES | YES |
| 33.76 *** | 17.16 *** | 12.14 *** | 11.92 *** | 9.75 *** | 8.30 *** | 7.25 *** | 6.99 *** | |
| 390 | 390 | 390 | 390 | 390 | 390 | 390 | 390 |
| Estimation (9) Substitution of Independent Variables | Estimation (10) Substitution of Core Dependent Variables | Estimation (11) Substitution of Both Independent and Dependent Variables | |
|---|---|---|---|
| −1.276 *** | −0.063 ** | −0.130 *** | |
| (0.255) | (0.025) | (0.034) | |
| −0.838 | 1.025 ** | −0.235 | |
| (0.603) | (0.432) | (0.581) | |
| 0.008 * | −0.008 ** | 0.006 | |
| (0.005) | (0.003) | (0.005) | |
| −0.343 *** | −0.169 *** | −0.383 *** | |
| (0.068) | (0.051) | (0.069) | |
| −0.074 ** | −0.032 | −0.074 * | |
| (0.038) | (0.028) | (0.038) | |
| −0.648 | −0.482 | −0.555 | |
| (0.610) | (0.460) | (0.618) | |
| 0.227 | 0.039 | 0.160 | |
| (0.143) | (0.107) | (0.144) | |
| 0.038 | −0.082 * | 0.044 | |
| (0.057) | (0.043) | (0.058) | |
| 2.191 | 8.812 *** | 2.033 | |
| (1.462) | (1.102) | (1.483) | |
| 0.946 | 0.970 | 0.944 | |
| Individual fixed effect | YES | YES | YES |
| Time fixed effect | YES | YES | YES |
| 12.01 *** | 5.20 *** | 10.44 *** | |
| 390 | 390 | 390 |
| First-Stage Regression Digital | Second-Stage Regression | |
|---|---|---|
| −1.220 *** | ||
| (0.465) | ||
| 0.452 *** | ||
| (0.055) | ||
| Control variables | YES | YES |
| Provincial fixed effect | YES | YES |
| Time fixed effect | YES | YES |
| Anderson canon.corr.LM statistic | 65.303 *** | |
| Cragg-Donald Wald F statistic | 68.381[16.38] | |
| 5.40 *** | ||
| 390 | ||
| Estimation (12) Energy Consumption per Unit of GDP | Estimation (13) Economic Agglomeration | Estimation (14) The Number of Robots Installation | |
|---|---|---|---|
| −1.053 *** | 1.002 *** | 0.408 *** | |
| (0.201) | (0.101) | (0.097) | |
| −1.549 *** | 0.158 | 1.340 *** | |
| (0.475) | (0.239) | (0.229) | |
| 0.011 *** | −0.004 ** | −0.014 *** | |
| (0.004) | (0.002) | (0.002) | |
| −0.185 *** | 0.061 ** | 0.170 *** | |
| (0.054) | (0.027) | (0.026) | |
| −0.064 ** | 0.014 | 0.049 *** | |
| (0.030) | (0.015) | (0.014) | |
| −0.114 | 0.338 | 0.344 | |
| (0.480) | (0.242) | (0.231) | |
| 0.249 ** | −0.197 *** | −0.106 * | |
| (0.113) | (0.057) | (0.054) | |
| 0.020 | −0.043 * | −0.109 *** | |
| (0.045) | (0.023) | (0.022) | |
| 3.266 *** | 1.776 *** | 6.208 *** | |
| (1.151) | (0.580) | (0.554) | |
| 0.931 | 0.998 | 0.998 | |
| Individual fixed effect | YES | YES | YES |
| Time fixed effect | YES | YES | YES |
| 10.14 *** | 21.06 *** | 39.43 *** | |
| 390 | 390 | 390 |
| Central China | −2.486 *** |
| (0.313) | |
| South China | −0.313 |
| (0.238) | |
| Southwest China | −2.160 *** |
| (0.316) | |
| Northwest China | −0.036 |
| (0.347) | |
| East China | −0.883 *** |
| (0.174) | |
| North China | −1.006 *** |
| (0.210) | |
| Northeast China | −3.054 *** |
| (0.441) | |
| Control variables | YES |
| Individual fixed effect | YES |
| Time fixed effect | YES |
| 0.980 | |
| 15.24 | |
| 390 |
Disclaimer/Publisher’s Note: The statements, opinions and data contained in all publications are solely those of the individual author(s) and contributor(s) and not of MDPI and/or the editor(s). MDPI and/or the editor(s) disclaim responsibility for any injury to people or property resulting from any ideas, methods, instructions or products referred to in the content. |
© 2023 by the authors. Licensee MDPI, Basel, Switzerland. This article is an open access article distributed under the terms and conditions of the Creative Commons Attribution (CC BY) license (https://creativecommons.org/licenses/by/4.0/).
Share and Cite
Xue, D.; Liu, T.; Li, X.; Zhao, X. Can the Digital Economy Accelerate “Carbon Neutrality”?—An Empirical Analysis Based on Provincial Data in China. Sustainability 2023, 15, 11441. https://doi.org/10.3390/su151411441
Xue D, Liu T, Li X, Zhao X. Can the Digital Economy Accelerate “Carbon Neutrality”?—An Empirical Analysis Based on Provincial Data in China. Sustainability. 2023; 15(14):11441. https://doi.org/10.3390/su151411441
Chicago/Turabian StyleXue, Dong, Tongyang Liu, Xiaomin Li, and Xiaolei Zhao. 2023. "Can the Digital Economy Accelerate “Carbon Neutrality”?—An Empirical Analysis Based on Provincial Data in China" Sustainability 15, no. 14: 11441. https://doi.org/10.3390/su151411441