Article

Determinants of Low-Carbon Logistics Capability Based on Dynamic fsQCA: Evidence from China’s Provincial Panel Data

School of Business Administration, Jimei University, Xiamen 361021, China
*
Author to whom correspondence should be addressed.
Sustainability 2023, 15(14), 11372; https://doi.org/10.3390/su151411372
Submission received: 27 June 2023 / Revised: 19 July 2023 / Accepted: 20 July 2023 / Published: 21 July 2023

Abstract

:
The fast-paced growth of the logistics industry has contributed significantly to China’s high-quality economic development. However, the growth of the logistics industry is frequently accompanied by high levels of pollution, carbon emissions, and energy consumption. How to increase low-carbon logistics capacity has emerged as a research hotspot under the dual carbon goals. This study used entropy weight TOPSIS to evaluate the low-carbon logistics capacity and dynamic fuzzy-set qualitative comparative analysis (fsQCA) to shed light on the antecedent conditions that influenced low-carbon logistics capability by using panel data from 30 Chinese provinces between 2008 and 2021. Based on the empirical results, several conclusions are drawn: (1) The comprehensive score show that while province low-carbon logistics capacity varies, most of them exhibit a general growing tendency in most provinces, where Beijing, Shanghai, Tianjin, Guangdong and Zhejiang rank among the top five. (2) Three configurations, digital empower capital intensive type, digital empower labor intensive type, and green ecology plus technology innovation type that lead to better low-carbon logistics capacity. Related policy recommendations are proposed, including strengthening the synergistic development of the digital economy and the logistics industry, promoting research and development of green and innovative technologies, and reinforcing the constraints of the dual-carbon target.

1. Introduction

China’s logistics industry has experienced fundamental changes from its beginning to rapid development after more than 40 years of reform and opening up, and its incredible accomplishments have garnered attention worldwide [1]. Currently, China has the greatest logistics industry in the world, topping all other nations in terms of cargo transport volume and number of shipments, with a total revenue of 12 trillion yuan ($1.74 trillion) in 2021, according to the National Development and Reform Commission. It is apparent that the logistics sector in China has developed into a fundamental and pillar industry, acting as an essential supporter in the growth of the country’s economy.
Despite its rapid development, the logistics sector still faces significant obstacles like high operating costs, inefficient production, high energy consumption, and emissions of carbon and air pollutants. The United Nations Environment Programme reported that the logistics industry accounts for about 10% of total global carbon emissions, with transportation as the largest source of logistics emissions [2]. Furthermore, according to data from the National Bureau of Statistics, China’s logistics industry (transportation, storage, post, and telecommunication) consumed 413.09 million tons of Standard Coal Equivalent (SCE) in 2020, accounting for about 8.29% of the overall energy usage. Obviously, the logistics sector is now a major cause of high energy consumption and serious environmental pollution [3]. Therefore, the intertwined connections between logistics activities and environmental impacts are undeniably significant. As a developing country with the world’s largest carbon emission, China has been committed to carbon reduction. At the 75th session of the United Nations General Assembly in 2020, China formally proposed the goal of achieving carbon peaking by 2030 and carbon neutrality by 2060. Under the background of “dual carbon goals,” promoting the modernization and transformation of the logistics sector, staying away from the current high energy consumption and extensive development, and striving to create eco-friendly, effective low-carbon logistics have all become necessary decisions for the long-term sustainability of the sector.
Building low-carbon logistics capacity, fostering high-quality development of the logistics industry, and protecting the environment have all steadily come under the spotlight in the context of the low-carbon constraint. As one of the important means to mitigate climate change mitigation, low-carbon logistics capacity refers to the integration of environmental sustainability into logistics activities to maintain competitiveness while reducing carbon emissions [4]. By reviewing the literature, several kinds of factors that influence low-carbon logistics capacity can be summarized as economic growth, urbanization, transportation capability, labor force, energy consumption, and governance [5,6,7,8,9]. It is observed that the effects of factors on low-carbon logistics capacity are diverse and may be mutually interactive [4]. A convergence of economic development, energy structure, scientific and technical innovation, and other influencing elements has led to the creation of green logistics [10]. However, there is currently little research that has looked into the interactions and combined effects of multiple factors (especially three or more) [11,12]. Additionally, previous research typically applied techniques like structural equation modeling, econometric models, data envelop analysis, and other quantitative or qualitative methods to examine the key factors affecting low carbon logistics capacity. Traditional quantitative approaches that aim to investigate marginal effects, such as multiple regression analysis, interpret the multiple causations between various variables. On the other hand, obtaining interaction effects for more than three variables is arduous [13]. Likewise, these methods are limited in their ability to deal with causal complexity on a holistic level as well as uncover individual variation observed in reality [14]. Therefore, for these reasons, this paper attempts to overcome these restrictions by using the dynamic fuzzy-set qualitative comparative analysis (fsQCA) approach, which emphasizes correlations between sets of antecedents and the outcome while also making explicit the configuration of factors [14].
In his book, Ragin [15] provided a thorough explanation of fuzzy-set qualitative comparative analysis (fsQCA), including a discussion of the problems that come with using a set-theoretic approach, which was considered a new path for management research [16]. Recently, fsQCA has been used in logistics research to explore the configurational paths that influence the growth of the logistics industry [17,18]. The main data used in mentioned studies was cross-sectional data, which excluded temporal influences. Some fsQCA analyses have been performed to take into account the time dimension by utilizing a method known as panel data fsQCA or dynamic fsQCA, which was created by Garcia-Castro and Ariño [19]. Consequently, dynamic fsQCA is used to analyze the joint effect of determinants on low-carbon logistics capacity, not only in the assessment of the stability of configurational paths for an outcome but also in the degree of fluctuations in the path associated with different provinces over time and the antecedents that make up these paths [20].
The rest of this paper is structured as follows. A literature review and a description of the metrics for low-carbon logistics capability are provided in Section 2. The research setting and the methodology are illustrated in Section 3. The empirical findings are discussed in Section 4, and the conclusions, limitations, and future research are covered in Section 5.

2. Literature Review

2.1. Factors Affecting Carbon Emission in Logistics Industry

Four basic categories can be drawn from previous research on the factors affecting carbon emissions in the logistics sector. The first is in terms of energy inputs directly consumed by logistics, including energy structure, energy intensity, energy efficiency, and energy prices [21,22,23,24]. Secondly, it is from macroeconomic factors, including industrial structure, economic scale, urbanization rate, cargo turnover, environmental regulation, and financial support [22,24,25,26]. Thirdly, it is considered from the logistics industry content, including logistics transportation structure, logistics transportation intensity, logistics industry labor productivity, logistics industry science and technology innovation capacity, logistics industry output scale, employee scale, and logistics enterprise average scale [22,24]. Finally, in terms of industry management degree, including the economic development of the service industry, the use of low-carbon technology in various sectors of the economy, and industry efficiency [27].

2.2. Factors of Low-Carbon Logistics Capacity

Given that the expansion of the logistics sector unavoidably worsens greenhouse gas emissions and endangers ecological sustainability while fostering economic growth. Therefore, as a potential remedy for the realistic dilemma facing the logistics industry, low-carbon logistics capacity enhancement and assessment index development have received a lot of attention in recent years. To examine the role of low-carbon logistics development in promoting low-carbon economic growth, Wang [28] constructed a regional low-carbon logistics capacity index system with a low-carbon logistics environment, low-carbon logistics strength, and low-carbon logistics potential as elements and empirically analyzed a regional sample using the fuzzy matter-element method. Li et al. [29] constructed an evaluation system of regional logistic low-carbon competitiveness from three aspects, including low-carbon logistics competitive environment, service capability and development level and measured the degree of influence of each index on regional logistics low-carbon competitiveness by projection pursuit method. Similarly, Wang et al. [4] used the entropy technique to assess regional low-carbon logistical development capacity in terms of infrastructure capacity, environmental protection capacity, business expansion capacity, and low-carbon ecological level. Zhou et al. [7] created a sequential parametric index system with infrastructure support capacity, information system guarantee capacity, operation management and operation capacity, and low-carbon ecological development capacity as elements with the intention of analyzing the interaction status between regional low-carbon logistics capacity subsystems and the degree of coordination between them, who came to the conclusion that the coordination level of each subsystem index fluctuates significantly over time. Correspondingly, from previous studies, each factor not only affects low-carbon logistics capacity but also interacts with other factors to have an impact as a whole. Additionally, due to the time shift, their impact on low-carbon logistics capacity will fluctuate.

2.3. fsQCA in Logistics Issues

Fuzzy-set qualitative comparative analysis (fsQCA) is one the widest and most emerging research technique to analyze the combined impact along with correlation to identify the configurations [11,30]. Asymmetry equations and causal complexity in the context of fsQCA lead to multiple paths leading to the same outcome with various combinations [31]. Therefore, fsQCA is widely applied in the analysis of logistics issues. Hartmann et al. [32] used fsQCA to explore how drivers at multiple levels interact to shape the fleet decisions in one of Europe’s leading third-party logistics providers operating a large, multi-country road transportation network. The study of Vlachos [33] was to empirically study the necessary and sufficient antecedents of customer loyalty to logistics service providers (LSPs) by using fsQCA. Moreover, the fsQCA was applied to identify the causal configuration relations for higher values of economic development by considering the influence of logistics competitiveness and logistics cost [34]. Despite the fact that fsQCA has been utilized extensively in previous research, the data it uses do not take into account temporal impacts [35]. As a result, some academics have lately begun to take these impacts into account by inventing dynamic fsQCA and using it to conduct research in the field of environmental pollution [14], entrepreneurial attitudes [35], and R&D intensity [36].

2.4. Entropy Weight TOPSIS

Entropy weight TOPSIS, which combines entropy and TOPSIS, is a thorough evaluation technique. An objective weighting approach to give weights to each index is the entropy weight method, which introduces the idea of information entropy [37]. The term “entropy” comes from physics and describes the level of intrinsic chaos in a system. Using the concept of information entropy, the more chaotic a system is, the greater the degree of uncertainty, the less information it can carry, and the lower its weight [38]. Compared to the weighting methods such as AHP, ANP, and DEMATEL, which require expert scoring to determine the weights, the entropy weighting method is more objective. Furthermore, some novel methods were proposed in the last decade to assign a weight, such as BWM, CILOS, and IOCRIM [39]. Entropy uses the information carried by the entropy value of the data itself to calculate the weights, according to the level of numerical dispersion across indicators, to provide a basis for the comprehensive evaluation of multiple indicators and make the research findings more unbiased and fair.
The TOPSIS (Technique for Order Preference by Similarity to an Ideal Solution) method is a comprehensive distance-based evaluation method, first proposed by Hwang and Yoon in 1981, which is known as the “superior-inferior solution distance method” [37]. The method uses the proximity of the evaluation alternative to the idealized target to rank the merits of each evaluation alternative [40]. Among the evaluation methods of PROMETHEE, VIKOR, and Fuzzy AHP, TOPSIS has a relatively simple calculation algorithm, that can analyze quantitative data and fully use data information [41]. Entropy weighting, combined with the TOPSIS method, has been widely used in various evaluation-based studies [42,43]. In addition, with reference to the logistics context, entropy weight TOPSIS was applied to the issue related to the regional logistics industry’s high-quality development level measurement and green logistics partner selection [44,45].
To sum up, according to the analysis of the above three parts, there are numerous pieces of literature on the low-carbon logistics capacity with different influencing factors and methods. Nonetheless, there are relatively few studies on the multi-factor interaction and low-carbon logistics capacity. Additionally, the temporal effects are absent from the causal combination of the variables affecting low-carbon logistics capacity using fsQCA. In light of this, an entropy weight TOPSIS is used to assess the provinces’ capacity for low-carbon logistics. Besides, this paper uses dynamic fsQCA to examine the causal complexity of low-carbon logistics capacity at the province level incorporating temporal effect and offering low-carbon development paths for the logistics industry.

3. Methodology

Low-carbon logistics capacity evaluation is a typical multi-criteria decision-making (MCDM) issue, which utilizes multiple measurement indicators for assessing provincial low-carbon logistics capacity. As a generally used MCDM method, the technique for order preference by similarity to an ideal solution (TOPSIS) is a methodology used to sort finite evaluation objects according to their proximity to the ideal solution, which has been widely used to evaluate concerns [42,46]. In order to highlight the varying degrees of importance of various indicators in the evaluation index, this paper employs the entropy method to calculate the weights for multiple indicators and then combines the TOPSIS model to evaluate and rank the low-carbon logistics capacity [47,48]. Further, in order to identify the multifactor combination influencing the effect of regional low-carbon logistics capacity, this paper will use the dynamic fsQCA model to conduct a comparative analysis of low-carbon logistics capacity and put forward corresponding countermeasure suggestions to accelerate the process of regional low-carbon logistics capacity construction with high quality. This study next illustrates the entropy weight TOPSIS model and the dynamic fsQCA model, respectively.

3.1. Entropy Weight TOPSIS

In the traditional TOPSIS method, the assumption that each indicator weight is equivalent by default contradicts reality. To that end, this paper employs the entropy weight TOPSIS approach to assess low-carbon logistics capability, which is a hybrid of the entropy and TOPSIS methodologies and can effectively leverage both. To overcome the arbitrariness of subjective assignment, this paper gives weights to various indicators and quantifies them using the entropy weight approach. Furthermore, the TOPSIS technique analyzes and ranks the distance between each object and the best object, allowing the findings to fully reflect the true scenario. The specific steps of the method are as follows:
Step 1: Assume that there are m evaluation objects and n evaluation indicators for each object, and create an evaluation matrix of regional low-carbon logistics capacity level.
X = ( x i j ) m n , ( i = 1 ,   2 ,   3 , , m ; j = 1 ,   2 ,   3 , , n )
Step 2: Normalization processing of the raw matrix data. The benefit attributes indicate that all the chosen attributes are of benefit (the higher, the more preference). The cost attributes, on the other hand, are the opposite, indicating that the higher, the worse.
Benefit   attributes :   x i j = x i j min ( x i j ) max ( x i j ) min ( x i j ) ;  
Cos t   attributes :   x i j = max ( x i j ) x i j max ( x i j ) min ( x i j ) .  
Step 3: Calculate the information entropy H j and weight w j .
k = 1 ln m ;  
p i j = x i j i = 1 m x i j ;  
H j = k i = 1 m p i j × ln p i j ;  
w j = ( 1 H j ) j = 1 n ( 1 H j ) ,   0 w j 1 ,   and   j = 1 n w j = 1 .  
Step 4: Calculate the normalized evaluation matrix based on the weights and determine the positive-ideal solution (PIS) Y j + and negative-ideal solution (NIS) Y j .
Y = y i j = w j × ( x i j ) m n , ( i = 1 ,   2 ,   3 , , m ; j = 1 ,   2 ,   3 , , n )
Y j + = max ( y 1 j , y 2 j , y 3 j , , y n j ) ,   Y j = min ( y 1 j , y 2 j , y 3 j , , y n j )
Step 5: The Euclidean distance between the object of study and the optimal and worst solutions.
D i + = j = 1 n ( Y j + y i j ) 2 ,   D i = j = 1 n ( Y j y i j ) 2
Step 6: Calculate the comprehensive evaluation score Z i based on the distance values of Equation (10).
Z i = D i D i + + D i ,   Z i [ 0 , 1 ] .  
Here, the closer Z i is to 1, the stronger the low-carbon logistics capacity of province i.

3.2. Dynamic QCA

To analyze the combination effect exerted by determinants on low-carbon logistics capacity, the fuzzy-set qualitative comparative analysis (fsQCA) was used. In the book titled Redesigning Social Inquiry: Fuzzy Sets and Beyond, Ragin [15] provided a thorough explanation of fsQCA, along with information on its associated set-theoretic approach. Its use as a method is growing in the fields of business and the social sciences [20,49], particularly in the study of logistics and sustainable development [11,14,50,51]. The analysis is based on set theory, and it uses Boolean minimization, fuzzy-set theory, and combinatorial logic to identify the combinations of case conditions that might be necessary or sufficient to result in an outcome [52]. As a result, fsQCA employs an inductive methodology to identify the configurational relationships between conditions and outcomes [53].
As a technique, fsQCA has also undergone development, particularly in regard to its proper application to panel data [19]. The dynamic fsQCA, considering the temporal effect and cross-sectional effect simultaneously, recognizes the intrinsic panel data structure and suggests a new set of generic descriptive metrics for assessing set-theoretic relationships for such panel data. Despite the fact that the dynamic fsQCA deviated from the central ideas of consistency and coverage, Garcia-Castro and Ariño [19] proposed guidelines for assessing how stable the consistencies and coverage are across cases (within consistency and coverage) and over time (between consistency and coverage). Consequently, three alternative forms of consistency are proposed by dynamic fsQCA: pooled consistency (POCONS), between consistency (BECONS), and within consistency (WICONS). Specifically, BECONS evaluates the cross-sectional consistency for each year, WICONS measures the consistency of the relations across time for each case, and POCONS assesses the consistency of each causal combination [36]. In addition, distance is the key to be taken into account in the dynamic fsQCA. The distances between BECONS and POCONS represent how stability a consistency has held over time. As a result, the smaller the distance, the more stable the consistency. If it is high, it is important to assess the temporal effect on the panel. The distances between the WICONS and POCONS were also computed to assess how the WICONS vary between cases [35].
According to the prior studies, the basic steps in dynamic fsQCA are shown in Figure 1. Calibration is the first step after data collection, which determines the degree of membership for conditions and the outcome in the set they represent. In the following, a truth table should be generated, which is a data matrix for necessity and sufficiency analyses. Any condition that should be present or absent in order to achieve the outcome can be found in the necessity analysis, with a consistency criterion over 0.9 [54]. Thereafter, the sufficiency analysis examines every possible logical combination of causal conditions that could result in the outcome, which uses a raw consistency benchmark of sufficiency analysis above 0.8 accompanied by a benchmark for proportional reduction in inconsistency (PRI) score of over 0.65 [55]. Finally, the causal configuration analysis can be drawn according to the complex, parsimonious, and intermediate solutions.

4. Variables Selection and Data Collection

4.1. Variables Selection and Measurement

Considering the previous literature review and referencing Che et al. [6], Zhou et al. [7], and Xiang et al. [47], this paper selects the outcome variable and antecedent conditions accordingly. The outcome variable is the low-carbon logistics capability (LCL). This concept comes from the low carbon economy, with the goal of low energy consumption, low pollution and low emissions. This variable represents the ability to apply energy efficiency technologies, renewable energy technologies, and greenhouse gas reduction technologies to minimize carbon emissions and environmental pollution from logistical activities [7,9]. The interpretation of the outcome is that the presence of the outcome indicates a high level of low-carbon capacity, while the absence denotes a low one. Based on the antecedent conditions, each provincial low-carbon logistics capacity score is calculated using the entropy weight TOPSIS.
The antecedent conditions used are FIX, EMP, RND, TEL, MOB, CAB, STE, ENI, and COI. FIX is the fixed assets investment in the logistics industry, which is represented by the total amount of fixed assets investment. Since extending the scale of the logistics industry and enhancing infrastructure might result in better resource utilization [3,56], so a high fixed assets investment would typically result in low-carbon logistics.
EMP assesses how many practitioners are employed in the logistics industry as a percentage of all practitioners. As an essential measure of low-carbon logistics development, the ratio can show the status of talent pools for industrial development, reflecting the level of logistics production technology [56,57].
The cornerstone for logistics services is road network density (RND), which means that the greater the RND, the greater the transportation capacity [58]. Moreover, a denser road network makes it easier to meet the demand for logistics services, which lowers the chance of traffic congestion and boosts the logistics industry’s environmental efficiency [7]. This variable is calculated as the ratio of paved road length to paved road area in each province.
The first three factors are related to the infrastructure support capabilities of low-carbon logistics, and the advancement of information technology also favors the growth of low-carbon logistics capacity. The digital economy has grown significantly in recent years, and it also encourages the transformation of the logistics industry to low-carbonization [59]. Therefore, the total amount of telecommunication services (TEL), the mobile telephone services (MOB), and the cable line length (CAB), which are all indicators of information technology, may raise the level of provincial information development, which in turn can reduce the environmental impact of the logistics industry while also boosting the industry’s effectiveness [60,61,62]. These three factors are measured by the total amount of telecommunication services, mobile telephone users as a percentage of the resident population, and the length of long-distance fiber-optic cable lines, respectively.
Scientific and technological advancements assist technological growth, and technological advancements result from financial investments in them. For the logistics industry to enhance low-carbon logistics capability and transition to low-carbonization, low-carbon technology development is essential [63]. It is also inextricably linked to spending on science and technology. As a result, promoting low-carbon logistics was more advantageous as a greater expenditure in low-carbon science and technology [64]. Hereof, with reference to the study of Zhou et al. [7], per capita science and technology expenditure (STE) is used to indicate the level of science and technology.
Energy consumption is a major contributor to carbon emissions. Similarly, energy use in the logistics industry contributes significantly to carbon emissions [65,66]. The logistics industry’s energy consumption intensity (ENI) is one of the elements influencing the low-carbon logistics capacity under the low-carbon constraint. Therefore, ENI measures the energy consumption per unit of output value, indicating the degree to which the logistics industry uses energy in economic activities.
The COI stands for the logistics industry’s carbon emission intensity, which indicates the amount of carbon emitted per unit of GDP. The COI is determined by dividing the total carbon emissions from the logistics industry by the industry’s value added. In general, the COI decreases as logistical carbon resource utilization increases and low-carbon ecological capability increases [7].
Within this framework, the configuration of nine driving factors that may lead to low-carbon logistics capacity is shown in Figure 2.

4.2. Data Collection

This paper, constrained by data availability, used panel data from 30 Chinese provinces between 2008 and 2021 (with the exception of Tibet, Taiwan, Hong Kong, and Macao). The logistics industry in this paper includes transportation, storage, and post industries, so the data required in this paper are adopted from these three industries. All data of selected variables come from China Statistical Yearbook and Provincial Statistical Yearbooks.
The statistics for the remaining seven of the nine antecedent conditions, with the exception of the energy consumption intensity and carbon emission intensity, can be obtained directly or easily derived from the aforementioned statistical yearbooks. After converting the energy consumption of the logistics sector into Standard Coal Equivalent (SCE) for each province using the conversion factors for each type of energy, the industry’s overall energy consumption can be determined. Table 1 lists the conversion factors.
Additionally, the many sorts of energy consumed in logistical activities result in carbon emissions. Therefore, using the method outlined in the 2006 IPCC Guidelines for National Greenhouse Gas Inventories, Equation (12) can be used to determine the carbon emissions from the logistics sector.
In addition, carbon emissions from logistics activities originate from emissions caused by the various energy consumed in logistics activities. Therefore, the carbon emissions from the logistics industry can be calculated by Equation (12) according to the method in the 2006 IPCC Guidelines for National Greenhouse Gas Inventories.
Q = i = 1 n Q i = i = 1 n E i · N C V i · C E F I · C O F i
where Q is the total carbon emissions; i is the energy type; Ei is the consumption of the ith energy source; NCVi represents the average low calorific value of the fuel item i; CEFi represents the carbon content per unit calorific value of the fuel item i; COFi represents the carbon oxidation rate of the fuel item i; NCVi⋅CEFi⋅COFi is the factors of carbon emission from fossil gas energy, which is shown in Table 2.

5. Empirical Study

5.1. Low-Carbon Logistics Capability Evaluation

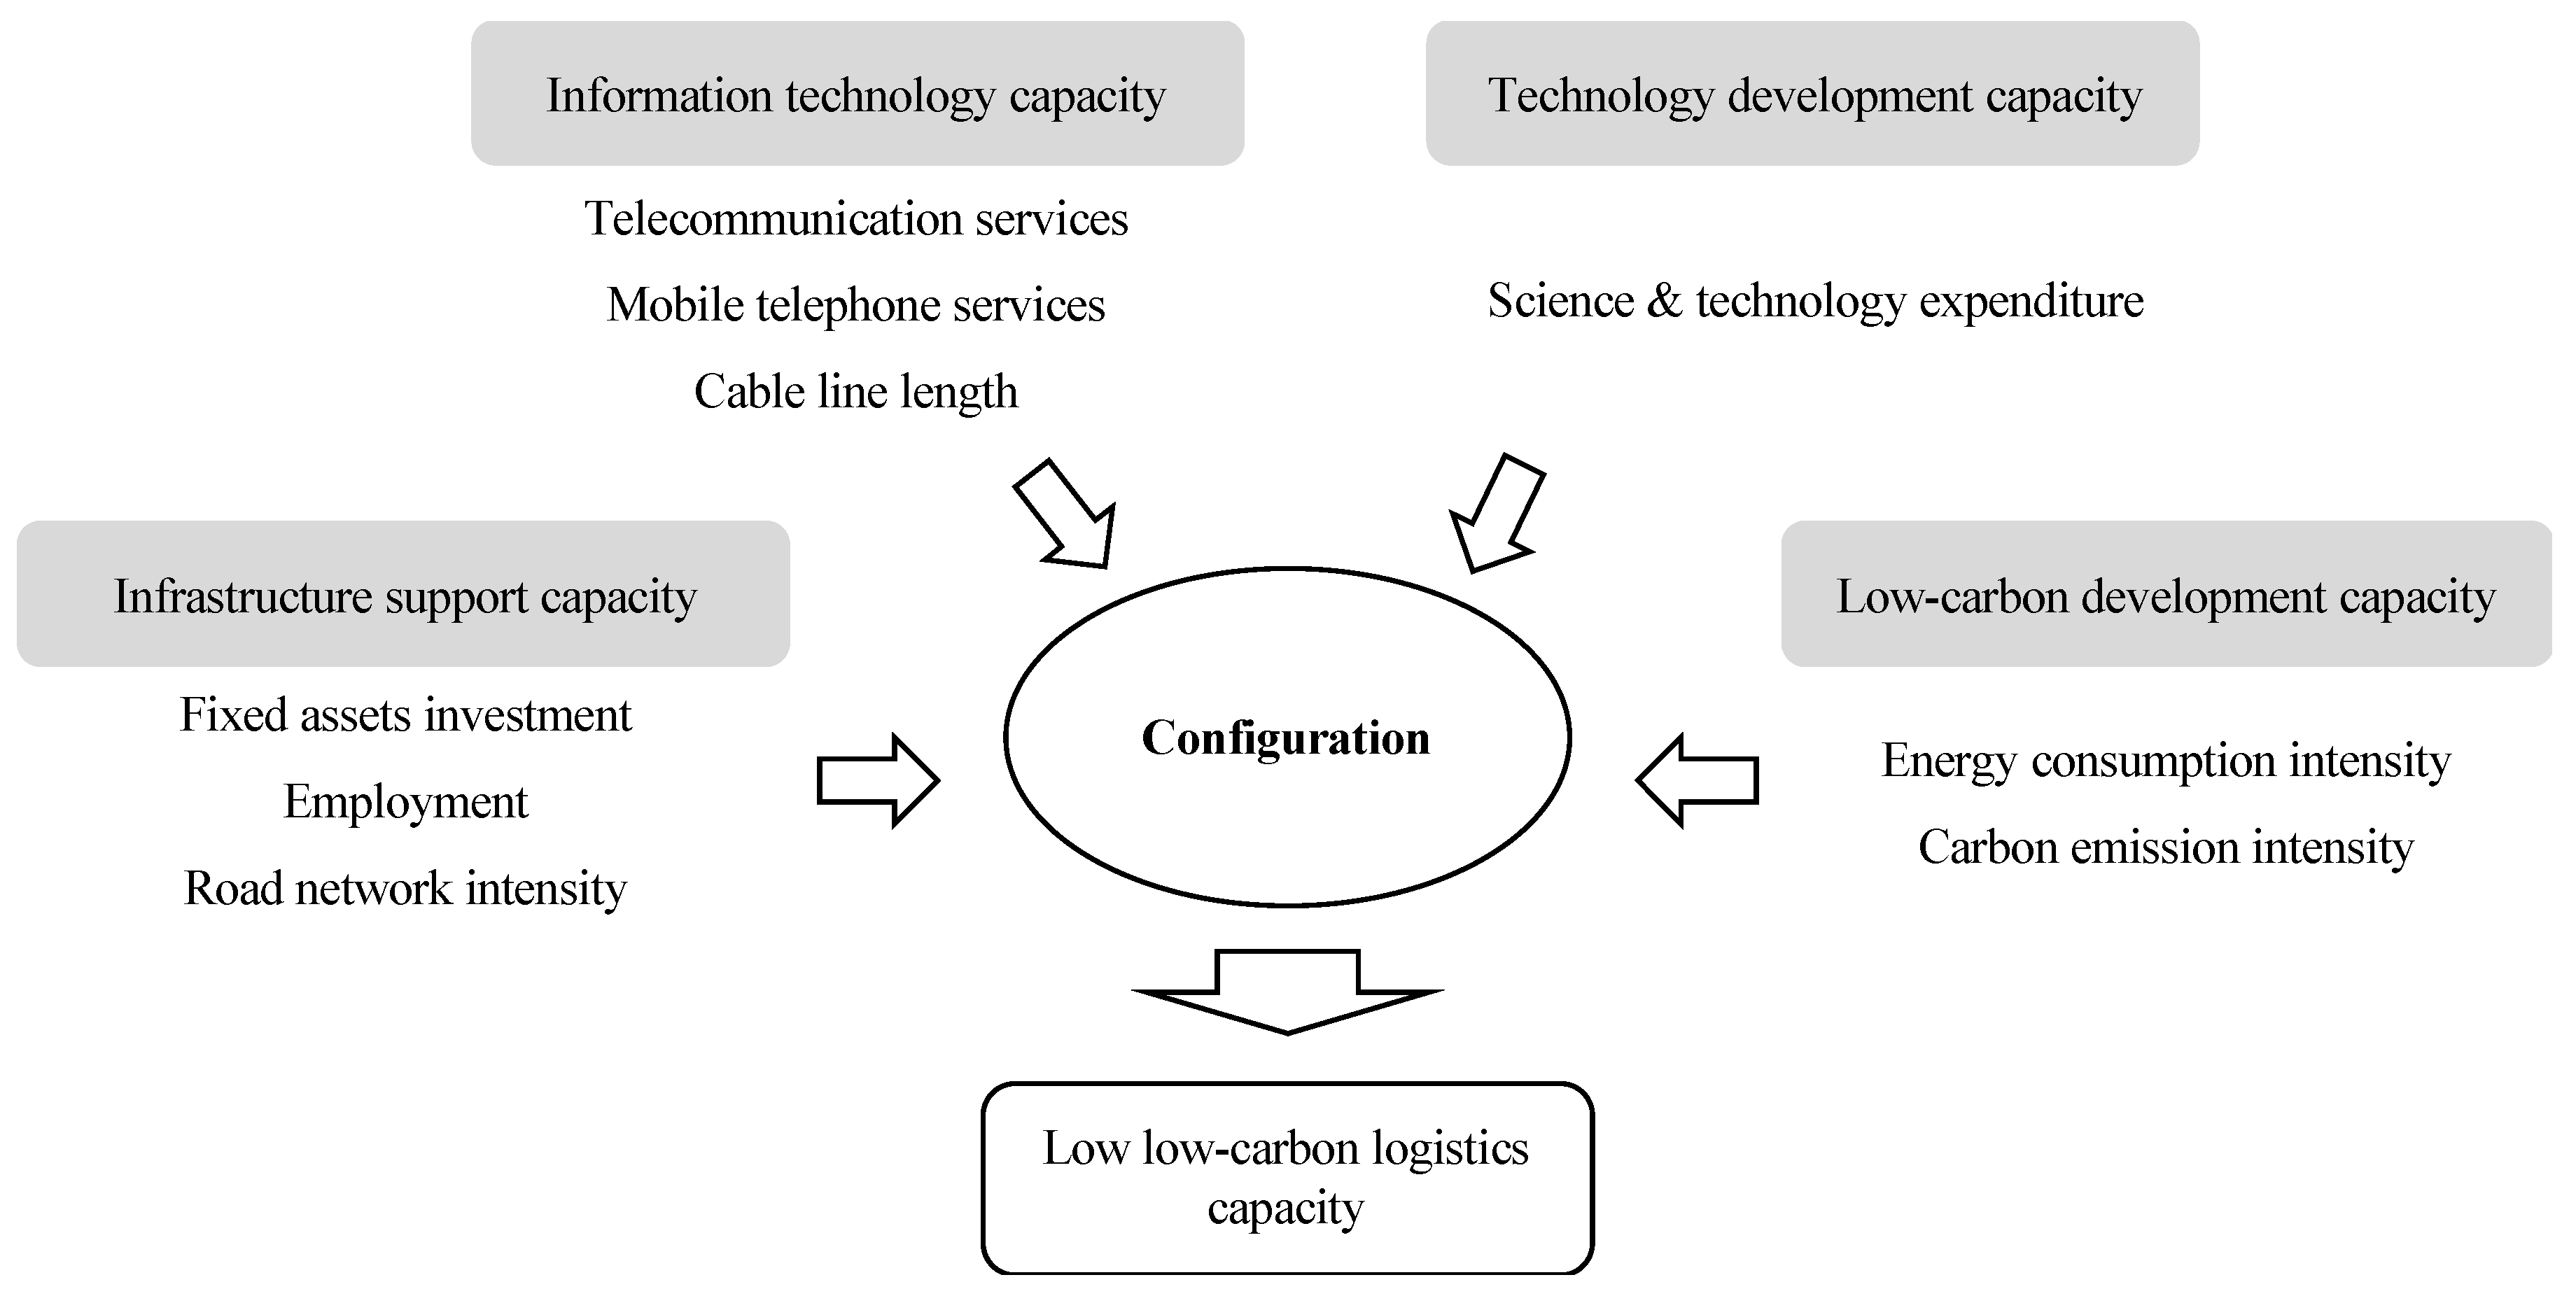
Since assessing low-carbon logistics capacity is a common MCDM problem, TOPSIS, in combination with entropy weight, is used to create a complete score of provinces’ low-carbon logistics capacity in China. Raw data needs to be normalized for the subsequent computation processes in accordance with the prior computation steps. Except for the energy consumption intensity and carbon emissions intensity, all of the outcome variables and antecedent conditions are benefit attributes. Table 3 then contains the average weights and sub-year weights of the antecedent conditions. In accordance with the entropy weight method, the top three most influential of the nine influencing factors are STE, TEL, and MOB, whereas the last three are RND, ENI, and COI. A data-driven approach reveals that improving low-carbon logistics capacity requires the development of technology and information system. Conversely, the provinces continue to drive the development of the logistics industry using a crude growth approach that is defined by high energy consumption, high pollution, and high emission. Future logistics industry growth should be mindful of restrictions on energy consumption and carbon emissions in order to meet the dual carbon goal.
Consequently, Table 4 displays the comprehensive scores of the province low-carbon logistics capacity by using TOPSIS, in combination with entropy weight.
From this result, we can draw three conclusions as follows. First, the low-carbon logistics capacity of each province fluctuates over the sample period. Second, Beijing, Shanghai, Tianjin, Guangdong, and Zhejiang rank in the top five of each province, while Guizhou, Jilin, Guangxi, Shanxi, and Gansu rank last. Finally, based on the scores, the 30 provinces and cities can be divided into three major categories. One part is the provinces whose trends remain largely unchanged, including Beijing and Tianjin; the other part is the provinces with declining trends, including Shanghai and Liaoning. The rest are provinces with an upward trend.

5.2. Dynamic QCA Analysis

5.2.1. Data Calibration

Following the basic steps outlined above, the original data should be calibrated to a fuzzy-set membership degree ranging from 0 to 1, which represents the membership of a variable [15]. As described by Woodside [13], full membership, crossover (neither in nor out), and full non-membership are denoted by 0.95, 0.5, and 0.05, respectively. Table 5 displays the calibration values and fuzzy value descriptive statistics for each condition and outcome.

5.2.2. Necessity and Sufficiency Analyses

According to the analysis of the necessary requirements, a necessary condition must be present in every occurrence of an outcome [15]. Alternatively, the outcome occurs when that condition occurs, even though the outcome occurs under other conditions [36]. The consistency must be larger than 0.9 in order to qualify as a required condition [54]. The overview of antecedent conditions for low-carbon logistics capability is shown in Table 6. There is no essential condition because, as in this study, none of the conditions have a consistency higher than 0.9.
After the necessary conditions were examined, the sufficient conditions were analyzed. To offer all theoretically feasible configurations of variables in 2k rows (k = number of variables), a truth table should be built, where each row represents a particular configuration. The truth table lists all possible logical combinations as well as cases that satisfy each combination. Logical reminders that contained no cases were not included in the analysis. As stated by Misangyi and Acharya [55], the raw consistency benchmark of sufficiency analysis should be more than 0.8 and be followed by a standard for PRI (proportional reduction in inconsistency) score of over 0.65 in order to avoid “simultaneous subset” relations of configurations in both the outcome and its absence [14,67]. The cut-off consistency and PRI in this study are 0.9 and 0.75, respectively.
As the intermediate solution meets the theoretical justifications and includes simplifying assumptions, this paper focuses on the intermediate solution accompanied by a parsimonious solution. The overall findings for the full panel are shown in Table 7. The recommendation given by Schneider and Wagemann [68] is that the solution consistency should be greater than 0.75. Additionally, the coverage should range from 0.25 to 0.65 [15]. In terms of this paper, the results met the standards for consistency and coverage, which are 0.967 and 0.469, respectively.
In Table 7, there are three configurations that illustrate the possible causal relationships that led to high low-carbon logistics capacity. The configuration with higher coverage (0.377) and considerable consistency (0.978) is FIX*~EMP*RND*TEL*MOB* STE*~COI. This configuration is preferable in terms of road network density, telecommunication service, and mobile phone services but worse in terms of carbon emission intensity. The configuration can be labeled as digital empower capital intensive type because it includes two core conditions that represent the advancement of information technology and one core condition that represents infrastructure support, along with fixed asset investment and science technology expenditure as edge conditions. The representative provinces are Guangxi, Guizhou, and Qinghai, which are located in the western region. In order to increase the level of low-carbon logistics capacity, this configuration offers a traditional path that encourages infrastructure development through the growth of the digital economy.
The second configuration, ~FIX*EMP*RND*TEL*MOB*~CAB*STE*~COI, has substantial coverage (0.241) and considerable consistency (0.960). Compared to the first configuration, the core and edge conditions are nearly identical, with the exception of the absence of fixed asset investment and employment as a peripheral causal condition. This configuration indicates that provinces with high employment levels have better low-carbon logistics capacity even though they spend less on fixed assets and are subject to less stringent carbon emission intensity restrictions. Consequently, this configuration is labeled as a digital empower labor-intensive type. The typical cases included Guangdong and Henan, where approximately half of all practitioners work in the logistics industry.
The third configuration is EMP*RND*TEL*MOB*~CAB*STE*ENI*COI, which has acceptable coverage (0.264) and considerable consistency (0.954). Specifically, this configuration featured low cable line length, high telecommunication services, mobile phone service, science and technology expenditure, energy consumption, and carbon emission intensity. Therefore, this paper labels the third configuration as a green ecology plus technology innovation type. Shanghai and Jiangsu, as economically advanced regions, have experienced rapid economic development leading to technological advances while reducing energy consumption and carbon emissions to support low-carbon development. Additionally, Guizhou has increased its expenditure on science and technology as a result of the setting up of the Ecological Civilization Pilot Zone and the incentives policies. This has increased the level of green technology innovation in the region and enhanced the capacity for low-carbon logistics, which is consistent with Zhang and Hu [69].

5.2.3. Analysis of Consistency and Coverage Distances

Table 8 lists the between consistency (BECONS), within consistency (WICONS), and the adj-distances of BECONS and WICONS for each configuration. The consistency analysis reveals that either the pooled consistencies (POCONS) or each year’s consistency are more than the cutoff of 0.8 [36]. There is no indication of cross-sectional or temporal impacts when the adj-distances of WICONS (0.052, 0.063, and 0.052) and BECONS (0.033, 0.050, and 0.037) are both less than the cutoff of 0.1. Despite the fact that there is no heterogeneity between or within clusters, the BECONS adj-distances are greater than the WICONS adj-distance and are not equal to zero, which causes the time effects to dominate the cross-sectional impact [19].
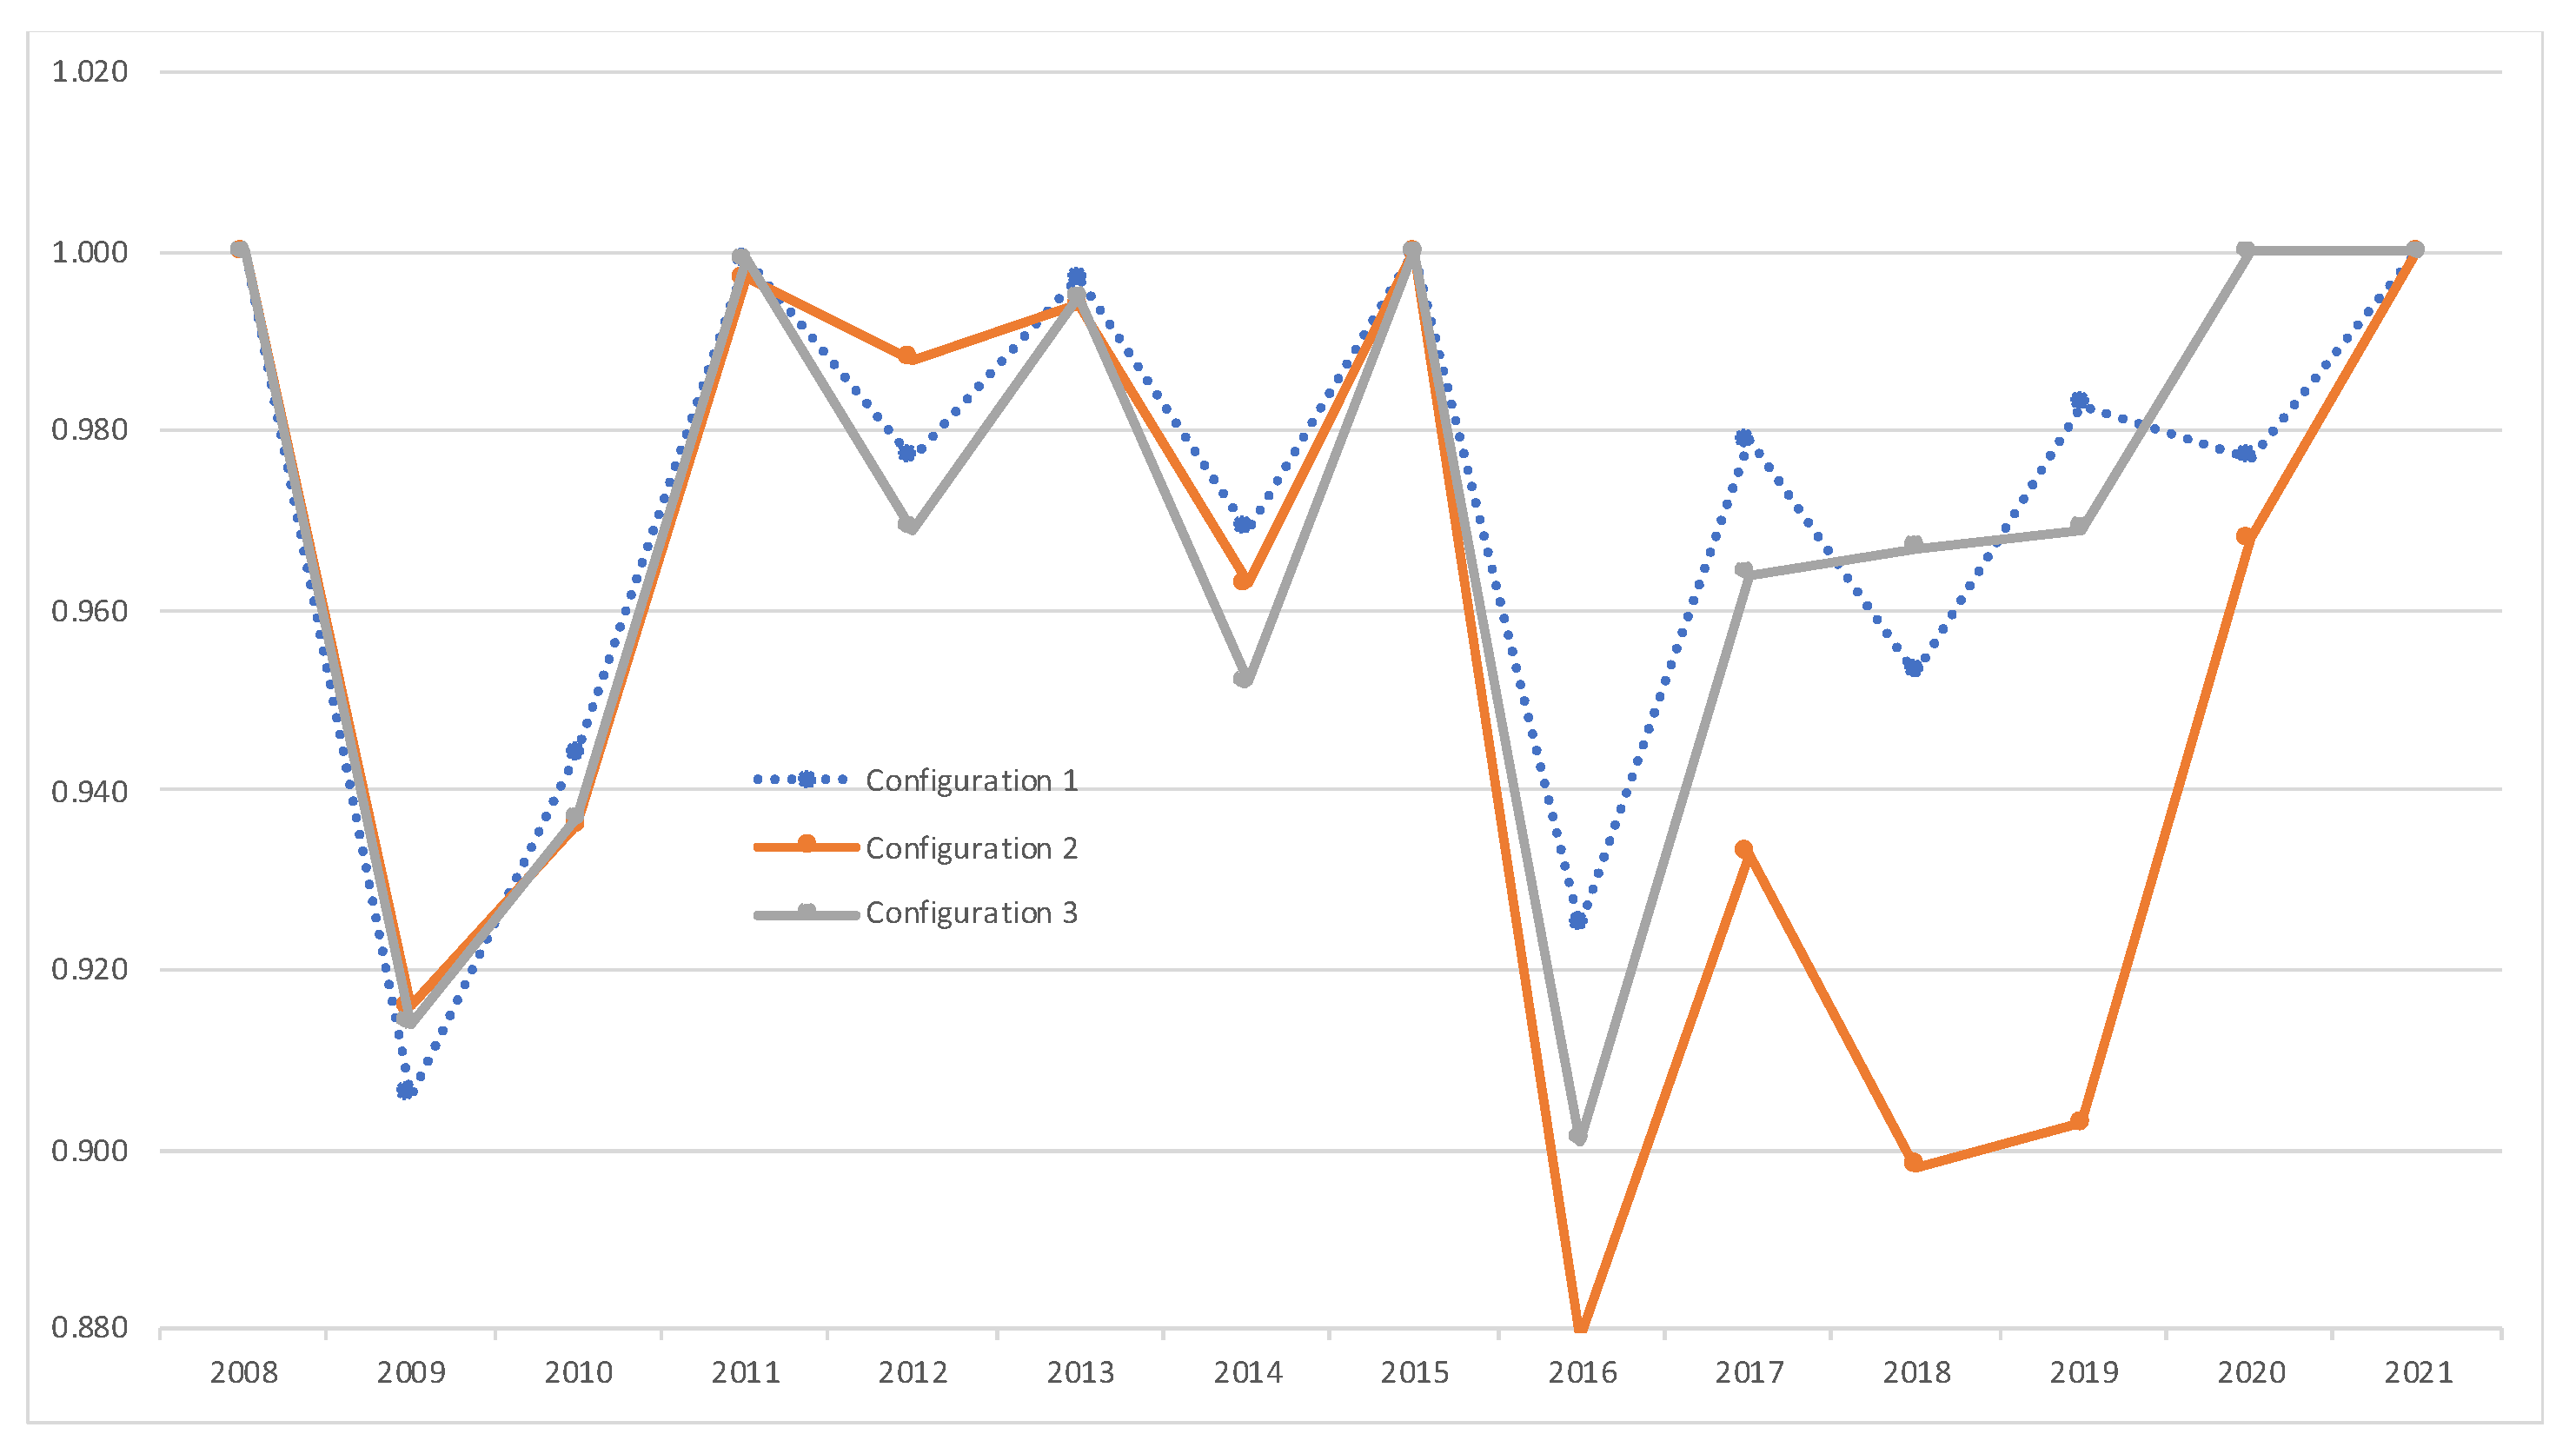
The analysis of BECONS reveals that they had a largely stable evolution across time, although there was some period volatility, as seen in Figure 3. The findings show that the inclusion of the logistics sector as a low-carbon pilot industry, as well as the development of related concepts and policies like the low-carbon economy and dual-carbon targets, have had an effect on low-carbon logistics capacity. These three configurations have insignificant cross-sectional effects and great consistency over time for each province in terms of WICONS. In addition, pooled coverage, i.e., POCOV (0.398, 0.274, and 0.266) and the annual between coverage (BECOV) are included in Table 8. The table can be analyzed to verify that BECOV has evolved smoothly. As a result, the coverages reflect that the configurations have an important potential to explain the low-carbon logistics capacity.

5.3. Robustness Analysis

This paper employs three different calibration values to examine the results’ validity, which are 0.90, 0.50, and 0.10, respectively. The three configurations are returned by the intermediate solution in essentially the same form. The results’ validity is thus supported by the robustness analysis.

6. Discussion and Conclusions

The rapid growth of China’s economy is increasingly being fueled by the fast-paced development of the logistics industry. However, at the same time, China, one of the carbon emission-producing industries with the quickest growth rates, also relies heavily on the logistics industry. Determining the critical elements influencing the development of low-carbon logistics and strengthening the capacity of low-carbon logistics, therefore, become the subject of this paper’s research under the constraint of the dual carbon target. In this paper, the provincial low-carbon logistics capacity in China was evaluated by the entropy weight TOPSIS and analyzed the configuration for high low-carbon logistics capacity by using dynamic fsQCA, considering the temporal and cross-sectional effects simultaneously.
In accordance with the empirical results, the following conclusions can be drawn. First of all, although the comprehensive scores show a certain fluctuation, but in general, the low-carbon logistics capacity of the provinces shows a trend of improvement yearly. However, the provinces and cities with great low-carbon logistics capabilities, are primarily located in the developed or eastern regions. The capacity for low-carbon logistics is also generally worse in provinces and cities with larger energy resource endowments, lower economic development, and industrial development as a foundation. Second, the core antecedent conditions determined by dynamic fsQCA are minor differences from the key factor derived from the entropy weighting method. Compared to the marginal analysis of some approaches, such as the regression method, fsQCA places more emphasis on multi-factor configurational effects. A multi-factor configurational analysis is therefore appropriate to use in the analysis of low-carbon logistics capacity and is also adaptable in other domains. Third, this paper finds three different combinations that lead to better low-carbon logistics capacity, which are the digital empower capital intensive type, digital empower labor intensive type, and green ecology plus technology innovation type. Overall, the findings point to three distinctive paths that may contribute to low-carbon logistics capability. To achieve high-quality development and low-carbon development of the logistics industry, provinces, and cities can choose their own paths based on the actual conditions.
The results of this study have several practical implications. First, encourage the digital economy’s high-quality growth while strengthening its impetus for the logistics industry’s carbon emission reduction. Despite the fact that China’s digital economy development is still in its infancy, there is still a need to upgrade the infrastructure. The financial, talent, tax, and regulatory support provided by governments should be increased in order to support the efficient and coordinated growth of digital industrialization and industrial digitalization. Guangdong and Jiangsu have successfully tapped into the potential of the digital economy to support the development of industrial clusters, lowering transaction costs and boosting productivity and efficiency. It is conceivable to reinforce the restrictions on energy conservation and emission reduction in the development of the logistics industry and further increase the capacity of low-carbon logistics by taking advantage of the expansion of the digital economy. Second, Low-carbon technological innovation is the key to the low-carbon development of the logistics industry. Given that research and technology expenditure have the highest entropy weight despite being a peripheral causative condition in all three configurations, technological innovation is crucial for enhancing low-carbon logistics capabilities. The majority of provinces and municipalities continue to invest in research and development because technology advancements help the logistics sector operate sustainably. More importantly, investing in research and development will be essential to advancing low-carbon and high-quality regional economic development. Third, strengthening the constraints of dual-carbon targets to achieve low-carbon logistics capabilities. In order to realize the transformation and upgrading from the perspective of the dual carbon targets, government, on the one hand, could enact the environmental regulation to effectively restrict the energy consumption and carbon emissions of the logistics industry. On the other hand, the government should increase environmental control expenditure in the logistics industry to prevent obtaining economic progress at the expense of environmental damage.
This study is one of the first to use a method such as the dynamic fsQCA in the logistics field. It analyzes the relationship between low-carbon logistics capacity and its antecedent conditions. Contribution-wise, it demonstrates that a combination of factors influences low-carbon logistics capacity, and that there are three paths that can each improve low-carbon logistics capacity. This paper has certain limitations. First, there are some examined antecedent conditions provided, but others, such location conditions and government interference, are still missing. Another drawback is that the study’s reliance on the innovative analytical approach of dynamic fsQCA, which, as the authors recognize, could lead to improvements in areas like relevant and acceptable thresholds. Dynamic fsQCA can be used in several study topics in the future research. Additionally, a sensitivity analysis can be performed to choose the appropriate threshold.

Author Contributions

Conceptualization, H.J. and J.W.; methodology, H.J. and T.S.; software, H.J.; investigation, B.Z.; data curation, T.S. and B.Z.; writing—original draft, H.J. and T.S.; writing—review & editing, B.Z. and J.W.; funding acquisition, H.J. and J.W. All authors have read and agreed to the published version of the manuscript.

Funding

This research is partially funded by the Ministry of Education of Humanities and Social Science Project of China (Grant No. 22YJC790049), the Research project of the Social Science Foundation of Fujian Province (Grant No. FJ2022BF040).

Institutional Review Board Statement

Not applicable.

Informed Consent Statement

Not applicable.

Data Availability Statement

The data presented in this study are available on request from the corresponding author.

Conflicts of Interest

The authors declare no conflict of interest.

Nomenclature

AbbreviationFull contextDefinition/Measurement
fsQCAFuzzy-set qualitative comparative analysis
TOPSISTechnique for Order Preference by Similarity to an Ideal Solution
POCONSPooled consistencyThe consistency of each causal combination
BECONSBetween consistencyThe cross-sectional consistency for each year
WICONSWithin consistencyThe consistency of the relations across time for each case
POCOVPooled coverageThe overall coverage of cases
BECOVBetween coverageThe yearly coverage of cases
WICOVWithin coverageThe cross-sectional coverage of cases
LCLLow-carbon logistics capacityComprehensive scores calculated by using entropy TOPSIS
FIXFixed assets investmentTotal amount of fixed assets investment in logistics industry
EMPEmployment in logistics industryThe practitioners in the logistics industry as a percentage of all practitioners
RNDRoad network densityThe ratio of paved road length to paved road area in each province
TELTelecommunication servicesTotal amount of telecommunication services
MOBMobile telephone servicesMobile telephone users as a percentage of the resident population in each province
CABCable line lengthLength of long-distance fiber-optic cable lines
PSFScience and technology expenditurePer capita science and technology expenditure
ENIEnergy consumption intensityThe ratio of energy consumption to value added of the logistics industry
COICarbon emission intensityThe ratio of carbon emissions to value added of the logistics industry

References

  1. State Council The People’s Republic of China. The 14th Five-Year Plan to Modernize Logistics. Available online: http://www.gov.cn/zhengce/content/2022-12/15/content_5732092.htm (accessed on 15 December 2022).
  2. UNEP. Emission Gap Report 2022: The Closing Window; United Nations Environment Programme: Nairobi, Kenya, 2022; Available online: https://www.unep.org/emissions-gap-report-2022 (accessed on 27 October 2022).
  3. Liang, Z.J.; Chiu, Y.-H.; Guo, Q.; Liang, Z. Low-carbon logistics efficiency: Analysis on the statistical data of the logistics industry of 13 cities in Jiangsu Province, China. Res. Transp. Bus. Manag. 2022, 43, 100740. [Google Scholar] [CrossRef]
  4. Wang, Y.F.; Yu, Z.F.; Hou, Y.M. The Effects of Environmental Regulation and Low-Carbon Logistics Capacity on the Level of New Urbanization in Six Central Provinces of China. Sustainability 2022, 14, 12686. [Google Scholar] [CrossRef]
  5. Liu, C.; Li, Z.Z. The Impact of low-carbon logistics on regional economic development in the Yangtze river delta region. East China Econ. Manag. 2023, 37, 33–40. [Google Scholar] [CrossRef]
  6. Che, X.Y.; Sui, B.W.; Liu, X.W. Research on the factors influencing the development of low-carbon logistics in China based by Tobit regression. J. Commer. Econ. 2021, 101–103. [Google Scholar]
  7. Zhou, T.; Chen, Y.; Yang, J.L. Research on the measurement of coordinated development level of regional low carbon logistics capability. J. Cent. South Univ. For. Technol. (Soc. Sci.) 2021, 15, 34–42. [Google Scholar]
  8. Han, L.P.; Li, M.D.; Liu, J. On the influencing factors of carbon emission of China’s logistics industry and its industrial linkage. J. Beijing Jiaotong Univ. (Soc. Sci. Ed.) 2022, 21, 86–93. [Google Scholar] [CrossRef]
  9. Jia, X.M.; Qu, Y.M. Review of domestic research of low-carbon logistics. Packag. Eng. 2022, 43, 289–300. [Google Scholar]
  10. Xu, C.Y.; Li, L. Study on the coordinated development of green logistics and green economy in the Yangtze river economic belt. East China Econ. Manag. 2023, 37, 31–39. [Google Scholar]
  11. Saini, M.; Hrušecká, D. Comparative impact of logistics performance index, ease of doing business and logistics cost on economic development: A fuzzy QCA analysis. J. Bus. Econ. Manag. 2021, 22, 1577–1592. [Google Scholar] [CrossRef]
  12. Hwang, D.W.; Hong, P.C.; Lee, D.Y. Critical factors that affect logistics performance: A comparison of China, Japan and Korea. Int. J. Shipp. Transp. Logist. 2017, 9, 107–129. [Google Scholar] [CrossRef]
  13. Woodside, A.G. Moving beyond multiple regression analysis to algorithms: Calling for adoption of a paradigm shift from symmetric to asymmetric thingking in data analysis and crafting theory. J. Bus. Res. 2013, 66, 463–472. [Google Scholar] [CrossRef]
  14. Chen, Y.; Hong, J.; Tang, M.; Zheng, Y.; Qiu, M.; Ni, D. Causal complexity of environmental pollution in China: A province-level fuzzy-set qualitative comparative analysis. Environ. Sci. Pollut. Res. 2023, 30, 15599–15615. [Google Scholar] [CrossRef]
  15. Ragin, C.C. Redesigning Social Inquiry: Fuzzy Sets and Beyond; University of Chicago: Chicago, IL, USA, 2008. [Google Scholar]
  16. Du, Y.Z.; Jia, L.D. Configurational perspective and qualitative comparative analysis (QCA): A new path for management research. J. Manag. World 2017, 155–167. [Google Scholar] [CrossRef]
  17. Lian, W.H.; Chu, Y.C.; Yan, Z.C. Research on the configuration and path of indluencing factors of high-quality development efficiency of China’s aviation logistic industry: Based on the fsQCA analysis of 31 provinces in China. Resour. Dev. Mark. 2022, 38, 1468–1474. [Google Scholar]
  18. Du, H. Discussion on multiple paths to improve the efficiency of China’s Logistics Industry under the dual carbon goals. J. Commer. Econ. 2022, 110–113. [Google Scholar]
  19. Garcia-Castro, R.; Ariño, M.A. A general approach to panel data set-theoretic research. J. Adv. Manag. Sci. Inf. Syst. 2016, 2, 63–76. [Google Scholar]
  20. Beynon, M.J.; Jones, P.; Pickernell, D. Country-level entrepreneurial attitudes and activity through the years: A panel data analysis using fsQCA. J. Bus. Res. 2020, 115, 443–455. [Google Scholar] [CrossRef]
  21. Bao, Y.D.; Li, Y.S.; Zhang, S.Z. Study on the scale of carbon emission of logistics industry and its influencing factors in the Yangtze river delta. Ecol. Econ. 2020, 36, 25–31+53. [Google Scholar]
  22. He, J.S.; Wang, S.F.; Xu, L. Research on the efficiency and influencing factors of green logistics in three bay-area city clusters under the constraint of carbon emissions. Railw. Transp. Econ. 2021, 43, 30–36. [Google Scholar]
  23. Cao, J.W.; Zhou, L. Research on the spatial and temporal distribution of carbon emissions from logistics industry in Yangtze river delta region and its influencing factors. Stat. Decis. 2021, 37, 79–83. [Google Scholar]
  24. Wang, F.Z. Study on influencing factors of carbon intensity in logistic industry: Analysis based on energy price and goods turnover. Price Theory Pract. 2018, 131–134. [Google Scholar] [CrossRef]
  25. Zhang, L.L.; Su, T.Y.; Zhang, J. Technical efficiency of logistics industry in China: Spatio-temporal differentiation, influencing factors and evolution logic—An empirical analysis based on PP-SFA model. J. Bus. Econ. 2019, 4, 30–45. [Google Scholar]
  26. Mu, X.Y.; Wang, L.; Xu, R.; Guo, Z.J. Study on carbon emission decoupling and influencing factors of logistics industry in western provinces. Environ. Sci. Technol. 2020, 43, 214–219. [Google Scholar]
  27. Wang, L.P.; Liu, M.H. Carbon emission measurement for China’s logistics industry and its influence factors based on input-output method. Resour. Sci. 2018, 40, 195–206. [Google Scholar]
  28. Wang, X. Evaluation and promotion strategy of regional logistics low-carbon development capability: Empirical analysis based on eight provinces and one city in both Yangtze river delta and the central region in China. Henan Soc. Sci. 2018, 26, 108–112. [Google Scholar]
  29. Li, Y.M.; Liu, M.Z.; Guo, L.L. Evaluation model based on projection pursuit method and empirical research of regional logistics low carbon competitiveness. Areal Res. Dev. 2015, 34, 28–33. [Google Scholar]
  30. Forkmann, S.; Henneberg, S.C.; Witell, L.; Kindström, D. Driver configurations for successful service infusion. J. Serv. Res. 2017, 20, 275–291. [Google Scholar] [CrossRef]
  31. Elliot, T. Fuzzy Set Qualitative Comparative Analysis; Research Notes: Statistics Group; UCI: Palm Desert, LA, USA, 2013. [Google Scholar]
  32. Hartmann, J.; Inkpen, A.; Ramaswamy, K. An fsQCA exploration of multiple paths to ecological innovation adoption in European transportation. J. World Bus. 2022, 57, 101327. [Google Scholar] [CrossRef]
  33. Vlachos, I. Necessary and sufficient antecedents of customer loyalty to logistics service providers. J. Bus. Ind. Mark. 2021, 36, 729–748. [Google Scholar] [CrossRef]
  34. Saini, M.; Hrušecká, D. Influence of logistics competitiveness and logistics cost on economic development: An fsQCA qualitative approach. E M Ekon. A Manag. 2021, 24, 51–64. [Google Scholar] [CrossRef]
  35. Pineiro-Chousa, J.; Lopez-Cabarcos, M.A.; Perez-Pico, A.M.; Caby, J. The influence of Twitch and sustainability on the stock returns of video game companies: Before and after COVID-19. J. Bus. Res. 2023, 157, 113620. [Google Scholar] [CrossRef]
  36. Guedes, M.J.; da Conceição Gonçalves, V.; Soares, N.; Valente, M. UK evidence for the determinants of R&D intensity from a panel fsQCA. J. Bus. Res. 2016, 69, 5431–5436. [Google Scholar] [CrossRef] [Green Version]
  37. Chen, C.H. A novel multi-creiteria decision-making model for building material supplier selection based on entropy-AHP weighted TOPSIS. Entropy 2020, 22, 259. [Google Scholar] [CrossRef] [PubMed] [Green Version]
  38. Zhang, J.G.; Song, X.W.; Yang, S. Buffer sizing of a critical chain project based on the entropy method. Manag. Rev. 2017, 29, 211–219. [Google Scholar]
  39. Ayan, B.; Abacıoğlu, S.; Basilio, M.P. A Comprehensive Review of the Novel Weighting Methods for Multi-Criteria Decision-Making. Information 2023, 14, 285. [Google Scholar] [CrossRef]
  40. Fu, W.; Sun, J.; Lee, X.D. Research on the openness of digital platforms based on entropy-weighted TOPSIS: Evidence from China. Sustainability 2023, 15, 3322. [Google Scholar] [CrossRef]
  41. Zhang, M.X.; Sun, Q.J.; Yang, X. Research on the assessment of the capacity of urban distribution networks to accept electric vehicles based on the improved TOPSIS method. IET Gener. Transm. Distrib. 2021, 15, 2804–2818. [Google Scholar] [CrossRef]
  42. Zou, T.; Guo, P.B.; Wu, Q.L. Applying an entropy-weighted TOPSIS method to evaluate energy green consumption revolution progressing of China. Environ. Sci. Pollut. Res. 2023, 30, 42267–42281. [Google Scholar] [CrossRef] [PubMed]
  43. Ma, J.; Zeng, Y.; Chen, D. Ramp Spacing Evaluation of Expressway Based on Entropy-Weighted TOPSIS Estimation Method. Systems 2023, 11, 139. [Google Scholar] [CrossRef]
  44. Chen, H.; Zhang, Y. Regional logistics industry high-quality development level measurement, dynamic evolution, and its impact path on industrial structure optimization: Finding from China. Sustainability 2022, 14, 14038. [Google Scholar] [CrossRef]
  45. Guan, T.C. Green logistics partner selection based on pythagorean hesitant fuzzy set and multiobjective optimization. Math. Probl. Eng. 2022, 2022, 3993066. [Google Scholar] [CrossRef]
  46. Guo, Y.R.; Shi, Q.; Guo, C.M. A performance-oriented optimization framework combining meta-heuristics and entropy-weighted TOPSIS for multi-objective sustainable supply chain network design. Electronics 2022, 11, 3134. [Google Scholar] [CrossRef]
  47. Xiang, K.; Zheng, N.; Chen, J.; Gao, W. Evaluation and obstacle degree analysis of low-carbon development in Fujian Province: Based on entropy weight TOPSIS method. Front. Energy Res. 2022, 10, 948893. [Google Scholar] [CrossRef]
  48. Li, X.; Peng, Y.; Guo, Y.; Wang, W.; Song, X. An integrated simulation and AHP-entropy-based NR-TOPSIS method for automated container terminal layout planning. Expert Syst. Appl. 2023, 225, 120197. [Google Scholar] [CrossRef]
  49. Medina-Molina, C.; Pérez-Macías, N.; Gismera-Tierno, L. The multi-level perspective and micromobility services. J. Innov. Knowl. 2022, 7, 100183. [Google Scholar] [CrossRef]
  50. Gligor, D.; Russo, I.; Maloni, M.J. Understanding gender differences in logistics innovation: A complexity theory perspective. Int. J. Prod. Econ. 2022, 246, 108420. [Google Scholar] [CrossRef]
  51. Lu, M.L.; Lei, W.; Gao, Y.J.; Wan, Q. If there appears a path to improve Chinese logistics indusry efficiency in low-carbon perspective? A qualitative analysis of provincial data. Math. Probl. Eng. 2021, 2021, 1–12. [Google Scholar] [CrossRef]
  52. Kent, R.; Olsen, W. Using fsQCA a Brief Guide and Workshop for Fuzzy-Set Qualitative Comparative Ayalsis; The Cathie Marsh Centre, University of Manchester: Manchester, UK, 2008. [Google Scholar]
  53. Schneider, C.Q.; Wagemann, C. Standards of good practice in qualitative comparative analysis (QCA) and fuzzy-sets. Comp. Sociol. 2010, 9, 397–418. [Google Scholar] [CrossRef] [Green Version]
  54. Schneider, C.Q.; Wagemann, C. Set-Theoretic Methods for the Social Sciences: A Guide to Qualitative Comparative Analysis; Cambridge University Press: Cambridge, UK, 2012. [Google Scholar]
  55. Misangyi, V.F.; Acharya, A.G. Substitutes or complements? A configurational examination of corporate governance mechanisms. Acad. Manag. J. 2014, 57, 1681–1705. [Google Scholar] [CrossRef]
  56. Yang, Y.; Li, Y. Study on the coupling and coordination of low carbon logistics and regional economy: A case study of Yunnan province. Ecol. Econ. 2023, 39, 86–92+142. [Google Scholar]
  57. Li, H.; Liao, X.; Hou, Z.Q. An empirical study on the coupling and coordination of regional logistics and green tourism economy in Yunnan province. Ecol. Econ. 2021, 37, 132–138. [Google Scholar]
  58. Chen, G.H. Research on the threshold effect of internet penetration on the green total factor productivity of the logistics industry. J. Commer. Econ. 2023, 89–92. [Google Scholar]
  59. Yuan, J.H. Research on the development status and countermeasures of China’s logistics industry under the background of low-carbon economy. Logist. Eng. Manag. 2022, 44, 102–104+107. [Google Scholar]
  60. Li, G.G.; Cao, Y.L. An empirical study of the regional logistics development and economic growth. Econ. Probl. 2012, 121–124. [Google Scholar] [CrossRef]
  61. Jia, Y.J. Research on the measurement of the development level of the integration of urban and rural commerce and trade circulation. J. Commer. Econ. 2023, 31–34. [Google Scholar]
  62. Han, J.B.; Jiang, M.Y. Has the development of the internent increased the total factor productivity of the logistics industry. Sci. Technol. Dev. 2021, 17, 1142–1149. [Google Scholar]
  63. Qin, W.; Qi, X.L. Evaluation of green logistics efficiency in northwest China. Sustainability 2022, 14, 6848. [Google Scholar] [CrossRef]
  64. Duan, X.-Y.; Chou, H.-J.; Cheng, S.-R. Recognition and Empirical Research on Key Influencing Factors of Low Carbon Development for Logistics Company. Discret. Dyn. Nat. Soc. 2015, 2015, 1–9. [Google Scholar] [CrossRef] [Green Version]
  65. Gil-Sayas, S.; Di Pierro, G.; Tansini, A.; Serra, S.; Curro, D.; Broatch, A.; Fontaras, G. Energy consumption of mobile air-conditioning systems in electrified vehicles under different ambient temperatures. Int. J. Engine Res. 2023. [Google Scholar] [CrossRef]
  66. Tzeiranaki, S.T.; Economidou, M.; Bertoldi, P.; Thiel, C.; Fontaras, G.; Clementi, E.L.; De Los Rios, C.F. The impact of energy efficiency and decarbonisation policies on the European road transport sector. Transp. Res. Part A-Policy Pract. 2023, 170, 103623. [Google Scholar] [CrossRef]
  67. Fiss, P.C. Building better causal theories: A fuzzy set approach to typologies in organization research. Acad. Manag. J. 2011, 54, 393–420. [Google Scholar] [CrossRef] [Green Version]
  68. Schneider, C.Q.; Wagemann, C. Reducing complexity in qualitative comparative analysis (QCA): Remote and proximate factors and the consolidation of democracy. Eur. J. Political Res. 2006, 45, 751–786. [Google Scholar] [CrossRef]
  69. Zhang, H.; Hu, J. Has ecological civilization construction promoted green technology innovation? An empirical assessment from synthetic control method. Sci. Technol. Prog. Policy 2023, 40, 151–160. [Google Scholar]
Figure 1. Basic steps for dynamic fsQCA.
Sustainability 15 11372 g001
Figure 2. Configuration analysis framework for low-carbon logistics capacity.
Sustainability 15 11372 g002
Figure 3. Variation of BECONS.
Sustainability 15 11372 g003
Table 1. Standard coal equivalent for each type of energy.
Energy TypeCoalGasolineKeroseneDiesel OilNatural GasElectricity
SCE0.71431.47141.47141.45711.33000.1229
Table 2. Carbon emission factors for each type of energy.
Energy TypeCoalGasolineKeroseneDiesel OilNatural GasElectricity
Carbon emission factors2.05532.98483.07953.16052.18400.9439
Table 3. Entropy weights for antecedent conditions.
FIXEMPRNDTELMOBCABSTEENICOI
20080.0830.0650.0830.1310.1100.0740.3720.0450.037
20090.0740.0600.0760.1170.1000.0690.4000.0450.060
20100.0750.0580.0820.1470.0780.0670.3880.0540.051
20110.0840.0690.0830.1140.1180.0790.3430.0580.052
20120.0810.0800.0690.1170.1170.0810.3500.0550.051
20130.1000.0810.0690.1230.1140.0990.3410.0380.035
20140.0960.0850.0360.1440.1180.1010.3480.0370.036
20150.1010.0850.0370.1540.1360.1080.3060.0380.036
20160.1020.0750.0380.1800.0960.0920.3410.0410.035
20170.1270.0840.0470.1410.0870.0980.3330.0450.040
20180.1330.0830.0680.1340.1040.0790.3170.0390.043
20190.1340.0850.0610.1200.1020.1140.2990.0390.045
20200.1280.1100.0700.1170.1060.1070.2950.0300.036
20210.1290.1160.0500.1210.1320.1060.2710.0340.041
Average0.1030.0810.0620.1330.1080.0910.3360.0430.043
Ranking467235189
Table 4. Provincial low-carbon logistics capacity.
Province20082009201020112012201320142015201620172018201920202021AverageRanking
Beijing0.830.670.830.830.820.830.800.750.660.770.770.730.740.730.771
Tianjin0.350.260.330.440.490.530.510.510.470.420.340.330.380.310.403
Hebei0.090.070.090.110.110.130.120.140.140.130.130.140.140.160.1216
Shanxi0.080.050.060.090.090.130.100.110.070.080.080.090.100.120.0929
Inner Mongolia0.100.070.080.140.130.150.140.170.130.140.130.160.160.180.1414
Liaoning0.170.120.150.200.200.230.170.140.120.110.100.110.120.140.1511
Jilin0.080.060.070.090.090.110.090.120.090.100.100.100.130.140.1027
Heilongjiang0.100.070.090.110.110.130.110.150.110.130.100.140.160.170.1217
Shanghai0.790.870.800.830.830.820.710.670.670.740.720.650.690.680.752
Jiangsu0.180.150.210.280.290.310.290.340.280.310.310.330.340.360.286
Zhejiang0.260.190.230.270.270.290.270.340.330.300.320.390.370.410.305
Anhui0.070.060.090.110.120.130.130.160.250.220.210.270.270.270.177
Fujian0.110.080.100.130.130.150.130.170.120.150.150.160.160.160.1412
Jiangxi0.060.050.060.070.070.080.080.110.090.130.140.170.180.180.1024
Shandong0.120.080.120.140.130.160.150.190.130.180.180.210.200.220.1610
Henan0.080.060.080.090.090.100.110.140.090.140.160.160.180.200.1215
Hubei0.080.060.070.090.100.130.160.200.210.220.220.250.230.230.169
Hunan0.070.060.060.090.090.110.090.120.120.120.120.150.160.160.1121
Guangdong0.280.210.290.270.270.330.280.450.530.450.460.480.420.410.374
Guangxi0.070.050.060.080.080.100.090.110.090.100.110.130.140.150.1028
Hainan0.070.060.070.100.090.110.090.110.090.090.120.150.190.180.1122
Chongqing0.070.050.050.070.070.100.090.120.110.120.120.130.140.160.1025
Sichuan0.090.070.090.110.120.140.150.190.180.180.200.260.250.280.178
Guizhou0.060.040.060.080.070.080.080.120.110.130.140.150.150.120.1026
Yunnan0.060.040.060.070.060.100.090.130.100.150.150.180.180.190.1119
Shaanxi0.070.050.050.090.080.090.100.140.130.130.130.130.130.150.1123
Gansu0.050.040.040.060.060.070.060.090.060.070.080.090.100.100.0730
Qinghai0.090.070.060.090.110.130.120.150.110.120.130.140.160.170.1218
Ningxia0.090.060.080.110.120.120.110.160.140.180.210.180.170.170.1413
Xinjiang0.100.060.080.120.120.140.110.130.100.100.110.110.120.130.1120
Table 5. Calibration values and statistics.
NCalibration ValuesFuzzy Values Descriptive
95%50%5%MeanStd.Min.Max.
Outcome
LCL4200.6950.1300.0600.4310.2680.0220.980
Conditions
FIX4203859.6871013.060216.7520.4640.2960.0300.992
EMP4207.6334.9883.3120.4690.3000.0190.991
RND42065.56751.26640.9120.4810.2890.0050.996
TEL4204746.240669.015123.1770.4410.2810.0331.000
MOB42013,238.4149387.2304511.9920.4950.3050.0180.999
CAB4205.7913.1400.3600.4830.2850.0381.000
STE420937.172149.88642.4960.4450.2840.0320.999
ENI4202.1671.0830.5270.4700.3020.0110.993
COI4204.9742.5601.3130.4800.3080.0150.996
Table 6. Necessary conditions.
ConditionConsistencyCoverage
FIX0.7390.686
~FIX0.6500.523
EMP0.6720.617
~EMP0.7040.572
RND0.7030.631
~RND0.6880.571
TEL0.7360.720
~TEL0.6800.524
MOB0.8670.754
~MOB0.5690.486
CAB0.6750.602
~CAB0.7470.623
STE0.8960.869
~STE0.6200.481
ENI0.5790.531
~ENI0.7960.648
COI0.5810.521
~COI0.7930.658
Table 7. Configuration for high low-carbon logistics capacity.
Configuration 1Configuration 2Configuration 3
FIX
EMP
RND
TEL
MOB
CAB
STE
ENI
COI
Consistency0.9780.9600.954
Raw coverage0.3770.2410.264
Unique coverage 0.1820.0100.037
Typical provincesGuangxi, Guizhou, QinghaiGuangdong, HenanShanghai, Jiangsu, Guizhou
Solution consistency0.967
Solution coverage0.469
Note: ● = Core causal condition (present); = Peripheral causal condition (present); ⊗ = Core causal condition (absent); = Peripheral causal condition (absent). Blank spaces indicate “do not care.”
Table 8. Consistencies and coverages for each configuration.
BECONS Adj-DistanceBetweenBECONSBECOV
123123123
0.0330.0500.03720081.0001.0001.0000.2280.2790.252
20090.9060.9160.9140.3840.4470.418
20100.9440.9360.9370.4090.3790.359
20110.9990.9970.9990.3480.2480.276
20120.9770.9880.9690.4110.2630.303
20130.9970.9940.9950.3880.2890.265
20140.9690.9630.9520.4690.3310.317
20151.0001.0001.0000.3980.2740.285
20160.9250.8790.9010.4220.2770.307
20170.9790.9330.9640.4240.2510.281
20180.9530.8980.9670.4210.2810.266
20190.9830.9030.9690.410.2650.224
20200.9770.9681.0000.4390.2720.213
20211.0001.0001.0000.3470.1590.156
WICONS Adj-distanceWithinWICONSWICOV
123123123
0.0400.0320.036Beijing1.0001.0001.0000.0500.4650.326
Tianjin1.0001.0001.0000.1430.2490.067
Hebei1.0001.0001.0000.2760.2370.066
Shanxi0.9370.9250.9370.5770.5870.577
Inner Mongolia0.9750.9460.9460.1780.0800.08
Liaoning1.0000.8351.0000.4010.5960.46
Jilin0.8170.7490.8080.5910.6790.627
Heilongjiang1.0001.0001.0000.3080.2920.292
Shanghai1.0001.0001.0000.0470.3100.227
Jiangsu0.9971.0001.0000.7280.1080.151
Zhejiang1.0001.0001.0000.6980.0380.32
Anhui1.0001.0001.0000.1590.1560.14
Fujian0.9701.0001.0000.7420.1550.284
Jiangxi0.9510.9480.9410.5760.4760.469
Shandong1.0001.0001.0000.5820.1440.221
Henan1.0001.0001.0000.1520.1510.152
Hubei0.9990.9970.9980.6340.3040.415
Hunan0.9920.9920.9920.4260.4050.423
Guangdong0.9991.0001.0000.8200.1230.131
Guangxi0.9510.9330.9460.7200.5170.645
Hainan1.0000.9881.0000.1920.5560.202
Chongqing0.9560.9580.9500.4730.5610.594
Sichuan1.0001.0001.0000.4290.0700.071
Guizhou0.9510.9800.9600.6700.3500.633
Yunnan0.9710.9620.9430.5640.2020.283
Shaanxi0.9440.9440.9410.3530.3530.337
Gansu0.8330.8260.8330.8400.8400.84
Qinghai1.0001.0001.0000.1000.1040.1
Ningxia1.0001.0001.0000.0510.0590.051
Xinjiang0.8670.9260.9300.5130.4140.409
PooledPOCONSPOCOV
123123
0.9740.9510.9680.3980.2740.266
Disclaimer/Publisher’s Note: The statements, opinions and data contained in all publications are solely those of the individual author(s) and contributor(s) and not of MDPI and/or the editor(s). MDPI and/or the editor(s) disclaim responsibility for any injury to people or property resulting from any ideas, methods, instructions or products referred to in the content.

