1. Introduction
Maritime transport accounts for 80% of the world trade volume and, in particular, container transport represents about 90% of international trade and about 60% of world maritime trade [
1,
2]. This implies that container ports have to be increasingly efficient and able to manage operations rapidly and sustainably [
3,
4,
5]. In this sense, port automation plays an important role, which makes ports safer, decreases the number of man-made disservices, increases productivity, and performance becomes more predictable; the work can be performed in any weather and the labor cost is low [
6,
7].
Port automation can be defined in relation to five components [
6]: automated equipment, which allows for the rapid uninterrupted handling of goods; equipment control systems, which facilitate operations and provide more information for decision-making processes; terminal control tower, which enables the intelligent coordination and optimization of the management of the entire port; human–machine interactions, which speed up complex activities and maintenance; and interactions with the port community, which allow for a more fluid data exchange and connectivity along the wider value chain, both at sea and on land, making the system more efficient.
Although, at present, the busiest ports around the world are already automated and the development of automation is growing rapidly, the number of automated ports developed in the world is less than that of ordinary ports. The automation of ports is possible in many scenarios; however, the advantage that can derive from automation is probably not clear. This paper aims to underline the impacts of automated HUs on the performance of a port.
A port represents an interchange node between land and maritime transport systems. In relation to the operational and functional characteristics, it is possible to classify freight ports into five categories [
8]:
General cargo ports: for receiving ships with different types of goods; these terminals have to have diversified and versatile means for moving the different types of goods;
Container ports: specialized in container handling;
Ro-Ro ports: used for loading/unloading goods on wheeled vehicles;
Bulk ports: to accommodate tankers carrying liquids;
Multipurpose ports.
The port has a structure divided by areas in relation to the performed functions. In particular, there is an entry/exit by sea and an outer port; one or more docks, where the ship docks and the cargo are loaded and unloaded; the storage/handling area of the goods (yard); an entry/exit by land; and a connection with land transport systems.
Each terminal area can be organized in an intelligent way to guarantee the freight management more efficiently, in particular, by introducing and managing advanced handling unit (HU) technologies.
Fleet management (FM) is a tactical–operational activity, developed by private and public companies, to manage freight transport services in order to optimize the transport fleets, satisfy the customer demand, and reduce the costs. FM is a broad concept concerning both the sizing and composition of the fleet and the allocation and routing of vehicles [
9]. In the context of maritime transport, the FM problem can concern two research areas: the FM of ships and the FM of handling equipment inside the port. The goal is always to maximize profits or minimize costs. With regard to vessel management, a widespread problem may relate to vessel deployment, scheduling, and sequencing [
10] under particular constraints, such as those linked to the request by the shipping companies of an arrival time window and the appropriate management fee [
11]. Ship management changes when considering liner services or cargo and industrial ships; liners operate on a frequent basis so they need to have a predictable and shared schedule; and cargo ships do not keep a regular schedule [
12]. In any case, it is necessary to try to respect the scheduled navigation times trying to make up for any delays [
13,
14]. The FM of HUs aims to improve the efficiency of container ports. A common problem is the scheduling and routing of the different HUs that need to coordinate in order to minimize the ship’s berth time-load element [
15].
This paper focuses on FM of HUs within a port in order to optimize the system performance in terms of number of handled containers.
The automated HUs make it possible to speed up the freight handling process without the driver, remotely monitored and controlled by specialized operators. Port automation has been addressed in the field literature; the term automation is often used to indicate automated interchanges and movements in the yard; instead, the semi-automated terminal refers to the partial automation of some activities [
16,
17].
The topic of the automated port has already been analyzed by the authors who proposed a framework of traditional and automated HUs by comparing their operating features and evaluating the related investment and operating costs [
18].
In the sector literature, there is research that compares the performance of automated and non-automated ports; however, the comparison can be questionable as the contexts in which the port nodes operate are different. No research has been found that projects traditional terminals towards automation and therefore allows to understand how the efficiency of a port changes if the traditional structure is partially or totally replaced with automation. The paper makes it possible to compare the port performance both in the case where the containers’ handling is conducted with ordinary means, and in the case where these are partially or totally replaced with automated HUs.
This paper focuses its attention on the FM of HUs in a container port and follows a simulation approach to assess the impact of the automated HUs’ introduction in terms of efficiency performance.
The paper is structured in five sections; in
Section 2, the literature review is presented. In
Section 3, an in-depth framework of traditional and automated HUs is illustrated to highlight their main characteristics; in
Section 4, the work considers the organizational problems of a container port. In
Section 5, the methodological approach, a what-if simulation approach is illustrated and introduced, and, finally, in
Section 6, the application to a real context is presented to compare the present configuration of a terminal with some project scenarios characterized by a partial and total replacement of traditional HUs with fully automated ones for container storage activities.
2. Literature Review
In the scientific literature, several studies have dealt with the automation of container ports. Some research has addressed the layout design of an automated container terminal. Wang et al. [
19] analyzed and designed the typical automated containers’ terminal layout in order to make a port sustainable. They proposed a conceptual model considering the interaction among the different areas given the fixed values of terminal width and length. Li et al. [
20] compared the performance of different types of terminal layout through the use of agent-based simulation models. Tsolakis et al. [
21] focused on the use of automated guided vehicles (AGVs) in container ports to promote the use of smart systems in container port operations following the greater need in the manufacturing sector, thus strengthening the relationship of digital technologies and container port design; they examined the role of AGVs as a key technological application to understand how they can improve the performance of a container port. Kumawat and Roy [
22] compared AGV and automated lifting vehicle (ALV) performances.
Some research has also focused its attention on the relationship between automation in ports and energy consumption [
23]. Among them, Hong et al. [
24] highlighted the advantages of automated electric trucks over manual diesel trucks from a social, economic, and efficiency point of view; in particular, a reduction in total energy consumption is demonstrated. Iris and Lam [
25] addressed the integrated energy management and operations planning problem for next-generation green ports; they demonstrated that significant cost savings can be pursued with a smart grid (port micro-grid) with respect to conventional settings.
Other studies compared the performance of fully automated terminals compared with that of non-fully automated ones. For example, Kim et al. [
26] selected some automated and non-automated ports and measured the performance during COVID-19 in terms of quantitative factors, such as throughput, number of ship arrivals, and berthing time.
Many studies were directed to studying activities that support decision-making practices, such as operations planning, real-time monitoring, and maintenance [
27]. Luo and Wu [
15] talked about integrated scheduling optimization for improving the loading process. Zhong et al. [
28] designed adaptive auto-tuning approaches for the equipment scheduling in an automated container terminal. Yang et al. [
29] proposed an integrated scheduling method for automated terminals’ handling equipment coordination and AGV routing. Mi et al. [
30] proposed a vision-based measurement technology for monitoring container surface damage to provide the necessary information for the complex operation scenario of automated container terminals. Xia et al. [
31] proposed machine-level predictive maintenance and applied it to Shanghai port, which significantly improved the efficiency and economy of the port transportation system. Zhong et al. [
32] simultaneously considered the problem of the integrated planning of AGVs with quay and yard cranes, the problem of minimizing the delay time, and the problem of conflict-free route planning. Yue et al. [
33] integrated AGV scheduling with dual-trolley quay crane scheduling, and built a two-stage optimization model to solve this. Wei et al. [
34] and Tan et al. [
35] studied the scheduling of automated quay cranes.
Other research has focused on yard management. Yu et al. [
36] provided a literature review on yard management issues in automated container terminals demonstrating automation as a key for terminal efficiency improvement. Yang et al. [
37] studied yard crane scheduling for a ground trolley-based automated containers terminal. He et al. [
38] proposed a dynamic yard allocation method for automated container terminals, which can be applied for daily yard space management. However, the template generation or clustering strategy for automated container terminals is seldom used. Yu et al. [
7] considered stack allocation in different scenarios to understand the optimal clustering strategy. Lu and Wang [
39] discussed the multi-automated stacking cranes’ scheduling of the yard. Chen et al. [
40] designed a multi-commodity network flow model to accurately provide the spatio-temporal scheduling of AGVs and automated stacking cranes.
3. Handling Units
Handling units (HUs) are means used in freight interchange nodes for cargo handling, i.e., to move loading units between different areas of the node or to transfer them from one means of transport to another [
8].
It is possible to classify the HUs operating in a container terminal into three classes in relation to the area of the terminal where they are used, their specific operational functions characterized by the power supply system (diesel, electric, hybrid, with natural gas), and by their level of automation. The automation can have six levels of automation [
41]. Each level is characterized by defining the level of human involvement in the vehicle management and by identifying the adopted technology level. From levels 0 to 5, people’s involvement decreases because the automation increases; the process becomes more intelligent.
3.1. Traditional HUs
Below, a description of the most used traditional HUs in a container port is proposed.
The straddle carrier (SC) is a lifting and transport wheeled mean used for handling containers (
Figure 1a). The SC can move in very narrow corridors among container rows and can load containers onto both trucks and trains; on the other hand, it is very heavy so as to generate high pressure on the floor.
A fork lift (FL), also known as a fork loader, has the characteristic of moving load units by moving along fixed vertical guides (
Figure 1b). A FL can be fitted with bottom forks or a lift frame to which a spreader is attached from the top or the front. These vehicles have good maneuverability; however, they are not very stable due to the center of gravity that shifts between loading and unloading activities. Moreover, there is the impossibility of handling when the mean is stopped.
The side loader (SL) is a side-loading trolley that has a faster translation speed than the SC and can therefore perform cycles in less time thanks also to greater visibility (
Figure 1c). In addition, it is subject to minor dynamic loads as the container rests on the platform of the truck. The SL is able to move rapidly through standard aisles and does not require the presence of cross aisles. The potential of the side trolley is to stack up to three containers. The SL can also have forks for lifting containers or a lifting frame to which a spreader is attached; it is widely used for handling in the railway sector. It guarantees shorter operating times, high productivity, and a reduction in the number of transshipments required.
The reach stacker (RS) consists of a fixed-arm self-propelled crane that allows the freight to be moved both vertically and horizontally when the machine is stationary (
Figure 1d). This feature makes these means remarkably versatile and usable in various situations. They are used in particular in the case of combined road–rail transport. The dimensions of the stackers and telescopic arms allow the handling of empty containers up to the fifth height. The telescopic spreader can rotate 120 degrees, allowing you to move or stack containers in axes or to approach the container obliquely with respect to its axis, reducing the space for maneuver and handling times. RSs have higher transfer speeds than the rider trucks and good maneuverability, better than that of the other front trucks. A peculiar characteristic of these types of units is that of having reduced transverse dimensions during the transport phase, as it is possible to travel with the container suspended in an axial position with the vehicle, thus managing to use corridors only 4 m wide.
Transtainers handle the containers, both horizontally and vertically, maintaining high stability. There are two types of transtainers: those with rubber tires, rubber tyred gantry cranes (RTGs), and those with steel wheels on rail, rail-mounted gantry cranes (RMGs). Transtainers are very useful in the case of yards with a considerable turnover, such as in the road–rail terminals of freight villages for the composition of block trains, in general, for the rapid transfer of load units from road transport units to trains and vice versa, or between trains. The controls of the crane and trolley that are usually used to support handling in the yard are achievable so that all movements can be combined simultaneously and thus obtain a high operating speed. The transtainer’s structure allows the high storage density of the containers and considerable maneuvering speed, and therefore achieves a remarkable performance in terms of shots per unit of time (particularly higher in the case of rail-mounted cranes). It allows one to stack up to the fifth height using the sixth for maneuvers.
RMGs are stiff and have no standardized means (
Figure 2a) bound to a specific area of the node; they generally run on 16 wheels with two edges, of which only some are motorized and they can reach a free span of up to 60 m, even if, with this gauge, the “traverse time” increases and, therefore, the handling time. To use this type of crane, it is necessary that the floor is adequately equipped; this also implies high installation costs. RTGs, instead, can be easily transferred inside the terminal (
Figure 2b). They provide greater flexibility; however, they require a suitable surface to withstand the pressure of the rubber wheels. RTGs involve a lower incidence of depreciation costs than that via rail; this implies a choice, in economic terms, less demanding and allows for future changes in the layout of the terminal.
Gantry cranes (GCs) are specialized cranes that, having to conduct well-defined maneuvers, do not require the movement of the arms (
Figure 2c). The basic operations that the GC have to perform are: container hooking, lifting, translation, descent, storage, and release. This sequence may vary in relation to the arrangement of the yard and serving trolleys operating in connection with it. GCs have a “buffer” (from 4 to 8 places) where the containers are positioned, waiting to be allocated by the trolleys in the yard. GCs are classified into post-Panamax and Panamax according to whether they are able to load/unload containers from ships transiting through the Panama Canal. Conventionally, Panamax cranes perform the first 16 positions; from the next position, we talk about post-Panamax cranes.
The multitrailer train (MTT) is a HU consisting of a terminal tractor to which trailers are coupled for the moving of containers inside the yard. The MTT moves similar to a normal means of transporting trailers, and it is generally used for travel over long distances.
3.2. Automated HUs
HUs, characterized by different levels of automation, exist in many ports to date; they work without drivers, guaranteeing greater efficiency, flexibility, and safety. Automated HUs require specific infrastructures and specialized operators. Below, a description of the most recent automated HUs in a container terminal is proposed.
Automated gantry cranes (AGCs) can be operated remotely and are equipped with sensors based on laser and/or infrared technology, advanced image processing to read the codes for container identification, and information systems for crane management that define their activities in real time. This type of HU does not have a driver’s cab, as the operator who controls and supervises the crane’s movements is located remotely in a special room in the terminal; however, for some operations, it is necessary for the operators to be very close to the means and, generally, they are positioned on the ship that is loading or unloading. AGC works faster and has very short cycle times. This system overcomes the problems related to limited vision due to the physical distance between the cabin and target; improves safety by avoiding contact between operators and the handling environment; and increases the availability of information thanks to cameras, improving the overall performance. However, the remote control of a crane also has its own increasing safety requirements. Latency times on video signals must be monitored during operations and the emergency stop functionality requires special attention [
42].
An automated straddle carrier (ASC) requires changes to the whole terminal structure. Specifically, it involves modifications to the space layout: specific fences; security infrastructures and access control; installation of navigation infrastructures; automatic/manual interchange points (water side interface, interchange with train/truck, maintenance areas, management of empty containers, handling of refrigerators); intelligent environment and wireless networks; and yard lighting. ASCs foresee the presence of a navigation system that allows them to accurately provide the position and orientation of the HU. The most widespread technologies are very precise and reliable thanks to systems based on magnetic and radar navigations. Magnetic navigation works by incorporating a sequence of passive magnets into the yard floor, detected by sensors arranged on the lower frame connected to a control software. The investment costs related to infrastructure are high; instead, those for equipment are relatively low. The navigation equipment is in the lower part of the HU, and therefore subject to wear; the magnets, however, are durable. In radar navigation, around 100–200 beacons are installed around the terminal. The HU is able to move, thanks to a radar unit that detects the beacons (at least three at the same time). The investment and installation costs of this type of navigation are quite cheap. In addition, the system is better protected against wear and tear and works on any type of yard.
Automated RTGs (ARTGs) are means very similar mechanically to RTGs [
43]. Automation can be achieved in levels starting from remote control up to full automation. The automation requires changes in the whole node and the presence of specialized operators. The most spread ARTGs involve engines with less polluting outcomes (electrical systems) and the installation of intelligent devices, such as cameras and GPS, as well as an integrated telematics system that controls and integrates company processes. Different levels of automation can be identified [
43], e.g., remote control; supervised automatic moves; automatic pick and place on stack; automatic gantry; and fully automated.
An automated stacking crane (AutoSC) stacks containers in the yard and is also used for loading/unloading road/rail vehicles. The number of rows covered depends on the specific objectives of the equipment. It is equipped with an optical laser system capable of detecting the exact position of a container with reference to the stack. This allows the AutoSC to precisely position the spreader to lift a container. Collision avoidance is an important feature because, in most cases, two or more AutoSCs are mounted on the same rails. AutoSCs have laser rangefinders capable of avoiding all possible collisions.
Automated guided vehicles (AGVs) are means that move containers horizontally on a fixed path; they handle containers moving from the quay to the yard and vice versa. They are characterized by flexibility, low mass, low fuel consumption, and high load capacity (about 60 t); they are based on different technologies, such as wire guide, colored band, magnetic strip, odometric guide, and GPS system.
Intelligent and autonomous vehicles (IAVs) are a class of means potentially superior to AGVs at present [
44]; however, they are still in the prototype stage. The transport capacity of an IAV is 1 TEU; however, it has the possibility of automatic coupling/decoupling of several units and, therefore, of moving containers of any size or more containers in a convoy. Unlike AGVs, IAVs are GPS-based systems not bound to a fixed path. All wheels are equipped with actuators to prevent wheel failure leading to the stop of the HU. IAVs can move laterally and longitudinally and do not need large spaces for maneuvering as the wheels offer 360-degree-rotation flexibility. An IAV adapts to the surrounding environment and vice versa, while in the case of AGVs, it is the environment that must adapt to them.
A study addressed by Camarero Orive et al. [
11] presented the main automated ports for each of which the introduction of automated HUs was reported in chronological order. In particular, the following HUs were considered: ARMG (automated rail-mounted gantry), C-ARMG (cantilever ARMG), AutoSC, ARTG, and AGV.
Table 1 identifies the vehicles that were present in the examined ports; in most of the ports considered, there are ARMGs; few ports have C-ARMGs and AGVs; and Sydney (Autostrad) and Tuxpan have an AutoSC, whereas only the port of Nagoya has the ARTG.
4. Planning Issues in a Container Port and HU Fleet Management
Container port problems can be addressed according to two approaches: global and local. The global approach refers to the study of the whole port without the details of the specific operations and components. Generally, this type of analysis is aggregate, performed for technical/operational purposes with tactical/strategic assessments. The local approach, on the other hand, expands the study in a disaggregated way concerning the system components with operational assessments. In general, the trend is to study the functional management of a port in order to optimize the time and costs of each activity. For this reason, reference is made to the optimization problems of each area of the port. In fact, the first planning problems concern the assignment of human resources to tasks and task scheduling.
Another way to approach planning issues within a port is to operate in relation to strategic, tactical, and operational levels. The strategic level concerns the design of a port choosing the kind of layout and equipment. The tactical level has a medium-term planning schedule (normally, not more than a year and not less than a month). In general, in terms of the structure, these decisions are more complicated; however, they work with less aggregated data and are easier to estimate and therefore less influenced by errors and uncertainties. They are usually dealt with by a high level of management, and some examples may be the allocation of the workforce or vehicles in the different areas of the port, etc. The operational level requires a short-term decision; these are problems related to daily activities. Usually, the management difficulty is greater because they must be solved in a short time, and a high level of detail is required that considers all possible constraints. This level includes the scheduling of operations, resource allocations, etc. At the operational level, there is a sub-level defined as “real time”, which concerns the supervision and control of all activities, in order to understand if there are any distortions with respect to the planned activities. These problems require immediate action.
The strategic level includes all the decisions usually adopted in the initial design phase of a new structure, or an extension of an existing port or conversion [
45,
46,
47,
48,
49,
50]. These kinds of problems involve high investments; therefore, the choices made are not changed over short time horizons. In general, the construction of a new port pays for itself after 10–15 years of operation. The problems relating to this level can be summarized as follows:
Quay (quay length; type of quay crane; number of quay cranes);
Yard (layout of the yard; type of yard HUs; number of yard HUs);
Landside (area layout for horizontal transport; number of HUs used for horizontal transport; type of HUs used for horizontal transport; type of connection with the hinterland; number of HUs used for connections with the hinterland).
Berth allocation problem (BAP) concerns the assignment of a berthing time and precise berthing position on the quay to inbound vessels. It is an optimization problem that has the objective of minimizing the time spent by ships in the port, guaranteeing a rapid and reliable service;
Quay crane assignment problem (QCAP) concerns the assignment of the cranes to each vessel for unloading/downloading activities. This optimization problem has the goal of minimizing process delay, which usually leads to significant costs; the number of cranes unloading/unloading a vessel defines the handling time;
Quay crane scheduling problem (QCSP) concerns the definition of the workload (bays to be loaded and/or unloaded) for each dock crane in order to minimize the service time of the ship (makespan);
Stowage planning (SP) is related to the assignment of containers to empty slots on a ship. In the first step, the assignment of the container class is defined; subsequently, there is the assignment of specific containers. The goal of this optimization problem is to minimize container handling both inside the ship and inside the yard;
Yard template planning (YTP) is a strategy applied to container terminals, especially transshipment hubs, which stores export and transshipment containers, which are loaded onto the same departing vessel at the same set of assigned sub-blocks. Yard template planning is concerned with the assignment of sub-blocks to vessels.
The operational management of the port mainly concerns the use of space, the location of the containers, the sorting of vehicles, and the management of HUs [
61]. These problems can be summarized as follows:
Storage allocation concerns the assignment of containers to yard slots in order to minimize handling times and crane movements [
62,
63,
64,
65]. This problem is planned before the containers arrive at the yard and then updated in real time when the containers are at port. Many problems are linked to this issue [
63], such as storing loading problems, when a position must be assigned to new containers; storing unloading problems, when the recovery of the containers involves a potential transfer; and pre-marshaling problems, when the transfer of containers can facilitate future loading and unloading operations;
Dispatching vehicles concerns the assignment of HUs to containers in order to minimize handling times. These problems can be integrated with related problems, such as construction crane planning, position assignment, dock crane planning, or their combinations [
66];
Programming of yard cranes means to determine the path of each crane in order to minimize the makespan and the total delay time of a crane. If a single crane is considered, the problem is to determine the number of containers to handle in each bay and the sequence of the bays to visit. If two or more cranes are considered, the cooperation and interference between them should be taken into account.
In the port landside, the containers are loaded/unloaded to/from trucks and trains. Operational planning problems concern [
67,
68], typically, the assignment of HUs to the container and the scheduling of activities.
5. Methodological Approach
The functional management analysis of a logistics system as a container port is often faced using a simulation model, an abstract and simplified representation of a system according to a given level of detail in relation to the analyst objectives. A simulation model reproduces the dynamic behavior of the system over time by considering the components and their functional relationships. The assessment of the system’s performance through a simulation model is conducted by a simulation run that is the temporal evolution of the system.
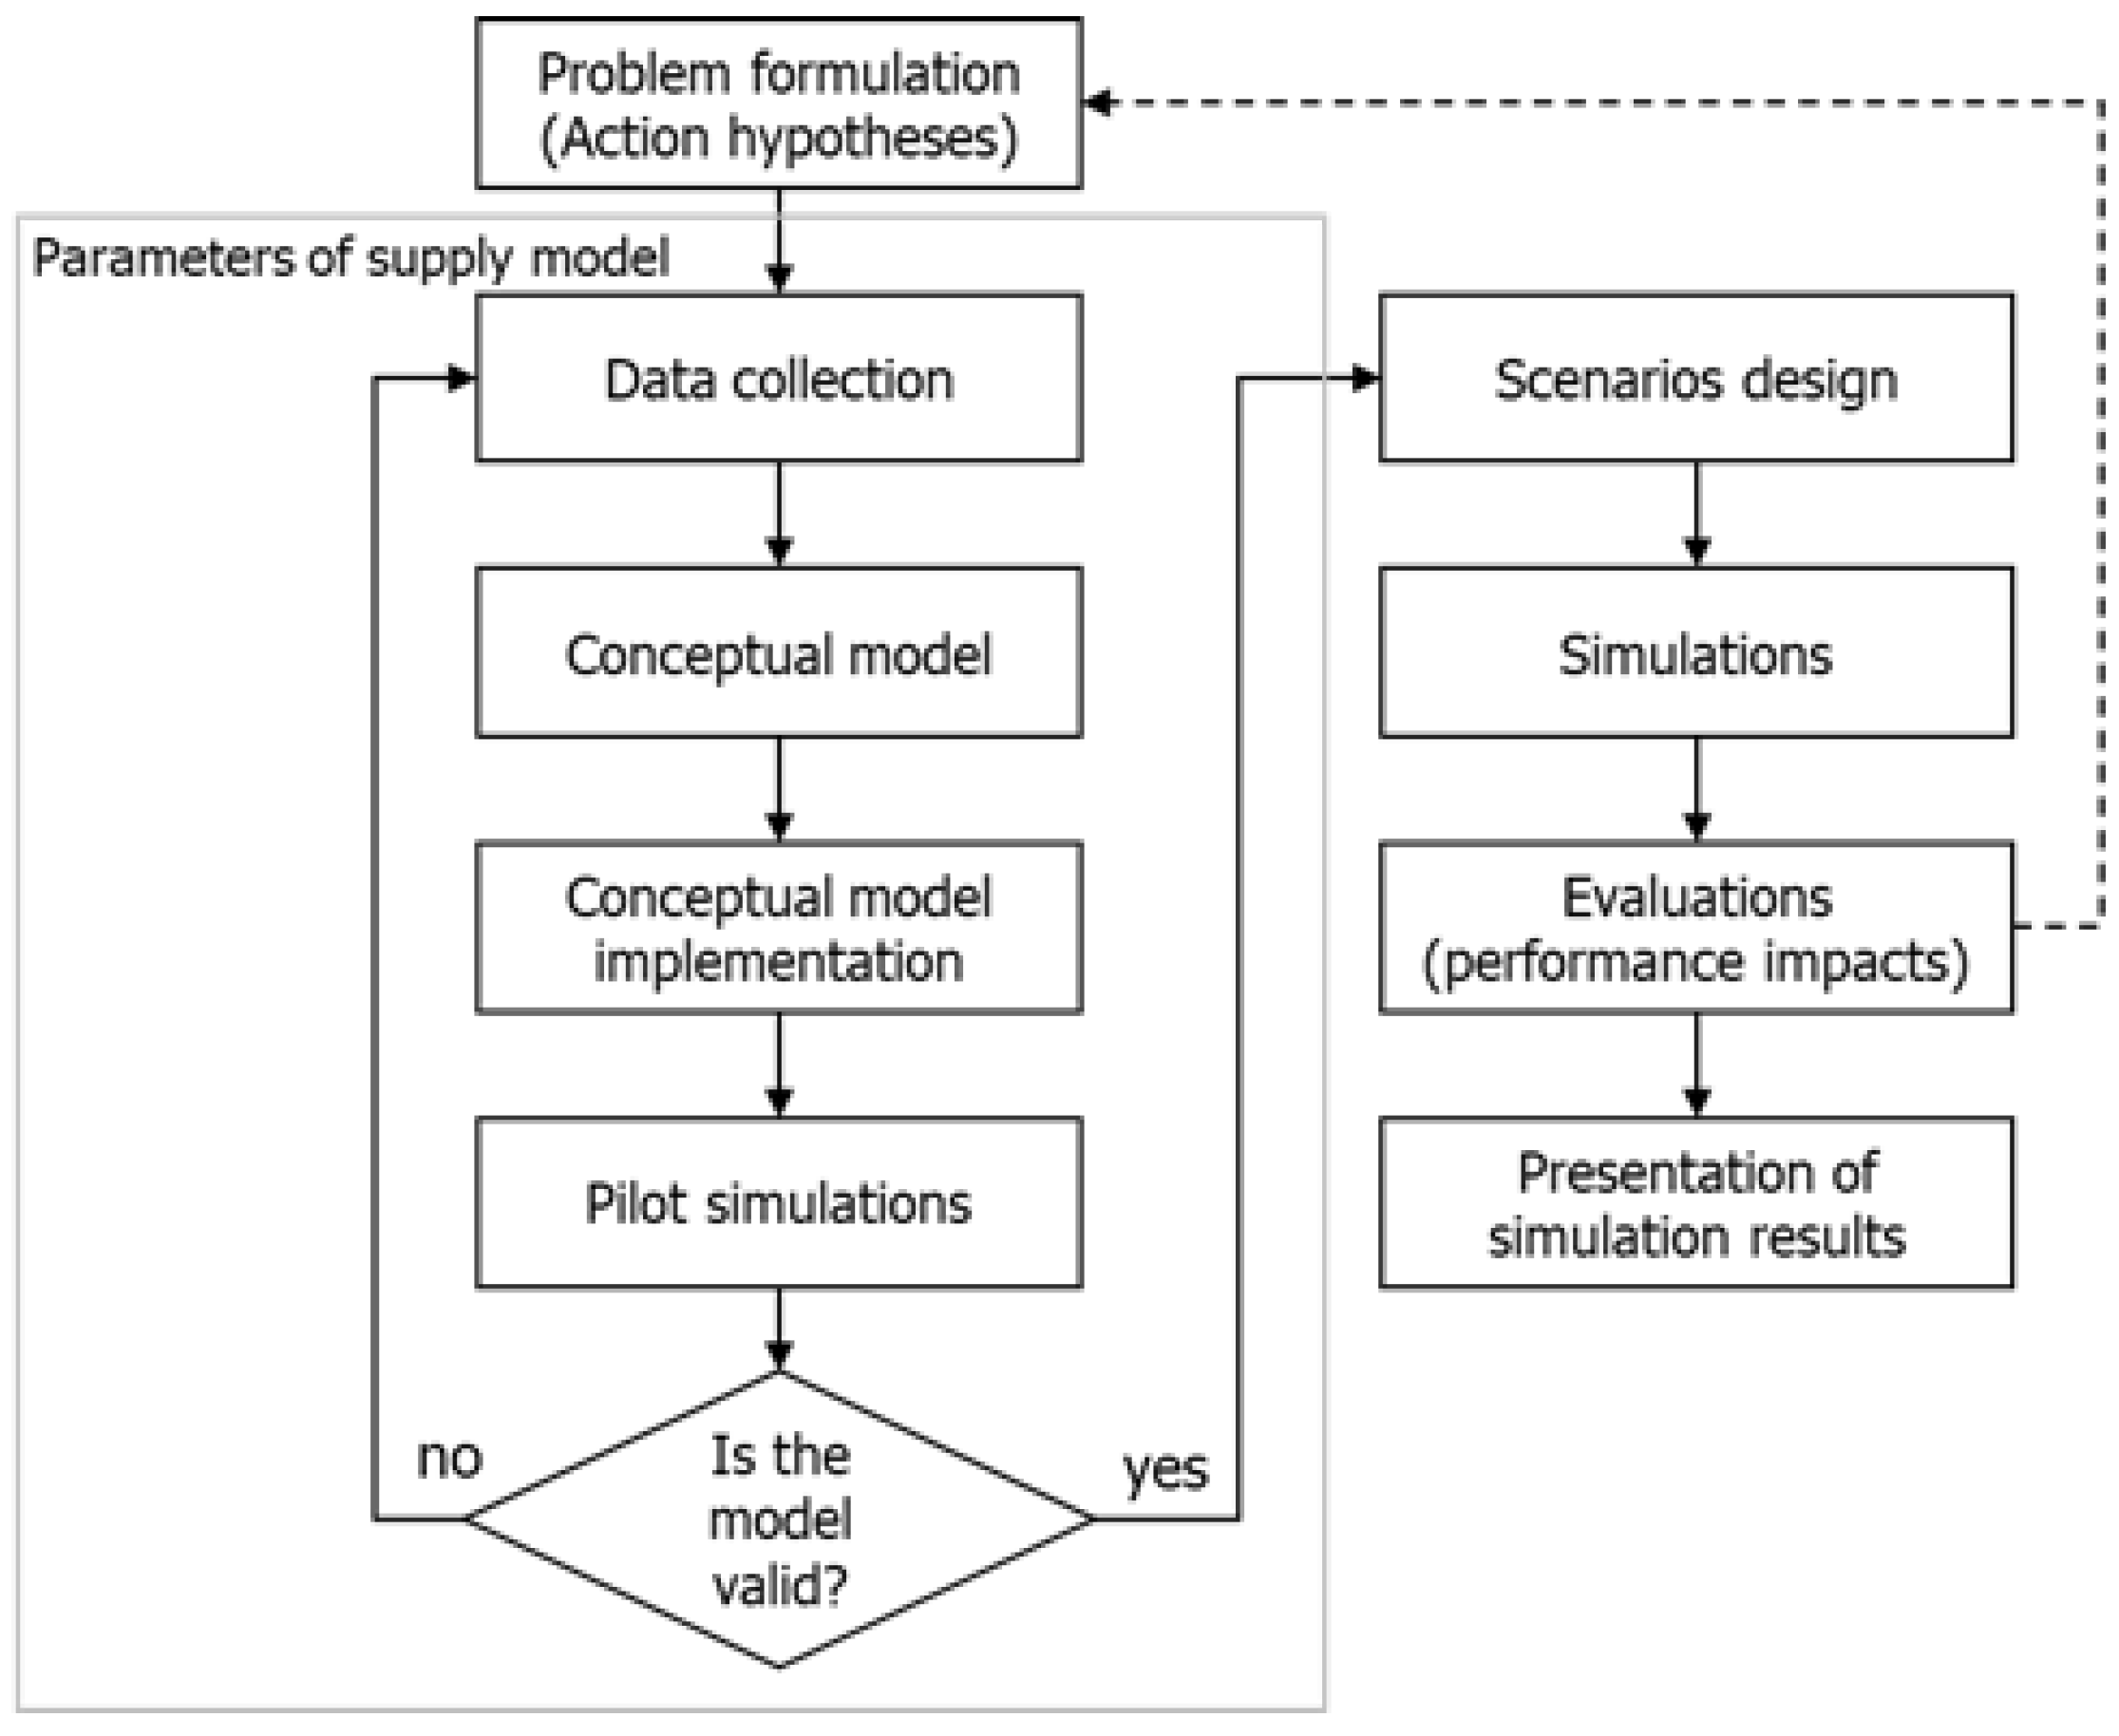
The proposed methodological approach was based on a simulation model and considered different steps (
Figure 3). In the first phase, the problem was analyzed and expanded in order to define the main goals of the study, the system components, and the reference performance measures. A database was built containing all the useful information on the system.
A very important study phase was the definition of the conceptual model where the main components of the system were identified and their relationship and activities conducted; the functional areas of the port and the relationships were represented by a flow chart and the system were schematized by using the graph theory. This phase represented the specification of the simulation model where the conceptual model was defined and reference variables were identified. The trend of reference variables were calibrated in order to obtain reference functions representing the real trend.
The model was implemented by using simulation software allowing to reproduce the dynamic behavior of the system over time. Through a pilot simulation, the model was subjected to ordinary cross-validation. Subsequently, different simulation scenarios were designed relating to different hypotheses on the system configuration, starting from the present one. Once the model was applied, the results were analyzed to evaluate the performance impacts.
To evaluate the performance of a port, the number of containers stored by the HUs were assumed as an important reference variable. To monitor and analyze this parameter, it was necessary to know the ship’s number arriving at the port and the unloaded containers’ numbers per ship. To facilitate the interpretation of the port processes, in the freight transfer from the ship to land, the following variables were important: the ship’s inter-arrival, waiting, service, and unloading times. These times were considered in relation to the statistical distributions obtained through calibrations or provided by the port managers. If these trends were not known, it was possible to assume average values in relation to the type of ship and the number of containers transported and to be unloaded.
In order to understand the activities performed within a port, it was necessary to know the transport supply of the port in terms of infrastructure and HUs (handling times, speed, etc.). Many port managers provided this information, allowing for the subsequent analysis to be performed.
6. A Case Study
A simulation model was proposed with the aim to analyze the activities of a container port in order to assess the performance in different configurations (scenarios). In particular, attention was paid to the FM of HUs used for the handling of goods in the quay/yard area. The main aim was to reduce the handling time costs, increasing the efficiency of the port.
After identifying the problem and defining the goal, a database was built (thanks to field surveys and sector research) that contained all the information necessary to complete the analysis. The conceptual model was defined to identify the main components of the system and the main activities. The model was implemented using a specialized software to reproduce the dynamic behavior and, after validation through pilot simulations, the different scenarios were built and simulated.
6.1. Structure, Layout, and Equipment
The container port considered in the study was the node of Gioia Tauro, located in Southern Italy (Calabria region), in a strategic position at the center of the Mediterranean area; it is the largest transshipment hub in Italy and one of the most important container traffic hubs in the Mediterranean basin.
Gioia Tauro port is classified as category II, class I of international importance; it is able to accommodate transoceanic ships in transit in the Mediterranean Sea and to handle any merchandise category. The port has a channel configuration. It has a total area of 620 ha, where 440 ha are susceptible to landsides and 180 ha to stretches of water. The entrance, located to the south, has an opening of 300 m above average sea level. The evolution basin is circular, with a diameter of 750 m.
The depth of the seabed varies between minus 14.5 and minus 18 m. In the northern part, there is an additional evolution basin 450 m in diameter. The width of the channel is 250 m above mean sea level. The operational spaces are also of absolute importance: it has 5130 m of docks where 3395 are located along the east side, 815 along the north side, and 920 m to the west for Ro-Ro units. The port yard has a total area of approximately 1.8 million square meters. To the south, there is a dock for the mooring of boats used for port services, fishing, and pleasure activities, equipped with quays 243 m in length.
In the port, there is a container terminal managed by the MedCenter Container Terminal (MCT), which has yards for the storage and handling of containers equal to 1.5 million square meters and a terminal for car transshipments along the north side of the canal that it extends for about 280 square meters [
70].
Figure 4 shows the layout of the Gioia Tauro port on the quay/yard side.
The yard can store nearly 59,000 TEUs; it is divided into 32 sectors parallel to the quay and organized into two areas. Each area has 32 lines, each containing 16 slots. Each slot can accommodate two-stacked one TEU containers [
71].
The unloading of containers from ships is conducted by [
72]: 16 gantry cranes + 3 on the way (up to 24 rows); 1 mobile crane + 2 on the way (up to 150 Tons); in the yard there are: 106 straddle carriers + 22 on the way; 12 reach stackers; 12 multitrailer trains; and various tractors and trailers.
6.2. Model Implementation
To optimize the performance of the HU fleet in Gioia Tauro port, simulation software FlexSim 20.0.5 was adopted, a tool designed to allow for the construction of interactive models of complex productions. Attention was given to the quay/yard area with the aim of optimizing the HU fleet that moved the containers from the quay to the yard. The choice to consider only a part of the system was linked to software license limitations.
The simulations were performed considering a 24 h port operation; three simulation scenarios were constructed on the basis of the literature studies and the authors’ experiences in the field. Scenario 0 reproduced the system in the present configuration; the containers were stored through 15 SCs; scenario 1 was created starting from the state of the system at present by replacing a part of ordinary HUs with innovative systems, 8 SCs and 7 IAVs; and scenario 2 assumed that all the containers’ storage was conducted with IAVs. IAVs are automated vehicles, with multiple degrees of freedom, equipped with innovative systems, such as GPS, which allows for precise guidance without the need to follow very restricted routes.
The ships arriving at the port and the containers transported were represented by Sources (entry into the model); after unloading, the ships left the quay through a Sinks (exit from the model). To simulate the containers unloading from ships, a Combiner was inserted on each quay, which associated the cargo in the containers for each ship, also represented through a Source. There was then a Separator that allowed for the simulation of the containers unloading and directed the outgoing ships towards the Sink. The ships carried different types of containers that were located in specific locations in the yard. To simulate this aspect, it was assumed in the model that the unloaded containers could consist of 5 types, in relation to which they were located in 5 different areas in the yard. This rule was introduced considering a Trigger on Creation in the Source relating to the containers. To simulate the unloading of the ship, 7 Cranes were considered that represented a part of the RMGs operating in the port. The containers were moved from the quay to the yard by 15 transporters representing existing SCs. Finally, the yard was composed of 5 FloorStorages, which represent the 5 areas previously defined. In the project scenarios, the IAVs were reproduced through the use of Robots.
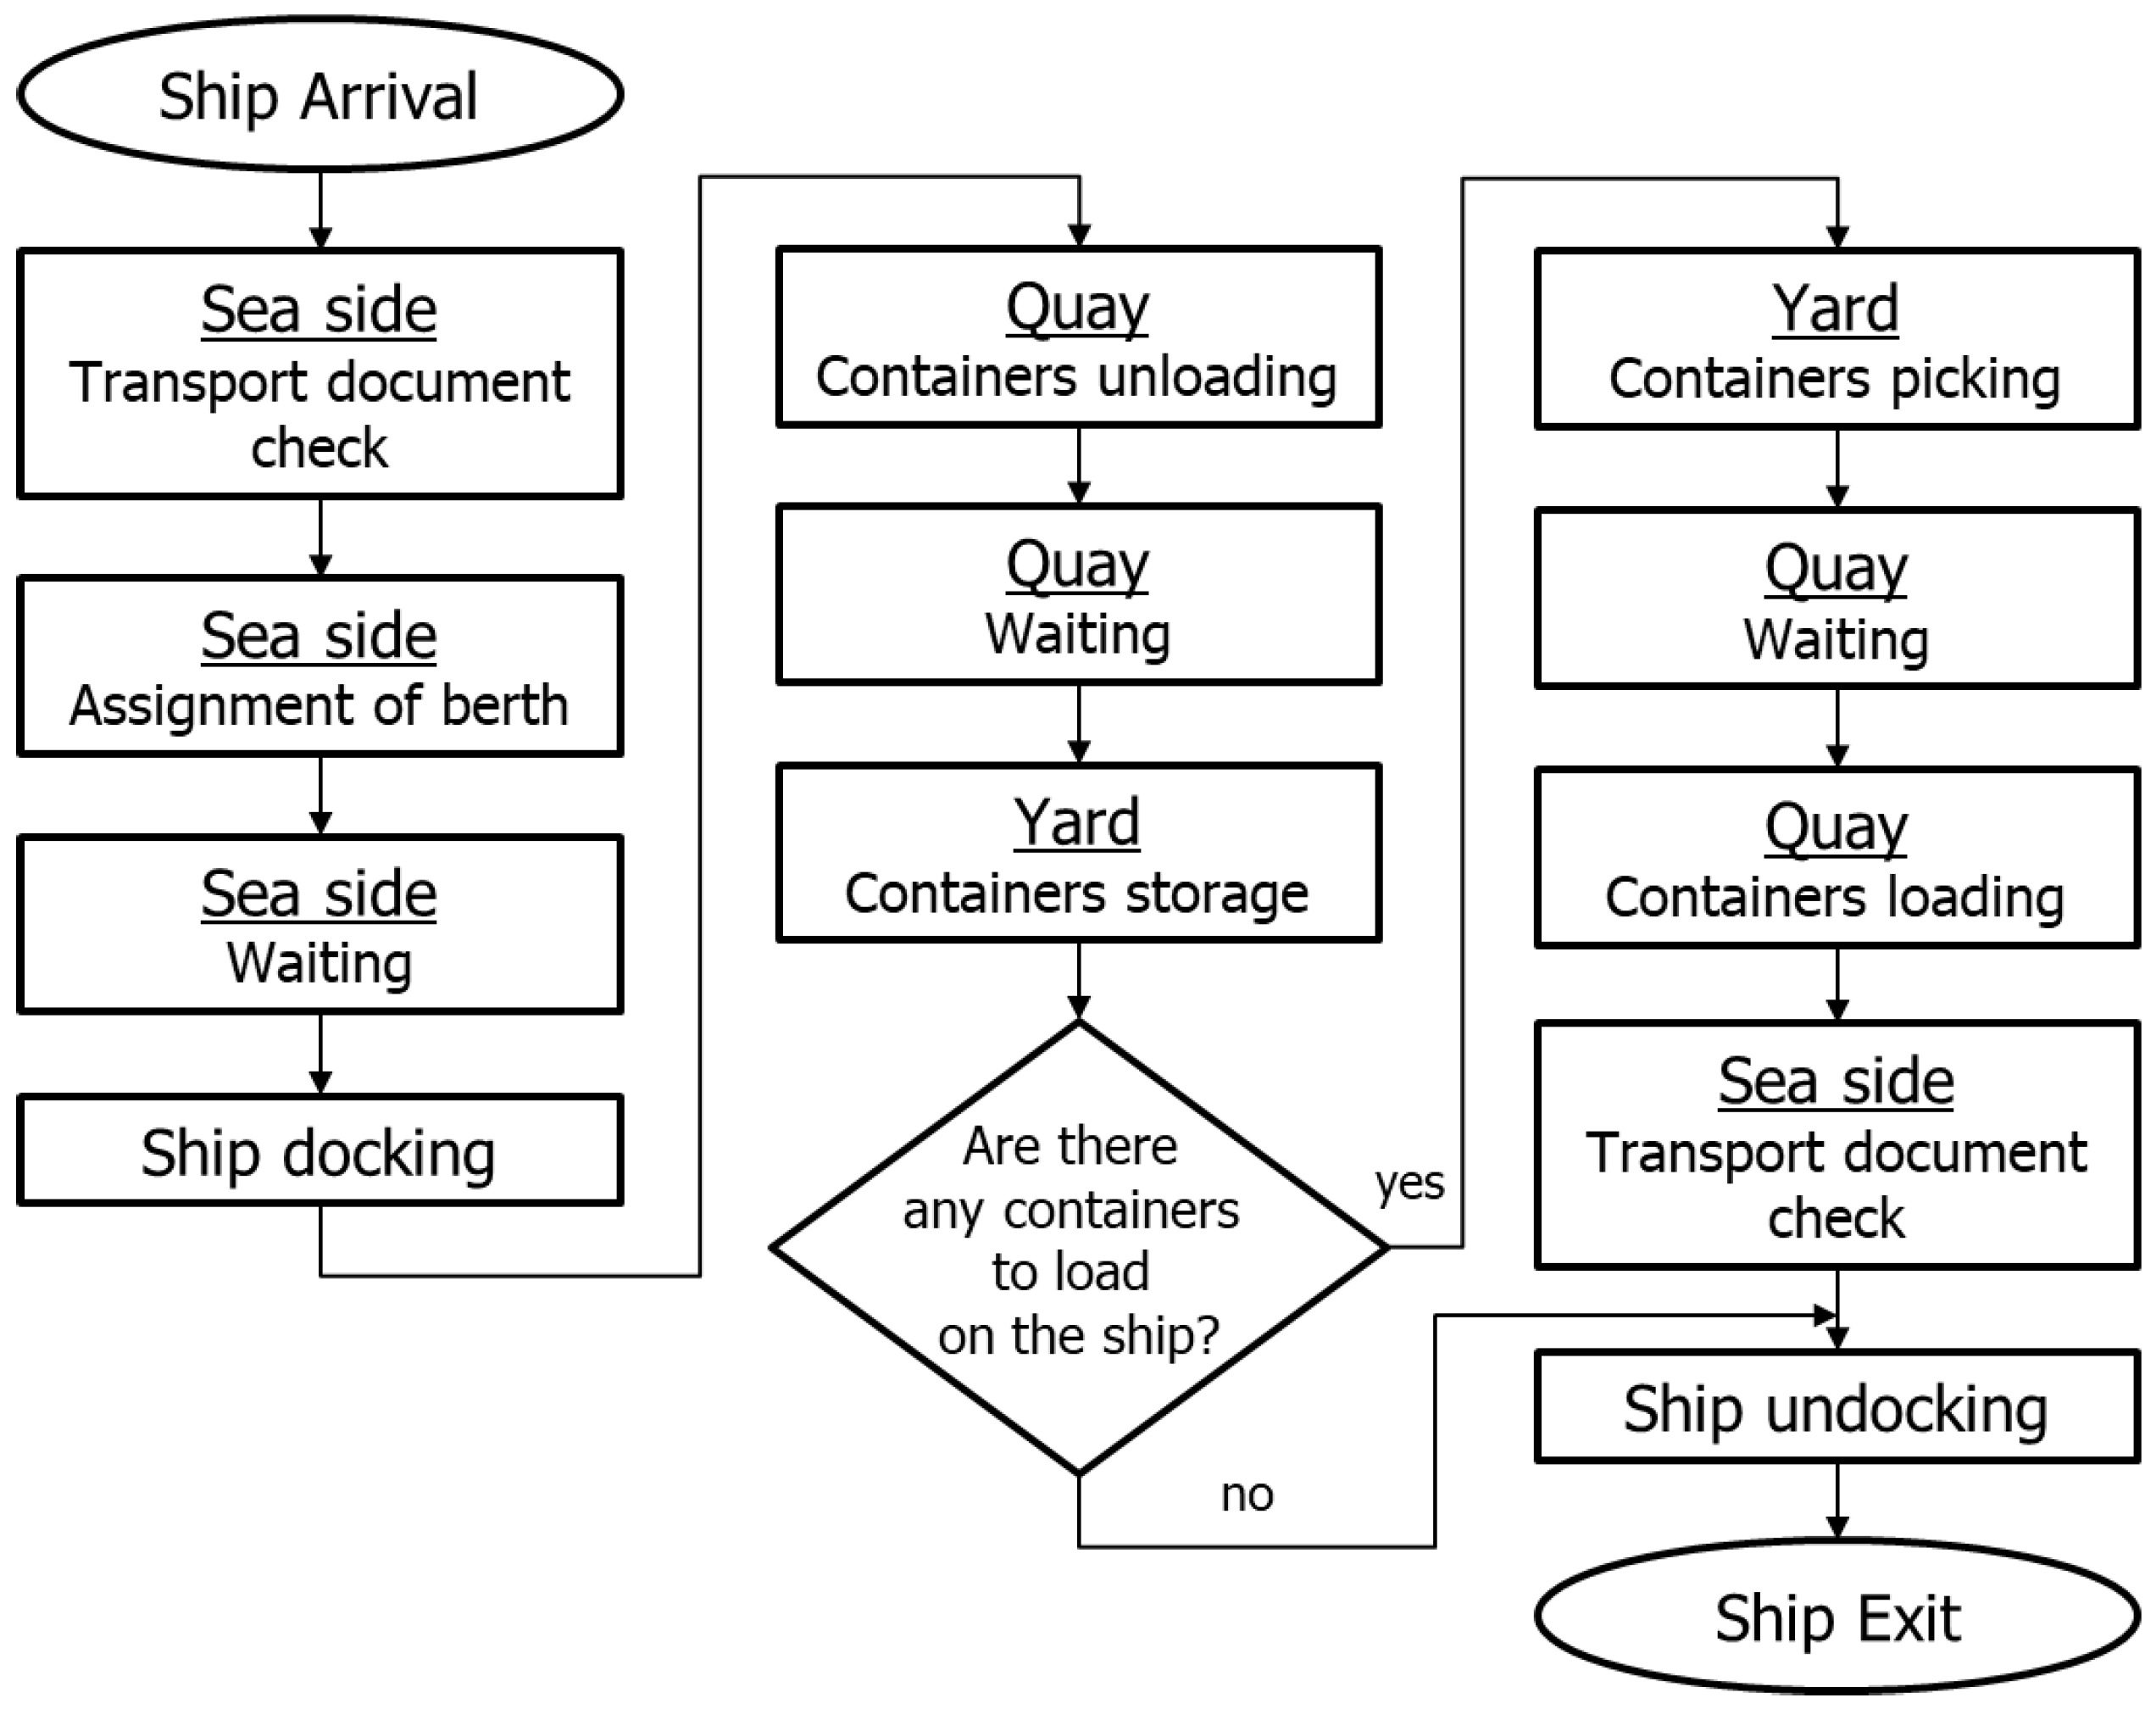
Figure 5 shows the flow chart related to the activities from the ship’s arrival to its exit. The ship approaching the port was identified and the transport document was checked; if the check was successful, a berth was assigned. The vessel remained at sea for as long as the berth was available; then, it approached and the containers were unloaded from the ship to the buffer on the quay. The containers were moved to the yard and, at the same time, it was verified whether containers needed to be loaded onto the ship; otherwise, the ship left the port. Whether the containers were to be loaded onto the ship, the HUs picked up the containers from the yard and placed them in the storage buffers on the quay, and then loaded them onto the ship, attaching the transport documents. The ship undocked and left the port.
6.3. Input Data
The data relating to the ship’s arrivals in the port were found on the website of the Port System Authority of Gioia Tauro. In 2021, from January to July, 824 ships landed for a total handling of 1,736,615 TEUs. The simulations were performed over a period of one day.
From the data available on the Internet, it emerged that, generally, there were 15 berths/ship on the quay; therefore, for the area under consideration, it was reasonable to assume an average of 4 arrivals per week, which included 3 feeder vessels (500 containers) and 1 mother vessel (10,000 containers).
The containers unloaded from the ships was conducted using rail-mounted gantry (RMG) cranes; in the case study, 7 RMGs were considered. The performances of each RMG are shown in
Table 2.
The area of the yard considered in the study included 10 areas. The containers were stored in the yard according to complex logics that were not analyzed. In the simulation, it was assumed that the containers were located in the yard in relation to the destinations; 5 storage blocks were defined. At the start of the simulation, it was assumed that the yard was completely empty.
The containers being handled from the quay to the yard occurred with 15 SCs, with the maximum speed set at 320 m/min (literature data: 20–26 km/h) and an average lifting speed of 18 m/min.
Three simulation scenarios were constructed: the first (scenario 0) reproduced the system configuration at present; scenario 1 was built starting from scenario 0 by partially replacing the HUs for container storage with fully automated vehicles with a maximum speed of 6 m/s (8 SCs and 7 IAVs); and in scenario 2, container handling was conducted exclusively by IAVs. The final goal was to analyze the operations of the HUs in the different areas in terms of the handling time and number of containers stored.
6.4. Simulation Results
The simulation results in the three scenarios can be compared considering the number of containers stored in the yard (
Table 3). During the simulation time, 2 ships arrived at the quay: in dock 1, a feeder ship was docked and all 500 containers transported were unloaded; a mother ship with 10,000 containers arrived in dock 2, where approximately 65% of the cargo (6526 containers) was unloaded.
In scenario 0, of the containers unloaded in dock 2, only 5.5% waited to be stored (360 containers); this meant that the handling system was efficient and able to operate without slowing down the node performance. the total number of containers stored in the yard was 6661. In scenario 1, the partial replacement of the fleet entailed an improvement in the performance of the port; in fact, although the percentage of containers stored compared to those unloaded was approximately the same (5%), in the same reference period, the number of containers stored was higher (6996). In scenario 2, the total replacement of SCs with IAVs produced a marked improvement in the operation of the port; in this case, 9462 containers out of 15,000 were stored in the reference period: +41% compared to the configuration at present and +8% more than in scenario 1.
Table 4 shows the number of containers handled by each HU. In scenario 0, ordinary HUs handled on average about 444 containers each; in scenario 1, SCs handled an average of 447 containers each, while automated HUs were able to move a higher number of containers, an average of about 487 containers each. In scenario 2, IAVs moved on average about 630 containers each, about +42% compared to scenario 0 and +35% compared to scenario 1.
Table 5 shows a summary of the simulation results of the three scenarios. As can be seen, scenario 2, although it involves significant investment costs offset by the elimination of personnel costs, shows an improvement in port performance compared to scenario 0: +42% of stored containers (
Nstock) and −88.89% of the permanence time (
tdock) of the containers in the quay.
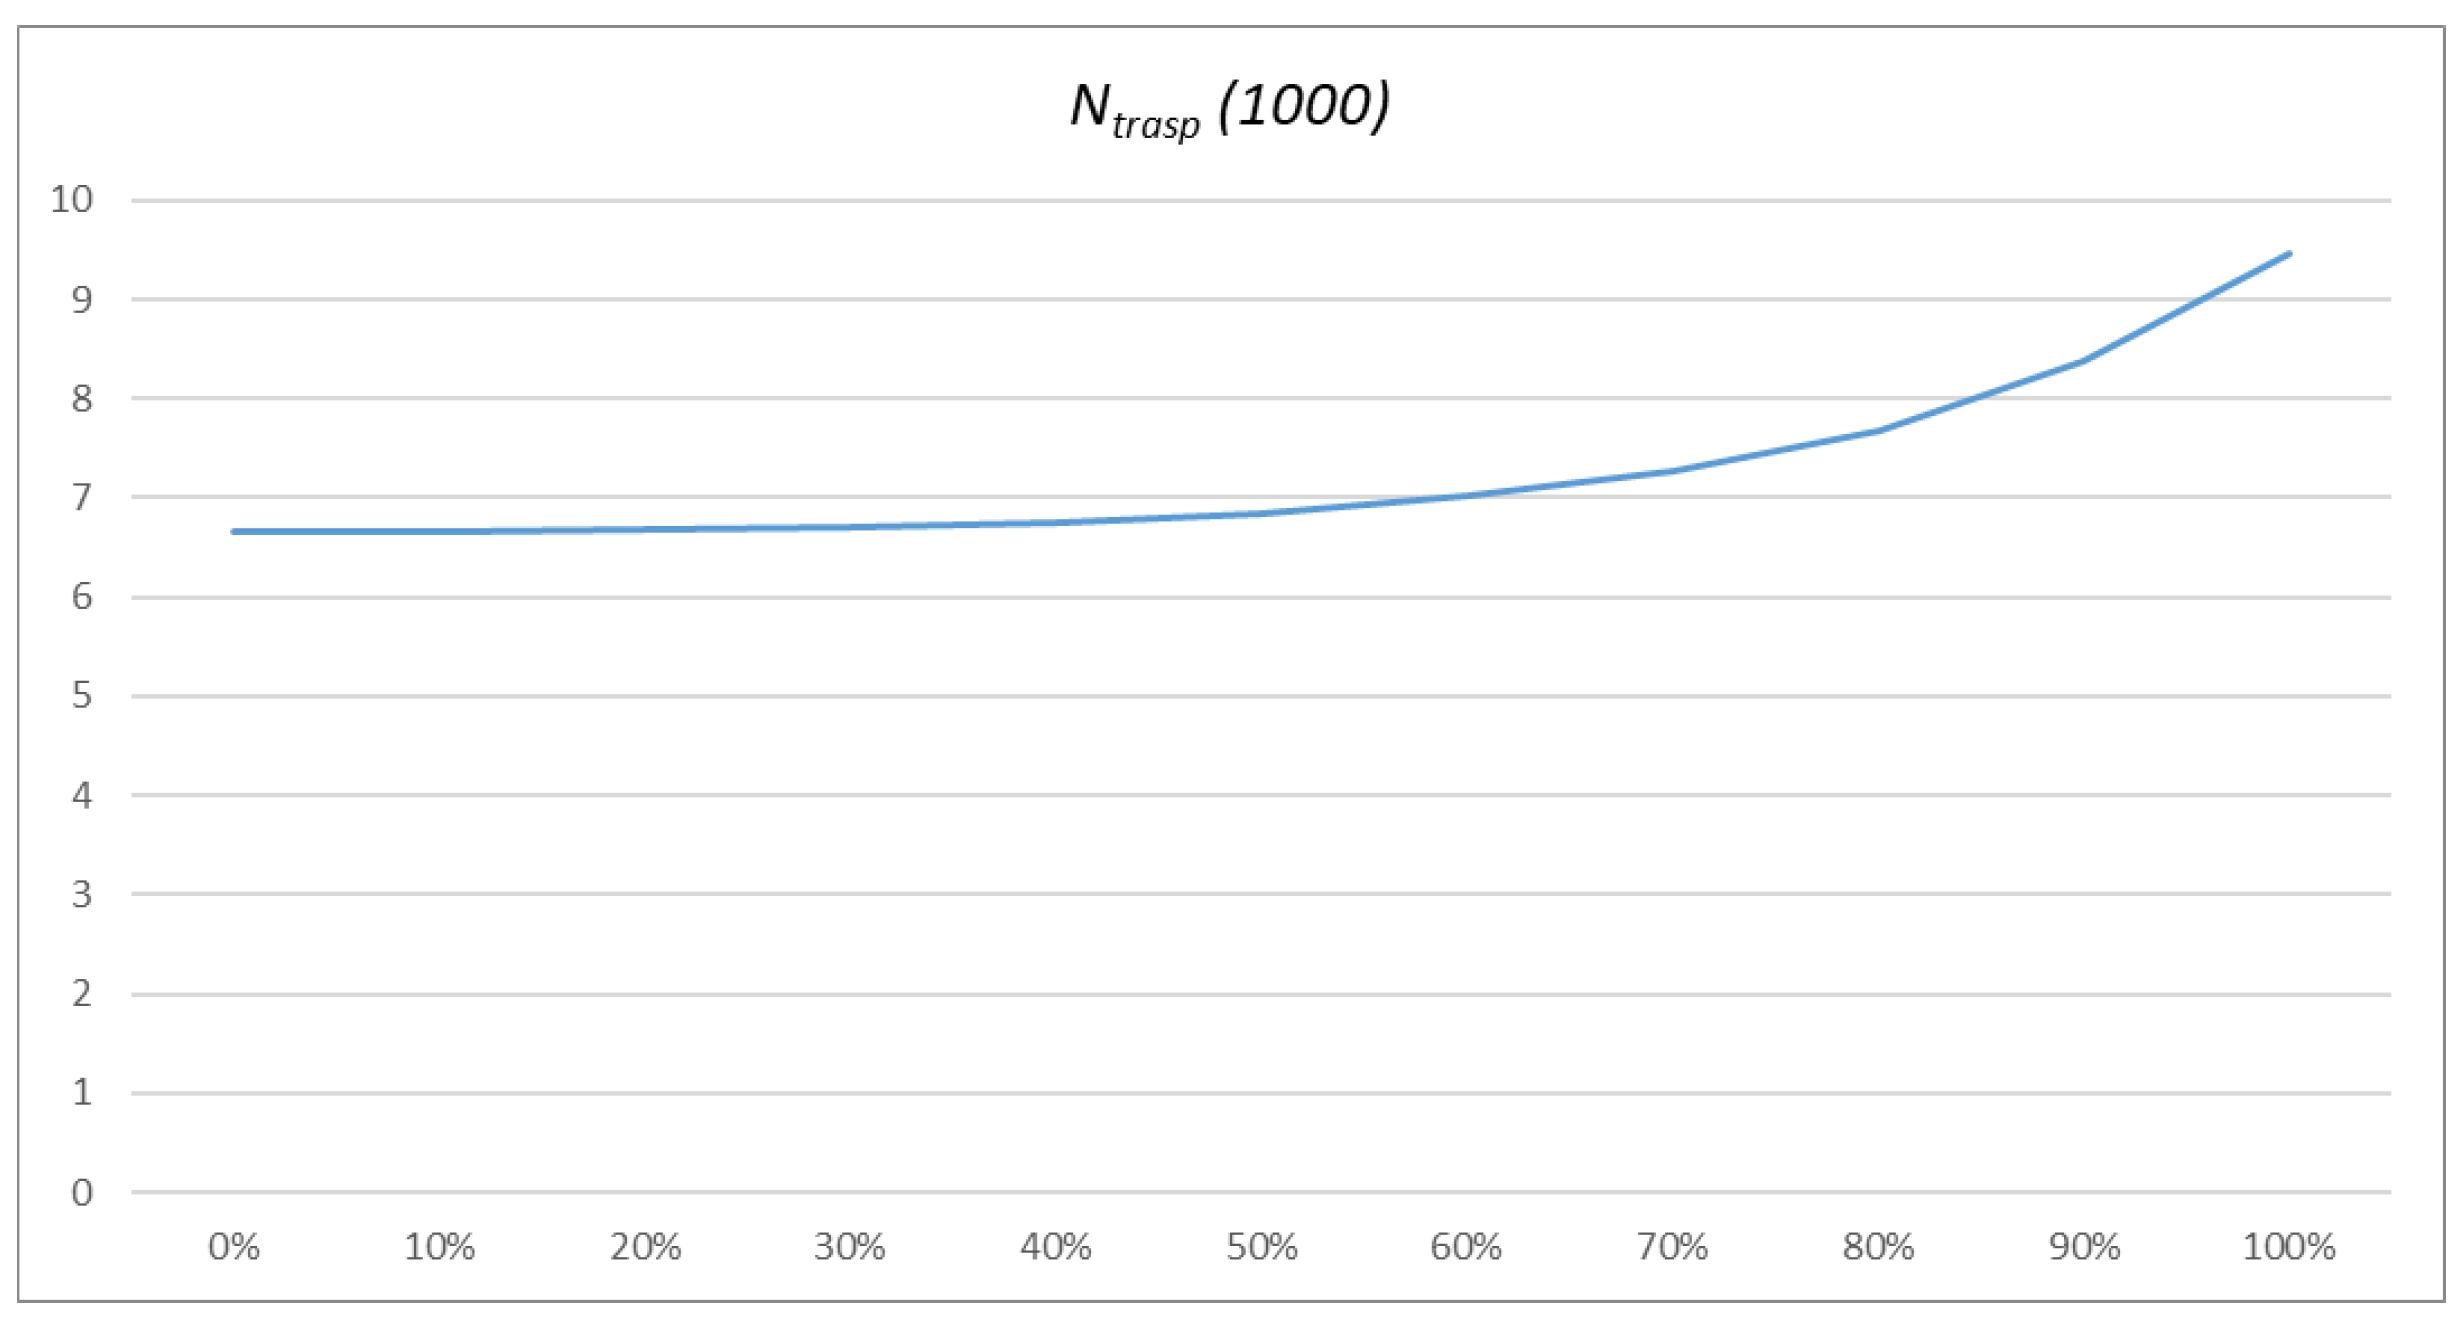
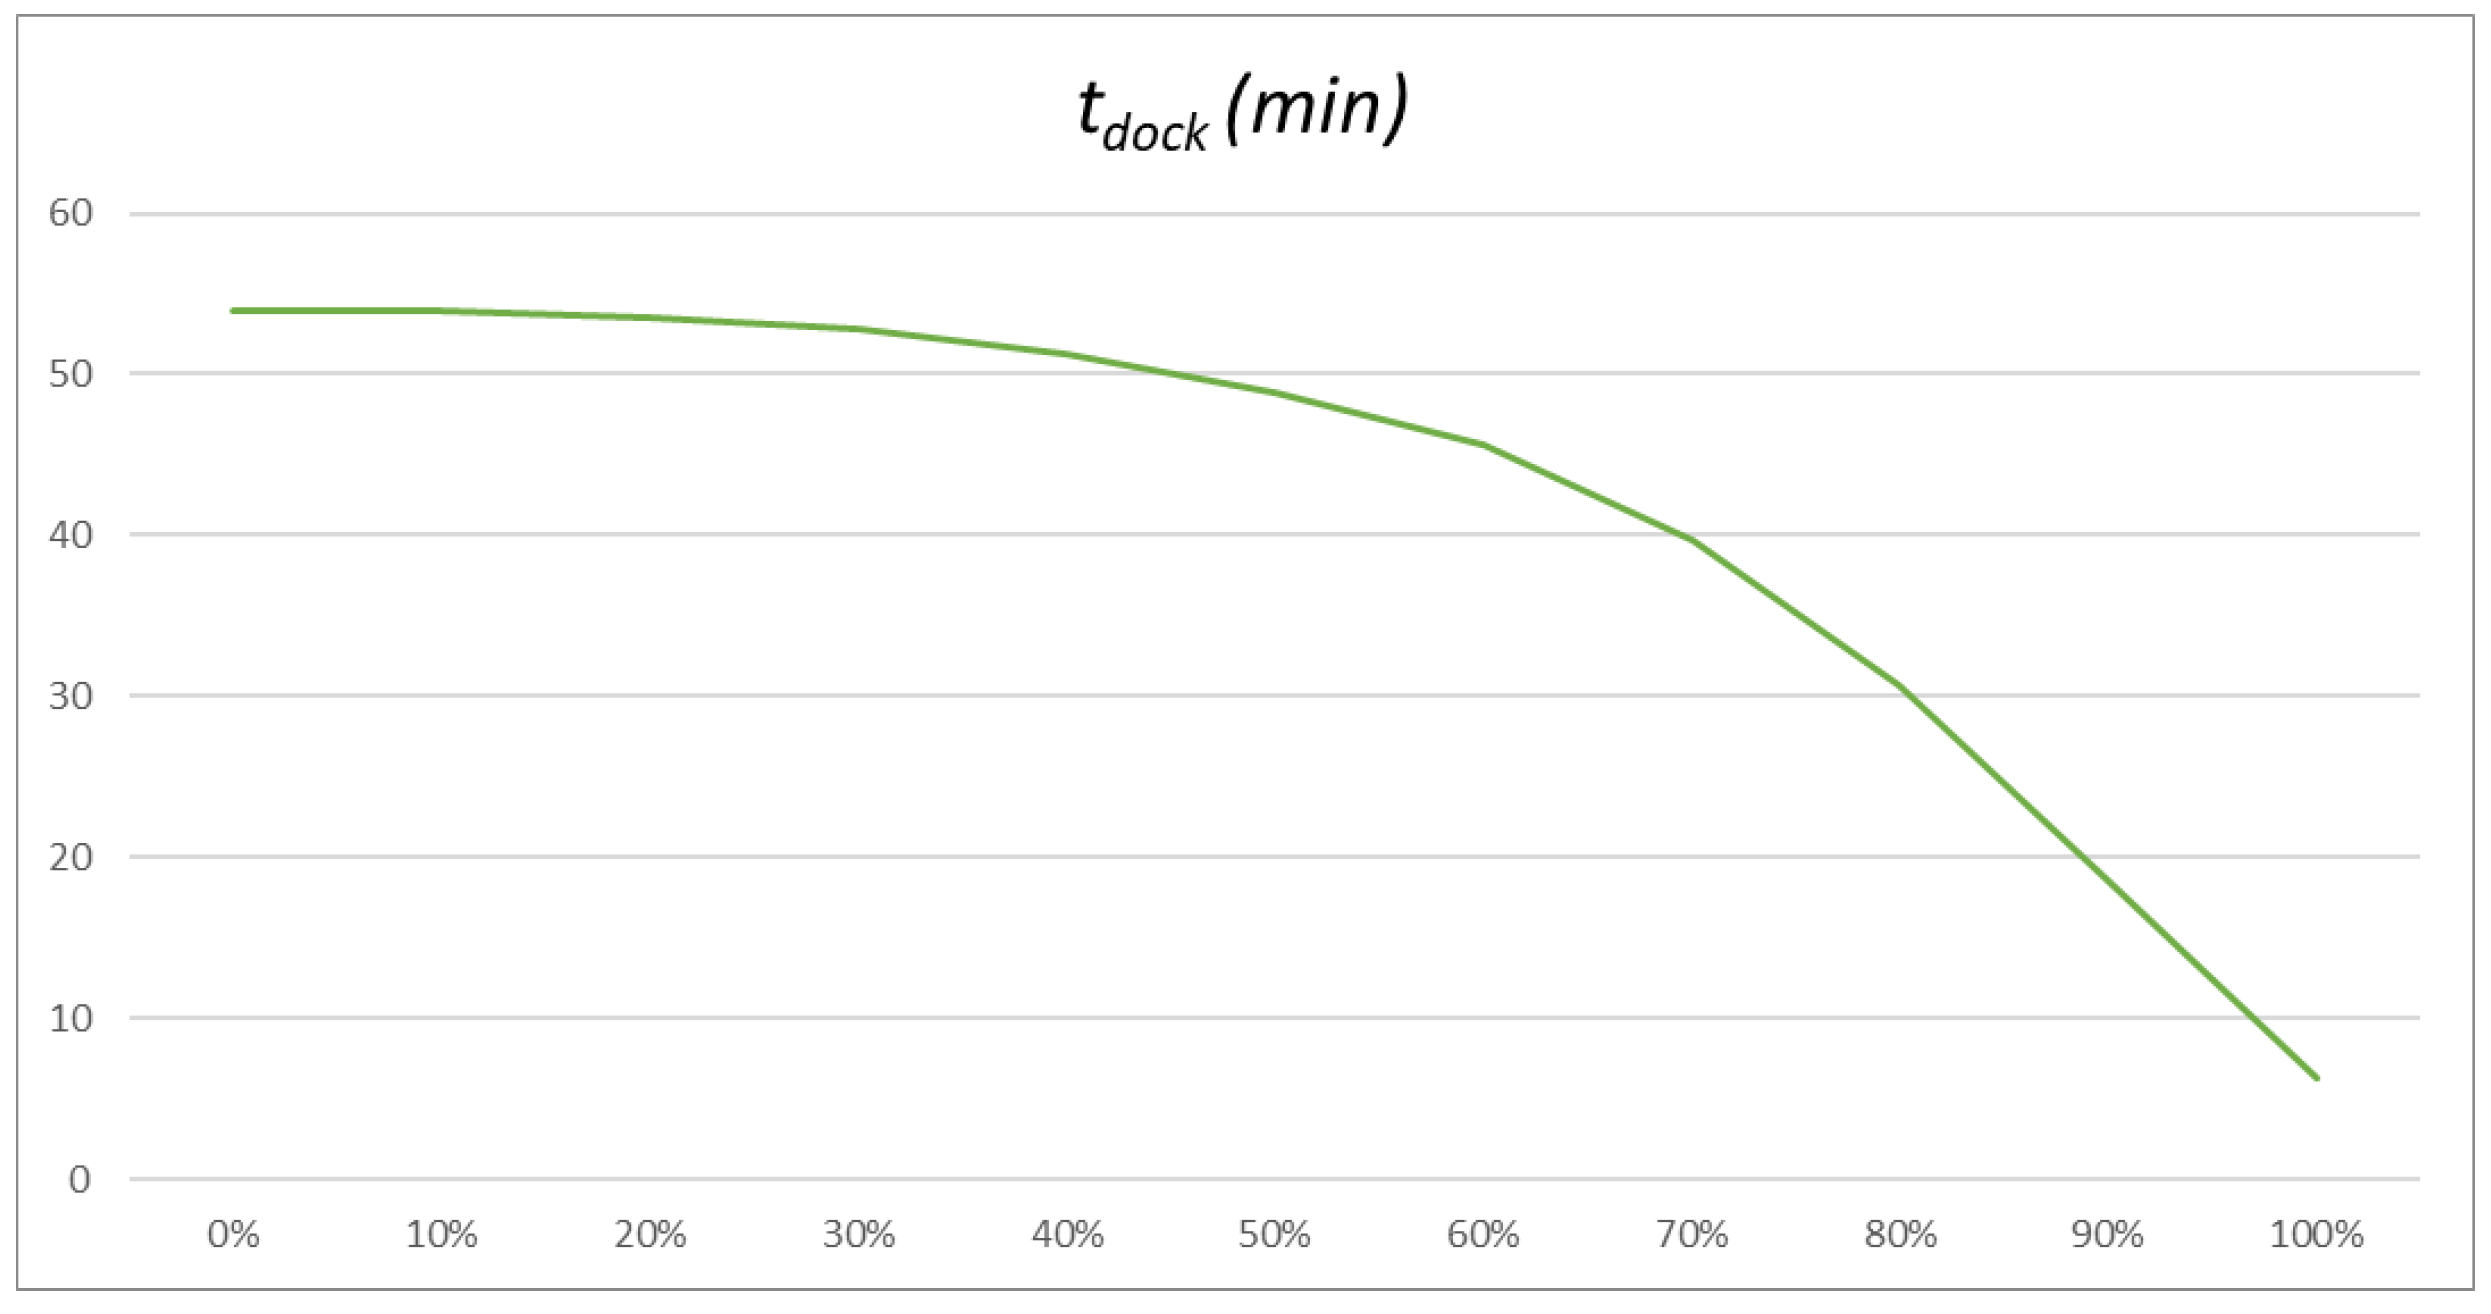
The robustness of the results was evaluated with a sensitivity analysis; the number of stored containers (
Nstock) and the permanence time (
tdock) of the containers in the quay were obtained by gradually increasing the level of automation of the HUs (+1 automated HU at each simulation level), starting from a configuration where the HUs were all SCs (0%—scenario 0) up to a configuration where the HUs were all IAVs (100%—scenario 2). The trends of
Nstock and
tdock are shown in
Figure 6.
Nstock increased with a trend of a parabola with upward concavity; it had irrelevant increases from a 0% automation up to 60%, then the increases were significant up to the last level with an increase of about 13%. tdock had a trend of a parabola with a downward concavity parabola; it had insignificant decreases up to the 60% level, then these decreases became modest until the last level showed a decrease of 66%.
A port performance evaluation can be performed, even in relation to the activity status of each HU. In particular, from
Figure 7, it can be observed that, in scenario 0, the SCs are forced to work at their maximum capacity in order to meet the storage needs of the container port. In fact, the state of activity of these HUs, in the simulation period, was close to 100%, which resulted in a situation of near-saturation.
In scenario 1, the SCs worked without periods of inactivity; the IAVs were able to guarantee the performance of activities with an average rest period of 40%. This suggests that it is possible to reduce the HUs, with consequent economic reductions, by reducing the inactivity of IAVs, guaranteeing the same performance. In scenario 2, IAVs improved port performance, maintaining an average activity level of 80%.
7. Conclusions
The need to optimize activities within logistic nodes, such as container ports, has pushed the managers of these systems towards intelligent solutions that can improve the ports’ performance by increasing productivity and reducing logistic times. In this context, the automation of HUs has become widespread at present, which allows freights to be moved in ports without a driver, thanks to intelligent structures managing the means functions. Each port area can be organized in an intelligent way to guarantee more efficient freight management; in particular, by introducing and managing advanced HU technologies. Automated HUs have higher operating costs than traditional ones; however, they produce positive results for safety, consumption, and air pollutants emissions, too.
The paper presented a framework for the most used HUs in a port considering the automation systems widespread in this sector. The automation of port activities addressed the logistics site to a better degree in terms of the environmental, social, and economic aspects.
The main goal of the study was to evaluate the impacts of automation in a container port; in particular, an application was introduced to analyze the system’s performance by the partial or total replacement of ordinary HUs, by using a what-if approach, with the aid of specialized simulation software.
The simulation results show how system efficiency can improve, thanks to the introduction of automated systems. The advantages related to these technologies do not only lead to an improved performance; it is possible to make economic considerations. Repaying the costs of purchasing vehicles and building the operations center that manages their activities, IAVs produce low operating costs considering the costs of the operators to be zero.
The developed analysis presented some limitations that the authors wanted to overcome in the future research. Given the very broad port context, we decided to focus our attention on a portion of the port; the aim was to extend the results to the entire system.
A more in-depth analysis of the selected configurations will also be proposed and a sensitivity analysis on the modification of the input parameters will also be applied.
Future research developments should concern the evaluation of other system characteristics, such as monetary costs and energy consumption. Finally, the research will also address the optimization problem by using optimization algorithms to support the decision-making problem, such as advanced heuristics and metaheuristics [
73,
74,
75,
76,
77,
78].


