Article

Life Cycle Assessment of Current Portuguese Railway and Future Decarbonization Scenarios

Low Carbon & Resource Efficiency, R&Di, Instituto de Soldadura e Qualidade, R. do Mirante 258, 4415-491 Grijó, Portugal
*
Authors to whom correspondence should be addressed.
Sustainability 2023, 15(14), 11355; https://doi.org/10.3390/su151411355
Submission received: 29 May 2023 / Revised: 3 July 2023 / Accepted: 14 July 2023 / Published: 21 July 2023
(This article belongs to the Special Issue Sustainable Railway Infrastructure and Rolling Stock)

Abstract

:
Given the current EU decarbonization targets, the railway transport is a key player to boost mobility toward more sustainable transportation, as it is currently the cleanest high-volume mode of locomotion available. However, a study analyzing the life cycle environmental impact of the existing conventional Portuguese railway has never been performed. Aiming to address this research gap, this paper presents an attributional life cycle assessment (LCA) to quantify the environmental impacts of the Portuguese railway infrastructure and rolling stock, using the Douro line case study. Through the LCA methodology, the current setting (using electric and diesel rolling stock) and three scenarios of full-line electrification (considering 2019, 2030, and 2050 electricity mixes) were analyzed for hotspot identification and an outlook on EU-aligned long-term sustainability prospects. In the current scenario, railway operation accounts for 74% of the total carbon footprint, mostly due to the fuel use of diesel trains and the expended electricity of electric train and infrastructure operation. The total electrification of the line and rolling stock can reduce carbon emissions by 38%, 56%, and 63%, if the 2019, 2030, and 2050 electricity mixes are considered, respectively. Further reductions could also be achieved with on-site renewable energy generation and through future low-carbon construction work strategies.

1. Introduction

As the world grapples with the mounting challenges of climate change and dwindling energy resources, the urgent need to develop and promote sustainable and environmentally friendly transportation solutions and mobility services for the future is becoming clear. The need to decrease worldwide greenhouse gas (GHG) emissions requires a unified action on all fronts, and the transportation sector, as one of the main CO2 emitters, must implement solutions to curb fossil fuel energy usage with the utmost urgency.
In this context, railway transport has the potential to be a key contributor to carbon footprint reduction and the promotion of an eco-conscious economy and lifestyle, since it is considered the most environmentally friendly high-volume means of transportation available and is far cleaner than its direct competitors: air travel and road traffic [1]. Indeed, although it accounts for around 8% of the world’s passenger transportation market and 7% of the freight market, it contributes just 2% to the total transport sector emissions [2]. Unlike other transportation forms, railway transport is the only one to have progressively lowered its total emissions, with a 2% reduction between 2000 and 2018 [3]. This is leading to increased investment from both the private and public sectors [4].
In addition to the ambitious decarbonization objectives established by the Paris Agreement for the year 2050, worldwide transportation demand, in terms of passenger-kilometers (pkm) traveled, is expected to double by that date [5]. As such, railway transportation has the potential to assume a central role in long-term transport sector decarbonization.
Life cycle environmental impact analyses have an important role in supporting these findings, and, thus, assisting sustainable policymaking. Several life cycle assessment (LCA) studies of both existing and prospective railway lines worldwide were conducted. Table 1 outlines the most relevant previous work, describing the regional context, the analyzed railway type, the functional unit, the processes included in this study, and the impact categories or indicators assessed.
Banar and Özdemir [6] combined LCA and life cycle costing (LCC) methodologies to evaluate both the environmental impact and cost of the Turkish railway (consisting of 888 km of high-speed railway (HSR) and 11,112 km of conventional railway (CR)), in terms of infrastructure and operation. For the HSR, most of the environmental impact is from infrastructure components, at 58%, with railway operation accounting for the remaining 42%. However, for the CR (the most representative of Portugal’s railway network), the authors found the reverse scenario, with railway operation accounting for 61% and infrastructure just 39%.
Wang et al. [7] analyzed the life cycle energy consumption and CO2 emissions of the infrastructure, trains, and operation of China’s HSR, through the application of the Tsinghua-LCA Model (TLCAM), focusing on the case study of the Beijing–Shanghai HSR line, comparing it to other means of transportation. It was concluded that the HSR has a clear advantage in terms of energy savings and carbon footprint reduction per pkm: GHG emissions were just 0.10, 0.24, 0.26, 0.32, and 0.38 times those resulting from, respectively, air flight, gasoline automobiles, diesel automobiles, electric automobiles, and public transportation. The authors also studied the effect of future Chinese electricity generation decarbonization efforts on the energy consumption and GHG emissions on this HSR line, concluding that the projected reduction of 60% in carbon emissions from the year 2015 (benchmark) to the year 2050 were possible.
Pritchard [8] applied an LCA methodology to conduct extensive comparisons between road and rail travel, comparing the available carbon calculator tools for accuracy by using real-world data and identifying the key components behind train energy use: traction energy, energy for auxiliaries such as heating and lighting, and regenerative energy recuperation via braking systems. It was also found that passenger occupancy levels can greatly affect modal transport comparisons, with railway transportation in particular having highly variable occupancy rates. Comparisons using carbon calculator tools showed a clear tendency for railway transportation to be cleaner than the road alternatives, but this is dependent on context, with assumptions regarding route, service type, and driving style making a significant difference. However, Pritchard concluded that “rail should be able to play an important role as part of a wider sustainable transport system”.
Likewise, Trevisan and Bordignon [23] published a screening LCA comparing the published literature on air, road, and rail travel, aggregating comparable studies for these three transportation modes and identifying common environmental hotspots within each one. It was found that the three transportation modes share similar patterns in terms of the relative contribution of the different processes. Namely, the operation of vehicles in road travel, of trains in railway transportation, and of airplanes in air travel was consistently the biggest hotspot in terms of emissions.
Cuenot [24], on behalf of the International Union of Railways (UIC), performed an analysis of 10 different LCA studies of railway infrastructures [9,10,11,12,13,14,15,16,17,18], in an attempt to identify the best methodology and provide suggestions on ways to uniform and harmonize railway environmental impact analyses. The following studies were analyzed. Tuchschmid et al. [9] evaluated the carbon footprint and other environmental impact of railway infrastructure and rolling stock, for both high-speed and local/conventional lines, using average emission factors taken from the ecoinvent 2.2 database. The methodology was applied by the authors to data from Germany, Switzerland, France, Italy, Spain, Norway, Belgium, Japan, and India. Chester [10] compared the environmental impacts of road, rail, and air transport in the United States, for local and high-speed infrastructures. ADEME, RNF, and SNCF [11] quantified the carbon footprint of new HSR infrastructure, by focusing on the case study of the Rhine–Rhône line in France. Loffredo et al. [12] measured the carbon footprint of the infrastructure construction phase, for the development of projects and programs enabling CO2 reduction, focusing on the Italian Bari–Taranto line. Asplan Viak AS [13] studied the environmental impacts of constructing new rail infrastructure for freight and passenger transport, centering on the case study of the Follo line in Norway (from Oslo to Ski). Grossrieder [14] analyzed the environmental impacts of a future Norwegian HSR infrastructure for passenger transport, based on the Oslo–Trondheim corridor. Sanz et al. [15] quantified environmental, economic and social impacts of different transport modalities in Spain, and focusing on passenger high-speed infrastructures. Hill et al. [16], estimated the GHG emissions of both freight and passenger transportation for local–regional and high-speed lines, accounting for infrastructure construction and use, vehicle manufacturing, and end-of-life vehicles of air, rail, road, and ship transportation modes, for the generic EU reality. INECO [17] evaluated the carbon footprint for the construction of new passenger HSR lines in Spain. Baron et al. [18] measured the carbon footprint of new HSR lines, with the methodology applied to data from two French lines (LGV Mediterranée from Valence to Marseille and the South Europe Atlantic Project from Tours to Bordeaux), a Taiwanese line (Taipei–Kaohsiung), and a Chinese line (Beijing–Tianjin).
Of the above studies, Cuenot [24] concluded that the approach undertaken by Tuchschmid et al. [9] was the most transparent, versatile, and comprehensive of all tested. The country-specific analyses of Tuchschmid et al. [9] highlighted how dependent railway environmental performance is on the geographic region and the operation phase. While the emissions per pkm of the railway infrastructure are similar for the majority of analyzed countries, the emissions per pkm for line operation vary greatly, from almost insignificant to several multiples of the infrastructure emissions. This mostly varies due to the electricity mix characteristics and train occupancy rates of that region. Indeed, the work of Tuchschmid et al. [9] showed that countries with the best environmental performance per transported user either present the cleanest electricity supplies (Switzerland, Norway, and France) or have very high occupancy rates (India and Japan). As an extreme scenario, a case study of the Indian railway network highlighted the effect of the load rate on the environmental impact per passenger very well. Despite India having a highly polluting energy generation mix and a large share of the rolling stock running on diesel, train occupancy is so high that the total CO2 emissions per pkm are very reduced, at just 9.1 g.
The methodology and the corresponding impact factors of Tuchschmid et al. [9] were also adopted in other recent works on the impact of railway lines, namely, a study from Kortazar et al. [19] detailing the environmental impacts of the existing HSR line in Spain; an LCA by Landgraf and Horvath [20] analyzing the carbon emissions for the entire Austrian railway network infrastructure; and a study by Gratzer [25] on the environmental impact of the Alpine railway infrastructure and rolling stock. These facts, coupled with the possibility of gathering a detailed inventory (an important requirement for this methodology), led to its choice as the approach to apply for this case study.
Comparisons of the different construction techniques for railway infrastructure and their impact on the life cycle environmental burdens were also recently published. Namely, Celauro et al. [21] combined LCA and LCC analyses of five alternative scenarios, incorporating different materials and construction methods, for the erection of a typical double-track railway line. These scenarios were applied to two different functional units: 1 km of embankment section and 1 km of cut section, both considering a straight alignment. Adding to this, the authors also studied the effects of two distinct maintenance approaches. Focusing on the conclusions of the environmental impact assessment, the initial construction phase is the main source of the environmental burdens, contributing to at least 80% of the total impact. Of this, material production is the main hotspot, being consistently responsible for more than 50% of the total burdens. The embankment sections showed a considerably higher impact than the equivalently constructed cut sections, and the use of lime stabilization techniques and recycled materials showed good results in terms of lowering the environmental impact.
Regarding the Portuguese infrastructure, the only published LCA was by Jones et al. [22], with the authors conducting an assessment of the long-planned HSR line between Porto and Lisbon. They found, similarly to most of the published HSR literature, that train operation accounts for most of the environmental impact (69% of CO2-eq., 76% of SO2, and 82% of PM10). A sensitivity analysis also showed that substituting the Portuguese electricity mix with that of countries with cleaner energy generation brings expressive reductions in overall GWP values—using Norway’s mix, a reduction of 63% was obtained.
However, this work by Jones et al. [22] remains a prospective study, since HSR lines are yet to be built in Portugal, with the full extent of the national network being conventional rail. Therefore, so far, there are no life cycle studies quantifying the environmental impact of the Portuguese railway network given its current state and infrastructure. The present work intends to fill this research gap, as it is of crucial importance to assess the present status to guide future sustainable policies for the sector at national level. To accomplish this, a novel in-depth life cycle analysis of the Douro line was performed, including not only the current infrastructure and rolling stock powertrains but also the future infrastructure upgrades required for fully electric rolling stock and forthcoming electric mixes.
The Douro line, in its present condition, extends for 163 km, between the localities of Ermesinde and Pocinho. It is a railway line of high strategic interest, as it has historically allowed for the shortest connection between the Atlantic marine port of Leixões in the city of Porto and the Spanish border. Inserted in a mountainous region throughout its entire length, it is characterized by strong differences in elevation for the first 70 km and a mostly flat layout after that, with some small climbs and descents as it trails along the valleys of the Douro wine region and the edges of the Douro River. Thus, this LCA study focusing on the Douro line can serve as a baseline proxy to assess the Portuguese conventional railway’s environmental performance.
The article is structured as follows: Section 2 describes the system under analysis and reports on the applied methodological framework; Section 3 presents the results of the environmental analysis for the several studied scenarios, identifying the main parameters and elements that contribute to environmental hotspots, with a view not only to assess the current environmental situation but also to perform some projections on the future performance of the line according to European decarbonization goals. At the end of Section 3, the obtained results are discussed and compared with the available literature, unfolding topics for further research; finally, Section 4 reports on the main findings and takeaways of the paper and offer the final remarks.

2. Materials and Methods

2.1. Goal and Scope Definition

This study aims to quantify the environmental impact of the construction and operation of the Douro railway line, through the application of an LCA methodology following ISO 14040 [26] and ISO 14044 [27]. To do so, a functional unit (FU) of 1 pkm was considered, as commonly found in the literature. The environmental impacts were assessed from the extraction of raw materials (cradle), through construction and maintenance of infrastructure and rolling stock and ending at the conclusion of the use phase. Adding to the novelty of the analysis, both the current infrastructure and rolling stock powertrains as well as future infrastructure upgrades and fully electric rolling stock were studied.
Overall, the following four distinct scenarios were simulated (Figure 1):
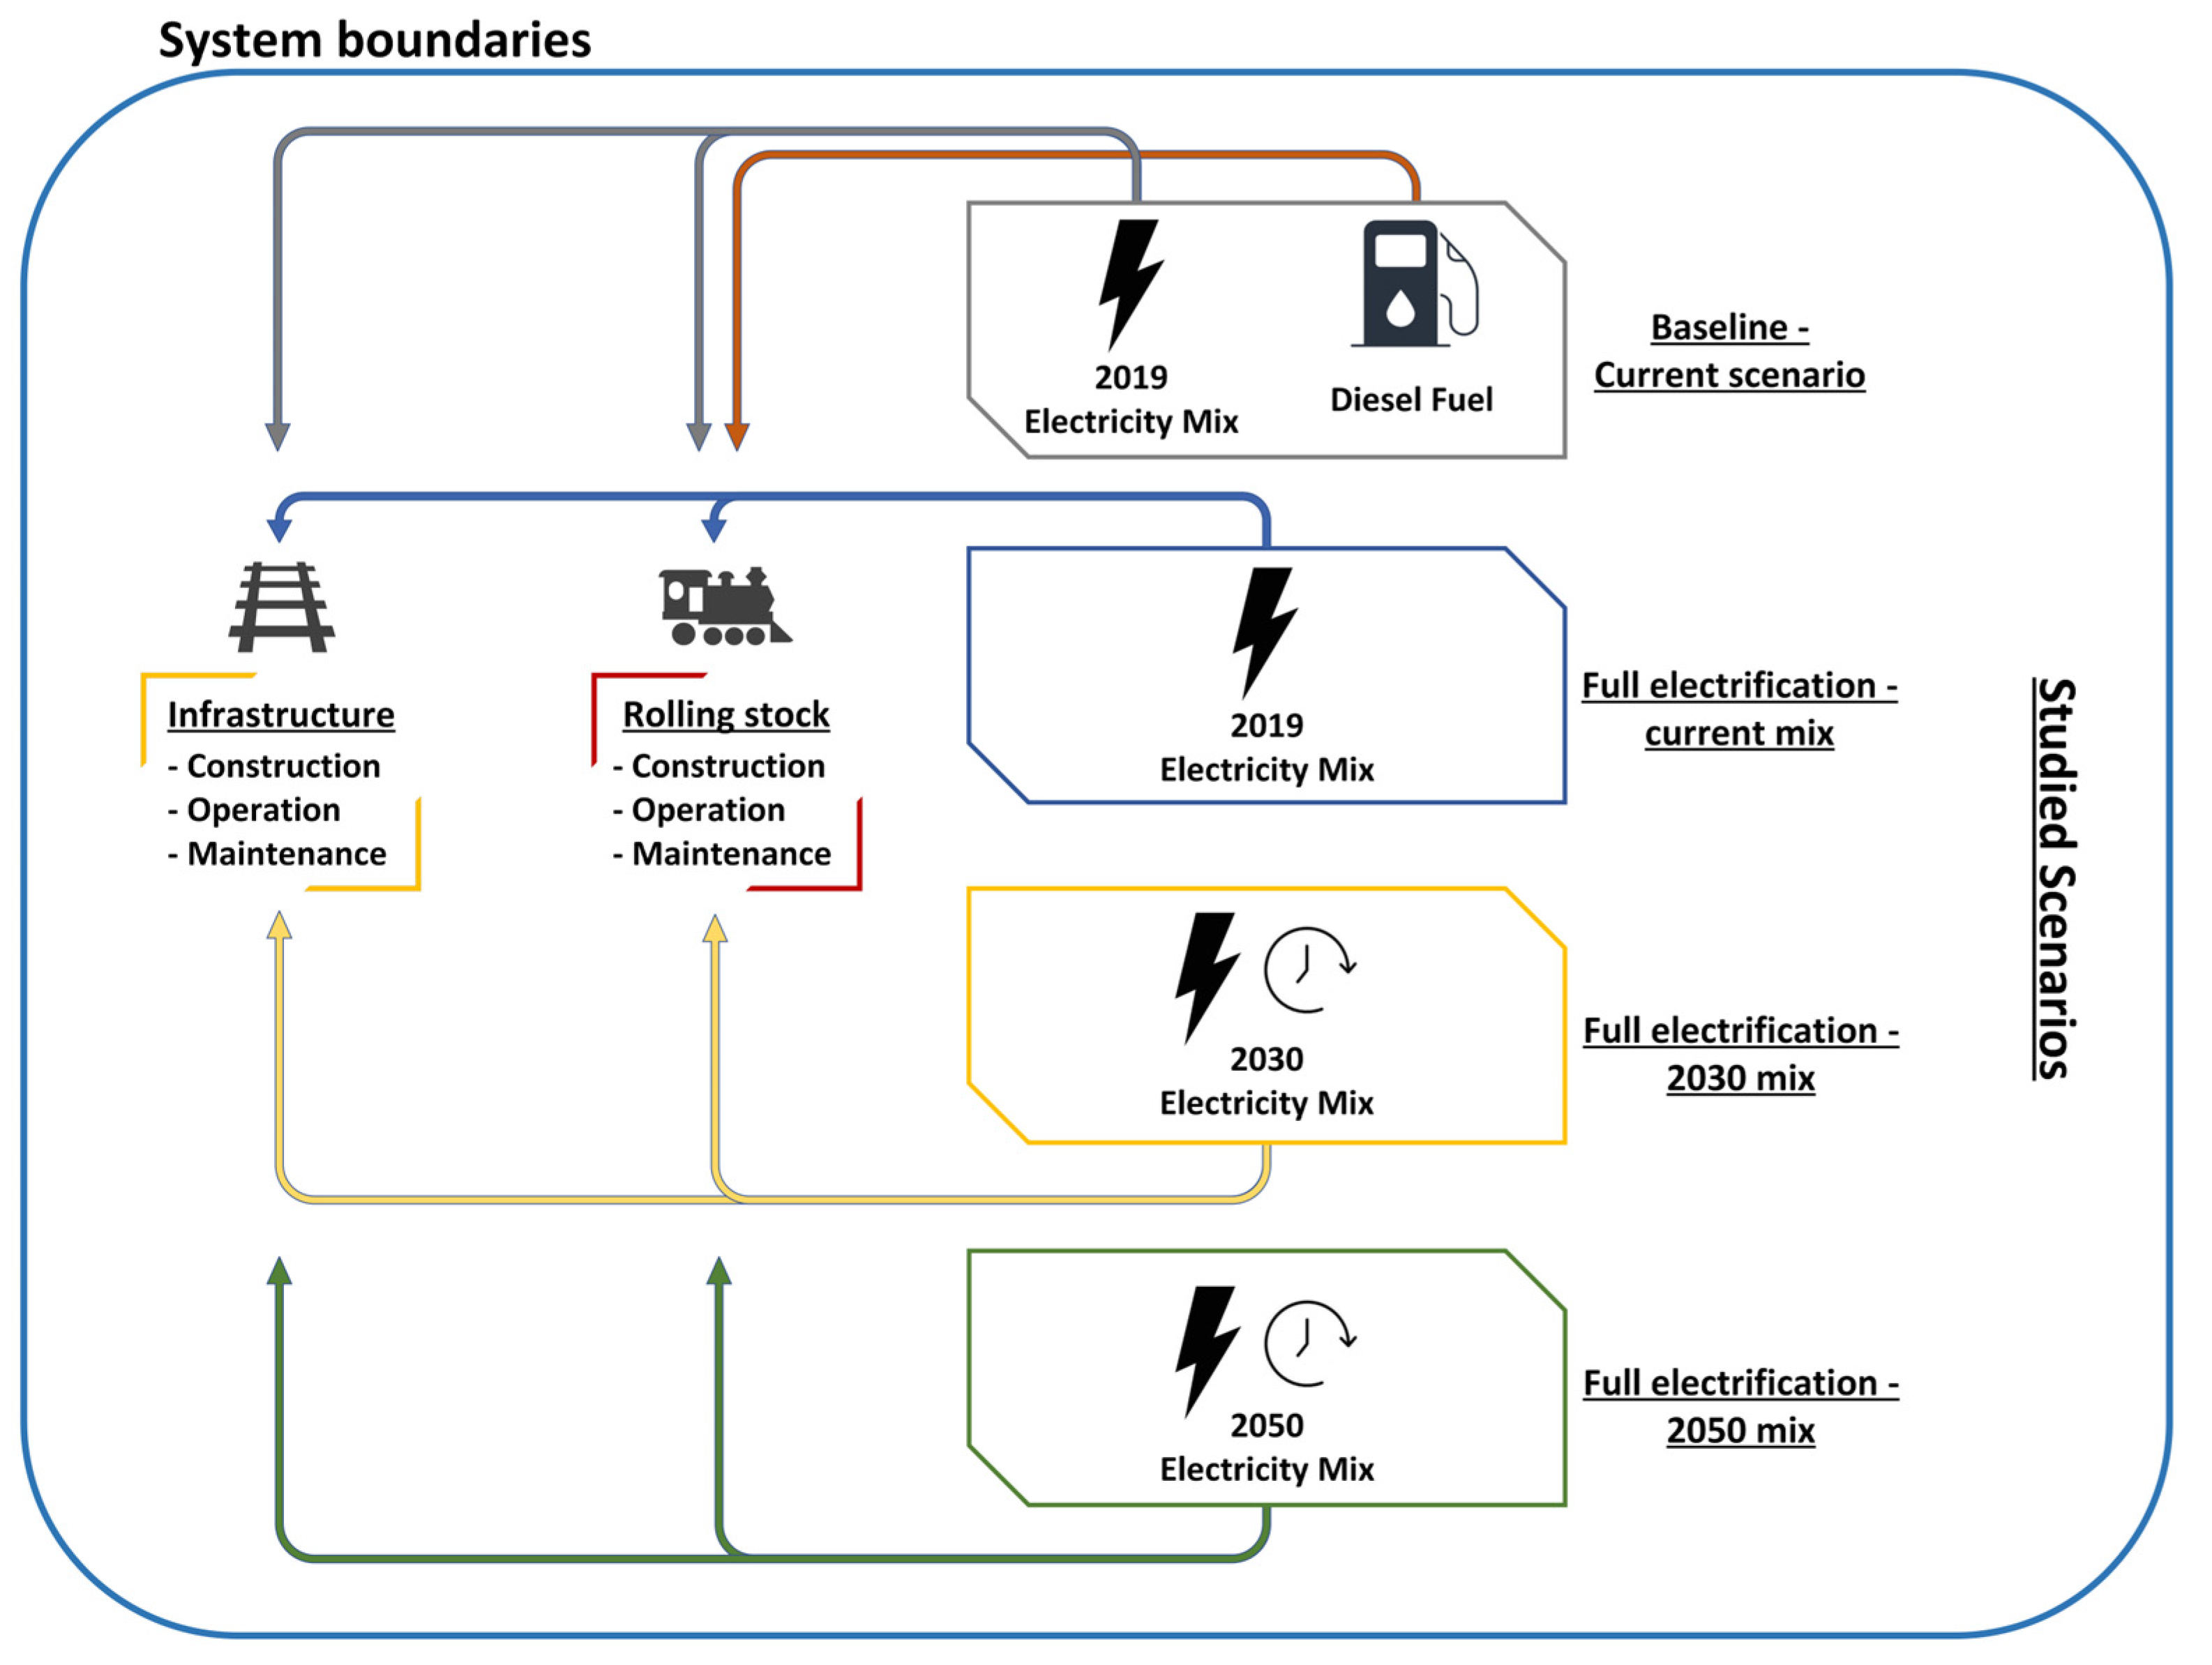
The first scenario (baseline—current scenario) studies the environmental impact of the Douro railway line for the year 2019, the last year of regular operation (without route suppressions due to COVID-19 control measures), with the simultaneous use of diesel and electric rolling stock.
In the second scenario (full electrification—current mix), the impact of complete line and rolling stock electrification was studied, considering the Portuguese electricity mix for 2019. From Marco de Canaveses up to Pocinho station (the line’s terminus), the line was now regarded as electrified (currently, it is not), and the diesel rolling stock was exchanged for an identical amount of electric rolling stock.
The third scenario (full electrification—2030 mix) shares the second scenario’s premise of full electrification; however, the electric mix was updated to reflect the Portuguese government’s projections for 2030, available for consultation in Roteiro para a Neutralidade Carbónica 2050 [28] and in line with the European Union’s objectives for progressive decarbonization (set by the Paris Agreement).
The fourth scenario (full electrification—2050 mix) builds on the previous two, but instead considered the electricity mix projections for the year 2050 [28], which is the set date to reach carbon neutrality for electric production.
To evaluate the environmental impacts of the infrastructure construction and maintenance, elements such as bridges, tunnels, electrical substations, passenger stations, earthworks, ballast deposition, rails, catenary system, and signaling infrastructure were considered. Additionally, considering the operation of the railway line, the construction and maintenance of the rolling stock, diesel fuel for diesel train locomotion, and electricity for infrastructure operation and electric train locomotion were also taken into account.
On the other hand, materials; processes such as wheel, brake, and overhead train line abrasion; the means of transport of the passengers to/from the station; support infrastructure for the train station (such as parking lots); disposal; and other end-of-life scenarios for the infrastructure and rolling stock were considered out of scope.

2.2. Life Cycle Inventory (LCI)

The present work was conducted by resorting to secondary sectorial LCA data proposed by Tuchschmid et al. [9]. The authors present impact values for a comprehensive set of railway elements and rolling stock. The LCI gathering consisted of the compilation of the quantities of each of these elements/impact factors for the complete Douro line. Some elements were measured by km of line (e.g., km of single and double track, km of bridges, and km of rails), while others were quantified by the total number of units present in the railway (e.g., number of passenger stations, electrical substations, and trains). This information was then coupled with primary data obtained from Infraestruturas de Portugal and Comboios de Portugal.
The ecoinvent 3.8 database [29] was used as a source of secondary data on the impacts of the electricity consumption of electric trains and the operation emissions of diesel trains, based on average emission factors.
Statistical data provided by Infraestruturas de Portugal, quantifying the annual train kilometers (tkm) traveled on the Douro line for 2019, show that 98% of all traffic traversing the railway is destined for passenger transportation, with only 2% corresponding to freight. Therefore, for the purposes of this work, only the environmental impacts of passenger transportation were considered, with a 100% impact allocation for this type of transport. Moreover, pkm data were divided by the different categories of passenger train service on the Douro line, since the propulsion type varies between them. They are divided by urban + suburban (electric trains only), regional (diesel only), and long distance (diesel only). Since no explicit pkm numbers could be gathered, an estimate was calculated through the pkm/tkm ratios per train service, as presented in the report Ecossistema Ferroviário Português 2017 [30]. These ratios were multiplied by the tkm/service numbers provided by Infraestruturas de Portugal. Table 2 compiles the obtained numbers.
For the rolling stock, inventory quantities were also estimated from information in the Ecossistema Ferroviário Português 2017 report. Seven UME3400 electric trains and ten AD592 diesel trains were assigned to the line. Tuchschmid et al. [9] provided impact data for four different types of train. The regional train type was selected since it is the closest in total weight to the UM3400 and AD592 trains coupled with passenger carriages. The compiled LCI is shown in Table 3.
To simulate the full electrification scenarios, additional catenary wiring and structure and the electrical substation planned for construction in Bagaúste [31] were considered in the LCI. The annual traveled pkm data associated with diesel propulsion were added to the pkm data for electric propulsion, and the 10 diesel trains were assumed to be replaced by 10 electric units. It is important to note that the marginal grid load increase due to full electrification scenarios may require further upstream changes (e.g., in terms of energy generation and distribution infrastructure). However, in this attributional LCA study, such upstream market consequences were out of the scope. Nevertheless, these could be further considered in future consequential LCA studies able to estimate adequate data on these possible future requirements.

2.3. Life Cycle Impact Assessment (LCIA)

To conduct this study, a combination of Microsoft Excel and SimaPro (v9.3) [32] were utilized. The gathered inventory data were combined with the individual impacts of each component, as reported by Tuchschmid et al. [9]. SimaPro (v9.3) was used to calculate the environmental impacts and flows of certain inputs, namely, the impact of the electricity usage for the different Portuguese electric mixes and emissions due to production, refinement, and burning of diesel, not considered in [9].
The impact indicators used for the LCIA and the corresponding impact methods are presented in Table 4. Results were compiled for the impact categories of Global Warming Potential (GWP) and Cumulative Energy Demand (CED). Additionally, the airborne emissions of elementary flows SO2, NOx, NMVOC, and PM10 were also quantified.

Limitations

Some materials and processes such as wheel, brake, and overhead train line abrasion, the means of transport of the passengers from/to the station, and support infrastructure for the train stations (such as parking lots) were out of the scope of this study. Likewise, possible end-of-life scenarios for the infrastructure and rolling stock and how these may impact the life cycle environmental burdens were not studied in this article. Also, for the full electrification scenarios, the authors only considered the required direct infrastructure additions (in terms of additional catenary wiring and structure and additional electrical substations). There may be further upstream infrastructure changes required in terms of energy generation and distribution to correctly accommodate the additional grid load of these scenarios.

3. Results and Discussion

The total impact results for the four scenarios can be seen in Figure 2, together with the percentual contributions of the different elements of the Douro railway.
In the current scenario, the operation phase presents a much larger contribution than infrastructure to the railway’s total environmental impact in all categories, except for PM10. Most of the operation phase impact is due to electricity and diesel consumption, especially the latter. The combination of both represents more than 70% of the total impact for GWP, CED, SO2, NOx, and NMVOC. These results foresee the drastic impact reduction that transitioning to pure electric locomotion may bring. It is also clear, through Figure 2, that the construction and maintenance of rolling stock have a small impact across all indicators.
As seen in the introductory section, the results above fall in line with most of the reviewed literature. Indeed, all papers analyzed by Trevisan et al. [23] reported a considerably higher contribution from the operation of the lines than infrastructure to the total emissions, and Jones et al. [22] reported the same in their prospective HSR study. Likewise, the national-scale case studies published by Tuchschmid et al. [9] show the same tendency for the railway networks of Germany, Italy, Spain, Belgium, India, and Japan (France, Norway, and Switzerland show a lower impact of operation due to the cleaner energy mixes being utilized). Banar and Özdemir [6] presented the same conclusions for the Turkish conventional railway, with train operation accounting for most of the GWP impact, followed by line construction, and the production and maintenance of rolling stock also presented very small contributions.
In terms of infrastructure, earthworks, sleepers plus ballast, and rails are the biggest overall contributors. The construction and maintenance of tunnels and bridges also presents a significant impact for GWP (6%) and PM10 (12%) emissions.
The results for the full electrification scenario with the 2019 mix show that operational impacts are greatly reduced in all categories except SO2. The average reduction across all indicators is 38%, with the savings in emissions for NOx rising to 78% and for NMVOC to 74%. Furthermore, looking at future scenarios, the planned progressive decarbonization of electric production means that, by 2030 and 2050, emissions from electricity will be greatly reduced. Comparing the 2050 scenario to the present situation, this leads to an average reduction in environmental impact across all indicators of 55%, which is effectively more than halving the present emissions.
Although the Paris Agreement and subsequent national climate action efforts tend to focus on GHG emissions (as they are the main driver of climate change), these results clearly show that decarbonization strategies can also lead to environmental impact reductions in a variety of other indicators.
It is also interesting to note, for the full electrification scenario with the 2019 electricity mix, how a comparatively small rise in the impact of electricity is enough to support the needs of the trains that previously ran on diesel, thereby avoiding the great amounts of pollution associated with the burning of this fuel.
Focusing on GWP, transitioning to fully electric rolling stock allows for a saving of 35 g of CO2-eq per pkm, which is 38% of the total. The effect of the electric mix is also visible: from the second scenario (fully electric transition with the 2019 electricity mix) to the fourth (2050 scenario), there is an additional reduction of 24 g of CO2-eq per pkm (41%). This equates to a total reduction of 63% in carbon emissions. The new catenary structure and electrical substation that need to be built for these total electrification scenarios have a small overall impact on the carbon footprint.
These results are also in line with those obtained by Wang et al. [7] and Jones et al. [22], regarding the high importance of electricity generation mixes for global railway environmental performance. Similarly, Kortazar et al. [19] concluded that a shift from the 2017 Spanish electricity mix to a fully renewable mix could lower GWP values from 54.65 to just 27.12 g of CO2-eq per pkm for passenger train transportation.
Figure 3 outlines the contribution to GWP of infrastructure vs. line operation and rolling stock, for the four studied scenarios. As already stated, in the current conditions, the operation phase represents most of the impact. However, since the infrastructure impact remains constant throughout the decades, a reduction in the operational phase impact also has the effect of increasing the infrastructure relevance. Indeed, from the current scenario to the 2050 scenario, railway operation decreases from 74% of the total carbon footprint to just 27%, with infrastructure evolving to be responsible for most of the emitted greenhouse gases.
To examine the possible courses of action for infrastructure impact reduction, a sensitivity analysis on the effect of the annual traveled pkm vs. the total carbon footprint/pkm, for the three studied full electrification scenarios, was conducted. The results are displayed in Figure 4, showing that a higher public adhesion to the railway can bring significant advantages, through increased economies of scale in infrastructure use. A rise from the current 1.81 × 10⁸ pkm to 3.00 × 10⁸ pkm permits a savings of 10 g of CO2-eq per pkm, which equates to an average reduction of 24% in carbon emissions across the three scenarios.
Despite full electrification showing promising results, to achieve a further life cycle decarbonized railway transport sector, joint efforts (and further research) should be focused on multiple complementary areas, such as the ones identified and discussed below.
The use of more environmentally friendly concrete mixtures is a viable course of action to reduce infrastructure impact. This can be achieved in a variety of ways, among which are carbon capturing during production [34], the use of clinker substitution technologies such as calcined clay plus lime [35], the employment of industrial waste and byproducts as admixtures (such as fly ash and granulated blast furnace slag) [36], and the introduction of recycled concrete aggregates [37]. Steel production for certain components such as rails, an identified hotspot, could also be made cleaner by shifting away from the typical blast furnace plus basic oxygen furnace production. For example, electric arc furnace technology and the direct reduction of iron with hydrogen could be used [38].
Adding to the above, developing lightweight alternatives for rolling stock production (e.g., based on composites, advanced steels, aluminum, or magnesium alloys [39,40]), despite a potential increase in embodied impact, may induce significant operational energy savings and a decline in the overall associated life cycle environmental impacts, since the use stage, namely, energy consumption, is still quite significant. Likewise, the integration of digitalization and information technologies into the next generation of train infrastructure and rolling stock also seems to be a very promising field. The development of tools such as intelligent traffic management, smart grid and energy monitoring, and eco-driving assistance for train conductors can potentially bring significant increases in operational efficiency.
With the operational energy requirements further reduced, the promotion of on-site renewable energy generation can also be a worthwhile prospect for railway carbon neutrality, by locally enabling the offset of emitted pollutants, with potentially lower distribution losses. Photovoltaic power stations could be constructed on the premises of railway electrical substations or on nearby land. Also, currently unused space such as service facilities and station rooftops or rolling stock roofs could easily be installed with photovoltaic panels. Given the present technology, this would only be enough to satisfy a small portion of the overall energy needs of these individual elements [41], but this is likely to improve since photovoltaic technological progress has been constant. It is important to mention that in this attributional study, the upstream market consequences of the marginal grid load increases of the full electrification scenarios were not considered; nevertheless, these could be further considered in future consequential LCA studies able to estimate adequate data based on possible grid future requirements.
Despite being out of the scope of this study, research focused on possible end-of-life scenarios for the railway elements and rolling stock (i.e., end-of-life material handling, recovery, recycling, and (ideally) the efficient reuse of components) may hold great potential for environmental impact reduction and circular economy promotion.
Finally, the presented results may be used in studies aiming to compare alternative transportation modes and types. Such comparisons may also include the time dimension and the clustering types of transport based on transportation speed ranges, for a fair comparison. It is important to note that LCA studies are usually based on “user-distance” functional units being agnostic to transportation speed, which is one of the factors that influences the transportation mode selection. Thus, to compare railway journeys with other forms of passenger locomotion such as air or road travel, the typical average speed of these transportation modes should be considered. Indeed, while a certain transportation option may be the cleanest for a passenger or cargo to traverse a given distance, the travel times for that option can be uncompetitive to the point of it not being a viable choice. Studying the balance between these two dimensions can be quite worthwhile in the effort of promoting modal shifts, as the time efficiency of travel is strongly connected to higher economic gains (through increased productivity) and improved quality of life. It can, therefore, quite often be the deciding factor when choosing between modes of transport. As such, from a business and consumer perspective, being informed of the transportation options that offer the best balance between low environmental impact and fast travel times can perhaps be more valuable than simply knowing what the overall cleanest option is. Also, while it would be expected for the use phase’s environmental impact to increase in importance together with increases in average speed (due to higher energy use), this is not always the case. In the study by Banar and Özdemir [6], for example, the use phase of the CR lines accounted for 61% of the total environmental impacts, while that of the faster HSR lines was reduced to just 42%. This can be due to a series of factors, such as potential increases in the efficiency of the newer and faster rolling stock or the more demanding infrastructure requirements for HSR than for CR (leading to a higher embodied infrastructure impact for HSR). However, the study of Banar and Özdemir [6] shows that further work is still necessary to gain a clearer picture of the trade-offs between average speeds and the environmental burdens per user.
Finally, by promoting railway transport as a quality alternative, with good transport-mode connections and equivalent speed ranges as other more polluting means of transport (such as the automobile), railway use rates can potentially increase. This would lead to superior economies of scale for the existing infrastructure and rolling stock, further assisting in the reduction in emitted pollutants per railway user.

4. Conclusions

The present LCA aimed at characterizing the Douro railway in terms of the overall environmental impact for six different indicators, both in terms of infrastructure as well as rolling stock and railway operation. The individual railway components and processes that represent environmental hotspots were identified, and potential improvement measures were analyzed. In addition to obtaining a characterization of the environmental impact of the Douro railway in its present condition, three additional scenarios were simulated. In the second scenario, the effects of transitioning from the current diesel locomotives to fully electric ones were studied, considering the current Portuguese electric mix. In the other two, the effect of the evolution to cleaner electricity production mixes was analyzed, specifically the planned Portuguese electric mixes for 2030 and 2050.
In the present situation, the railway operation phase represents most of the environmental impact for five of the six indicators and 74% of the total carbon footprint impact. A big part of this environmental impact is due to the electricity used to power the electric rolling stock and operate the infrastructure, which is mainly due to the burning of diesel to power diesel trains. It was found that the construction and maintenance of rolling stock, as well as the building and maintenance of stations and support buildings, has little impact in the overall emission values. In terms of infrastructure, the biggest environmental hotspots are earthworks for line construction, sleepers and ballast, and finally steel rails. For the alternate scenarios, replacing diesel trains with electric alternatives has a significant impact on all indicators except SO2. In terms of the carbon footprint, this transition allows for a 38% reduction in greenhouse gas emissions. As such, it is a priority in terms of short-term action.
Considering the big impact of electricity use on global railway emissions, the projected electric mixes for 2030 and 2050 are also determinant in the long-term decarbonization of the railway. The 2030 scenario allows an additional saving of 30% for the GWP values. The 2050 scenario elevates this saving to 41%. And if the comparisons are conducted for the present situation with the diesel trains still circulating, the total reduction in GHG emissions is 56% (2030 scenario) and 63% (2050 scenario). The remaining indicators also show promise: the 2050 projections lead to a 42% reduction in consumed primary energy, 8% in inhalable PM10 particles, 49% in SO2 emissions, 85% in NOx, and 76% in NMVOC. These results, however, still show space for improvement, which sparks further discussion and additional research work in complementary fields, namely:
-
Promoting a higher user occupancy, resulting in reduced environmental impact per user and per pkm;
-
Reducing infrastructure impact through cleaner manufacturing techniques for raw material hotspots such as concrete or steel;
-
Off-setting produced emissions by strategies such as on-site renewable energy generation;
-
Developing lightweight rolling stock through the use of advanced materials (e.g., composites, advanced steels, aluminum, or magnesium alloys), possibly leading to considerable operational energy savings;
-
Studying viable end-of-life scenarios for railway elements and rolling stock, such as possible pathways for the efficient reuse of components;
-
Further integrating digitalization tools into train infrastructure and rolling stock, helping to assist and promote operational efficiency.

Author Contributions

Conceptualization, T.R.d.S., B.M. and H.M.; formal analysis, T.R.d.S.; investigation, T.R.d.S.; writing—original draft preparation, T.R.d.S. and B.M.; writing—review and editing, T.R.d.S., B.M. and H.M.; visualization, T.R.d.S.; supervision, H.M. All authors have read and agreed to the published version of the manuscript.

Funding

This research work was funded by project FERROVIA 4.0, with reference number POCI-01-0247-FEDER-046111, co-financed by the European Regional Development Fund (ERDF), through the Operational Programme for Competitiveness and Internationalization (COMPETE 2020), under the PORTUGAL 2020 Partnership Agreement.

Informed Consent Statement

Not applicable.

Data Availability Statement

Not applicable.

Conflicts of Interest

The authors declare no conflict of interest.

References

  1. Saramago, G.; Montenegro, P.A.; Ribeiro, D.; Silva, A.; Santos, S.; Calçada, R. Experimental Validation of a Double-Deck Track-Bridge System under Railway Traffic. Sustainability 2022, 14, 5794. [Google Scholar] [CrossRef]
  2. International Energy Agency. The Future of Rail—Opportunities for Energy and the Environment. 2019. Available online: www.iea.org (accessed on 25 November 2022).
  3. International Union of Railways (UIC). Sustainability. 23 September 2021. Available online: https://uic.org/sustainability/ (accessed on 25 November 2022).
  4. Montenegro, P.A.; Ribeiro, D.; Ortega, M.; Millanes, F.; Goicolea, J.M.; Zhai, W.; Calçada, R. Impact of the train-track-bridge system characteristics in the runnability of high-speed trains against crosswinds—Part II: Riding comfort. J. Wind Eng. Ind. Aerodyn. 2022, 224, 104987. [Google Scholar] [CrossRef]
  5. OECD. ITF Transport Outlook 2017; OECD: Paris, France, 2017. [Google Scholar] [CrossRef]
  6. Banar, M.; Özdemir, A. An evaluation of railway passenger transport in Turkey using life cycle assessment and life cycle cost methods. Transp. Res. Part D Transp. Environ. 2015, 41, 88–105. [Google Scholar] [CrossRef]
  7. Wang, Y.Z.; Zhou, S.; Ou, X.M. Development and application of a life cycle energy consumption and CO2 emissions analysis model for high-speed railway transport in China. Adv. Clim. Chang. Res. 2021, 12, 270–280. [Google Scholar] [CrossRef]
  8. Pritchard, J. Investigating the Environmental Sustainability of Rail Travel in Comparison with Other Modes. Ph.D. Thesis, University of Southampton, Southampton, UK, 2015. [Google Scholar]
  9. Tuchschmid, M.; Knörr, W.; Schacht, A.; Schmied, M. Carbon Footprint and Environmental Impact of Railway Infrastructure; Öko-Institut e.V.: Berlin, Germany, 2011. [Google Scholar]
  10. Chester, M. Life-Cycle Environmental Inventory of Passenger Transportation in the United States; University of California: Berkeley, CA, USA, 2008; Available online: http://escholarship.org/uc/item/7n29n303.pdf (accessed on 28 November 2022).
  11. ADEME; RFF; SNCF. 1er Bilan Carbone Ferroviaire Global. September 2009. Available online: https://www.banquedesterritoires.fr/sites/default/files/ra/Le%20bilan%20carbone%20de%20la%20LGV%20Rhin-Rh%C3%B4ne.pdf (accessed on 28 November 2022).
  12. Loffredo, F.; Fedele, P.; Severini, M. The climatic mark of railway infrastructural projects. Ing. Ferrov. 2011, 66, 237–254. [Google Scholar]
  13. Asplan Viak, A.S. New Double Track Line Oslo—Ski, Life Cycle Assessment of the Follo Line—Infrastructure; Asplan Viak AS: Sandvika, Norway, 2011. [Google Scholar]
  14. Grossrieder, C. Life-Cycle assessment of Future High-Speed Rail in Norway. Master’s Thesis, Norwegian University of Science and Technology, Trondheim, Norway, 2011. [Google Scholar]
  15. Sanz, A.; Vega, P.; Mateos, M. Las Cuentas Ecológicas del Transporte en España; Ecologistas en Acción y Grupo de Estudios y Alternativas 21, S.L: Madrid, Spain, 2014. [Google Scholar]
  16. Hill, N.; Brannigan, C.; Wynn, D.; Milnes, R.; van Essen, H.; den Boer, E.; Van Gijlswijk, R. The Role of GHG Emissions from Infrastructure Construction, Vehicle Manufacturing, and ELVs in Overall Transport Sector Emissions; European Commission: Brussels, Luxembourg, 2011. [Google Scholar]
  17. INECO. Huella de Carbono de la Construcción de una Línea Ferroviaria de Alta Velocidad; INECO: Heteren, The Netherlands, 2012. [Google Scholar]
  18. Baron, T.; Tuchschmid, M.; Martinetti, G.; Pépion, D. High Speed Rail and Sustainability. Background Report: Methodology and Results of Carbon Footprint Analysis; Paris International Union of Railways: Paris, France, 2011. [Google Scholar]
  19. Kortazar, A.; Bueno, G.; Hoyos, D. Environmental balance of the high speed rail network in Spain: A Life Cycle Assessment approach. Res. Transp. Econ. 2021, 90, 101035. [Google Scholar] [CrossRef]
  20. Landgraf, M.; Horvath, A. Embodied greenhouse gas assessment of railway infrastructure: The case of Austria. Environ. Res. Infrastruct. Sustain. 2021, 1, 025008. [Google Scholar] [CrossRef]
  21. Celauro, C.; Cardella, A.; Guerrieri, M. LCA of Different Construction Choices for a Double-Track Railway Line for Sustainability Evaluations. Sustainability 2023, 15, 5066. [Google Scholar] [CrossRef]
  22. Jones, H.; Moura, F.; Domingos, T. Life cycle assessment of high-speed rail: A case study in Portugal. Int. J. Life Cycle Assess. 2017, 22, 410–422. [Google Scholar] [CrossRef]
  23. Trevisan, L.; Bordignon, M. Screening life cycle assessment to compare CO2 and greenhouse gases emissions of air, road, and rail transport: An exploratory study. Procedia CIRP 2020, 90, 303–309. [Google Scholar] [CrossRef]
  24. Cuenot, F. Carbon Footprint of Railway Infrastructure; International Union of Railways (UIC): Paris, France, 2016. [Google Scholar]
  25. Gratzer, H. Railway Infrastructure and Its Environmental Effects in the Alps (1945–Today). Master’s Thesis, Technische Universität Wien, Vienna, Austria, 2021. [Google Scholar]
  26. ISO 14040; Environmental Management—Life Cycle Assessment—Principles and Framework. ISO: Geneva, Switzerland, 2006.
  27. ISO 14044; Environmental Management—Life Cycle Assessment—Requirements and Guidelines. ISO: Geneva, Switzerland, 2006.
  28. República Portuguesa and Agência Portuguesa do Ambiente. Roteiro para a Neutralidade Carbónica 2050; República Portuguesa and Agência Portuguesa do Ambiente: Alfragide, Portugal, 2019. [Google Scholar]
  29. Ecoinvent. Ecoinvent Database. Available online: https://ecoinvent.org/the-ecoinvent-database/ (accessed on 9 September 2022).
  30. Autoridade da Mobilidade e dos Transportes. Ecossistema Ferroviário Português 2017; Autoridade da Mobilidade e dos Transportes: Lisboa, Portugal, 2019. [Google Scholar]
  31. Orlando, A. Governo dá luz Verde ao Financiamento para a Construção da Subestação Elétrica de Bagaúste. Jornal de Notícias, 17 March 2021. Available online: https://www.jn.pt/local/noticias/vila-real/peso-da-regua/governo-da-luz-verde-ao-financiamento-para-a-construcao-da-subestacao-eletrica-de-bagauste-13469770.html (accessed on 25 November 2022).
  32. PRé Sustainability B.V. SimaPro|LCA Software for Informed-Change Makers. Available online: https://simapro.com/ (accessed on 9 September 2022).
  33. PRé Sustainability B.V. SimaPro Database Manual—Methods Library; PRé Sustainability B.V.: Amersfoort, The Netherlands, 2020. [Google Scholar]
  34. IEAGHG. Deployment of CCS in the Cement Industry; IEAGHG: Cheltenham, UK, 2013. [Google Scholar]
  35. UN Environment; Scrivener, K.L.; John, V.M.; Gartner, E.M. Eco-efficient cements: Potential economically viable solutions for a low-CO2 cement-based materials industry. Cem. Concr. Res. 2018, 114, 2–26. [Google Scholar] [CrossRef]
  36. Benhelal, E.; Zahedi, G.; Shamsaei, E.; Bahadori, A. Global strategies and potentials to curb CO2 emissions in cement industry. J. Clean. Prod. 2013, 51, 142–161. [Google Scholar] [CrossRef]
  37. Meyer, C. The greening of the concrete industry. Cem. Concr. Compos. 2009, 31, 601–605. [Google Scholar] [CrossRef]
  38. Arens, M.; Worrell, E.; Eichhammer, W.; Hasanbeigi, A.; Zhang, Q. Pathways to a low-carbon iron and steel industry in the medium-term—The case of Germany. J. Clean. Prod. 2017, 163, 84–98. [Google Scholar] [CrossRef]
  39. Monteiro, H.; Alonso, R.; Gonçalves, M.; Iten, M.; Caetano, N.S. Life cycle energy of vehicles on lightweighting and alternative powertrain strategies—A review. Energy Rep. 2022, 8, 241–247. [Google Scholar] [CrossRef]
  40. Gonçalves, M.; Monteiro, H.; Iten, M. Life Cycle Assessment studies on lightweight materials for automotive applications—An overview. Energy Rep. 2022, 8, 338–345. [Google Scholar] [CrossRef]
  41. Teng, J.; Li, L.; Jiang, Y.; Shi, R. A Review of Clean Energy Exploitation for Railway Transportation Systems and Its Enlightenment to China. Sustainability 2022, 14, 10740. [Google Scholar] [CrossRef]
Figure 1. System boundaries for this study and outline of the four analyzed scenarios.
Sustainability 15 11355 g001
Figure 2. LCIA results per pkm for the four studied scenarios.
Sustainability 15 11355 g002
Figure 3. Relative contributions to GWP emissions of infrastructure vs. rolling stock and line operation.
Sustainability 15 11355 g003
Figure 4. Sensitivity analysis results of annual pkm vs. GWP emissions/pkm, for the full electrification scenarios.
Sustainability 15 11355 g004
Table 1. The most relevant published literature of railway LCA studies.
ReferenceRegionRailway TypeSystem BoundariesF.U.Impact Categories/Indicators
ICIOIMIEOLVCVOVMVEOL
Banar and Özdemir [6]TurkeyHSR, CRXXXXXXXX1 pkmADP, AP, EP, GWP, ODP, toxicity category, FAETP
Wang et al. [7]ChinaHSRXXX XXXX1 pkmEnergy consumption, GWP
Pritchard [8]U.K. CRXXX XXX 1 tkm, 1 pkmEnergy consumption, CO2
Tuchschmid et al. [9]Several regionsHSR, CRXXX XXX 1 tkm, 1 pkmCED, CO2, PM10, NMVOC, NOx
Chester [10]U.S.A.HSR, CRXXX XXX 1 vmt, 1 pmtEnergy consumption, GWP, CO, NOx, SO2, PM, VOC
ADEME, RNF, SNCF [11]FranceHSRXXX X Complete lineGWP
Loffredo et al. [12]ItalyHSR, CRX Complete lineCO2
Asplan Viak AS [13]NorwayHSRXXXX Complete lineGWP, AP, ODP, POCP, EP
Grossrieder [14]NorwayHSRXXXXXXXX1 m of line × year, 1 pkm, 1 tkmGWP, ODP, human toxicity, AP, EP, WDP
Sanz et al. [15]SpainHSR, CRXX XXX XComplete lineEnergy consumption, GWP, NO2, PM10, PM2.5, O3, noise, territory occupation, fragmentation
Hill et al. [16]E.U.HSR, CRXXX XX 1 km of line, 1 km × year, impact per passengerGWP, CED
INECO [17]SpainHSRX 1 km of lineGWP
Baron et al. [18]France, Taiwan, ChinaHSRX 1 km of line, 1 pkmCO2
Kortazar et al. [19]SpainHSRXXX XXX Impact per year, 1 pkmCED, GWP, PM10, NMVOC, NOx
Landgraf and Horvath [20]AustriaCRXXXX 1 km of line × yearGWP
Celauro et al. [21]ItalyHSR, CRXXXX 1 km of cut section; 1 km of embankment sectionGWP, NOx, PM10, AP, CO, Hg, Pb, EP, POCP, ADPE, ADPF, WS, ODP
Jones et al. [22]PortugalHSRXXXXXXXX1 km of line, 1 pkmGWP, AP, PM10
IC = infrastructure construction; IO = infrastructure operation; IM = infrastructure maintenance; IEOL = infrastructure end-of-life; VC = vehicle construction; VO = vehicle operation; VM = vehicle maintenance; VEOL = vehicle end-of-life; HSR = high-speed rail; CR = conventional rail; pkm = passenger-kilometer; tkm = train-kilometer; vmt = vehicle miles traveled; pmt = passenger miles traveled; ADP = abiotic depletion potential; AP = acidification potential; EP = eutrophication potential; GWP = global warming potential; ODP = ozone depletion potential; FAETP = freshwater aquatic ecotoxicity potential; PM = particulate matter; NMVOC = non-methane volatile organic compounds; VOC = volatile organic compounds; WDP = water deprivation potential; CED = cumulative energy demand; ADPE = abiotic depletion potential of elements; ADPF = abiotic depletion potential of fossil resources; WS = water scarcity.
Table 2. Data used for annual pkm calculation of the Douro railway line.
Train Servicepkm/tkm Ratio (Source: AMT [30])pkm (Estimated)
Urban + suburban (electric)143129,115,931
Regional (diesel)5243,947,627
Long distance (diesel)1997,654,539
Table 3. LCI of the Douro line, according to the categorization of Tuchschmid et al. [9].
ProcessEntry (Unit)Inventory Quantity
Current Scenario/Full Electrification Scenarios
Lifetime (Years)
Infrastructure construction and maintenanceEarthworks, single track, new line (km)125.4100
Earthworks, double track, new line (km)37.7100
Viaduct, single track (km)1.38100
Small concrete bridge, single track (km)0.23100
Small concrete bridge, double track (km)0.03100
Iron bridge, single track (km)1.62100
Open pit tunnel, single track (km)0.11100
Mining tunnel, single track (km)7.13100
Concrete sleepers and ballast, single track (km)93.735
Concrete sleepers and ballast, double track (km)37.735
Wood sleepers and ballast, single track (km)31.730
Rail type S54, single track (km)125.430
Rail type S54, double track (km)37.730
Catenary wiring, single track (km)13.9/(125.4)10
Catenary wiring, double track (km)37.710
Mast and overhead wiring, concrete, single track (km)13.9/(125.4)60
Mast and overhead wiring, concrete, double track (km)37.760
Overhead wiring for tunnels, single track (km)1.09/(7.24)10
Signals, double track (km)37.730
Cables for telecommunications, double track (km)37.730
Cable drains, double track (km)37.730
Junction for local trains (no. of units)1100
Stop for local trains (no. of units)39100
Transformer substation, building (no. of units)1/(2)60
Transformer substation, electrical installations (no. of units)1/(2)60
Rolling stock and railway operationUME3400 trains (no. of units)7/(17)50
AD592 trains (no. of units)10/(0)50
Electricity (high voltage) for train and infrastructure operation (kWh/year)12,091,123/(23,923,548)-
Diesel for train operation (liters/year)2,700,000/(0)-
Note: The inventory quantities for the full electrification scenarios (in parentheses) are identical for the scenario with the current mix, the 2030 mix, and the 2050 mix. When no value in parentheses is provided, the full electrification scenarios have the same inventory quantity for that input as the baseline scenario.
Table 4. Impact indicators used for the LCA study.
Impact IndicatorsUnitImpact MethodDescription
Impact categoriesGWPkg CO2-eqReCiPe 2016 v1.1 Midpoint (H) [33]Emissions of greenhouse gases into the air
CEDMJCED v1.11 [33]Direct and indirect energy used throughout all considered lifecycle stages of the product/service
Elementary flowsPM10kgSelected LCI results, additional v1.04 [33]Emissions to air of inhalable particles <10 μm and >2.5 μm
SO2kgSelected LCI results v1.05 [33]Emissions to air of sulfur dioxide; related impact categories: terrestrial acidification (Recipe 2016 Midpoint)
NOXkgSelected LCI results v1.05Emissions to air of nitrogen oxide; related impact categories: photochemical ozone formation—terrestrial ecosystems and human health (Recipe 2016 Midpoint)
NMVOCkgSelected LCI results v1.05Emissions to air of volatile organic compounds (except methane); related impact categories: photochemical ozone formation—terrestrial ecosystems and human health (Recipe 2016 Midpoint)
Disclaimer/Publisher’s Note: The statements, opinions and data contained in all publications are solely those of the individual author(s) and contributor(s) and not of MDPI and/or the editor(s). MDPI and/or the editor(s) disclaim responsibility for any injury to people or property resulting from any ideas, methods, instructions or products referred to in the content.

