
Enhancing Multifunctionality in Agricultural Landscapes with Native Woody Vegetation

Abstract
:1. Introduction
1.1. Literature Review
1.1.1. Livestock Foraging
1.1.2. Shade and Shelter
1.1.3. Native Bush Birds
1.1.4. Landscape Ecology
2. Methods
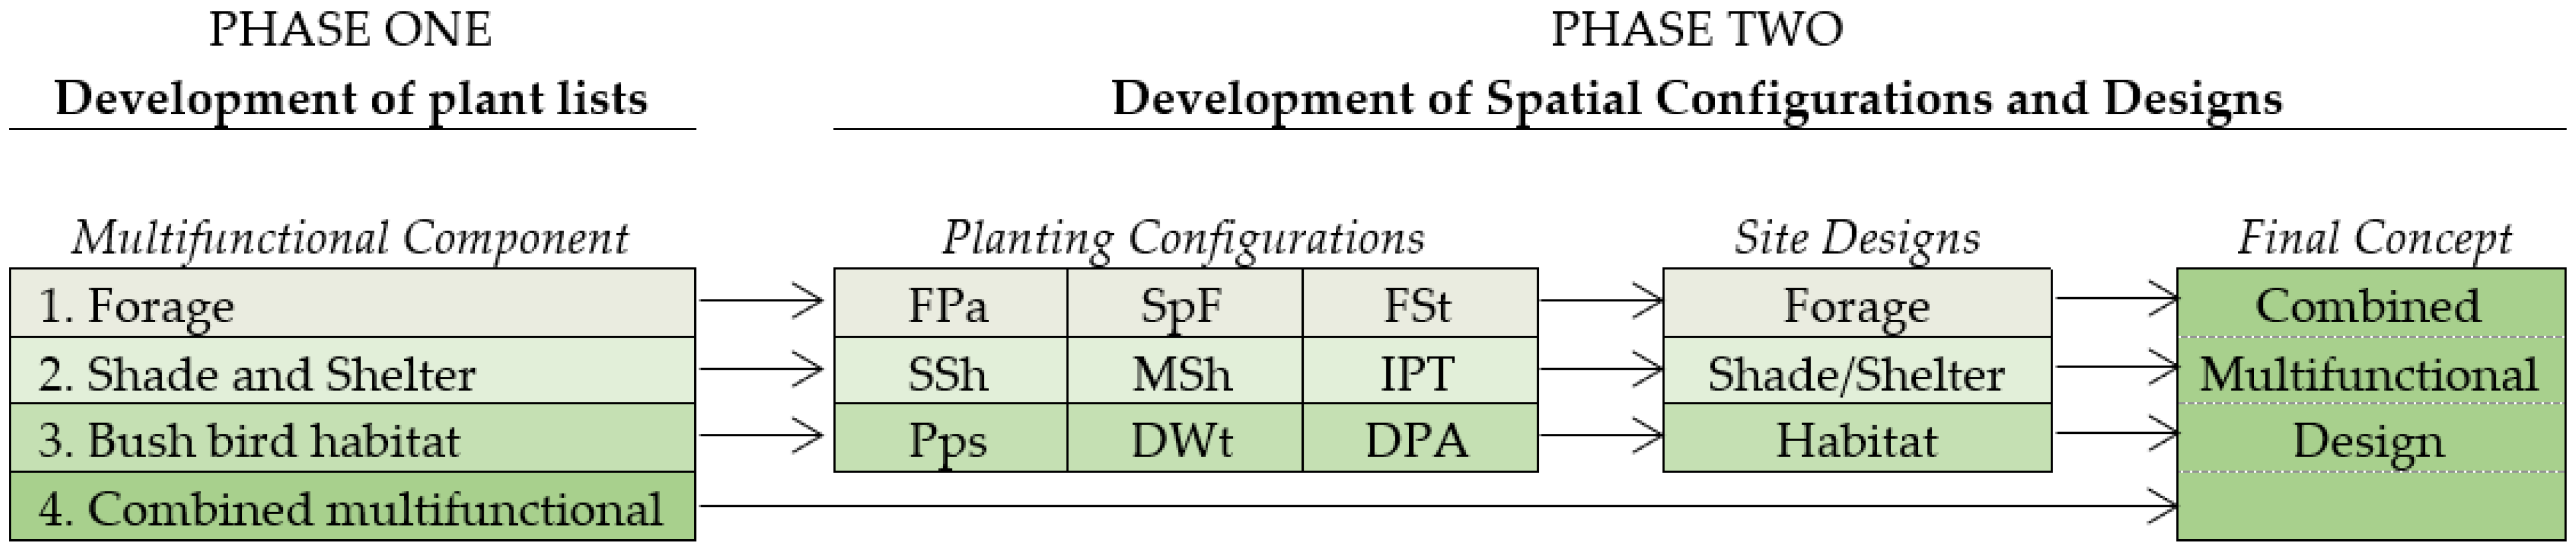
2.1. Overview
2.2. Methodology: Phase One
Developing the Plant Lists
- Forage characteristics: palatability, tolerance to defoliation, and growth rates.
- Shade and shelter characteristics: shade provision, plant height, canopy size, and shelter provision.
- Native bush bird habitat characteristics: availability of food sources and quality of nesting sites.
- A combined multifunctional list with scores from lists 1–3 and scores for environmental tolerances of frost, drought, wind, sun/shade preferences, soil preferences of drainage, depth, moisture, and type, and conservation threat status [67].
2.3. Methodology: Phase Two
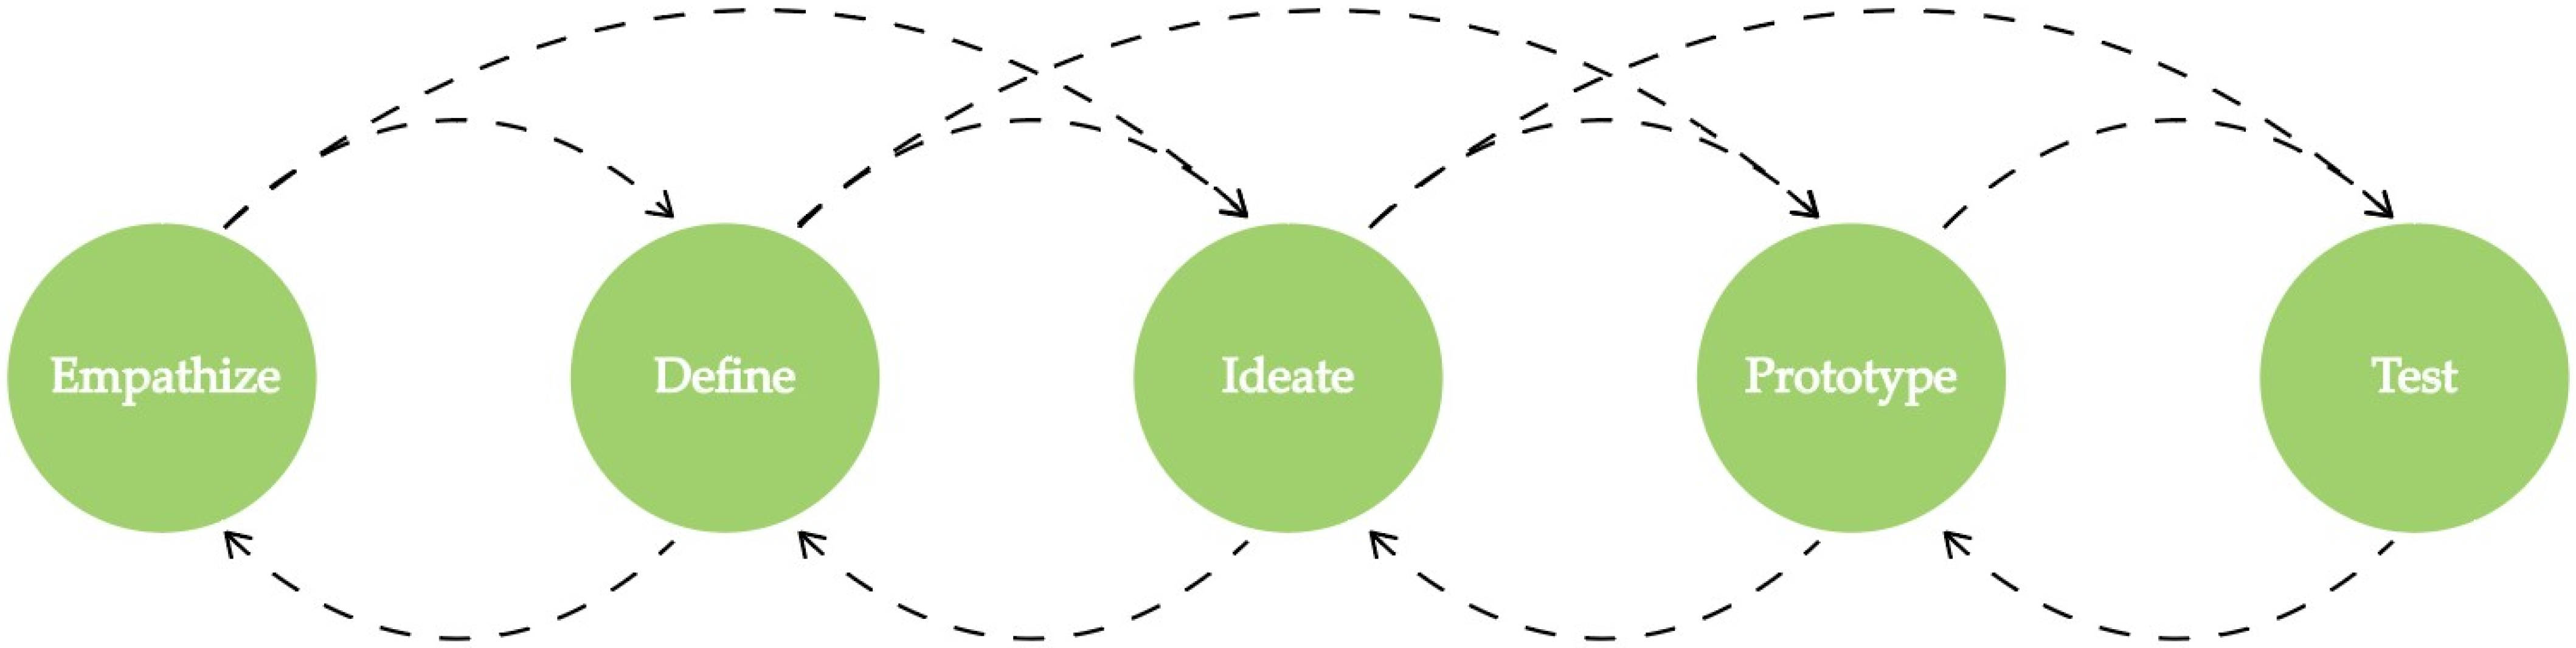
Design Thinking Methodology
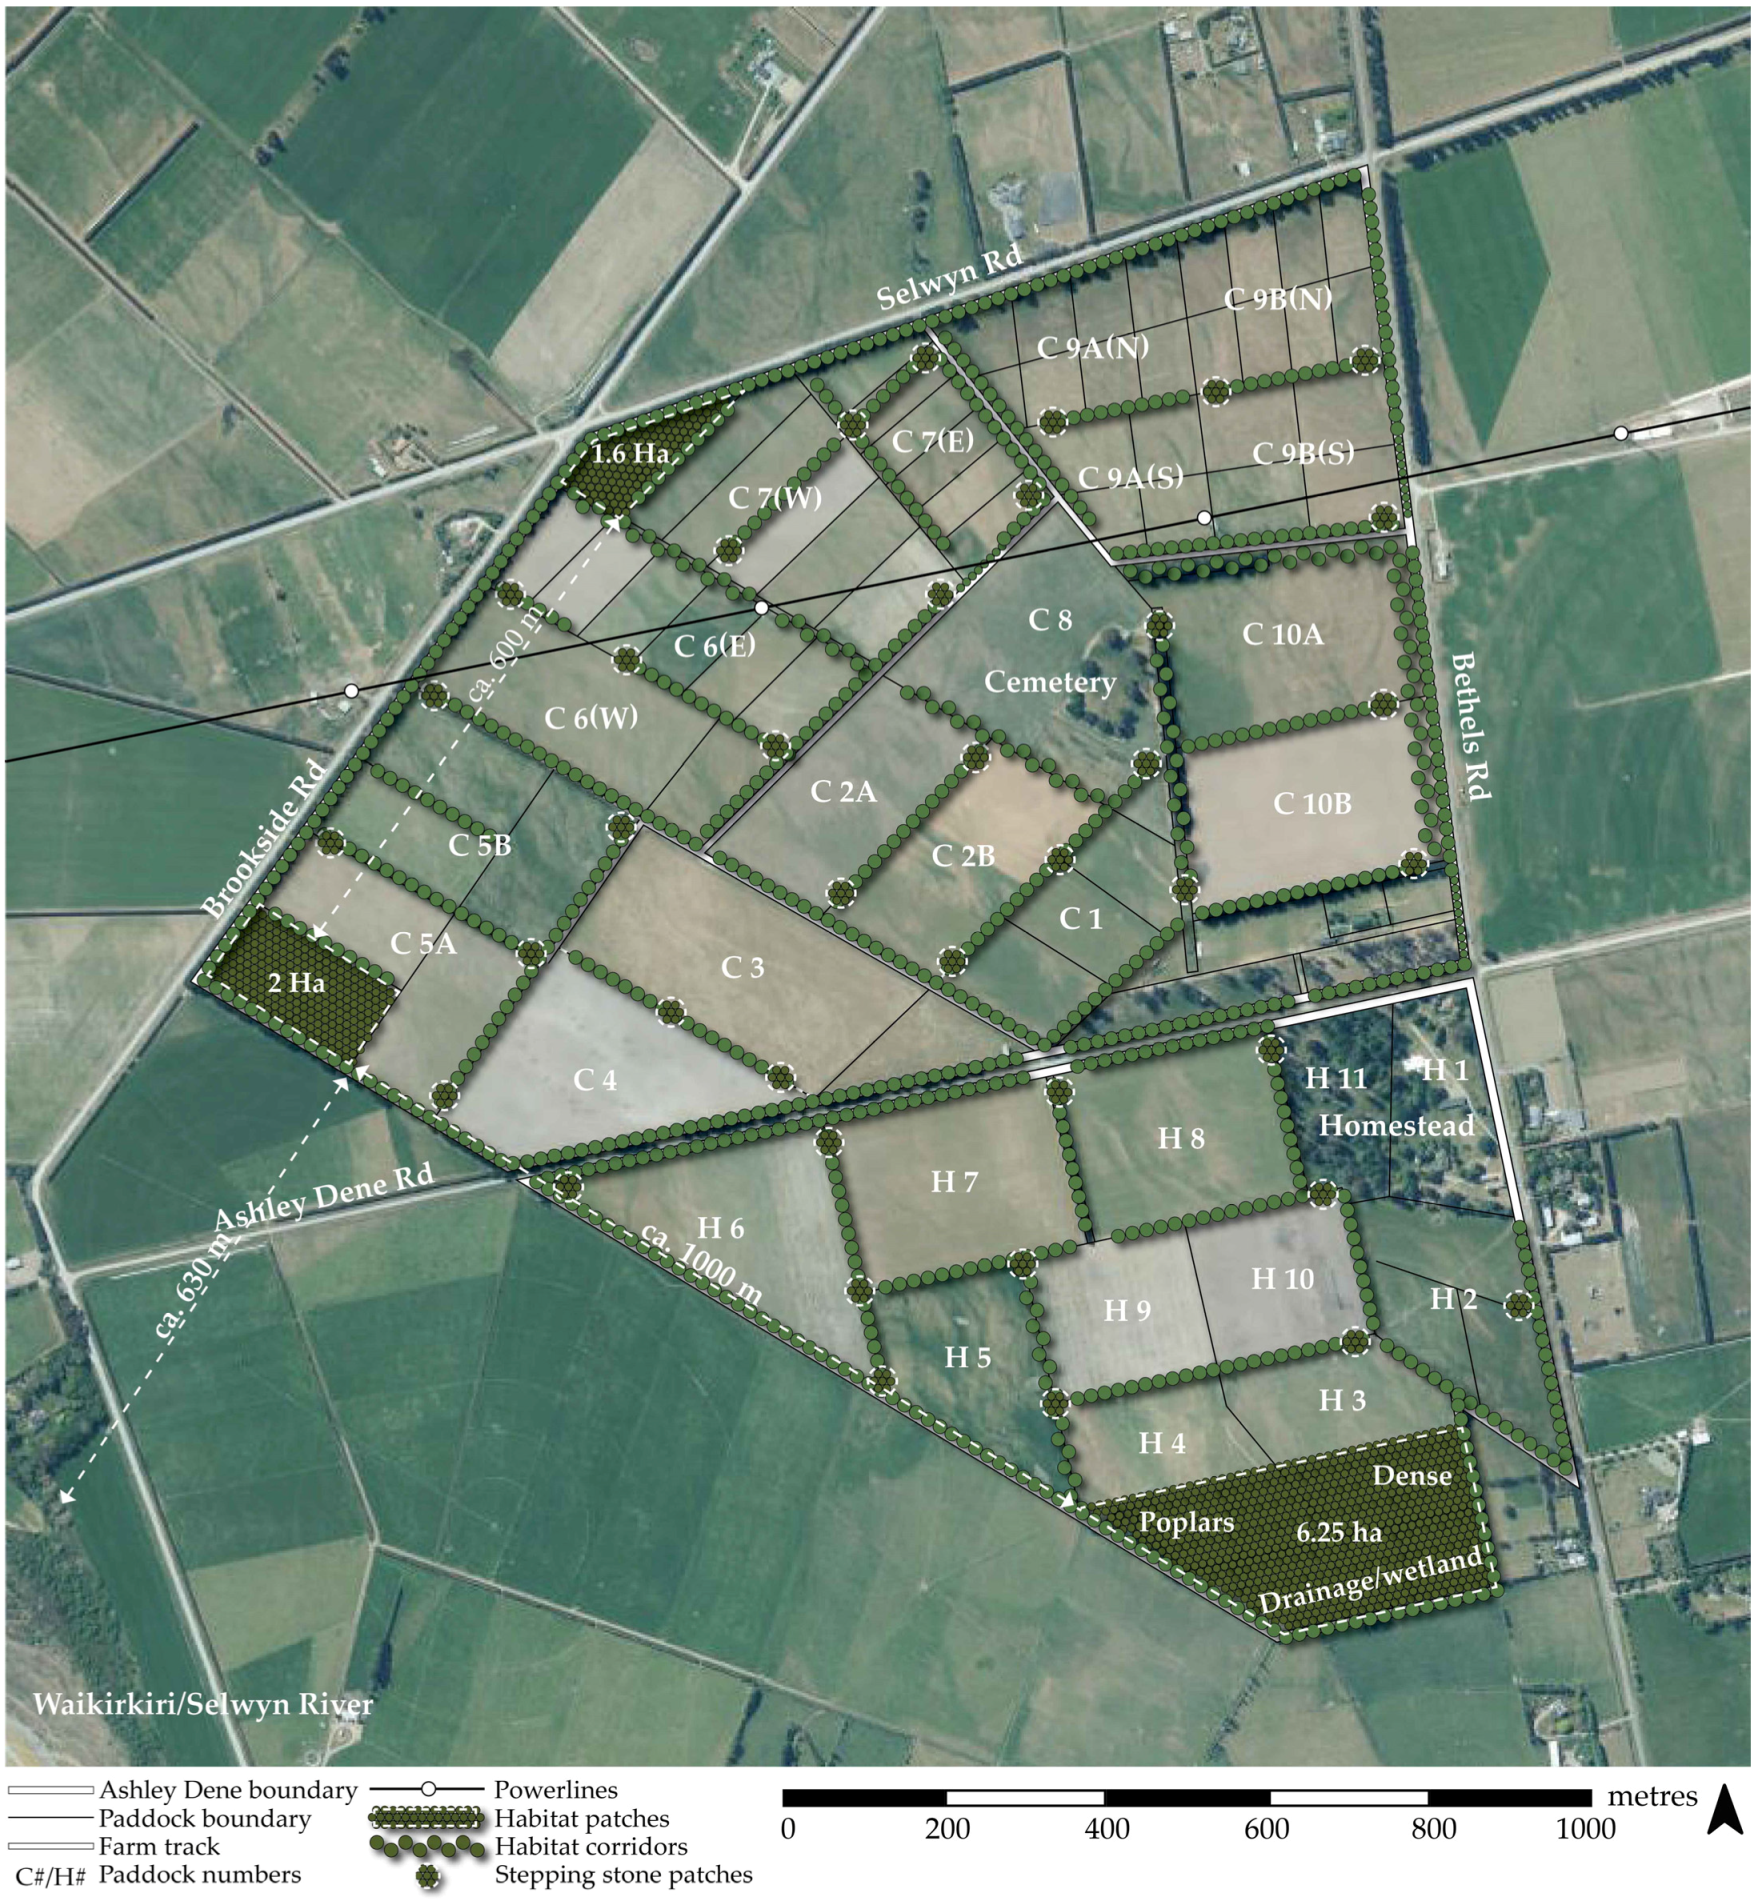
2.4. The Case Study Site: Ashley Dene Farm
2.5. Phase Two: Planting Configurations
2.6. Phase Two: Site Designs
2.7. Phase Two: Combined Multifunctional Design
3. Results
3.1. Phase One: Plant Lists
3.1.1. Enhancing Foraging Opportunities in Dryland Agricultural Landscapes
3.1.2. Increasing Shade and Shelter in Dryland Agricultural Landscapes
3.1.3. Restoring Native Bush Bird Habitat in Dryland Agricultural Landscapes
3.1.4. Enhancing Multifunctionality in Dryland Agricultural Landscapes
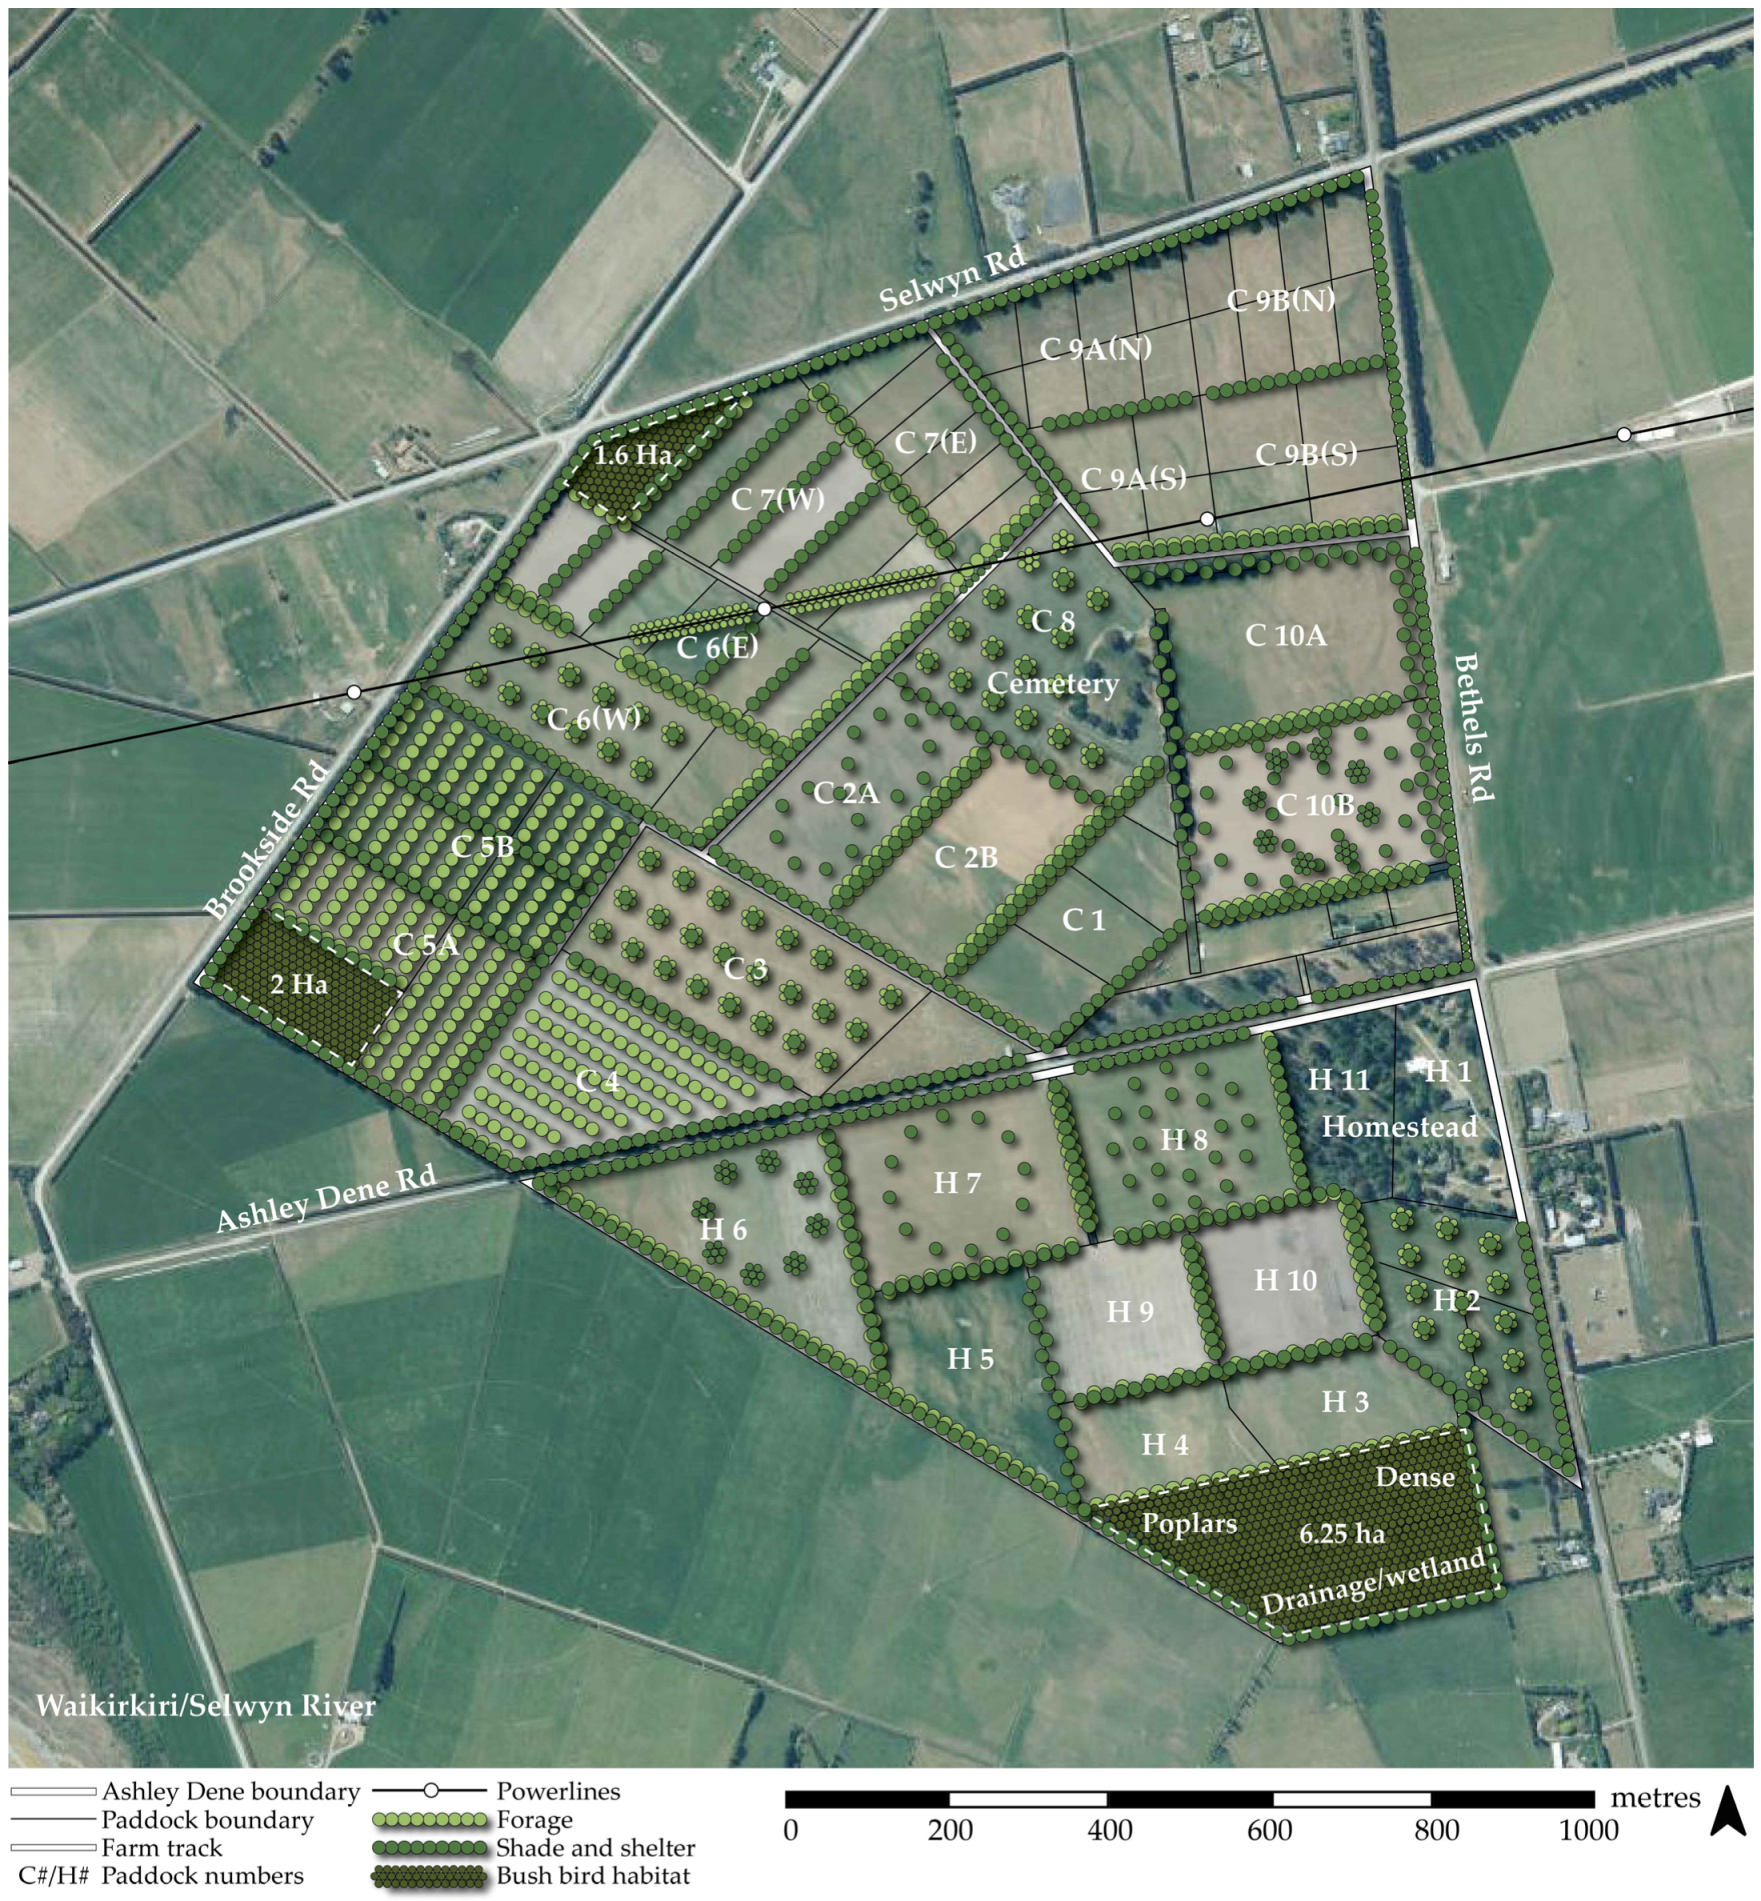
3.2. Phase Two: Planting Configurations and Site Designs
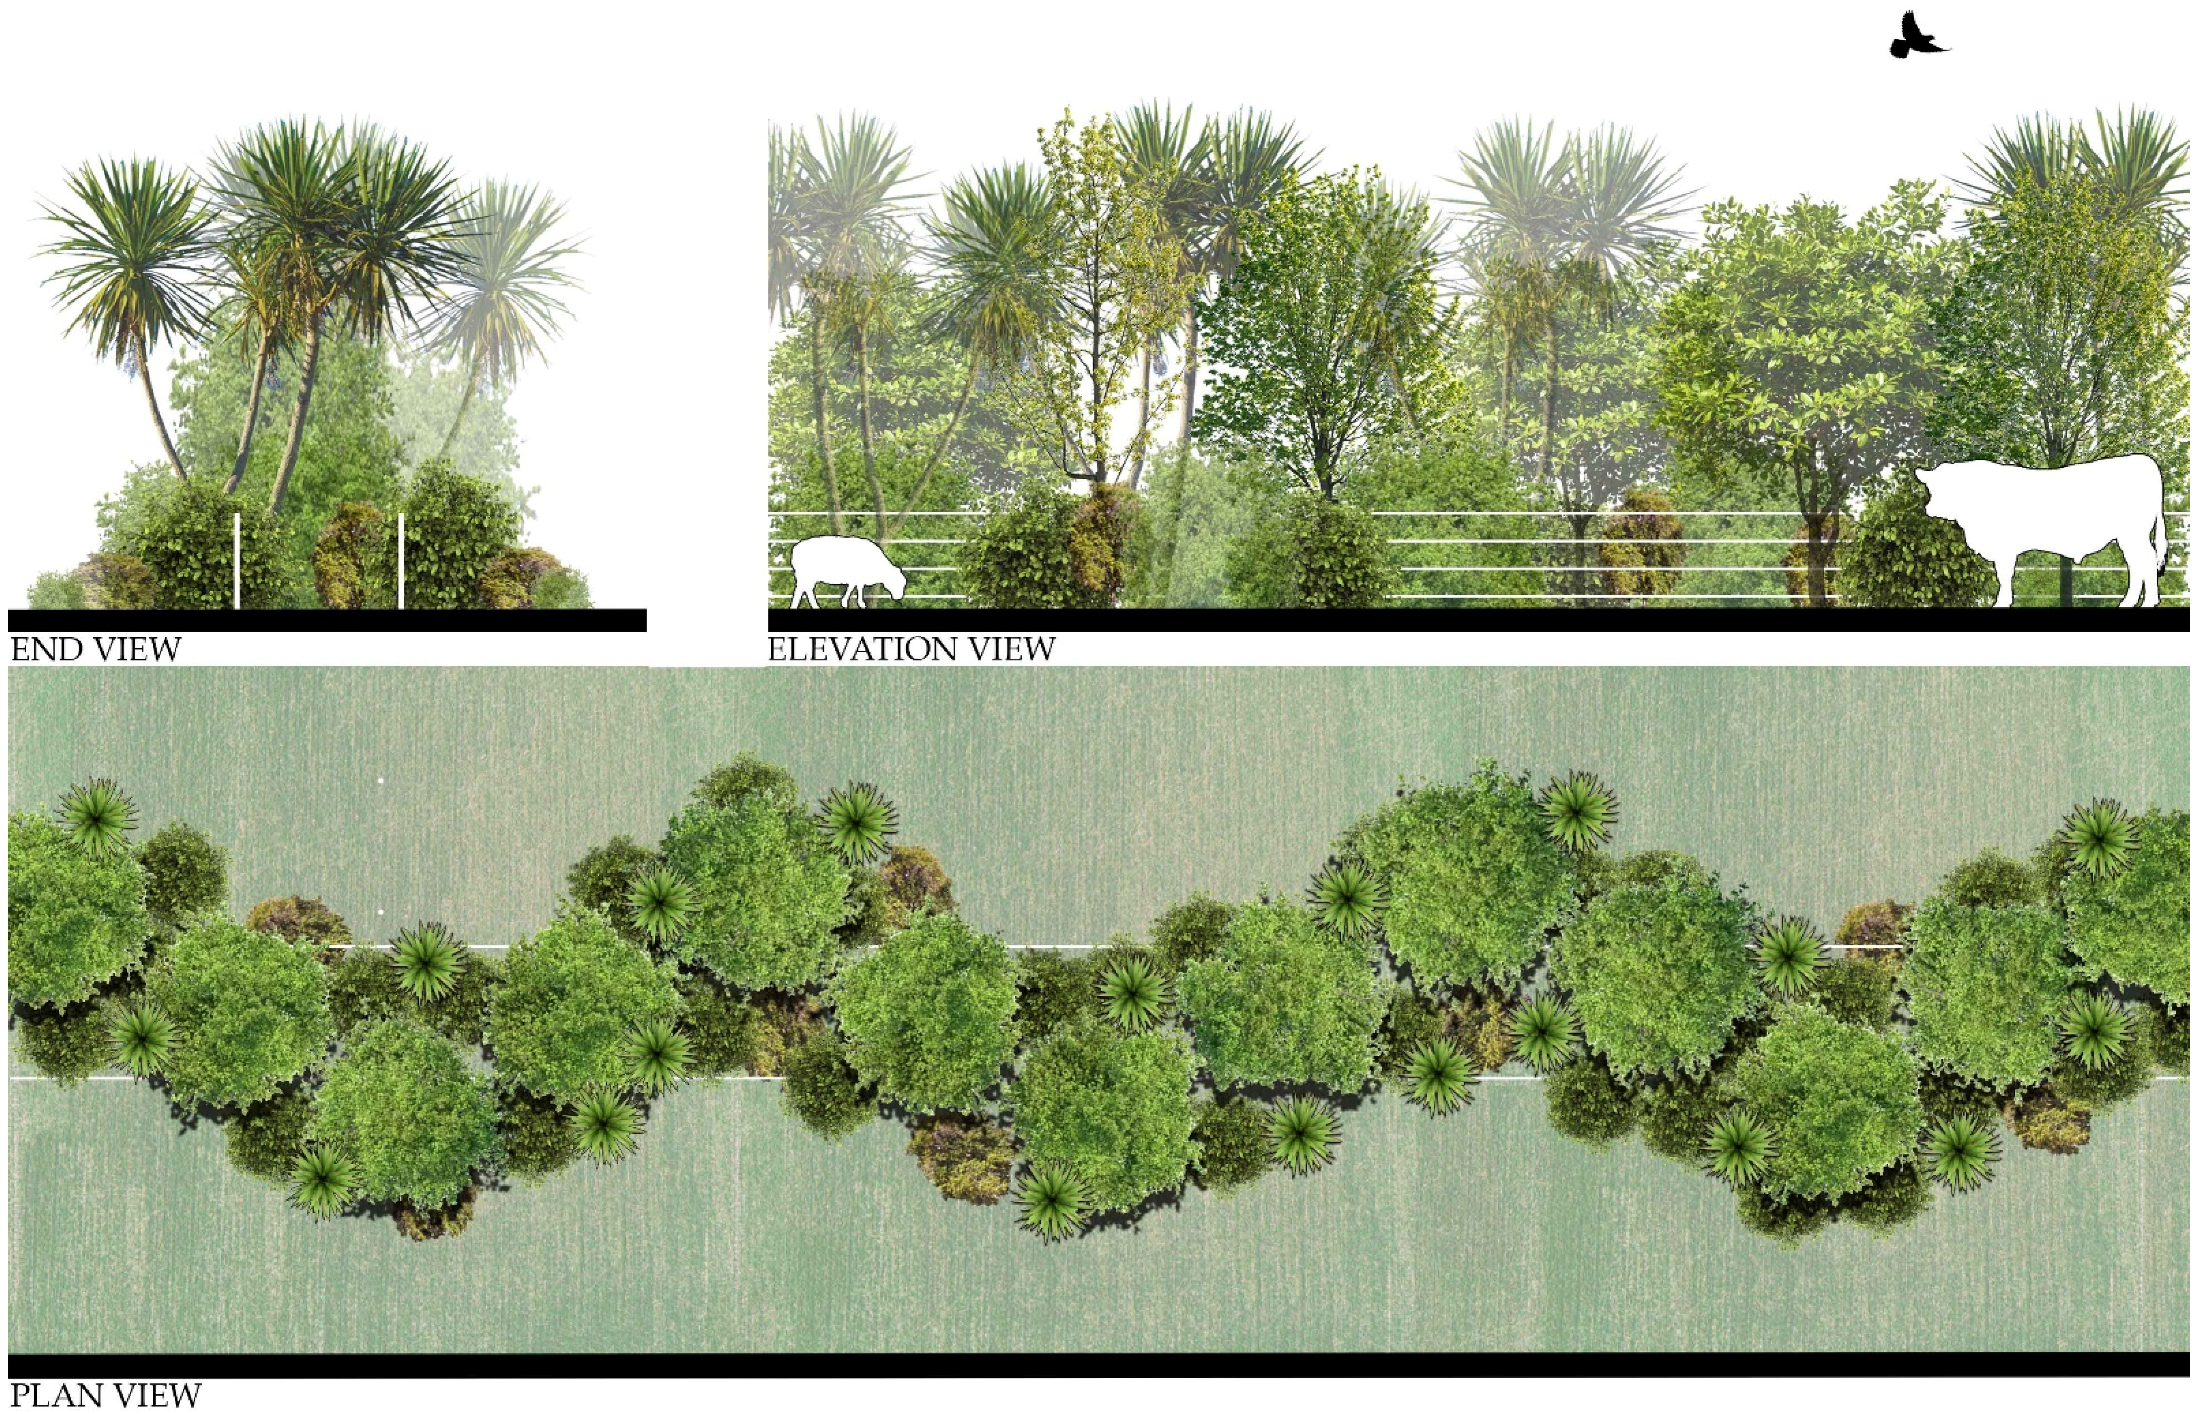
3.2.1. Designing to Enhance Foraging Opportunity
Forage Patches
Spreading Forage
Forage Strips
3.2.2. Livestock Forage Site Design
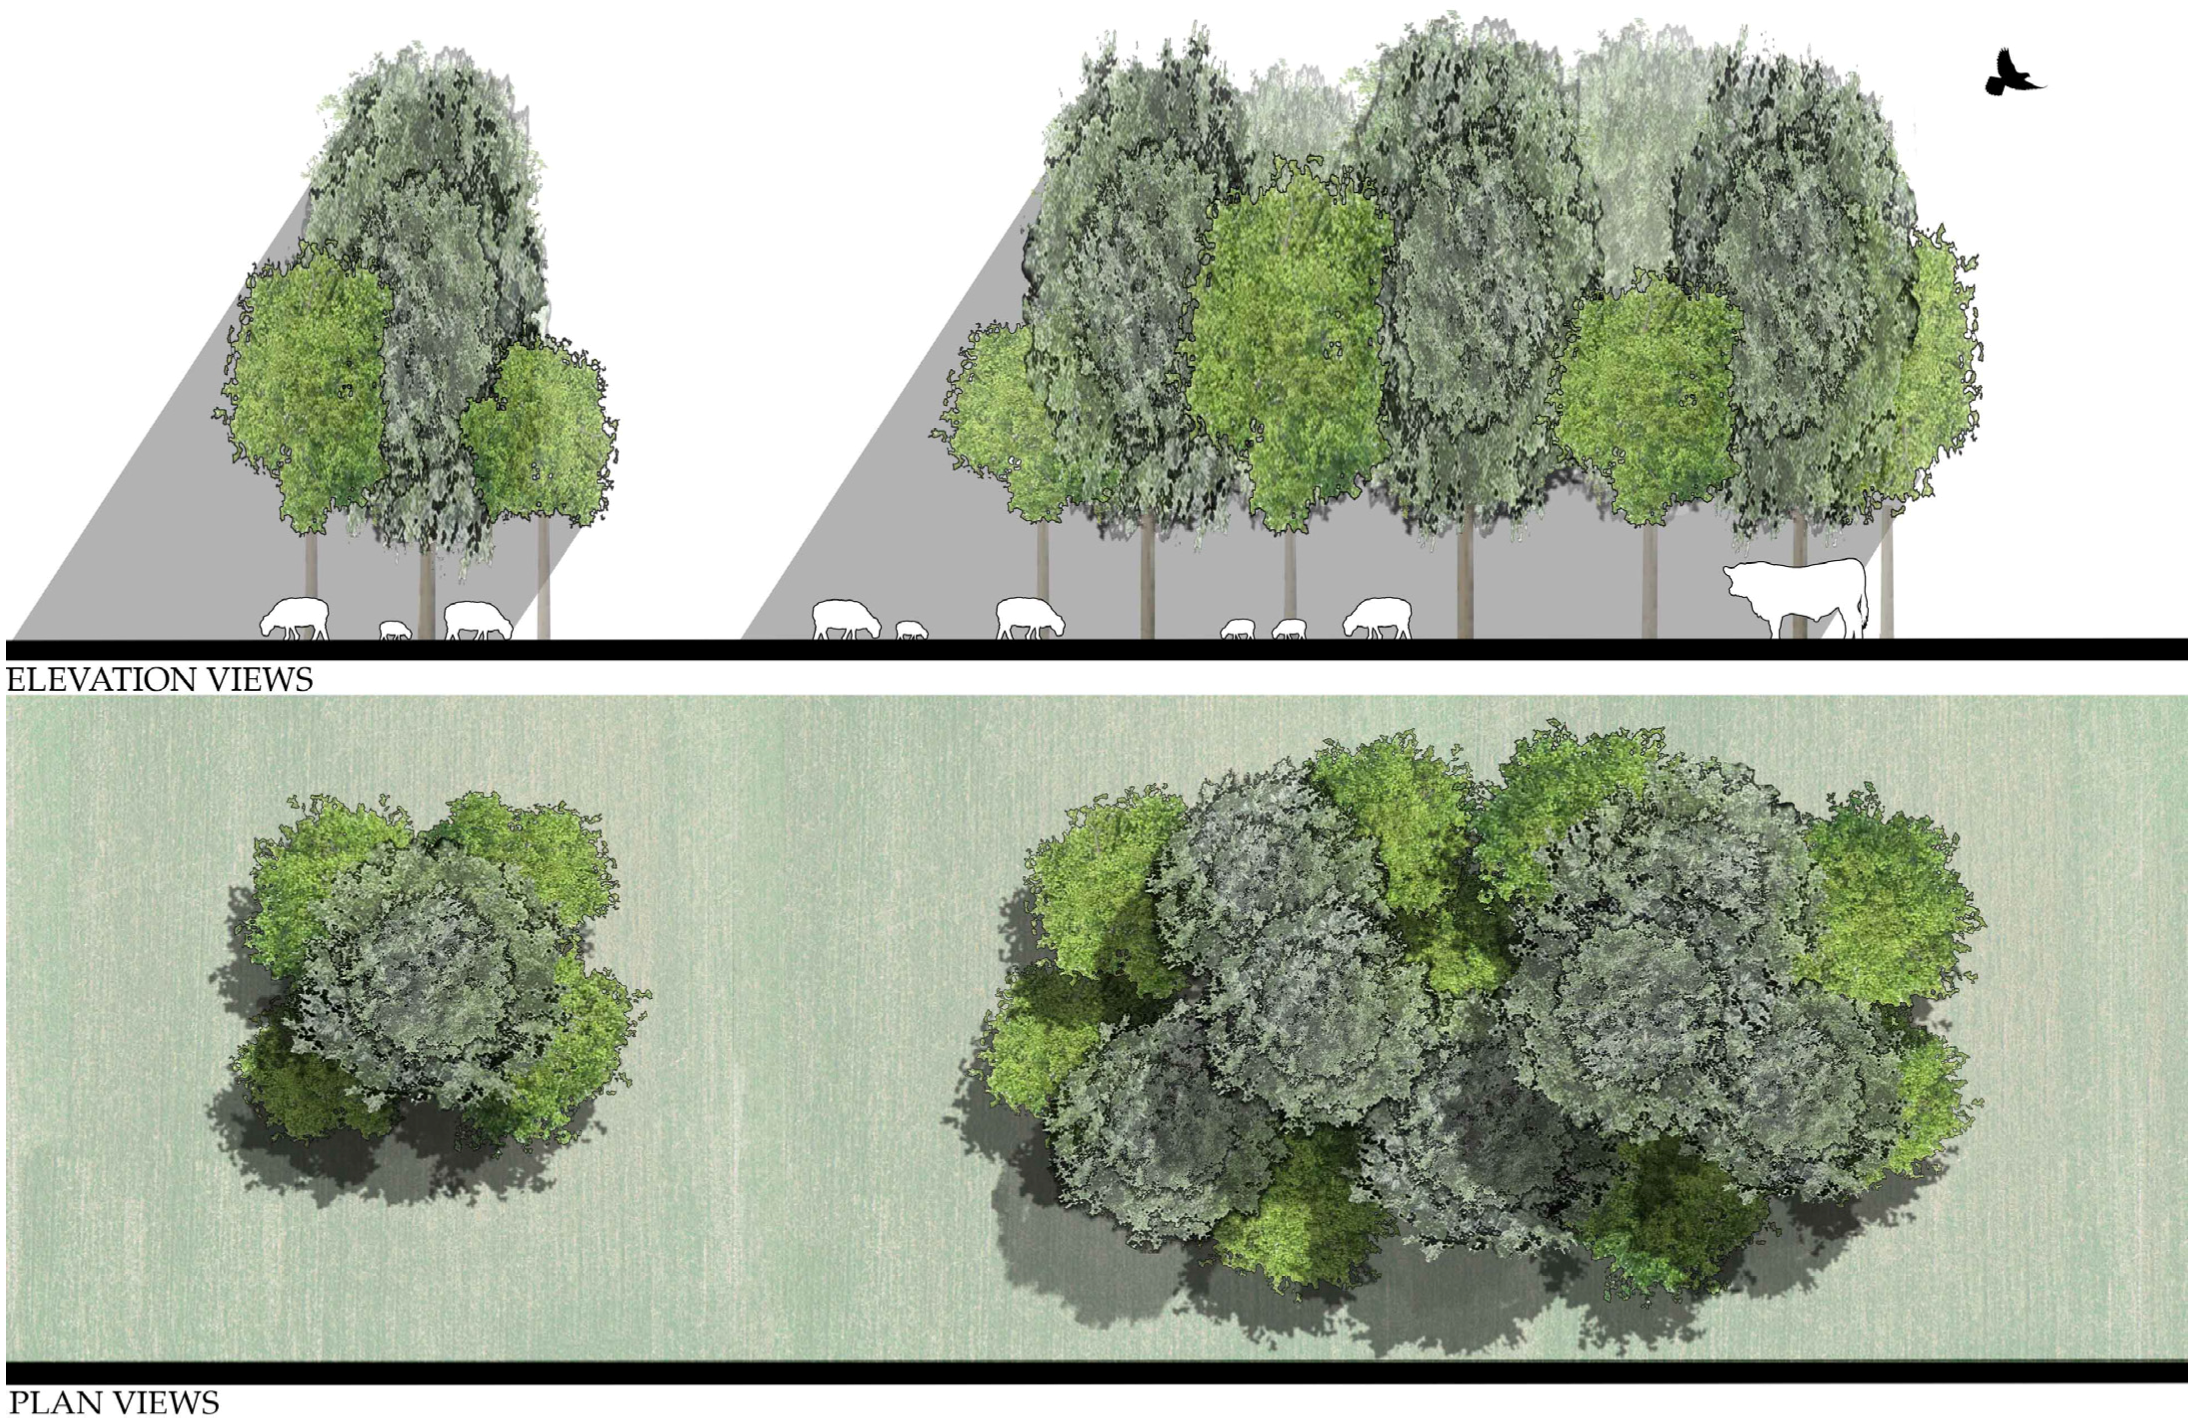
3.2.3. Designing for Increased Shade and Shelter
Straight Shelter
Meandering Shelter
In-Paddock Shade Trees
3.2.4. Shade and Shelter Site Design
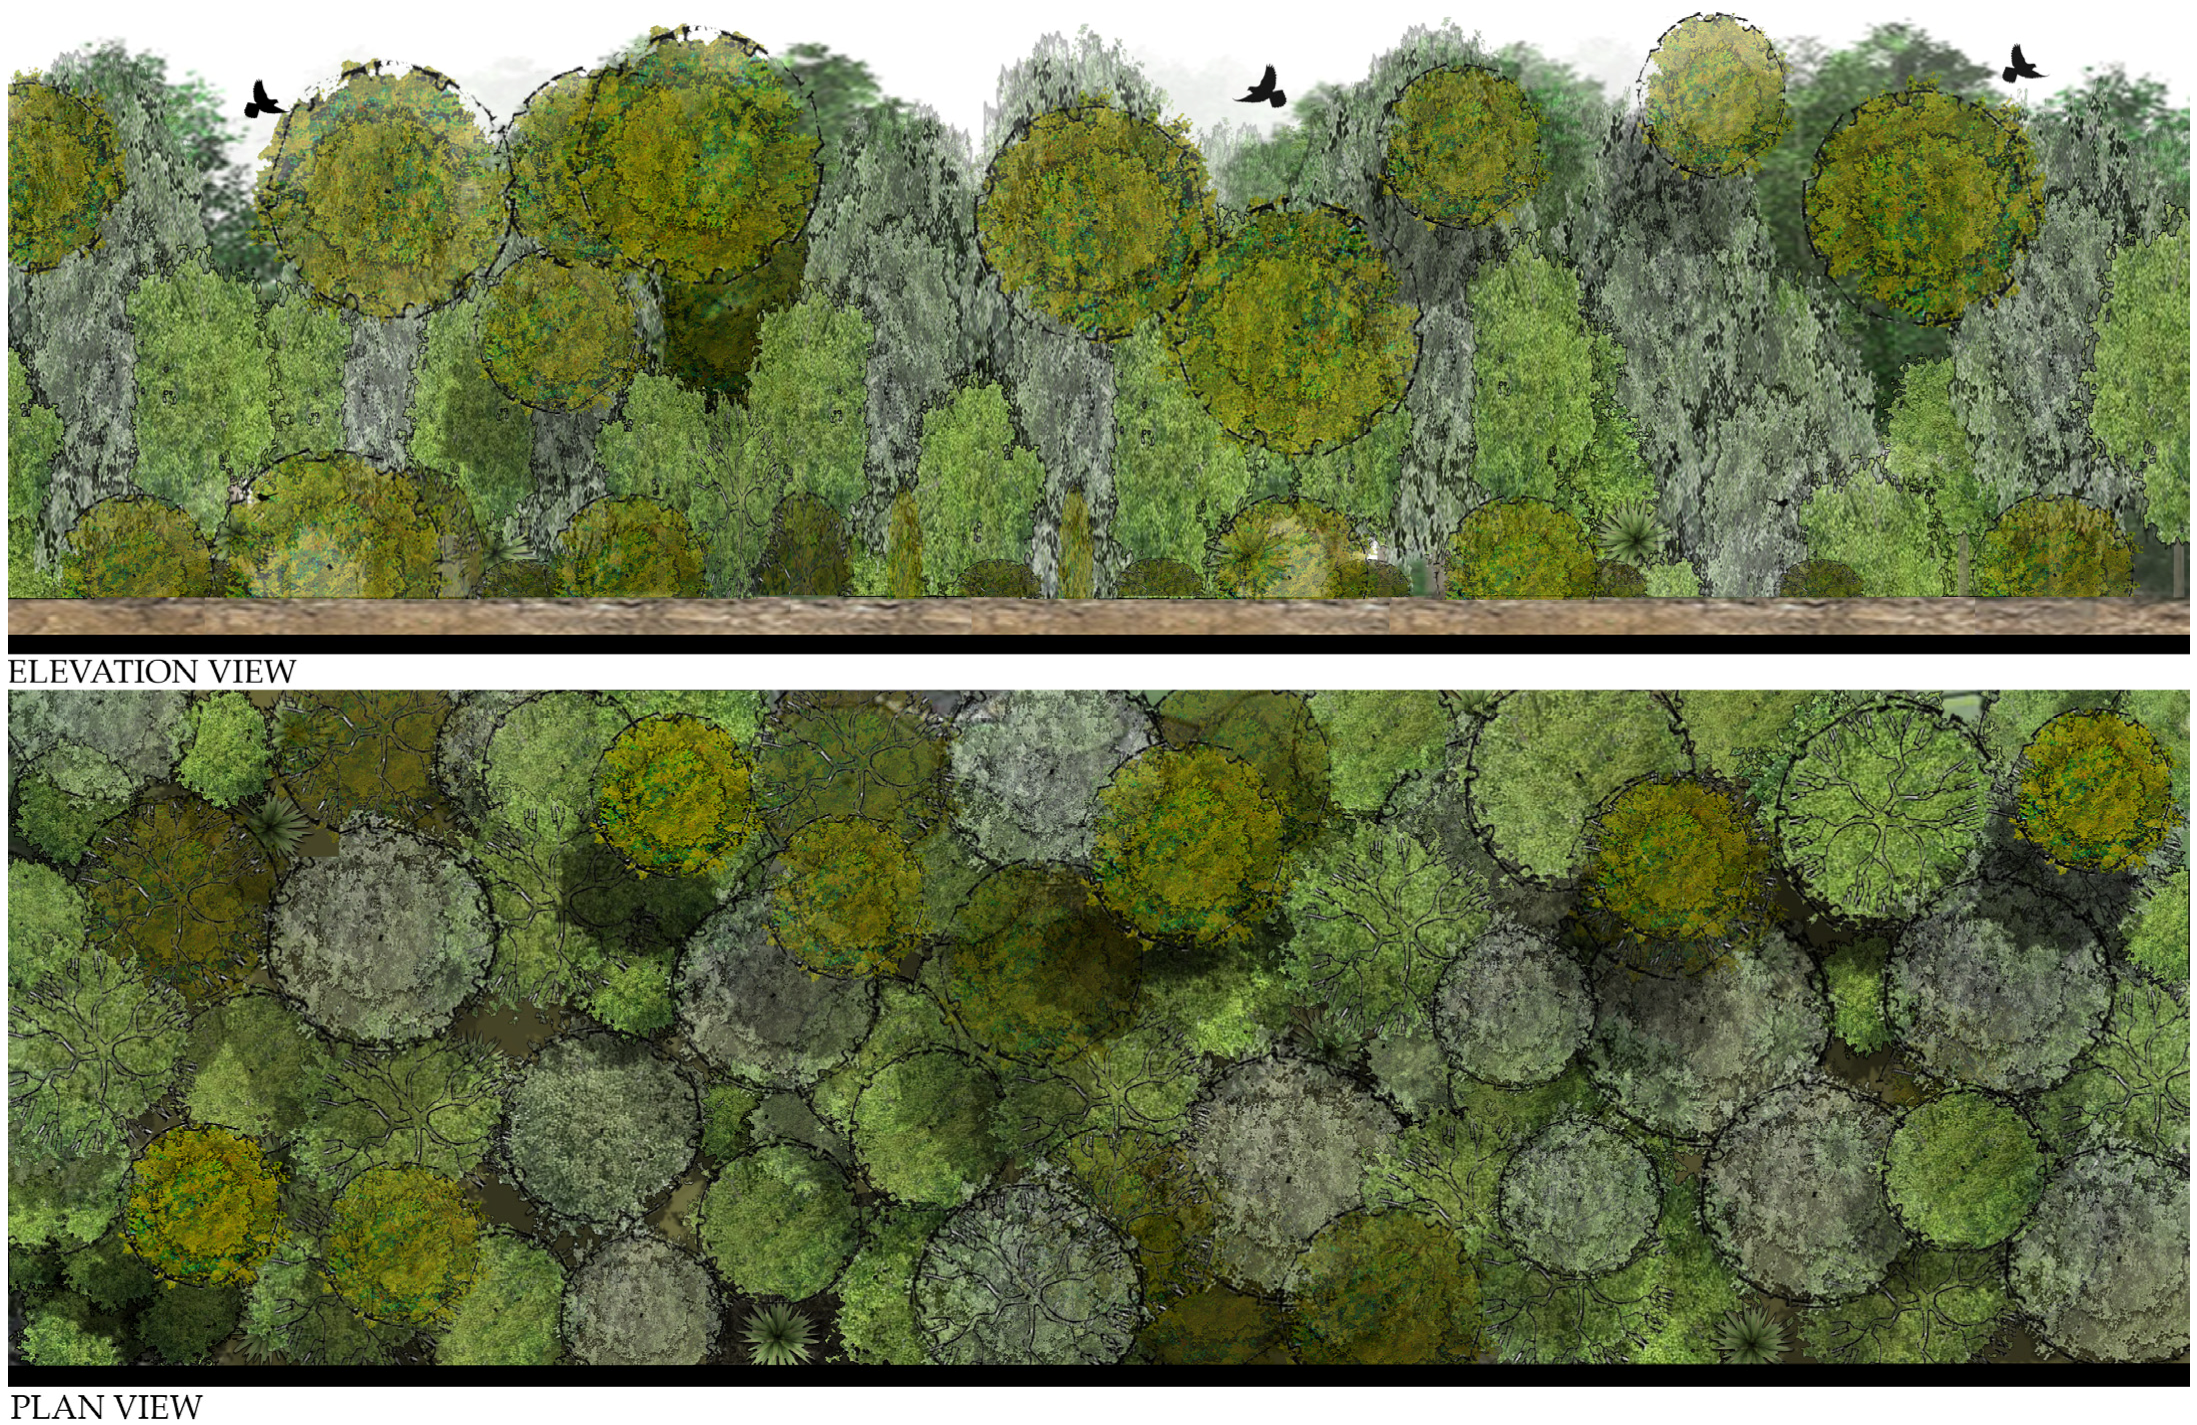
3.2.5. Designing for Native Bush Bird Habitat
Habitat Planting Configuration Focused on Poplar Trees
Habitat Planting Configuration Focused on Wetland/Drainage Corridor
Habitat Planting Configuration Focused on Densely Planted Area
3.2.6. Bush Bird Habitat Site Design
3.3. Combined Multifunctional Site Design
4. Discussion
4.1. Native Woody Vegetation and Spatial Layouts for Enhanced Foraging Opportunities
4.2. Native Woody Vegetation and Spatial Layouts for Optimal Shade and Shelter On-Farm
4.3. Native Woody Vegetation and Spatial Layouts for Optimal Bush Bird Habitat
4.4. Native Woody Vegetation and Spatial Layouts for Optimal Functions When Considering the Three Components of a Multifunctional Dryland Agricultural Landscape
5. Conclusions
Author Contributions
Funding
Institutional Review Board Statement
Informed Consent Statement
Data Availability Statement
Acknowledgments
Conflicts of Interest
Appendix A

| Botanical Name | Common Name | Fo | SS | HT | ET | So | Total |
|---|---|---|---|---|---|---|---|
| Podocarpus totara | tōtara | 5.00 | 25.00 | 6.00 | 22.50 | 20.75 | 79.25 |
| Hoheria angustifolia | narrow-leaved houhere | 10.00 | 20.50 | 6.50 | 21.00 | 20.75 | 78.75 |
| Elaeocarpus hookerianus | pōkākā | 8.00 | 22.50 | 6.50 | 17.50 | 21.75 | 76.25 |
| Plagianthus regius | lowland ribbonwood, mānatu | 8.00 | 20.50 | 6.00 | 19.50 | 20.75 | 74.75 |
| Prumnopitys taxifolia | mataī, black pine | 5.00 | 25.00 | 6.50 | 15.50 | 20.75 | 72.75 |
| Cordyline australis | cabbage tree, ti kōuka | 11.00 | 15.00 | 7.00 | 21.50 | 17.75 | 72.25 |
| Pittosporum tenuifolium | black matipo, kōhūhū | 11.00 | 18.00 | 5.00 | 19.00 | 18.50 | 71.50 |
| Griselinia littoralis | broadleaf, kāpuka | 11.00 | 17.50 | 5.50 | 20.50 | 17.00 | 71.50 |
| Kunzea ericoides | kānuka | 7.00 | 13.50 | 7.00 | 24.00 | 20.00 | 71.50 |
| Dodonaea viscosa | akeake | 9.00 | 18.00 | 4.50 | 19.50 | 18.75 | 69.75 |
| Pittosporum eugenioides | lemonwood, tarata | 11.00 | 21.50 | 5.00 | 14.50 | 15.50 | 67.50 |
| Dacrycarpus dacrydioides | kahikatea | 5.00 | 24.00 | 6.50 | 14.50 | 17.25 | 67.25 |
| Olearia fragrantissima | fragrant tree daisy | 9.00 | 14.00 | 4.50 | 18.00 | 20.75 | 66.25 |
| Corynocarpus laevigatus | karaka | 8.00 | 17.50 | 5.00 | 15.50 | 19.25 | 65.25 |
| Olearia avicenniifolia | mountain akeake | 9.00 | 10.00 | 4.50 | 22.50 | 18.50 | 64.50 |
| Pseudopanax arboreus | five-finger, whauwhaupaku | 11.00 | 15.00 | 7.50 | 14.50 | 16.25 | 64.25 |
| Olearia paniculata | akiraho, golden akeake | 9.00 | 12.50 | 4.50 | 19.00 | 19.25 | 64.25 |
| Sophora microphylla | kōwhai, small-leaved kōwhai | 6.00 | 11.00 | 6.50 | 21.50 | 18.50 | 63.50 |
| Discaria toumatou | matagouri, tūmatakuru | 9.00 | 10.00 | 2.00 | 23.50 | 19.00 | 63.50 |
| Leptospermum scoparium | mānuka | 7.00 | 12.50 | 4.00 | 23.50 | 16.25 | 63.25 |
| Pseudopanax crassifolius | lancewood, horoeka | 9.00 | 13.00 | 3.50 | 16.50 | 20.75 | 62.75 |
| Coprosma propinqua | mikimiki | 10.00 | 10.00 | 2.00 | 22.50 | 17.75 | 62.25 |
| Muehlenbeckia astonii | shrubby tororaro | 8.00 | 10.00 | 2.50 | 24.00 | 17.75 | 62.25 |
| Corokia cotoneaster | korokio, wire-netting bush | 10.00 | 9.00 | 2.50 | 22.50 | 17.75 | 61.75 |
| Teucridium parvifolium | teucridium | 12.00 | 6.00 | 2.00 | 22.50 | 19.00 | 61.50 |
| Pseudopanax ferox | fierce lancewood | 6.00 | 11.00 | 3.50 | 21.75 | 19.25 | 61.50 |
| Coprosma virescens | mikimiki | 11.00 | 7.50 | 2.00 | 22.50 | 18.50 | 61.50 |
| Olearia adenocarpa | Canterbury shrub daisy | 7.00 | 7.50 | 2.50 | 24.50 | 20.00 | 61.50 |
| Helichrysum lanceolatum | niniao | 9.00 | 7.50 | 2.50 | 22.50 | 18.50 | 60.00 |
| Carpodetus serratus | marbleleaf, putaputāwētā | 10.00 | 13.00 | 7.00 | 19.00 | 11.00 | 60.00 |
| Carmichaelia australis | common broom | 9.00 | 6.00 | 2.50 | 23.50 | 18.75 | 59.75 |
| Muehlenbeckia complexa | small-leaved pōhuehue | 8.00 | 10.00 | 2.00 | 21.50 | 17.75 | 59.25 |
| Coprosma intertexta | mikimiki | 10.00 | 7.50 | 2.00 | 21.00 | 18.75 | 59.25 |
| Olearia lineata | shrub daisy | 9.00 | 10.00 | 2.50 | 20.00 | 17.00 | 58.50 |
| Ozothamnus leptophyllus | tauhinu | 8.00 | 7.50 | 1.50 | 22.50 | 18.75 | 58.25 |
| Veronica strictissima | Banks Peninsula hebe | 11.00 | 8.50 | 2.00 | 18.75 | 17.75 | 58.00 |
| Veronica salicifolia | koromiko | 11.00 | 11.50 | 2.00 | 15.50 | 17.75 | 57.75 |
| Carmichaelia torulosa | Canterbury broom | 10.00 | 5.50 | 2.50 | 21.00 | 18.75 | 57.75 |
| Coprosma lucida | karangu, shining karamū | 11.00 | 11.00 | 2.00 | 15.50 | 17.75 | 57.25 |
| Coprosma linariifolia | yellow wood | 10.00 | 11.50 | 2.00 | 16.00 | 17.25 | 56.75 |
| Coprosma robusta | karamū | 12.00 | 11.00 | 2.00 | 14.50 | 17.00 | 56.50 |
| Aristotelia fruticosa | mountain wineberry | 11.00 | 4.50 | 2.50 | 20.50 | 17.75 | 56.25 |
| Sophora prostrata | prostrate kōwhai | 7.00 | 4.50 | 2.50 | 22.50 | 19.00 | 55.50 |
| Coprosma acerosa | sand coprosma | 8.00 | 6.00 | 2.00 | 21.00 | 18.50 | 55.50 |
| Pennantia corymbosa | kaikōmako | 10.00 | 14.50 | 2.00 | 17.50 | 11.25 | 55.25 |
| Phormium tenax | flax, harakeke | 9.00 | 7.50 | 2.50 | 19.50 | 16.25 | 54.75 |
| Melicytus alpinus | porcupine shrub | 6.00 | 5.00 | 2.50 | 22.50 | 18.50 | 54.50 |
| Coprosma crassifolia | mikimiki | 10.00 | 7.50 | 2.00 | 22.50 | 12.50 | 54.50 |
| Plagianthus divaricatus | marsh ribbonwood | 8.00 | 7.00 | 2.50 | 20.00 | 16.25 | 53.75 |
| Olearia bullata | shrub daisy | 10.00 | 10.50 | 2.50 | 19.00 | 11.75 | 53.75 |
| Muehlenbeckia axillaris | creeping pōhuehue | 7.00 | 6.00 | 2.00 | 21.00 | 16.25 | 52.25 |
| Aristotelia serrata | makomako, wineberry | 12.00 | 14.50 | 4.50 | 9.50 | 11.25 | 51.75 |
| Myrsine divaricata | weeping matipo, māpou | 8.00 | 9.50 | 2.50 | 16.00 | 14.75 | 50.75 |
| Coprosma wallii | mikimiki | 10.00 | 7.50 | 2.00 | 18.00 | 11.75 | 49.25 |
| Coprosma dumosa | coprosma | 10.00 | 3.50 | 2.00 | 22.50 | 11.00 | 49.00 |
| Melicope simplex | poataniwha | 5.00 | 10.00 | 2.00 | 17.50 | 13.25 | 47.75 |
| Chionocloa conspicua | hunagamoho | 9.00 | 3.50 | 1.50 | 22.50 | 11.00 | 47.50 |
| Austroderia richardii | toetoe | 6.00 | 9.00 | 2.00 | 19.50 | 10.25 | 46.75 |
| Cyathodes juniperina | mingimingi | 5.00 | 6.00 | 2.00 | 20.50 | 11.75 | 45.25 |
| Coprosma rigida | rigid mikimiki | 9.00 | 6.50 | 2.00 | 14.50 | 13.00 | 45.00 |
| Coprosma pedicellata | mikimiki | 10.00 | 11.50 | 2.00 | 15.00 | 6.50 | 45.00 |
| Anemanthele lessoniana | wind grass | 9.00 | 1.00 | 1.50 | 18.50 | 14.75 | 44.75 |
| Astelia fragrans | bush lily | 9.00 | 2.00 | 2.00 | 11.50 | 11.25 | 35.75 |
References
- Leroy, F.; Hite, A.H.; Gregorini, P. Livestock in evolving foodscapes and thoughtscapes [Hypothesis and Theory]. Front. Sustain. Food Syst. 2020, 4, 105. [Google Scholar] [CrossRef]
- Gorlinski, G. The History of Agriculture, 1st ed.; Britannica Educational Publishing: Chicago, IL, USA, 2012. [Google Scholar]
- Mazoyer, M.; Roudart, L.; Membrez, J.H. A History of World Agriculture: From the Neolithic Age to the Current Crisis; NYU Press: New York, NY, USA, 2006; Available online: https://books.google.co.nz/books?id=VDIVCgAAQBAJ (accessed on 1 October 2022).
- Moller, H.; MacLeod, C.J.; Haggerty, J.; Rosin, C.; Blackwell, G.; Perley, C.; Meadows, S.; Weller, F.; Gradwohl, M. Intensification of New Zealand agriculture: Implications for biodiversity. N. Z. J. Agric. Res. 2008, 51, 253–263. [Google Scholar] [CrossRef] [Green Version]
- Sizemore, G.C. Accounting for biodiversity in the dairy industry. J. Environ. Manag. 2015, 155, 145–153. [Google Scholar] [CrossRef] [PubMed]
- Williams, J.; Price, R. Impacts of red meat production on biodiversity in Australia: A review and comparison with alternative protein production industries. Anim. Prod. Sci. 2010, 50, 723–747. [Google Scholar] [CrossRef]
- Butler, S.J.; Vickery, J.A.; Norris, K. Farmland biodiversity and the footprint of agriculture. Science 2007, 315, 381–384. [Google Scholar] [CrossRef] [PubMed]
- García-Vega, D.; Newbold, T. Assessing the effects of land use on biodiversity in the world’s drylands and Mediterranean environments. Biodivers. Conserv. 2020, 29, 393–408. [Google Scholar] [CrossRef] [Green Version]
- Williams, K. Native Plant Communities of the Canterbury Plains. Department of Conservation. 2005. Available online: https://www.doc.govt.nz/globalassets/documents/conservation/native-plants/motukarara-nursery/canterbury-plains-plant-communities-book-full.pdf (accessed on 7 October 2022).
- MacLeod, C.J.; Blackwell, G.; Moller, H.; Innes, J.; Powlesland, R. The forgotten 60%: Bird ecology and management in New Zealand’s agricultural landscape. N. Z. J. Ecol. 2008, 32, 240–255. Available online: https://newzealandecology.org/nzje/2883 (accessed on 3 October 2022).
- Norton, D.A.; Butt, J.; Bergin, D.O. Upscaling restoration of native biodiversity: A New Zealand perspective. Ecol. Manag. Restor. 2018, 19, 26–35. [Google Scholar] [CrossRef] [Green Version]
- Selwood, K.E.; Zimmer, H.C. Refuges for biodiversity conservation: A review of the evidence. Biol. Conserv. 2020, 245, 108502. [Google Scholar] [CrossRef]
- Tozer, K.; Douglas, G.; Dodd, M.; Müller, K. Vegetation options for increasing resilience in pastoral hill country [Review]. Front. Sustain. Food Syst. 2021, 5, 550334. [Google Scholar] [CrossRef]
- Benavides, R.; Douglas, G.B.; Osoro, K. Silvopastoralism in New Zealand: Review of effects of evergreen and deciduous trees on pasture dynamics. Agrofor. Syst. 2008, 76, 327. [Google Scholar] [CrossRef]
- Farm Forestry New Zealand. Report: Trees for Steep Slopes. 2018. Available online: https://www.nzffa.org.nz/farm-forestry-model/why-farm-forestry/trees-for-erosion-controlsoil-conservation/report-trees-for-steep-slopes/tree-species/ (accessed on 8 October 2022).
- Barnagaud, J.-Y.; Barbaro, L.; Papaix, J.; Deconchat, M.; Brockerhoff, E.G. Habitat filtering by landscape and local forest composition in native and exotic New Zealand birds. Ecology 2014, 95, 78–87. [Google Scholar] [CrossRef] [PubMed]
- Spurr, E.; Rod, S.; Tranter, K. Food preferences of the bellbird (Anthornis melanura) in native forest remnants on the Port Hills, Banks Peninsula, New Zealand. Notornis 2011, 58, 139–157. [Google Scholar]
- Brown, J.S. Foraging ecology of animals in response to heterogeneous environments. In The Ecological Consequences of Environmental Heterogeneity: 40th Symposium of the British Ecological Society; Hutchings, M.J., John, E.A., Stewart, A.J.A., Eds.; Cambridge University Press: Cambridge, UK, 2000; pp. 181–214. Available online: https://books.google.co.nz/books?id=Q15hcYTqujIC (accessed on 2 October 2022).
- Pyke, G.H.; Pulliam, H.R.; Charnov, E.L. Optimal foraging: A selective review of theory and tests. Q. Rev. Biol. 1977, 52, 137–154. [Google Scholar] [CrossRef] [Green Version]
- Stephens, D.W.; Krebs, J.R. Optimization models in behavioral ecology: The spandrel meets its arch-rival. In Foraging Theory; Stephens, D.W., Krebs, J.R., Eds.; Princeton University Press: Princeton, NJ, USA, 2019. [Google Scholar] [CrossRef]
- Chapman, D.; Parsons, A.; Cosgrove, G.; Barker, D.J.; Marotti, D.; Venning, K.; Rutter, S.; Hill, J.; Thompson, A. Impacts of spatial patterns in pasture on animal grazing behavior, intake, and performance. Crop Sci. 2007, 47, 399–415. [Google Scholar] [CrossRef]
- Kramer, D.L. Foraging behavior. In Evolutionary Ecology: Concepts and Case Studies; Fox, C.W., Roff, D.A., Fairbairn, D.J., Eds.; Oxford University Press: Oxford, UK, 2001; pp. 232–246. [Google Scholar]
- Charlton, J.; Douglas, G.; Wills, B.; Prebble, J. Farmer experience with tree fodder. NZGA Res. Pract. Ser. 2003, 10, 7–15. [Google Scholar] [CrossRef]
- Douglas, G.; Wills, B.; Pryor, H.; Foote, A.; Trainor, K. Establishment of perennial legume species in drought-prone, North and South Island sites. In Proceedings of the New Zealand Grassland Association, Oamaru, New Zealand, 21–24 October 1996. [Google Scholar]
- Lambert, M.; Jung, G.; Costall, D. Forage shrubs in North Island hill country: Forage production. N. Z. J. Agric. Res. 1989, 32, 477–483. [Google Scholar] [CrossRef]
- Newcomb, G. Forage: A Guide to Tree Forage Crops. 1999. Available online: https://treecrops.org.nz/forage/ (accessed on 3 October 2022).
- Sheppard, J. Observations on Shrubs with Fodder Potential in Canterbury and Marlborough (C. R. Division, Trans.); Department of Scientific and Industrial Research: Lincoln, New Zealand, 1985. [Google Scholar]
- Wills, B.; Begg, J.; Brosnan, M. Forage shrubs for the South Island dry hill country: Atriplex halimus L. (Mediterranean saltbush). Proc. N. Z. Grassl. Assoc. 1990, 52, 103–106. [Google Scholar] [CrossRef]
- Emms, J.; Vercoe, P.E.; Hughes, S.J.; Jessop, P.; Norman, H.C.; Kilminster, T.; Kotze, A.; Durmic, Z.; Phillips, N.; Revell, D.K. Making decisions to identify forage shrub species for versatile grazing systems. In Proceedings of the 22nd International Grassland Congress Sydney, Sydney, Australia, 15–19 September 2013. [Google Scholar]
- Beck, M.R.; Gregorini, P. How dietary diversity enhances hedonic and eudaimonic well-being in grazing ruminants. Front. Vet. Sci. 2020, 7, 191. [Google Scholar] [CrossRef] [Green Version]
- Provenza, F.D.; Villalba, J.J.; Haskell, J.; MacAdam, J.W.; Griggs, T.; Wiedmeier, R.D. The value to herbivores of plant physical and chemical diversity in time and space. Crop Sci. 2007, 47, 382–398. [Google Scholar] [CrossRef]
- Cosgrove, G.; Parsons, A.; Marotti, D.; Rutter, S.; Chapman, D. Opportunities for enhancing the delivery of novel forage attributes. N. Z. Soc. Anim. Prod. Conf. 2001, 61, 16–19. [Google Scholar]
- Nuthall, R.; Rutter, S.; Rook, A. Milk production by dairy cows grazing mixed swards or adjacent monocultures of grass and white clover. In Proceedings of the British Grassland Society Research Conference, Stafford, Aberdeen, UK, 11–13 September 2000. [Google Scholar]
- Larson-Praplan, S.; George, M.; Buckhouse, J.; Laca, E. Spatial and temporal domains of scale of grazing cattle. Anim. Prod. Sci. 2015, 55, 284–297. [Google Scholar] [CrossRef]
- Kendall, P.; Nielsen, P.; Webster, J.; Verkerk, G.; Littlejohn, R.; Matthews, L. The effects of providing shade to lactating dairy cows in a temperate climate. Livest. Sci. 2006, 103, 148–157. [Google Scholar] [CrossRef]
- New Zealand Government. Animal Welfare Act. 1999. Available online: https://www.legislation.govt.nz/act/public/1999/0142/latest/DLM49664.html?search=ts_act%40bill%40regulation%40deemedreg_animal+welfare+act+1999_resel_25_a&p=1 (accessed on 25 July 2022).
- Nair, P.K.R. An Introduction to Agroforestry; Kluwer Academic Publishers: Dordrecht, The Netherlands, 1993; Available online: https://books.google.co.nz/books?id=CkVSeRpmIx8C (accessed on 7 October 2022).
- Bloomberg, M.; Bywater, A.C. Estimating the effect of shade on heat stress in New Zealand dairy cows using two published models. In Proceedings of the MODSIM 2007 International Congress on Modelling and Simulation, Christchurch, New Zealand, 10–13 December 2007. [Google Scholar]
- Farm Forestry New Zealand. Shelter Design: What Is Best for Your Land? 2011. Available online: https://www.nzffa.org.nz/farm-forestry-model/resource-centre/tree-grower-articles/may-2011/shelter-design-what-is-best-for-your-land/#:~:text=The%20best%20sheltering%20effect%20is,or%20porosity%20through%20the%20shelter (accessed on 8 October 2022).
- Brandle, J.R.; Hodges, L.; Zhou, X.H. Windbreaks in North American agricultural systems. In New Vistas in Agroforestry, 1st ed.; Nair, P.K.R., Rao, M.R., Buck, L.E., Eds.; Springer: Berlin/Heidelberg, Germany, 2004; pp. 65–78. [Google Scholar] [CrossRef]
- Forman, R.T.T. Land Mosaics: The Ecology of Landscapes and Regions; Cambridge University Press: Cambridge, UK, 1995; Available online: https://books.google.co.nz/books?id=sSRNU_5P5nwC (accessed on 7 October 2022).
- Wang, H.; Takle, E.S. Numerical simulations of shelterbelt effects on wind direction. J. Appl. Meteorol. 1995, 34, 2206–2219. [Google Scholar] [CrossRef]
- Heisler, G.M.; Dewalle, D.R. Effects of windbreak structure on wind flow. Agric. Ecosyst. Environ. 1988, 22–23, 41–69. [Google Scholar] [CrossRef]
- Smith, H.C. Shelter Research Needs in Relation to Primary Production: The Report of the National Shelter Working Party; Sturrock, J.W., Ed.; Ministry of Works and Development. Water and Soil Division: Wellington, New Zealand, 1984. [Google Scholar]
- Gardiner, B. Windbreaks and shelterbelts. In Encyclopedia of Forest Sciences; Burley, J., Ed.; Elsevier: Amsterdam, The Netherlands, 2004; pp. 1801–1806. [Google Scholar] [CrossRef]
- Singh, J.V. Windbreaks and Shelterbelts. 2010. Available online: http://agropedia.iitk.ac.in/content/windbreaks-and-shelterbelts#:~:text=Windbreaks%20are%20such%20structures%20which,cattle%20feed%20and%20fuel%20wood (accessed on 23 February 2023).
- Takle, E.S. Windbreaks and shelterbelts. In Encyclopedia of Soils in the Environment; Hillel, D., Ed.; Elsevier: Amsterdam, The Netherlands, 2005; pp. 340–345. [Google Scholar] [CrossRef]
- Ying, G.-G. Remediation and mitigation strategies. In Integrated Analytical Approaches for Pesticide Management; Maestroni, B., Cannavan, A., Eds.; Elsevier: Amsterdam, The Netherlands, 2018; pp. 207–217. [Google Scholar] [CrossRef]
- Eglington, S.M.; Noble, D.G.; Fuller, R.J. A meta-analysis of spatial relationships in species richness across taxa: Birds as indicators of wider biodiversity in temperate regions. J. Nat. Conserv. 2012, 20, 301–309. [Google Scholar] [CrossRef]
- Gregory, R.D.; Noble, D.; Field, R.; Marchant, J.; Raven, M.; Gibbons, D. Using birds as indicators of biodiversity. Ornis Hung. 2003, 12, 11–24. Available online: http://ornis.hu/articles/OrnisHungarica_vol12-13_p11-25.pdf (accessed on 3 October 2022).
- Vielliard, J.M. Bird community as an indicator of biodiversity: Results from quantitative surveys in Brazil. An. Da Acad. Bras. De Ciências 2000, 72, 323–330. [Google Scholar] [CrossRef] [Green Version]
- Deconchat, M.; Brockerhoff, E.G.; Barbaro, L. Effects of surrounding landscape composition on the conservation value of native and exotic habitats for native forest birds. For. Ecol. Manag. 2009, 258, S196–S204. [Google Scholar] [CrossRef]
- Duncan, R.P.; Blackburn, T.M. Extinction and endemism in the New Zealand avifauna. Glob. Ecol. Biogeogr. 2004, 13, 509–517. [Google Scholar] [CrossRef]
- Innes, J.; Kelly, D.; Overton, J.M.; Gillies, C. Predation and other factors currently limiting New Zealand forest birds. N. Z. J. Ecol. 2010, 34, 86. Available online: https://newzealandecology.org/nzje/2911 (accessed on 3 October 2022).
- Moors, P. Predation by mustelids and rodents on the eggs and chicks of native and introduced birds in Kowhai Bush, New Zealand. Ibis 1983, 125, 137–154. [Google Scholar] [CrossRef]
- White, P.C.; King, C.M. Predation on native birds in New Zealand beech forests: The role of functional relationships between stoats Mustela erminea and rodents. Ibis 2006, 148, 765–771. [Google Scholar] [CrossRef]
- Martin-Albarracin, V.L.; Amico, G.C.; Simberloff, D.; Nuñez, M.A. Impact of non-native birds on native ecosystems: A global analysis. PLoS ONE 2015, 10, e0143070. [Google Scholar] [CrossRef] [PubMed]
- Department of Conservation. Predator Free 2050. 2021. Available online: https://www.doc.govt.nz/nature/pests-and-threats/predator-free-2050/ (accessed on 2 October 2022).
- O’Donnell, C.F.; Hoare, J.M. Quantifying the benefits of long-term integrated pest control for forest bird populations in a New Zealand temperate rainforest. N. Z. J. Ecol. 2012, 36, 131–140. Available online: https://www.researchgate.net/publication/262565385_Quantifying_the_benefits_of_long-term_integrated_pest_control_for_forest_bird_populations_in_a_New_Zealand_temperate_rainforest_New_Zealand (accessed on 3 October 2022).
- iNaturalist. Observations: Selwyn District. 2022. Available online: https://www.inaturalist.org/observations?place_id=155152&quality_grade=research&verifiable=any&view=species&iconic_taxa=Aves (accessed on 10 May 2022).
- Dramstad, W.E.; Olson, J.D.; Forman, R.T. Landscape Ecology Principles in Landscape Architecture and Land-Use Planning; Harvard University Graduate School of Design: Cambridge, MA, USA, 1996. [Google Scholar]
- Pickett, S.T.A.; Cadenasso, M.L. Landscape ecology: Spatial heterogeneity in ecological systems. Science 1995, 269, 331–334. [Google Scholar] [CrossRef]
- Simmons, E.A. Landscape and planning: Landscape ecology, the concepts. In Encyclopedia of Forest Sciences; Burley, J., Ed.; Elsevier: Amsterdam, The Netherlands, 2004; pp. 502–508. [Google Scholar] [CrossRef]
- Meurk, C.; Hall, G. Options for enhancing forest biodiversity across New Zealand’s managed landscapes based on ecosystem modelling and spatial design. N. Z. J. Ecol. 2006, 30, 131–146. Available online: https://newzealandecology.org/nzje/2297 (accessed on 11 January 2023).
- Davies-Colley, R.J.; Payne, G.; Van Elswijk, M. Microclimate gradients across a forest edge. N. Z. J. Ecol. 2000, 24, 111–121. Available online: https://www.jstor.org/stable/24054666 (accessed on 7 April 2023).
- Young, A.; Mitchell, N. Microclimate and vegetation edge effects in a fragmented podocarp-broadleaf forest in New Zealand. Biol. Conserv. 1994, 67, 63–72. [Google Scholar] [CrossRef]
- Michel, P. Amendment to the New Zealand Threat Classification System 2008: Revised Categories 2021. Department of Conservation. 2021. Available online: https://www.doc.govt.nz/globalassets/documents/science-and-technical/nztcs-amendment-revised-categories-2021.pdf (accessed on 8 October 2022).
- Adebayo, S.; Emuoyibofarhe, O.; Awofolaju, T. Cost efficient Internet of things based smart farm system for rural farmers: Leveraging design thinking approach. Herit. Sustain. Dev. 2021, 3, 111–120. [Google Scholar] [CrossRef]
- Lucas, D. Ashley Dene before sheep. In Ashley Dene Lincoln University Farm: The First 100 Years; Lucas, D., Gow, N., Nicol, A., Eds.; Lincoln University: Lincoln, NZ, USA, 2012. [Google Scholar]
- Meurk, C. Vegetation of the Canterbury Plains and downlands. In The Natural History of Canterbury, 3rd ed.; Winterbourn, M., Knox, G., Burrows, C., Marsden, I., Eds.; University of Canterbury Press: Christchurch, New Zealand, 2008; pp. 195–250. [Google Scholar]
- Francis, M. A case study method for landscape architecture. Landsc. J. 2001, 20, 15–29. [Google Scholar] [CrossRef]
- Wang, L.; Wang, D.; He, Z.; Liu, G.; Hodgkinson, K.C. Mechanisms linking plant species richness to foraging of a large herbivore. J. Appl. Ecol. 2010, 47, 868–875. [Google Scholar] [CrossRef]
- Burke, D.M.; Nol, E. Influence of food abundance, nest-site habitat, and forest fragmentation on breeding ovenbirds. Auk 1998, 115, 96–104. [Google Scholar] [CrossRef]
- Elliot Noe, E.; Innes, J.; Barnes, A.D.; Joshi, C.; Clarkson, B.D. Habitat provision is a major driver of native bird communities in restored urban forests. J. Anim. Ecol. 2022, 91, 1444–1457. [Google Scholar] [CrossRef] [PubMed]
- Gordon, I.J.; Pérez-Barbería, F.J.; Manning, A.D. Rewilding Lite: Using traditional domestic livestock to achieve rewilding outcomes. Sustainability 2021, 13, 3347. [Google Scholar] [CrossRef]
- Newton, I. Population Limitation in Birds; Academic Press Limited: London, UK, 1998. [Google Scholar]


| Forage | Shade and Shelter | Habitat | Environment and Soil | Combined Lists | ||||||||||||||||||||
|---|---|---|---|---|---|---|---|---|---|---|---|---|---|---|---|---|---|---|---|---|---|---|---|---|
| Species of Native Woody Vegetation | Palatability | Growth Rate | Defoliation | Total Forage Score | Shade Provision | Plant Height | Canopy Size | Shelter Provision | Total Shade and Shelter Score | Food Sources | Nesting Sites | Total Bush Bird Habitat Score | Conservation Status | Frost Tolerance | Drought Tolerance | Wind Tolerance | Sun and Shade | Soil Drainage | Soil Depth | Soil Moisture | Soil Type | Total Environment and Soil Score | Total Combined Multifunctional Score | Total Combined Multifunctional Scores (Weighted). (Score Used in Plant Lists) |
| Sp.1 | 1–5 | 1–5 | 1–5 | #/15 | 1–5 | 1–5 | 1–5 | 1–5 | #/20 | 1–5 | 1–5 | #/10 | 0–8 | 1–5 | 1–5 | 1–5 | 1–5 | 1–5 | 1–5 | 1–5 | 1–5 | #/48 | #/93 | #/95.75 |
| Sp.2 | 1–5 | 1–5 | 1–5 | #/15 | 1–5 | 1–5 | 1–5 | 1–5 | #/20 | 1–5 | 1–5 | #/10 | 0–8 | 1–5 | 1–5 | 1–5 | 1–5 | 1–5 | 1–5 | 1–5 | 1–5 | #/48 | #/93 | #/95.75 |
| Sp.3 | 1–5 | 1–5 | 1–5 | #/15 | 1–5 | 1–5 | 1–5 | 1–5 | #/20 | 1–5 | 1–5 | #/10 | 0–8 | 1–5 | 1–5 | 1–5 | 1–5 | 1–5 | 1–5 | 1–5 | 1–5 | #/48 | #/93 | #/95.75 |
| … | … | … | … | … | … | … | ||||||||||||||||||
| Sp.63 | 1–5 | 1–5 | 1–5 | #/15 | 1–5 | 1–5 | 1–5 | 1–5 | #/20 | 1–5 | 1–5 | #/10 | 0–8 | 1–5 | 1–5 | 1–5 | 1–5 | 1–5 | 1–5 | 1–5 | 1–5 | #/48 | #/93 | #/95.75 |
| Weighting and scores | × 1 | × 1 | × 1 | #/15 | × 1.5 | × 1 | × 1 | × 1.5 | #/25 | × 0.5 | × 1 | #/7.5 | × 0.25 | × 1 | × 1.5 | × 1 | × 1 | × 1.5 | × 1.5 | × 1.5 | × 0.25 | #/48.25 | ||
| Botanical Name | Common Name | Palatability | Defoliation | Growth Rate | Total |
|---|---|---|---|---|---|
| Aristotelia serrata | makomako, wineberry | 5.0 | 4.0 | 3.0 | 12.0 |
| Coprosma robusta | karamū | 5.0 | 3.0 | 4.0 | 12.0 |
| Teucridium parvifolium | teucridium | 3.0 | 4.0 | 5.0 | 12.0 |
| Pittosporum eugenioides | lemonwood, tarata | 3.0 | 3.0 | 5.0 | 11.0 |
| Pittosporum tenuifolium | black matipo, kōhūhū | 3.0 | 3.0 | 5.0 | 11.0 |
| Griselinia littoralis | broadleaf, kāpuka | 5.0 | 3.0 | 3.0 | 11.0 |
| Cordyline australis | cabbage tree, ti kōuka | 3.0 | 5.0 | 3.0 | 11.0 |
| Pseudopanax arboreus | five-finger, whauwhaupaku | 5.0 | 3.0 | 3.0 | 11.0 |
| Veronica salicifolia | koromiko | 5.0 | 1.0 | 5.0 | 11.0 |
| Coprosma lucida | karangu, shining karamū | 5.0 | 3.0 | 3.0 | 11.0 |
| Veronica strictissima | Banks Peninsula hebe | 5.0 | 1.0 | 5.0 | 11.0 |
| Coprosma virescens | mikimiki | 3.0 | 3.0 | 5.0 | 11.0 |
| Aristotelia fruticosa | mountain wineberry | 5.0 | 4.0 | 2.0 | 11.0 |
| Hoheria angustifolia | narrow-leaved houhere | 3.0 | 4.0 | 3.0 | 10.0 |
| Pennantia corymbosa | kaikōmako | 4.0 | 3.0 | 3.0 | 10.0 |
| Carpodetus serratus | marbleleaf, putaputāwētā | 3.0 | 4.0 | 3.0 | 10.0 |
| Coprosma linariifolia | yellow wood | 3.0 | 4.0 | 3.0 | 10.0 |
| Coprosma pedicellata | mikimiki | 3.0 | 4.0 | 3.0 | 10.0 |
| Olearia bullata | shrub daisy | 3.0 | 4.0 | 3.0 | 10.0 |
| Coprosma propinqua | mikimiki | 3.0 | 3.0 | 4.0 | 10.0 |
| Botanical Name | Common Name | Shade | Height | Canopy | Shelter | Total |
|---|---|---|---|---|---|---|
| Podocarpus totara | tōtara | 7.5 | 5.0 | 5.0 | 7.5 | 25.0 |
| Prumnopitys taxifolia | mataī, black pine | 7.5 | 5.0 | 5.0 | 7.5 | 25.0 |
| Dacrycarpus dacrydioides | kahikatea | 7.5 | 5.0 | 4.0 | 7.5 | 24.0 |
| Elaeocarpus hookerianus | pōkākā | 7.5 | 4.0 | 5.0 | 6.0 | 22.5 |
| Pittosporum eugenioides | lemonwood, tarata | 6.0 | 4.0 | 4.0 | 7.5 | 21.5 |
| Hoheria angustifolia | narrow-leaved houhere | 7.5 | 4.0 | 3.0 | 6.0 | 20.5 |
| Plagianthus regius | lowland ribbonwood | 7.5 | 4.0 | 3.0 | 6.0 | 20.5 |
| Dodonaea viscosa | akeake | 6.0 | 3.0 | 3.0 | 6.0 | 18.0 |
| Pittosporum tenuifolium | black matipo, kōhūhū | 6.0 | 3.0 | 3.0 | 6.0 | 18.0 |
| Corynocarpus laevigatus | karaka | 4.5 | 4.0 | 3.0 | 6.0 | 17.5 |
| Griselinia littoralis | broadleaf, kāpuka | 6.0 | 2.0 | 5.0 | 4.5 | 17.5 |
| Cordyline australis | cabbage tree, ti kōuka | 3.0 | 4.0 | 2.0 | 6.0 | 15.0 |
| Pseudopanax arboreus | five-finger, whauwhaupaku | 4.5 | 3.0 | 3.0 | 4.5 | 15.0 |
| Aristotelia serrata | makomako, wineberry | 3.0 | 4.0 | 3.0 | 4.5 | 14.5 |
| Pennantia corymbosa | kaikōmako | 3.0 | 4.0 | 3.0 | 4.5 | 14.5 |
| Olearia fragrantissima | fragrant tree daisy | 4.5 | 3.0 | 2.0 | 4.5 | 14.0 |
| Kunzea ericoides | kānuka | 3.0 | 3.0 | 3.0 | 4.5 | 13.5 |
| Carpodetus serratus | marbleleaf, putaputāwētā | 1.5 | 4.0 | 3.0 | 4.5 | 13.0 |
| Pseudopanax crassifolius | lancewood, horoeka | 1.5 | 4.0 | 3.0 | 4.5 | 13.0 |
| Leptospermum scoparium | mānuka | 3.0 | 2.0 | 3.0 | 4.5 | 12.5 |
| Botanical Name | Common Name | Food | Nesting | Total |
|---|---|---|---|---|
| Pseudopanax arboreus | five-finger, whauwhaupaku | 2.5 | 5.0 | 7.5 |
| Sophora microphylla | kōwhai, small-leaved kōwhai | 2.5 | 5.0 | 7.5 |
| Cordyline australis | cabbage tree, ti kōuka | 2.0 | 5.0 | 7.0 |
| Carpodetus serratus | marbleleaf, putaputāwētā | 2.0 | 5.0 | 7.0 |
| Kunzea ericoides | kānuka | 2.0 | 5.0 | 7.0 |
| Hoheria angustifolia | narrow-leaved houhere | 1.5 | 5.0 | 6.5 |
| Elaeocarpus hookerianus | pōkākā | 1.5 | 5.0 | 6.5 |
| Prumnopitys taxifolia | mataī, black pine | 1.5 | 5.0 | 6.5 |
| Dacrycarpus dacrydioides | kahikatea | 1.5 | 5.0 | 6.5 |
| Corynocarpus laevigatus | karaka | 1.0 | 5.0 | 6.0 |
| Plagianthus regius | lowland ribbonwood | 1.0 | 5.0 | 6.0 |
| Podocarpus totara | tōtara | 1.0 | 5.0 | 6.0 |
| Griselinia littoralis | broadleaf, kāpuka | 2.5 | 3.0 | 5.5 |
| Pittosporum eugenioides | lemonwood, tarata | 2.0 | 3.0 | 5.0 |
| Pittosporum tenuifolium | black matipo, kōhūhū | 2.0 | 3.0 | 5.0 |
| Aristotelia serrata | makomako, wineberry | 1.5 | 3.0 | 4.5 |
| Dodonaea viscosa | akeake | 1.5 | 3.0 | 4.5 |
| Olearia fragrantissima | fragrant tree daisy | 1.5 | 3.0 | 4.5 |
| Olearia paniculata | akiraho, golden akeake | 1.5 | 3.0 | 4.5 |
| Olearia avicenniifolia | mountain akeake | 1.5 | 3.0 | 4.5 |
| Botanical Name | Common Name | Fo | SS | HT | ET | So | Total |
|---|---|---|---|---|---|---|---|
| Podocarpus totara | tōtara | 5.00 | 25.00 | 6.00 | 22.50 | 20.75 | 79.25 |
| Hoheria angustifolia | narrow-leaved houhere | 10.00 | 20.50 | 6.50 | 21.00 | 20.75 | 78.75 |
| Elaeocarpus hookerianus | pōkākā | 8.00 | 22.50 | 6.50 | 17.50 | 21.75 | 76.25 |
| Plagianthus regius | lowland ribbonwood | 8.00 | 20.50 | 6.00 | 19.50 | 20.75 | 74.75 |
| Prumnopitys taxifolia | mataī, black pine | 5.00 | 25.00 | 6.50 | 15.50 | 20.75 | 72.75 |
| Cordyline australis | cabbage tree, ti kōuka | 11.00 | 15.00 | 7.00 | 21.50 | 17.75 | 72.25 |
| Pittosporum tenuifolium | black matipo, kōhūhū | 11.00 | 18.00 | 5.00 | 19.00 | 18.50 | 71.50 |
| Griselinia littoralis | broadleaf, kāpuka | 11.00 | 17.50 | 5.50 | 20.50 | 17.00 | 71.50 |
| Kunzea ericoides | kānuka | 7.00 | 13.50 | 7.00 | 23.75 | 20.00 | 71.25 |
| Dodonaea viscosa | akeake | 9.00 | 18.00 | 4.50 | 19.50 | 18.75 | 69.75 |
| Pittosporum eugenioides | lemonwood, tarata | 11.00 | 21.50 | 5.00 | 14.50 | 15.50 | 67.50 |
| Dacrycarpus dacrydioides | kahikatea | 5.00 | 24.00 | 6.50 | 14.50 | 17.25 | 67.25 |
| Olearia fragrantissima | fragrant tree daisy | 9.00 | 14.00 | 4.50 | 18.00 | 20.75 | 66.25 |
| Corynocarpus laevigatus | karaka | 8.00 | 17.50 | 5.00 | 15.50 | 19.25 | 65.25 |
| Olearia avicenniifolia | mountain akeake | 9.00 | 10.00 | 4.50 | 22.50 | 18.50 | 64.50 |
| Pseudopanax arboreus | five-finger, whauwhaupaku | 11.00 | 15.00 | 7.50 | 14.50 | 16.25 | 64.25 |
| Olearia paniculata | akiraho, golden akeake | 9.00 | 12.50 | 4.50 | 19.00 | 19.25 | 64.25 |
| Discaria toumatou | matagouri, tūmatakuru | 9.00 | 10.00 | 2.00 | 23.50 | 19.00 | 63.50 |
| Sophora microphylla | kōwhai, small-leaved kōwhai | 6.00 | 11.00 | 6.50 | 21.50 | 18.50 | 63.50 |
| Leptospermum scoparium | mānuka | 7.00 | 12.50 | 4.00 | 23.50 | 16.25 | 63.25 |
Disclaimer/Publisher’s Note: The statements, opinions and data contained in all publications are solely those of the individual author(s) and contributor(s) and not of MDPI and/or the editor(s). MDPI and/or the editor(s) disclaim responsibility for any injury to people or property resulting from any ideas, methods, instructions or products referred to in the content. |
© 2023 by the authors. Licensee MDPI, Basel, Switzerland. This article is an open access article distributed under the terms and conditions of the Creative Commons Attribution (CC BY) license (https://creativecommons.org/licenses/by/4.0/).
Share and Cite
Eggers, J.; Davis, S.; Doscher, C.; Gregorini, P. Enhancing Multifunctionality in Agricultural Landscapes with Native Woody Vegetation. Sustainability 2023, 15, 11295. https://doi.org/10.3390/su151411295
Eggers J, Davis S, Doscher C, Gregorini P. Enhancing Multifunctionality in Agricultural Landscapes with Native Woody Vegetation. Sustainability. 2023; 15(14):11295. https://doi.org/10.3390/su151411295
Chicago/Turabian StyleEggers, James, Shannon Davis, Crile Doscher, and Pablo Gregorini. 2023. "Enhancing Multifunctionality in Agricultural Landscapes with Native Woody Vegetation" Sustainability 15, no. 14: 11295. https://doi.org/10.3390/su151411295