Article

Demand Priority of Green Space from the Perspective of Carbon Emissions and Storage

1
Guangzhou Urban Planning and Design Co., Ltd., Guangzhou 510030, China
2
School of Civil Engineering, Guangzhou University, Guangzhou Higher Education Mega Center, Guangzhou 510006, China
*
Author to whom correspondence should be addressed.
Sustainability 2023, 15(14), 11199; https://doi.org/10.3390/su151411199
Submission received: 30 May 2023 / Revised: 30 June 2023 / Accepted: 11 July 2023 / Published: 18 July 2023
(This article belongs to the Special Issue Sustainable Growth and Carbon Neutrality)

Abstract

:
During the process of rapid urban expansion, there has been a growing interest in understanding the spatial requirements of green spaces. However, limited research has evaluated green space demand specifically in terms of carbon storage and carbon emissions. This study introduces a novel methodological framework that aligns ecosystem service functions with both supply and demand, considering carbon storage and carbon emissions as crucial perspectives. The goal was to develop a comprehensive approach to assess the matching between the supply and demand of green spaces based on their carbon-related ecosystem services. The following research questions were developed to guide this study: (1) What are the spatial and temporal characteristics of carbon storage? (2) What are the spatiotemporal variations in carbon emissions on a city scale? (3) How does a city obtain the demand priority evaluation of green spaces in terms of carbon neutrality? Using Guangzhou as a case study, we employed the integrated valuation of ecosystem services and tradeoffs (InVEST) model to measure the spatial and temporal patterns of carbon storage. Remote sensing data were utilized, along with emission factors, to analyze the spatial and temporal characteristics of carbon emissions. The line of best fit method was employed to predict future carbon storage and carbon emissions, as well as population density and average land GDP. Based on these predictions, we prioritized the demand for green spaces. The results indicate the future demand priority order for green spaces in different districts. We suggest that this green space demand evaluation model can serve as a reference for future policy making and be applied to other cities worldwide.

1. Introduction

Climate change has become a global issue due to carbon emissions in the wake of modernization and urbanization. Carbon dioxide (CO2) is a main greenhouse gas that is emitted primarily due to the use of fossil fuels and deforestation worldwide [1,2]. Carbon storage (CS) involves making a carbon sink using plant photosynthesis, and the main type of space used for carbon storage is green space, which is organized with many different species of plants to absorb CO2 [3]. With urban space expansion, the change in vegetation coverage and land use type significantly impact CS, which also significantly impacts soil quality, land productivity, agricultural production, and food safety, as well as regional ecology, the environment, human survival, and social and economic development. Moreover, efficiently estimating climate change mitigation and ensuring standardized protocols and enhanced data quality are imperative in CS research, particularly when conducting an integrated assessment of land use changes and their influence. By scrutinizing historical changes from a contextual standpoint, valuable insights are gained for developing sustainable land management strategies [4,5]. China’s government has committed to reducing greenhouse gas emissions by 2030 and achieving carbon neutrality by 2060. This goal is especially pertinent to the city of Guangzhou, which is one of the most developed and densely populated urban agglomerations in China. The expansion of built land in Guangzhou has made it difficult to reduce carbon emissions (CEs) [6]. Moreover, rapid urban expansion has negatively impacted green spaces, which has become an important factor limiting city sustainability [7,8]. This strays from the urban plan goal of creating livable, sustainable, and functional urban environments that meet the needs of the population. Despite urban planners noticing that built land expansion will harm CS, it is still common for urban planners to overlook the allocation of green spaces in favor of increasing prosperity, especially in developing countries. Some studies have analyzed vegetation, land use, and management to inform sustainable urban planning using life cycle assessments to explore the transition from global urban green spaces to nature-based solutions. By assessing vegetation, species composition, and carbon sequestration potential, these studies provide insights into their role in sustainability and climate change mitigation [9,10,11]. Therefore, this research on the demand priority of green spaces is significant in promoting low-carbon cities.
Green space, carbon storage, and carbon emission are closely related. Firstly, CS strongly depends on green space distribution. It can be regarded as the value of urban land with vegetation and is considered to be one of the most promising options available to reduce carbon dioxide (CO2) emissions into the atmosphere as a result of urban expansion [12,13,14,15]. It is also a way to mitigate the accumulation of greenhouse gases in the air released by burning fossil fuels and other anthropogenic activities [16,17]. In addition, the increase in atmospheric CO2 caused by land use and land cover change (LUCC) is a driver of the increasing global climate. There should be a precise, accurate, and cost-effective method for measuring the quantity of CS [18,19,20]. InVEST (integrated valuation of ecosystem services and tradeoffs) is a suite of models that is used to calculate and evaluate natural goods and services that sustain and fulfill human life [16]. Furthermore, green spaces are the main type of space used to remove atmospheric CO2. CEs, primarily from the combustion of fossil fuels, have risen dramatically since the start of the industrial revolution. Matching the demand for CS and green space is the main way to reduce CEs. The existing research on the demand for green spaces mainly focuses on the social aspect to judge whether there is enough green space for different people [21,22,23]. Most of the world’s greenhouse gas emissions come from countries that have a strong need to develop their economies [24]. However, CEs are not only reduced by people themselves, but also by different industries or traffic. Therefore, it is not enough to use human factors such as the distance between residents and green spaces to evaluate demand. Unfortunately, few researchers have focused on the carbon perspective to evaluate the demand and supply of green spaces. To summarize, the gap between CS and CEs reveals the need for green spaces from urban planners [25]. Moreover, this research will be more useful for policymakers if it carries out predictions of CS and CEs to guide the green space demand, as analyzing past trends in CEs and CS is a useful way to predict future demand [24]. Our work aims to fill this research gap by focusing on evaluating green spaces from the perspective of the gap between CEs and CS, as green spaces will have a dominant role in absorbing carbon emissions and creating more CS in the future [26,27].
Therefore, this paper focuses on the following questions: (1) How are cities of different residential densities performing in terms of green space supplies? (2) What are the turning points in the relation between green supply and residential density? (3) How do cities balancing the green space supply and green space pressure in Europe? In addition, this study aimed to develop a novel methodological framework for matching each ecosystem service function regarding both the supply and demand sides from the perspective of carbon storage and carbon emissions.
In this study, we used remote sensing data with the InVEST model to calculate CS from temporal and spatial perspectives [28]. The emission factor (EF) was used to calculate the current CEs from temporal and spatial perspectives using data of components such as electricity, fuel, and water. Furthermore, this research focused on the growth rate method to predict future CS and CEs. The characteristics of CS and CEs indicate a relationship between carbon and green space; however, this is insufficient, and social and economic factors should also be taken into consideration. These considerations can be seen in much of the existing research [29,30]. Moreover, the factors and data on green space service changes, i.e., the gap between carbon emission and carbon storage, population density, and average land gross domestic product (GDP), can be obtained to express the green space demand in different districts. Lastly, we developed a method to evaluate the demand priority of green space in different districts in Guangzhou.
This research is structured as follows: The methods are detailed in Section 2, including the study area, data source, and the methodology used for calculating carbon. Section 3 presents the results of the CS and CE analysis in Guangzhou. The demand priority evaluation of green space is further discussed in Section 4. In Section 5, we conclude with the main results and suggestions for further research.

2. Materials and Methods

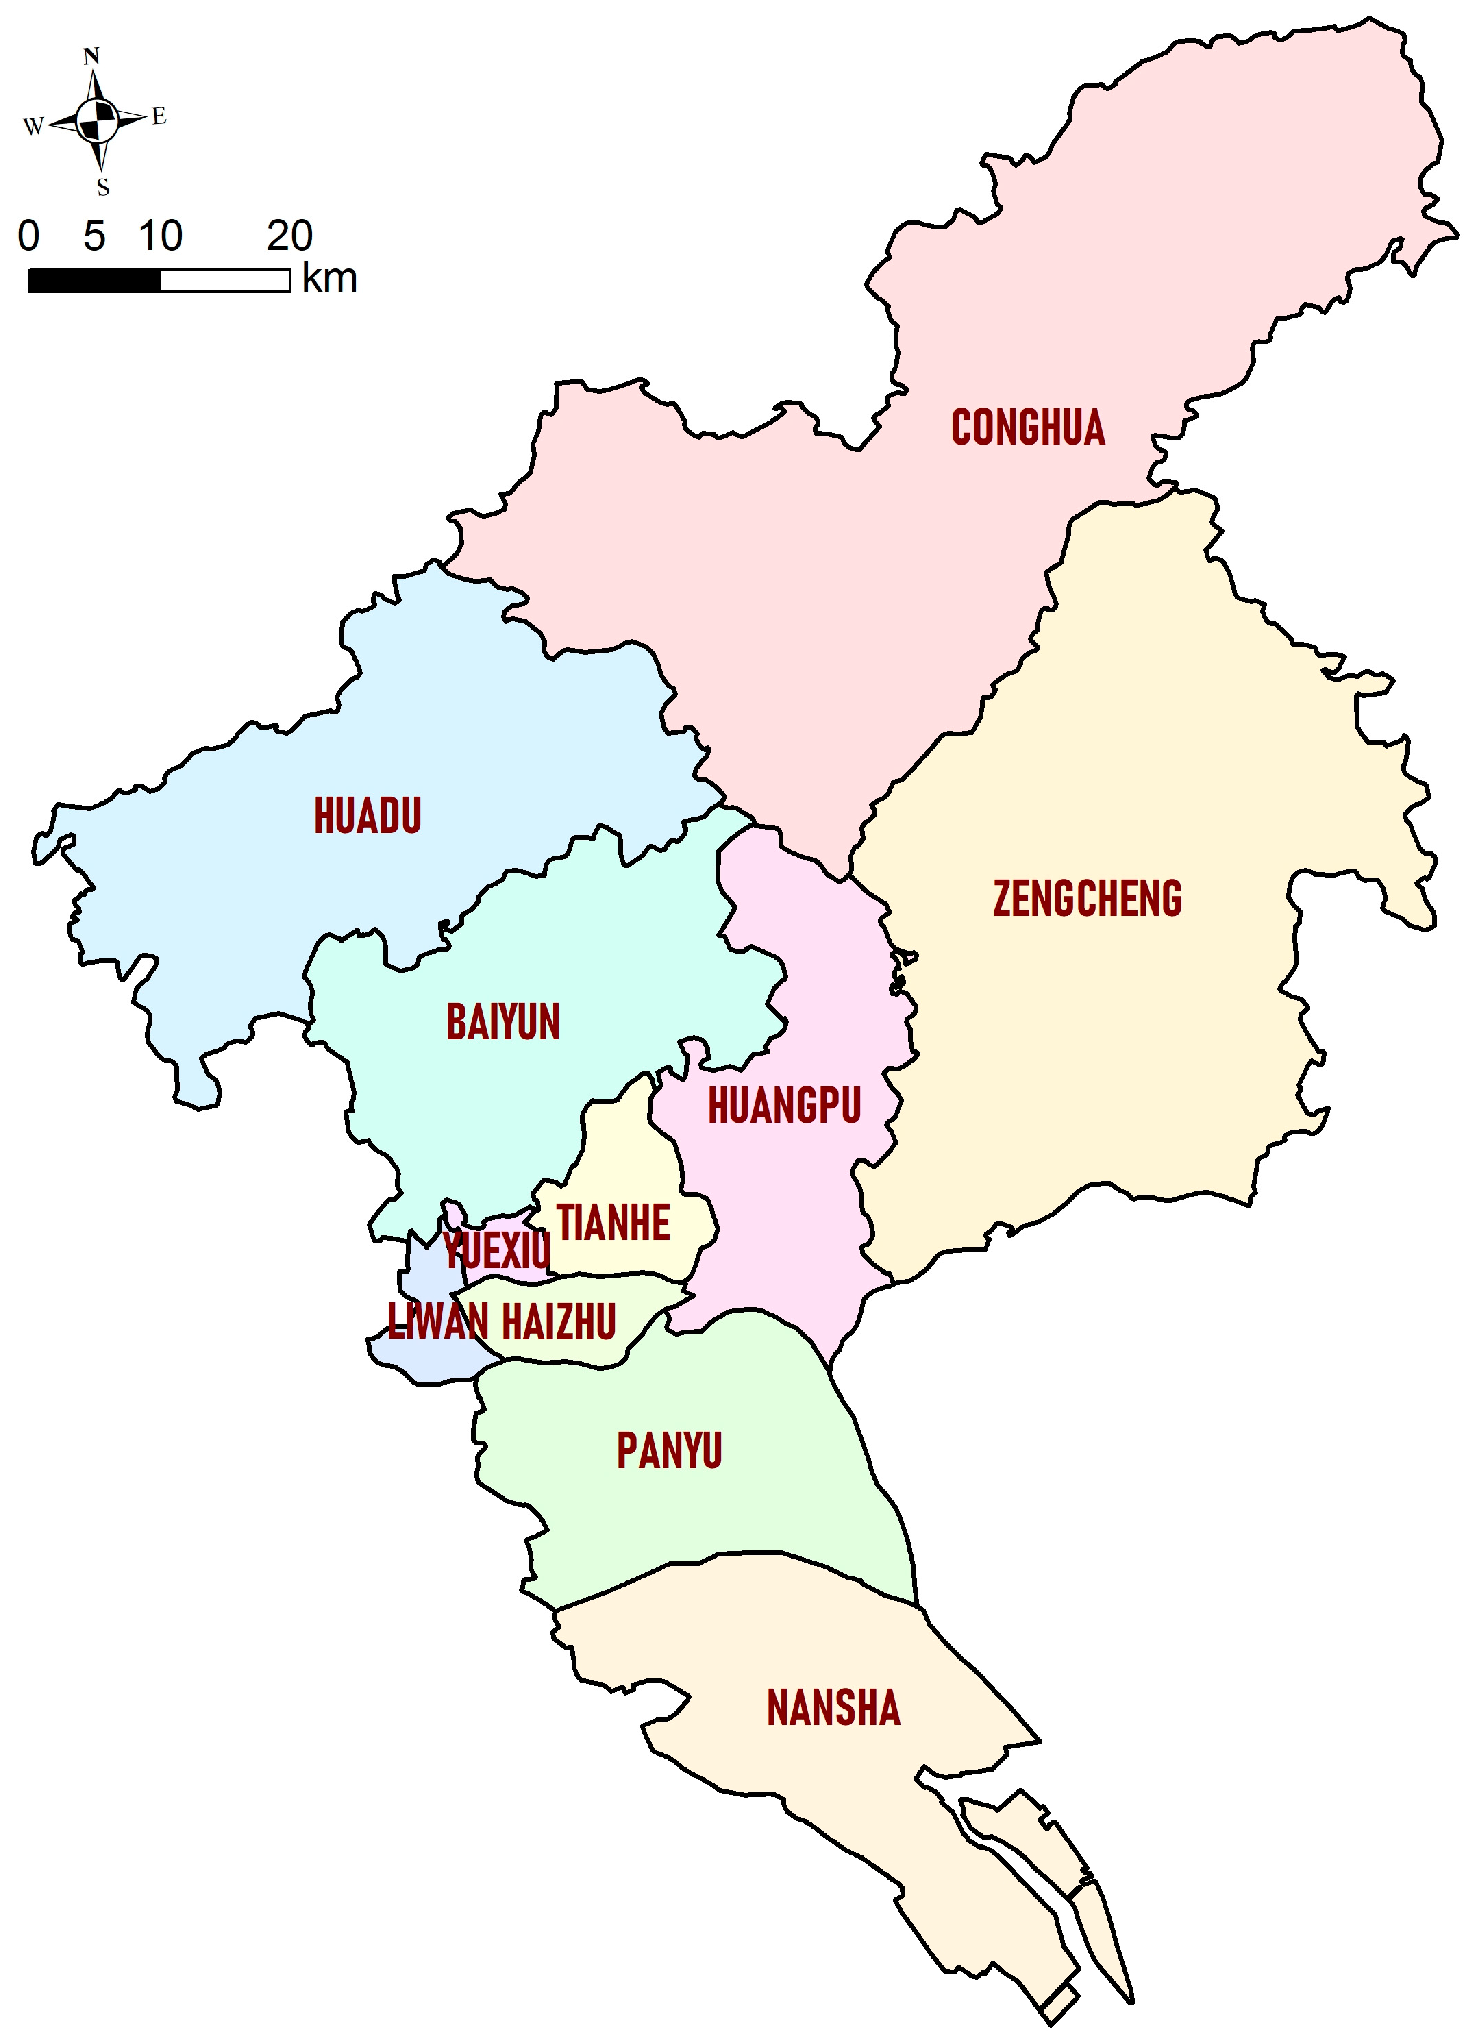
2.1. Area for Case Study

Guangzhou is situated in the southern part of China, in the center of the Pearl River Delta in the Guangdong province. Its northeastern region is characterized by high relief, while the southwest is marked by low relief. The city’s northern regions are hilly and mountainous, covered with thick forests and low mountains such as the renowned Baiyun Mountain, or “The Lung of the City”. The central area is mainly hilly and surrounded by a series of rivers and canals. The Pearl River and its tributaries pass through Guangzhou, with the northern and southern branches of the Pearl River forming a huge delta. The annual rainfall is 1720 mm. Guangzhou has a land area of 7434.4 km2 and a 41.67 ecological land cover (forests, grasslands, water areas, and wetlands). The built-up area comprises 25.44% of the town’s total area [31]. There are eleven districts in Guangzhou City: Yuexiu, Liwan, Haizhu, Tianhe, Baiyun, Huangpu, Panyu, Huadu, Nansha, Conghua, and Zengcheng [31] (Figure 1).

2.2. Data Source

Remote sensing refers to the process of sensing and monitoring the physical properties of a region from a distance (typically from a satellite or aircraft). Researchers can “sense” facts about the planet using an RGB camera or a thermal infrared camera that collects remote-sensing photos [32]. We collected remotely sensed data in the years 2000, 2010, and 2020. Remote sensing interpretation is the process of extracting object information from remotely sensed images. Visual interpretation is the process by which professionals obtain target-specific information from remotely sensed imagery via direct observation or with the aid of interpretive tools. Remote sensing image understanding is also known as computerized remote sensing image interpretation [33,34].
Guangzhou’s land use data for the years 2000, 2010, and 2020 were obtained from the Chinese Academy of Sciences’ Data Center for Resources and Environmental Sciences via remote sensing interpretation. The land uses were categorized as woodlands, grasslands, croplands, water areas, construction lands, and unused lands. The resolution of the data was 0.3 km × 0.3 km (Figure 2).

2.3. Research Method

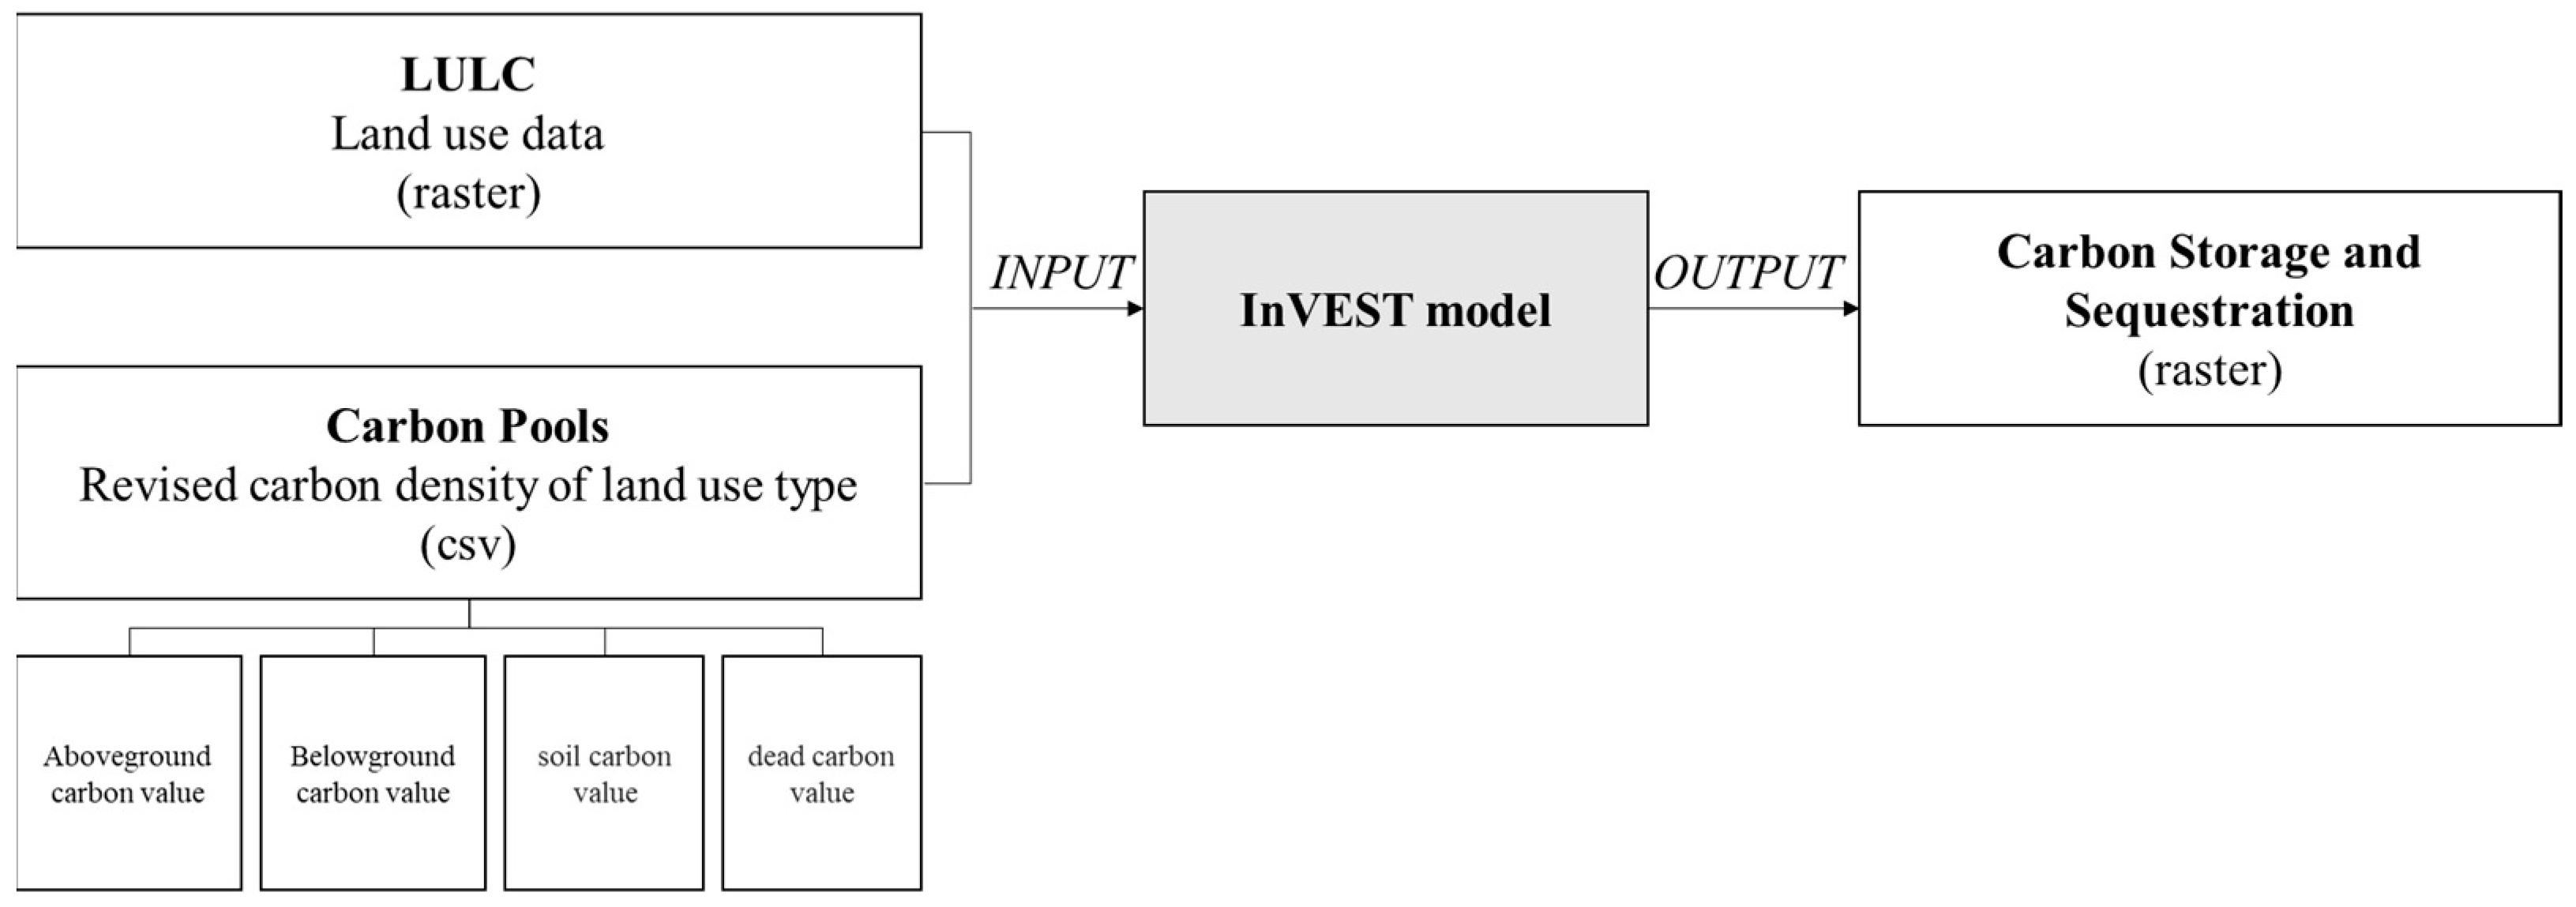
2.3.1. The InVEST Model

In the present study, the simulation and evaluation of CS in urban spaces with vegetation were completed using the InVEST model. The InVEST model (https://naturalcapitalproject.stanford.edu/software/invest, accessed on 19 December 2022) is an open-source software developed by the Natural Capital Project from Stanford University, the University of Minnesota, the Chinese Academy of Sciences, the Nature Conservancy, the World Wildlife Fund, the Stockholm Resilience Centre, and the Royal Swedish Academy of Sciences. InVEST is a valuation model that has a strong practical performance and can quantify the value of ecosystem services. The InVEST model estimates long-term carbon storage in the current landscape using maps of LUCC and CS from above-ground biomass, below-ground biomass, soil, and dead material. The CS and sequestration modules of InVEST combine the land-use cover type with CS for evaluation and study, and the results of the output are intuitive and reliable. The ecosystem CS calculation used in the model is based on land-use type as the unit of assessment. The CS in terrestrial ecosystems is evaluated via grid calculations according to the average carbon density data on the above-ground carbon pool, underground carbon pool, soil carbon pool, and dead carbon pool in different land use types in the study area. This study focuses only on terrestrial CS. The InVEST model aims to assess the relationship between land-use and ecosystem services functions. The model has been developed to include multiple modules such as water conservation, habitat suitability, and carbon storage, forming an important model that incorporates multiple ecosystem service valuation functions. One of these is the CS service module, which has been successfully applied in practical studies in many areas of global research. CS in the ecosystem includes above-ground CS, the sequestration of vegetation by underground carbon, soil carbon storage, and CS in dead organic material. The formula is as follows:
Ctotal = Cabove + Cbelow + Csoil + Cdead
where Ctotal represents the total ecosystem carbon storage (t), Cabove represents the carbon density in the above-ground biomass (t/km), Cbelow represents the carbon density in the belowground biomass (t/km), Csoil represents the carbon density of the soil (t/km), and Cdead represents the carbon density of the dead matter (t/km).

2.3.2. Land Use Dynamic Attitude

Changing the structure of land use types alone is not sufficient to reveal the pattern of urban land change. In this section, the dynamic attitude of a single land use type is adopted to further reveal the characteristics of land use change. We used the dynamic attitude of a single land-use type to investigate the characteristics of land-use change and reflect the rate of regional land change. The mathematical formula is as follows:
K = U b U a U a × T 1 × 100 %
where Ub is the land type area at the end of this study (ha), Ua is the land type area at the beginning of this study (ha), T is the time interval of this study (year), and K is the dynamic attitude of a single land-use type. If K is greater than zero, the area of the land type increases, and if it is less than zero, the area decreases. If |K| is larger, the land type changes faster.
In this sense, the LULC and carbon pool data were input into the InVEST model to conduct an analysis (Figure 3). Based on the land use data of Guangzhou from 2000 to 2020, this study aimed to evaluate the effects of land-use (LULC) changes on the dynamics of CS.

2.3.3. Carbon Emission Calculation

The emission factor (EF) is a commonly utilized measure in carbon emission assessment at the city level. Based on the EF, the annual carbon emissions of urban households were determined by analyzing the water, electricity, natural gas, and car fuel bills obtained from questionnaire responses (Table 1). The calculation of CO2 emissions follows the equation provided below [35]:
CE = E × f
where CE is the amount of CO2 emissions (kg), E is the energy use, and f is the emission factor of energy (kg CO2 e/kWh).

2.3.4. Line of Best Fit to Predict Future CS and CEs

The term “best fit” refers to the construction of a line that minimizes the gap between price points and the actual linear regression line [36]. Choosing the most suitable probability model involves not only visual observations but also numerical tests [37]. In the case of the previous CS and CE data, there was a close alignment between the time data and the line, with the right tail of the data falling near the line. Therefore, the line of best fit for the CS and CE data was utilized in the SPSS 22.0 software to make predictions about future CS and CE values.

3. CS and CE Analysis

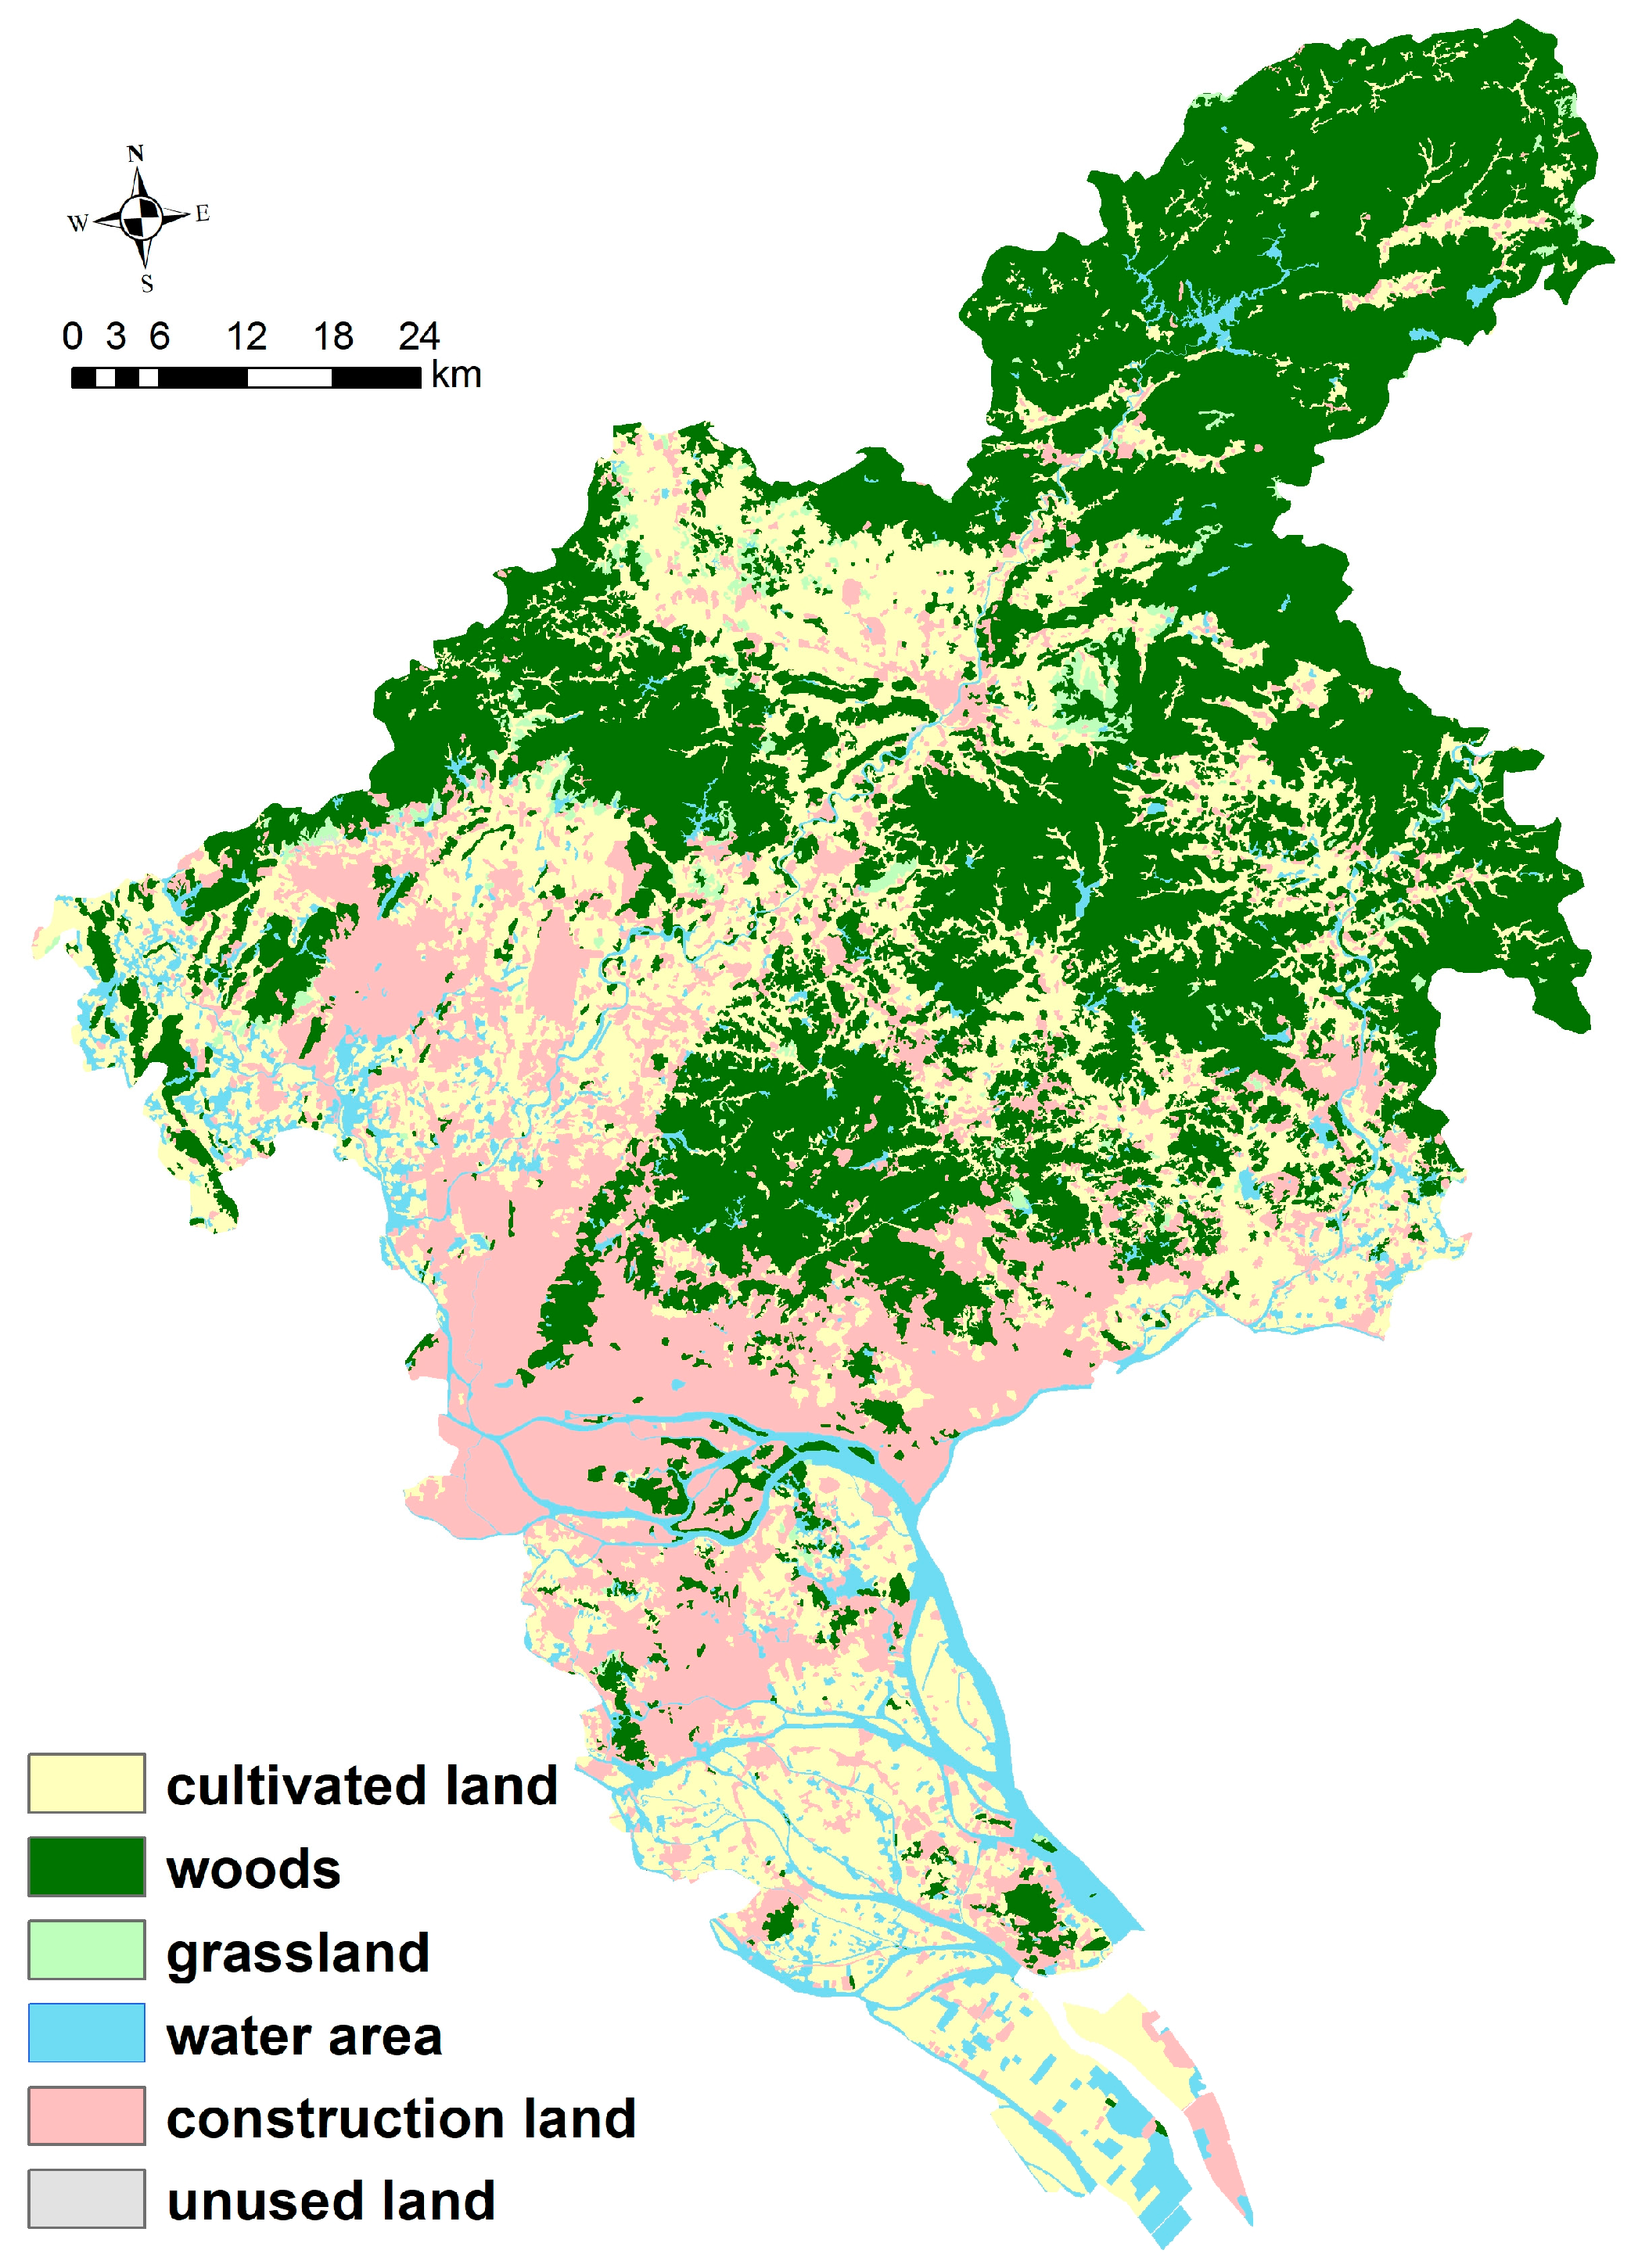
3.1. Spatio-Temporal Changes in Land Use

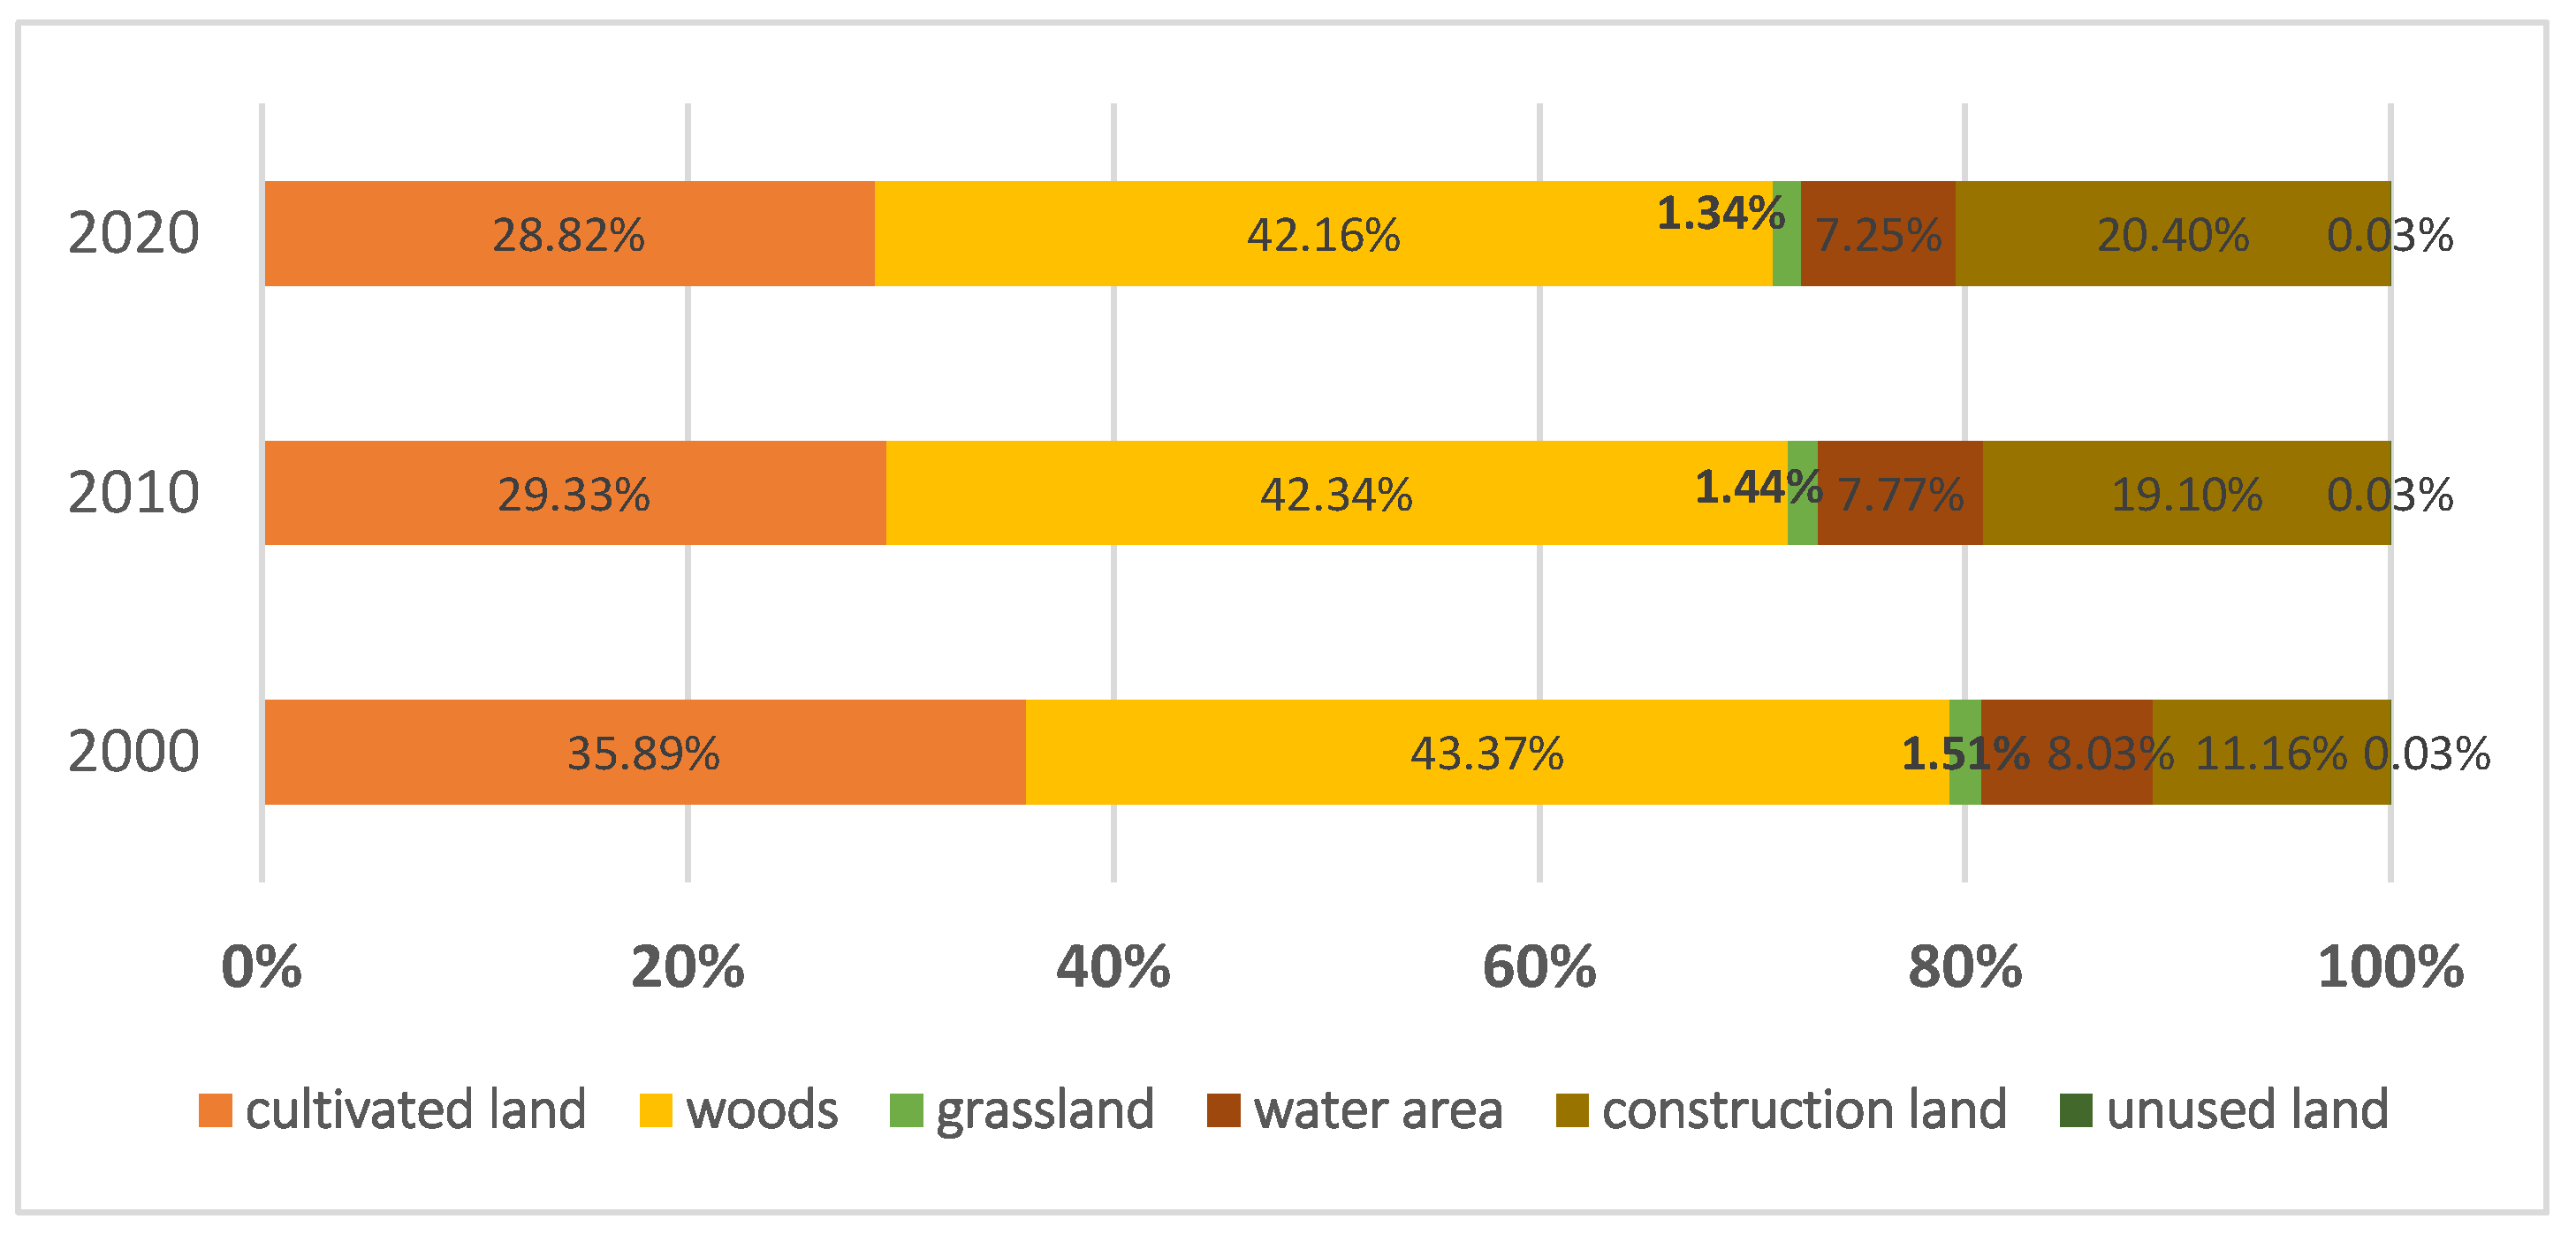
3.1.1. Land Use Structure Change

The characteristics of the land use types were analyzed for different periods with the ArcGIS spatial analysis tool. The main findings are as follows: (1) Regarding the overall characteristics, the land use area sizes order in Guangzhou was: woodland > cropland > construction land > water area > grassland > unused land. Moreover, the proportion of construction land increased, while the proportion of woodland and cropland decreased. (2) Regarding the structural changes from 2000–2020 (Figure 4 and Table 2), in 2000, the area of the forest land was 3126.85 km2, and in 2020, the remaining area of the forest land decreased to 3040.03 km2. The proportion of forested land was 42.16% in 2020, which was still the land-use type with the highest proportion of urban land area, belonging to the dominant landscape type. The census data for the year 2000 indicated that the cultivated area was 2588.12 km2, comprising 35.89%, and the area shrank to 2077.91 km2 in 2020 with a sharp decline, representing 28.82%. The data also indicated the built-up area was 805 km2, comprising 11.16%. As of 2020, the built-up area was 1470.67 km2 or 20.40%, and of all the land types, the rate of increase in the construction land area was the highest. In the year 2000, the water area was 579.23 km2, accounting for 8.03%, and in 2020, the water area was 522.67 km2, accounting for 7.25%. There was a relatively small proportion of grassland and unused land, and a relatively small change in the area.

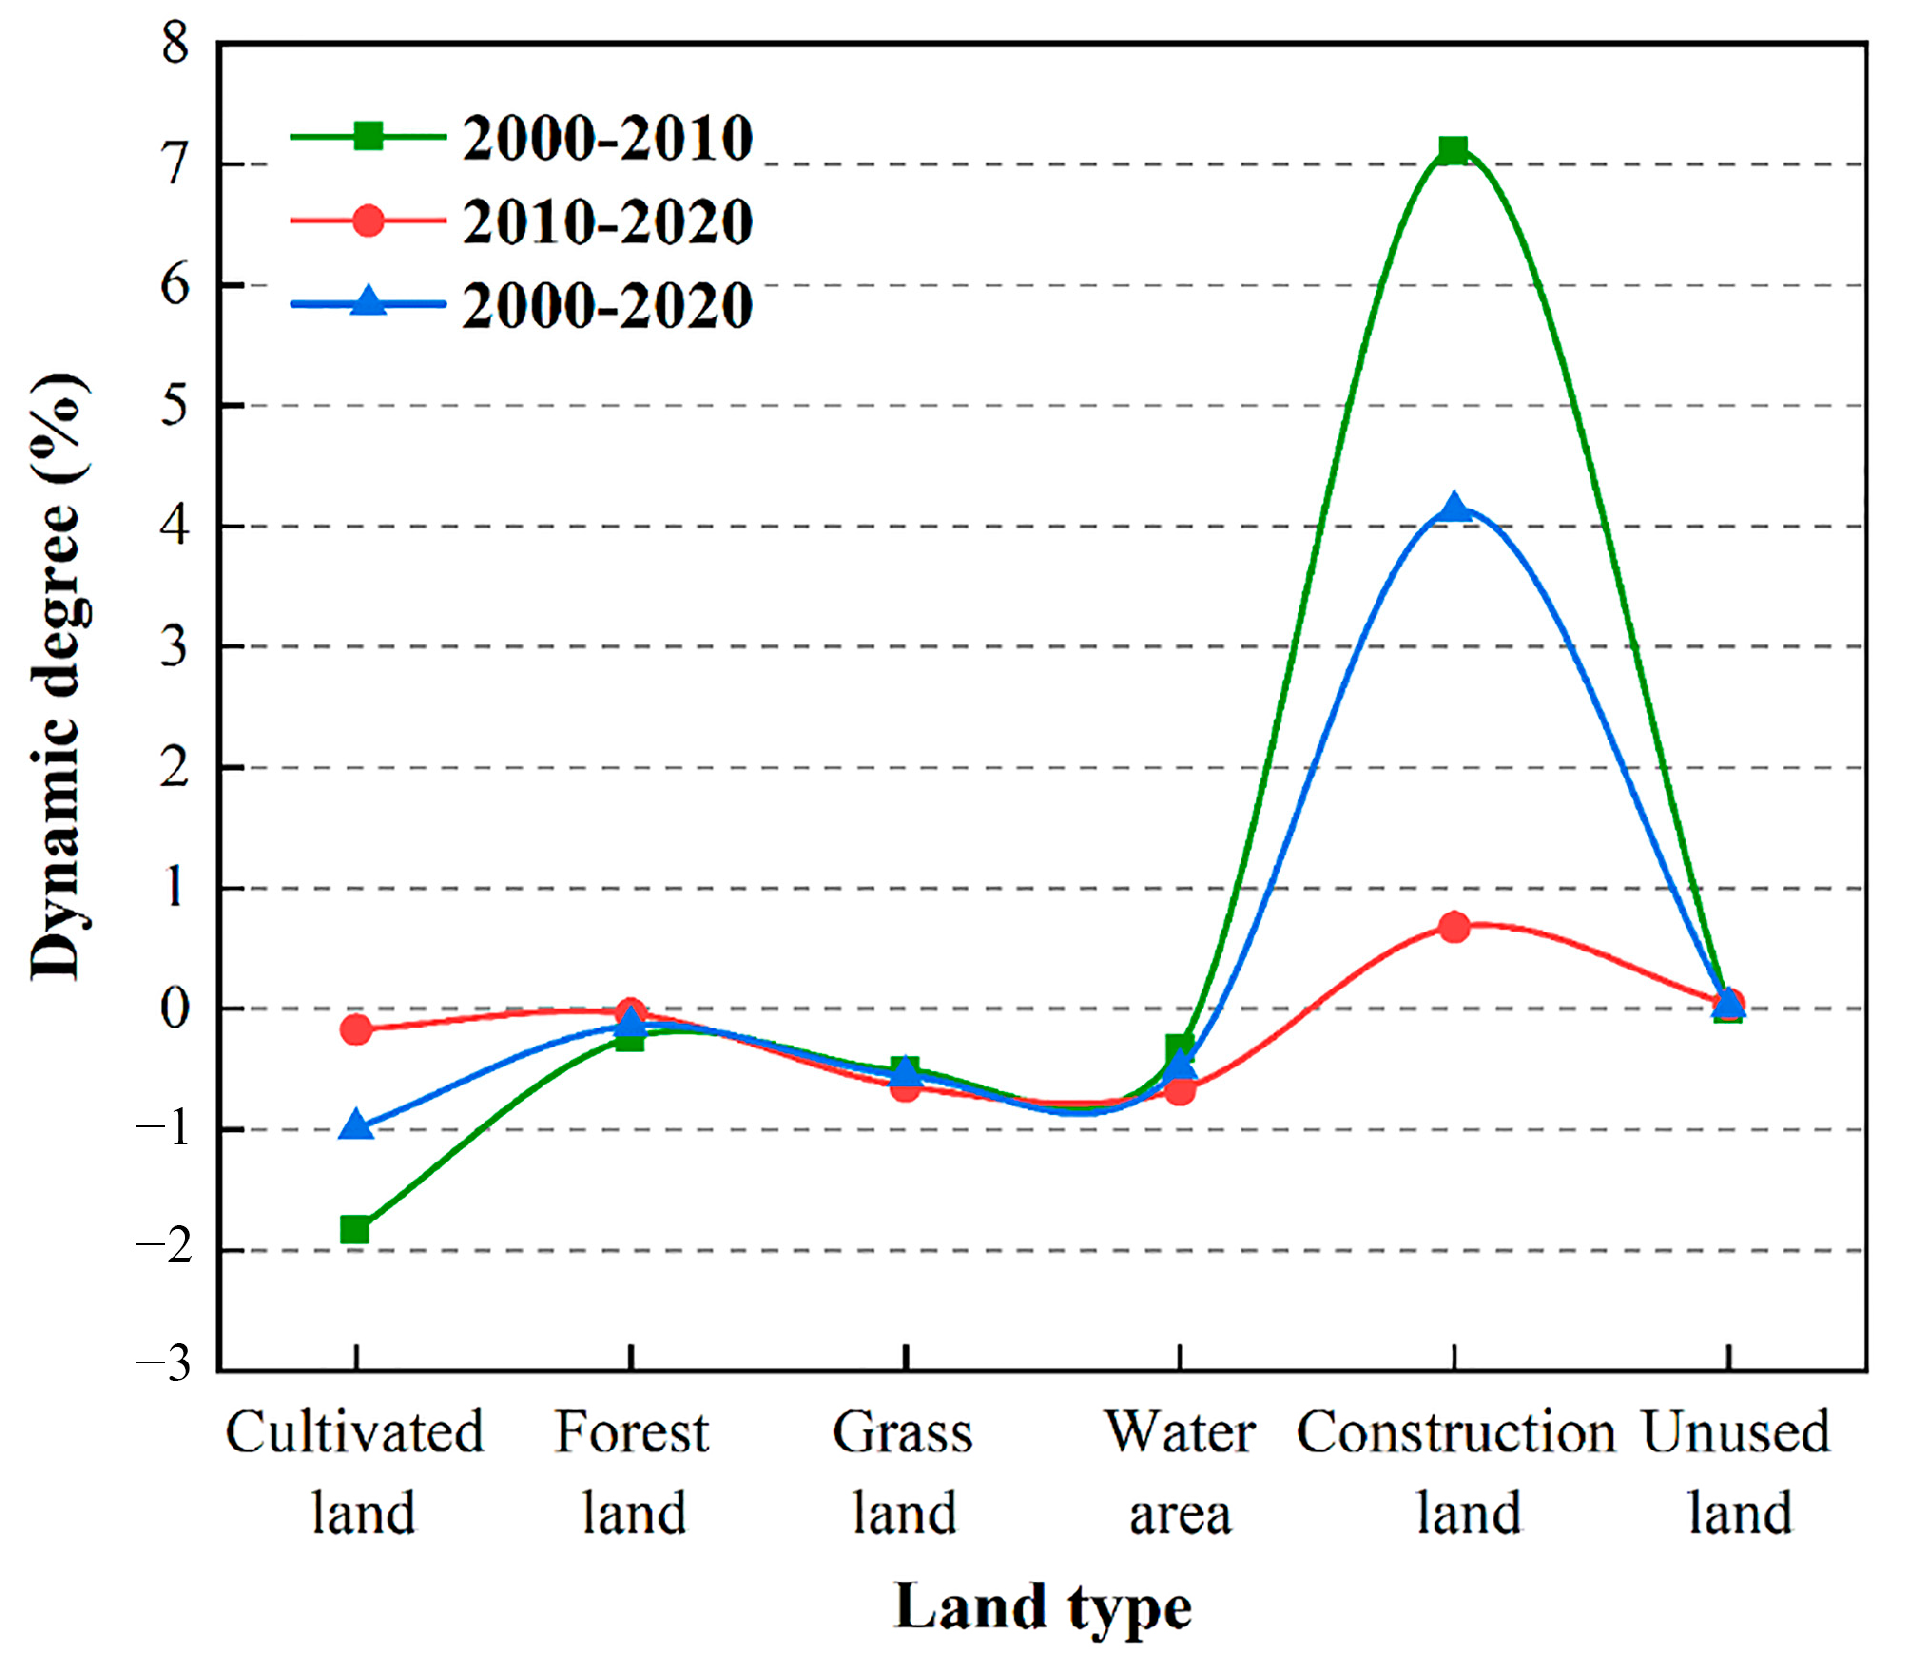
3.1.2. Land Use Dynamic Attitude

The land use dynamic attitude (Figure 5) was the highest for the years 2000 to 2010, showing significant urban expansion. The land use dynamic attitude of construction land was 7.11%, which changed the most. Cultivated land degradation decreased by −1.83%. The construction land size area increased, while the area of the other land types declined.
From 2010 to 2020, construction land in Guangzhou increased by 93.61 km2 (0.68% growth). The changes in land use were gentler, with decreases of −0.17%, −0.04%, −0.64%, and −0.67% in cultivated land, forest land, grassland, and water areas, respectively. Unused land increased slightly (0.01 km2) with a land use dynamic attitude of 0.04%. Guangzhou’s urban development showed moderate and steady growth, with a lower land use dynamic attitude than before.
In summary, woodland was the main land type in Guangzhou. Construction land rapidly expanded, primarily at the expense of the cultivated land and woodland. The most significant changes occurred during 2000–2010, followed by a decreased rate of change in 2010–2020. The construction land experienced the highest transformation, particularly impacting the cultivated land. The other land types saw minimal changes.

3.2. Identifying CS Characteristics

3.2.1. CS Characteristics in the Time Dimension

CS includes aboveground and subsurface vegetation carbon storage, soil carbon storage, and CS in dead organic matter (Table 3). The analysis of CS over time and spatial dimensions was based on land use change. The carbon module of the InVEST model required the input of land use type data, and a carbon density table was determined primarily by referring to literature and revising the formula. The changes were calculated using the InVEST model.
The results show that the CS in Guangzhou decreased by 4.11% from 2000 to 2020, with an average annual decrease of 8.33 × 10⁴ t. From 2000 to 2010, the total CS decreased by 3.77%, with an average annual decline of 15.27 × 10⁴ t. From 2010 to 2020, the total CS decreased by 0.36%, with an average annual decline of 1.39 × 10⁴ t. Upon entering the 21st century, urban construction in Guangzhou entered its peak, and the carbon loss reached its peak from 2000 to 2010. After 2010, the expansion of construction land was moderated, and the land change tended to be stable. During this period, the carbon loss in Guangzhou was alleviated. The change in carbon reserves in Guangzhou was drastic from 2000 to 2010. During this period, rapid economic growth and accelerated urbanization in Guangzhou also resulted in a strong demand for land development. After 2010, land development activities eased significantly.
In summary, carbon sinks are falling. From the time dimension perspective, the ecological spatial CS in Guangzhou is trending downward. With 2010 as the turning point, CS declined rapidly from 2000 to 2010 and slowed down significantly from 2010 to 2020. CS significantly changed in the area around the urban center during 2000–2010 and was relatively moderate during 2010–2020.

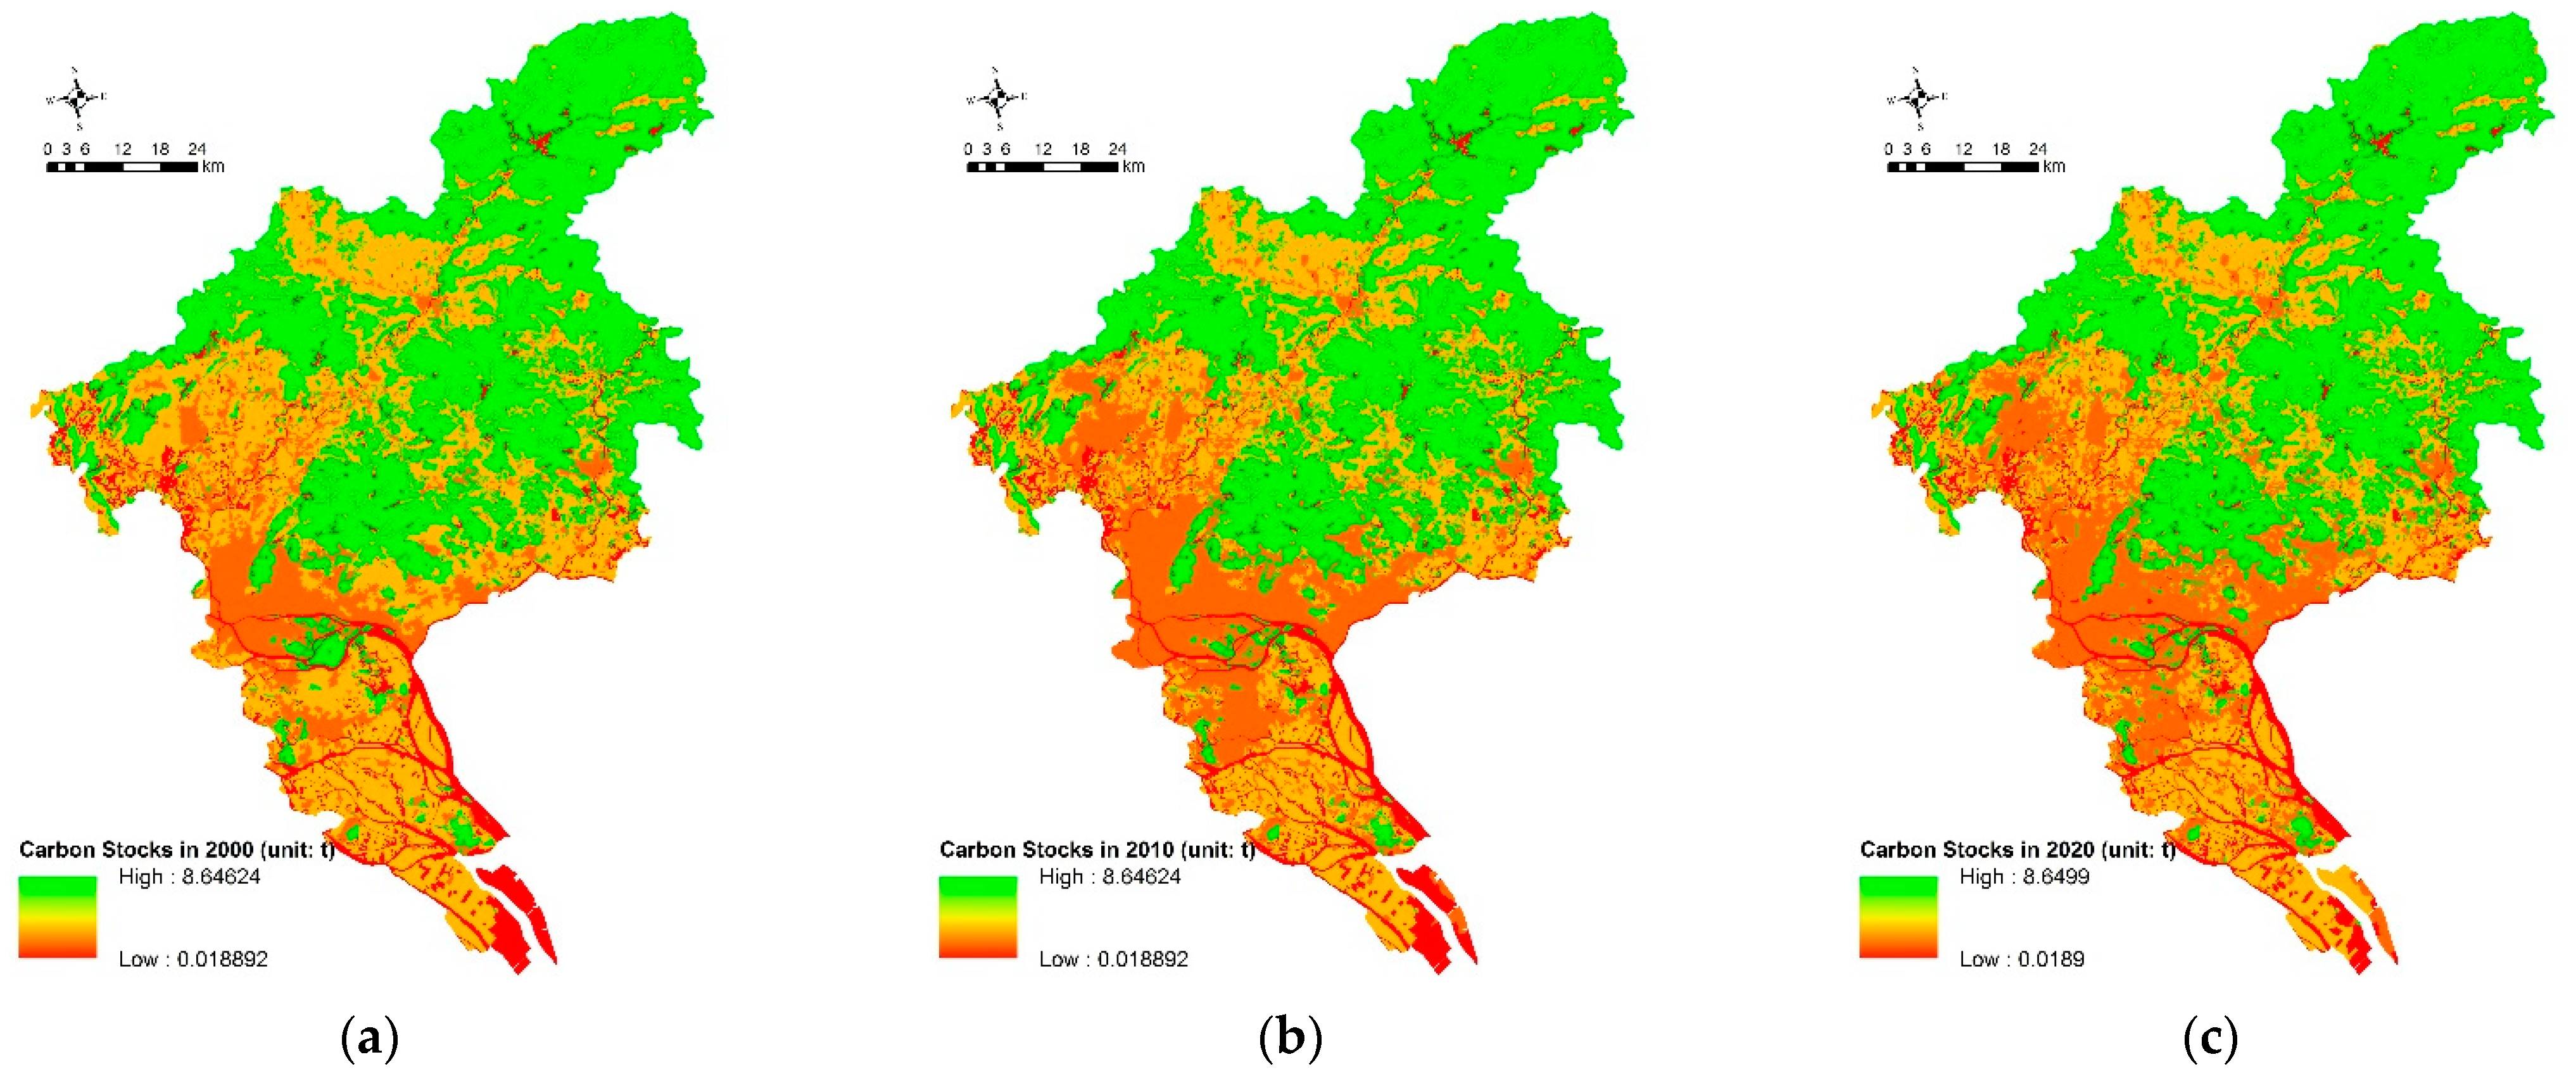
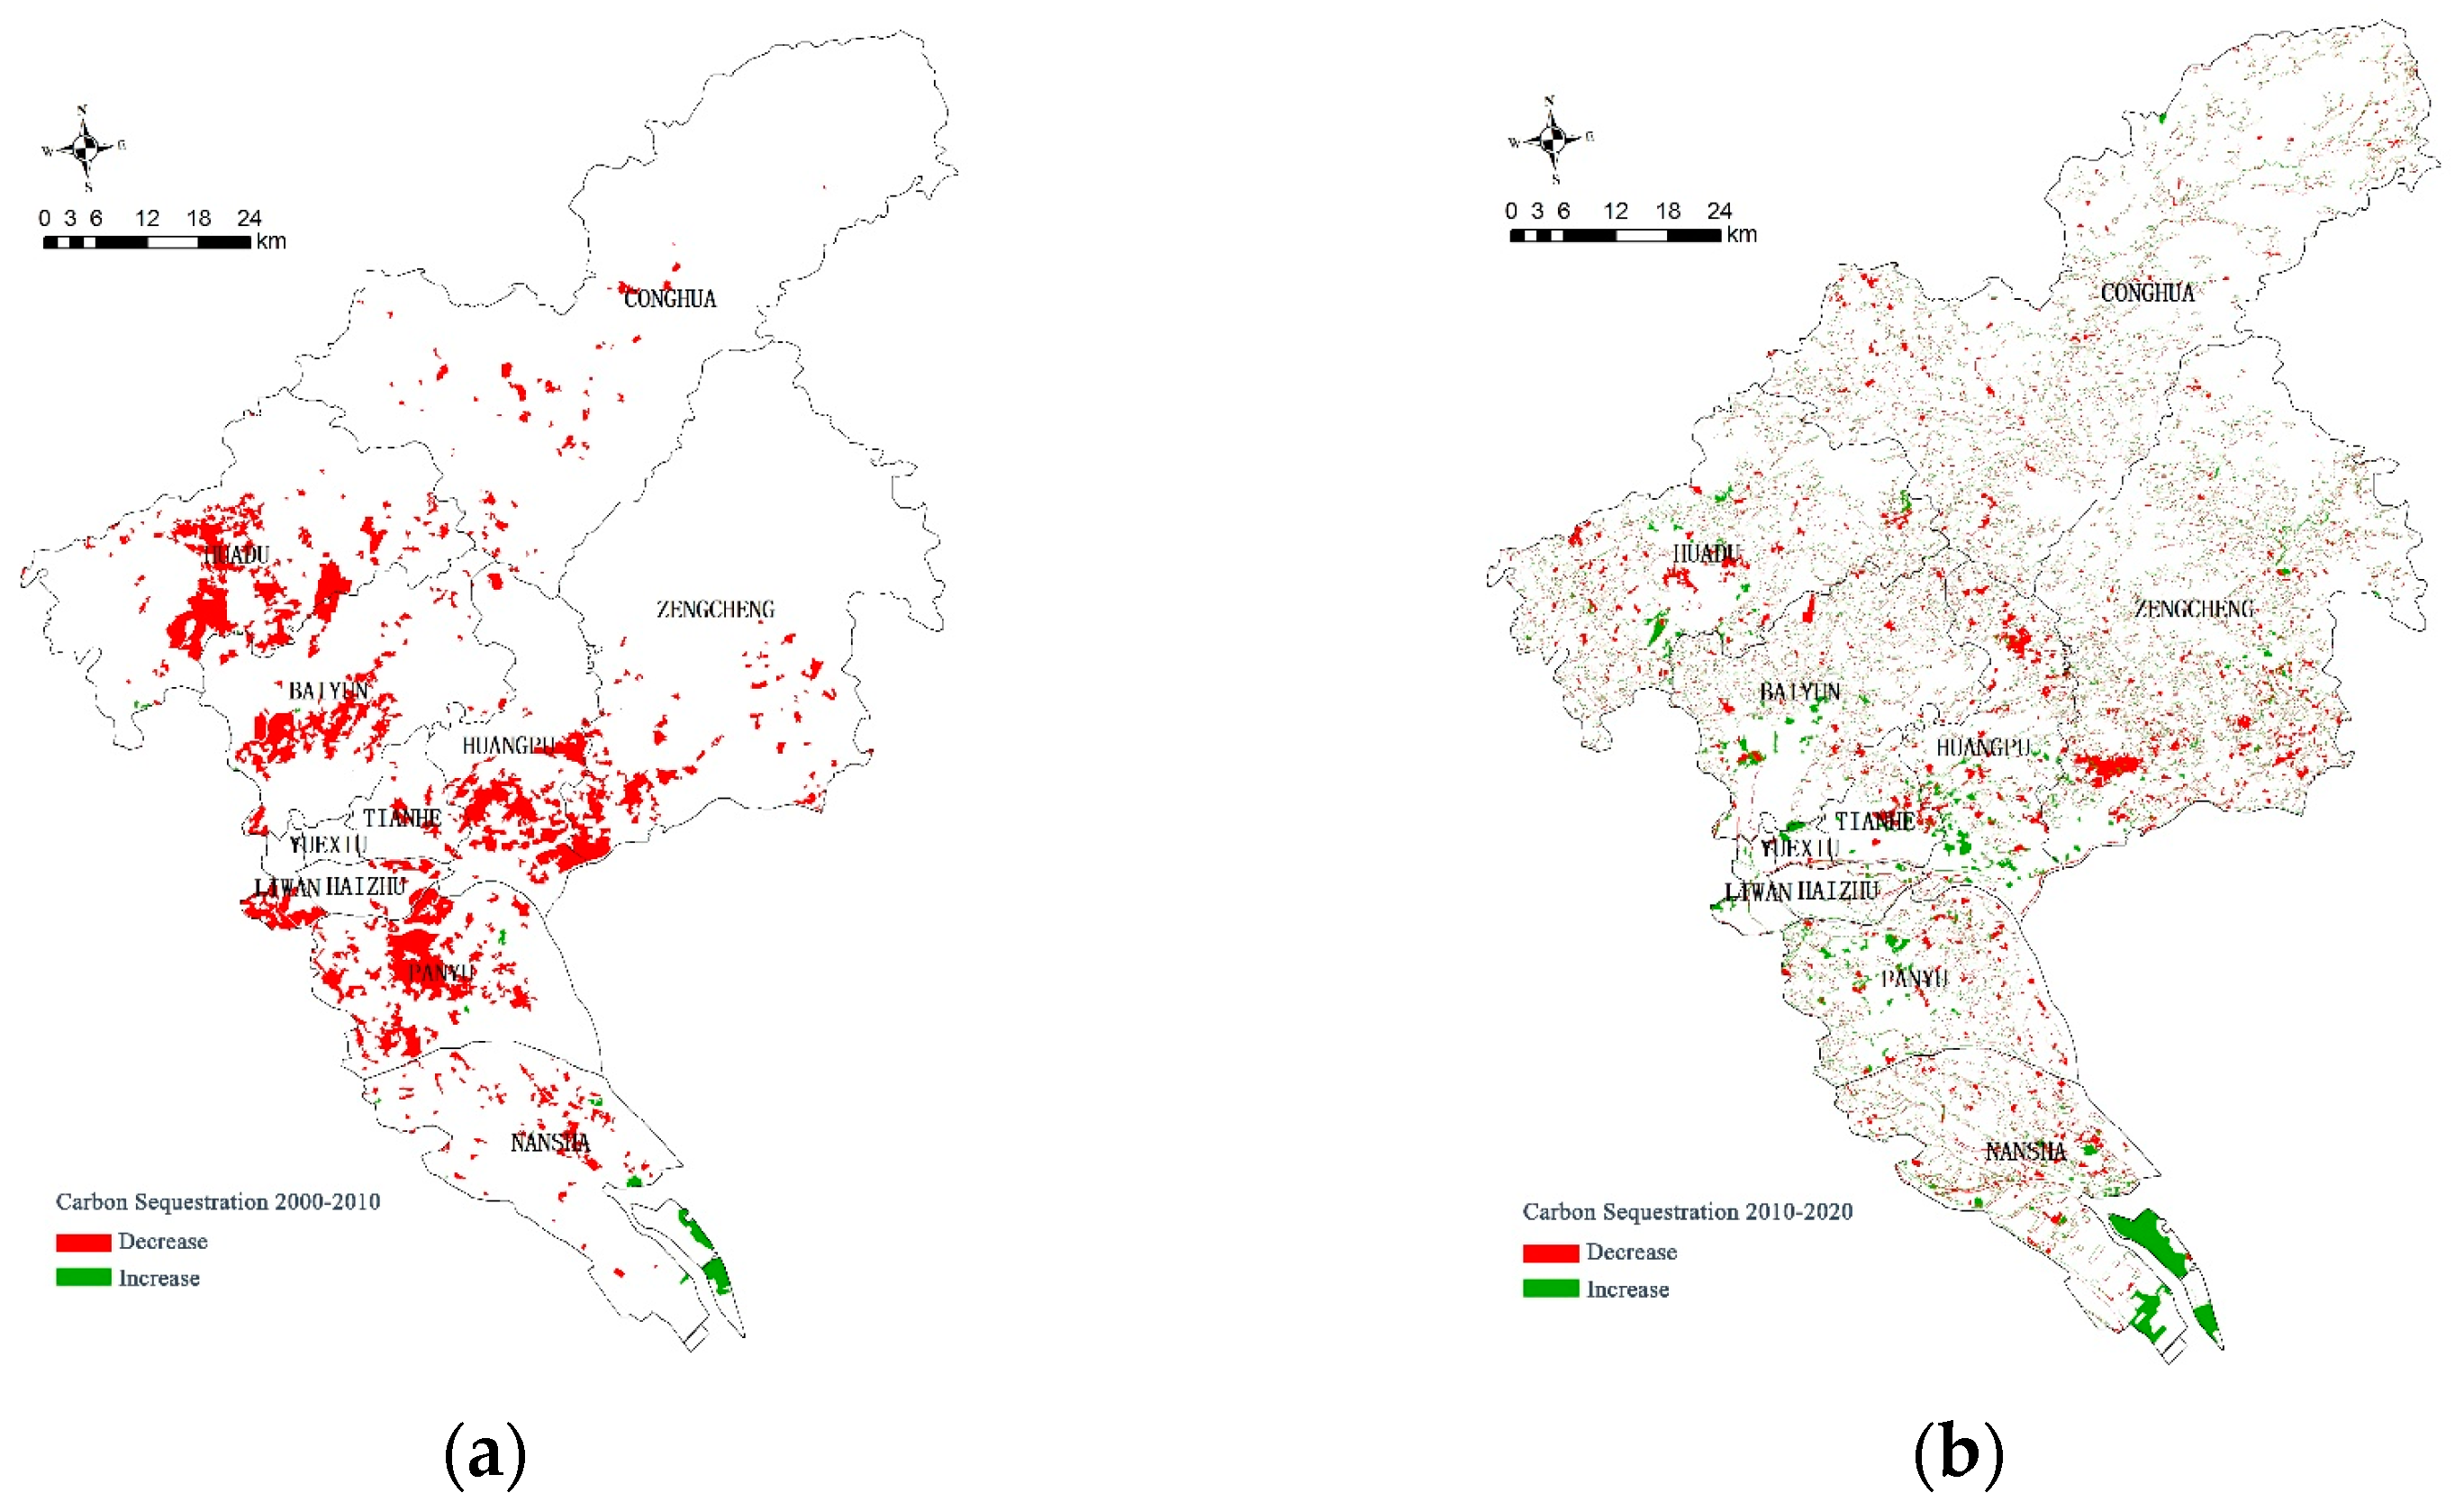
3.2.2. CS Characteristics in the Spatial Dimension

As illustrated in Figure 6, the largest carbon reserve in Guangzhou is forest land, which is mainly distributed in the northern and central eastern regions. The forest land coverage in these regions is high. Low values are mainly found in construction land, which is mainly distributed in urban areas along the lower reaches of the Pearl River and is greatly affected by urban construction activities. CS decreased significantly in the Huadu District, Baiyun District, Huangpu District, and Panyu District (Figure 7). Overall, the areas of CS decline are mainly distributed around the central urban areas, which is mainly due to the impact of urban expansion via human activities. Conversely, CS increased in the Nansha District, Zengcheng District, Huadu District, and Baiyun District, which was mainly due to the policy of afforestation and returning farmland to forest. However, the increased area was small.

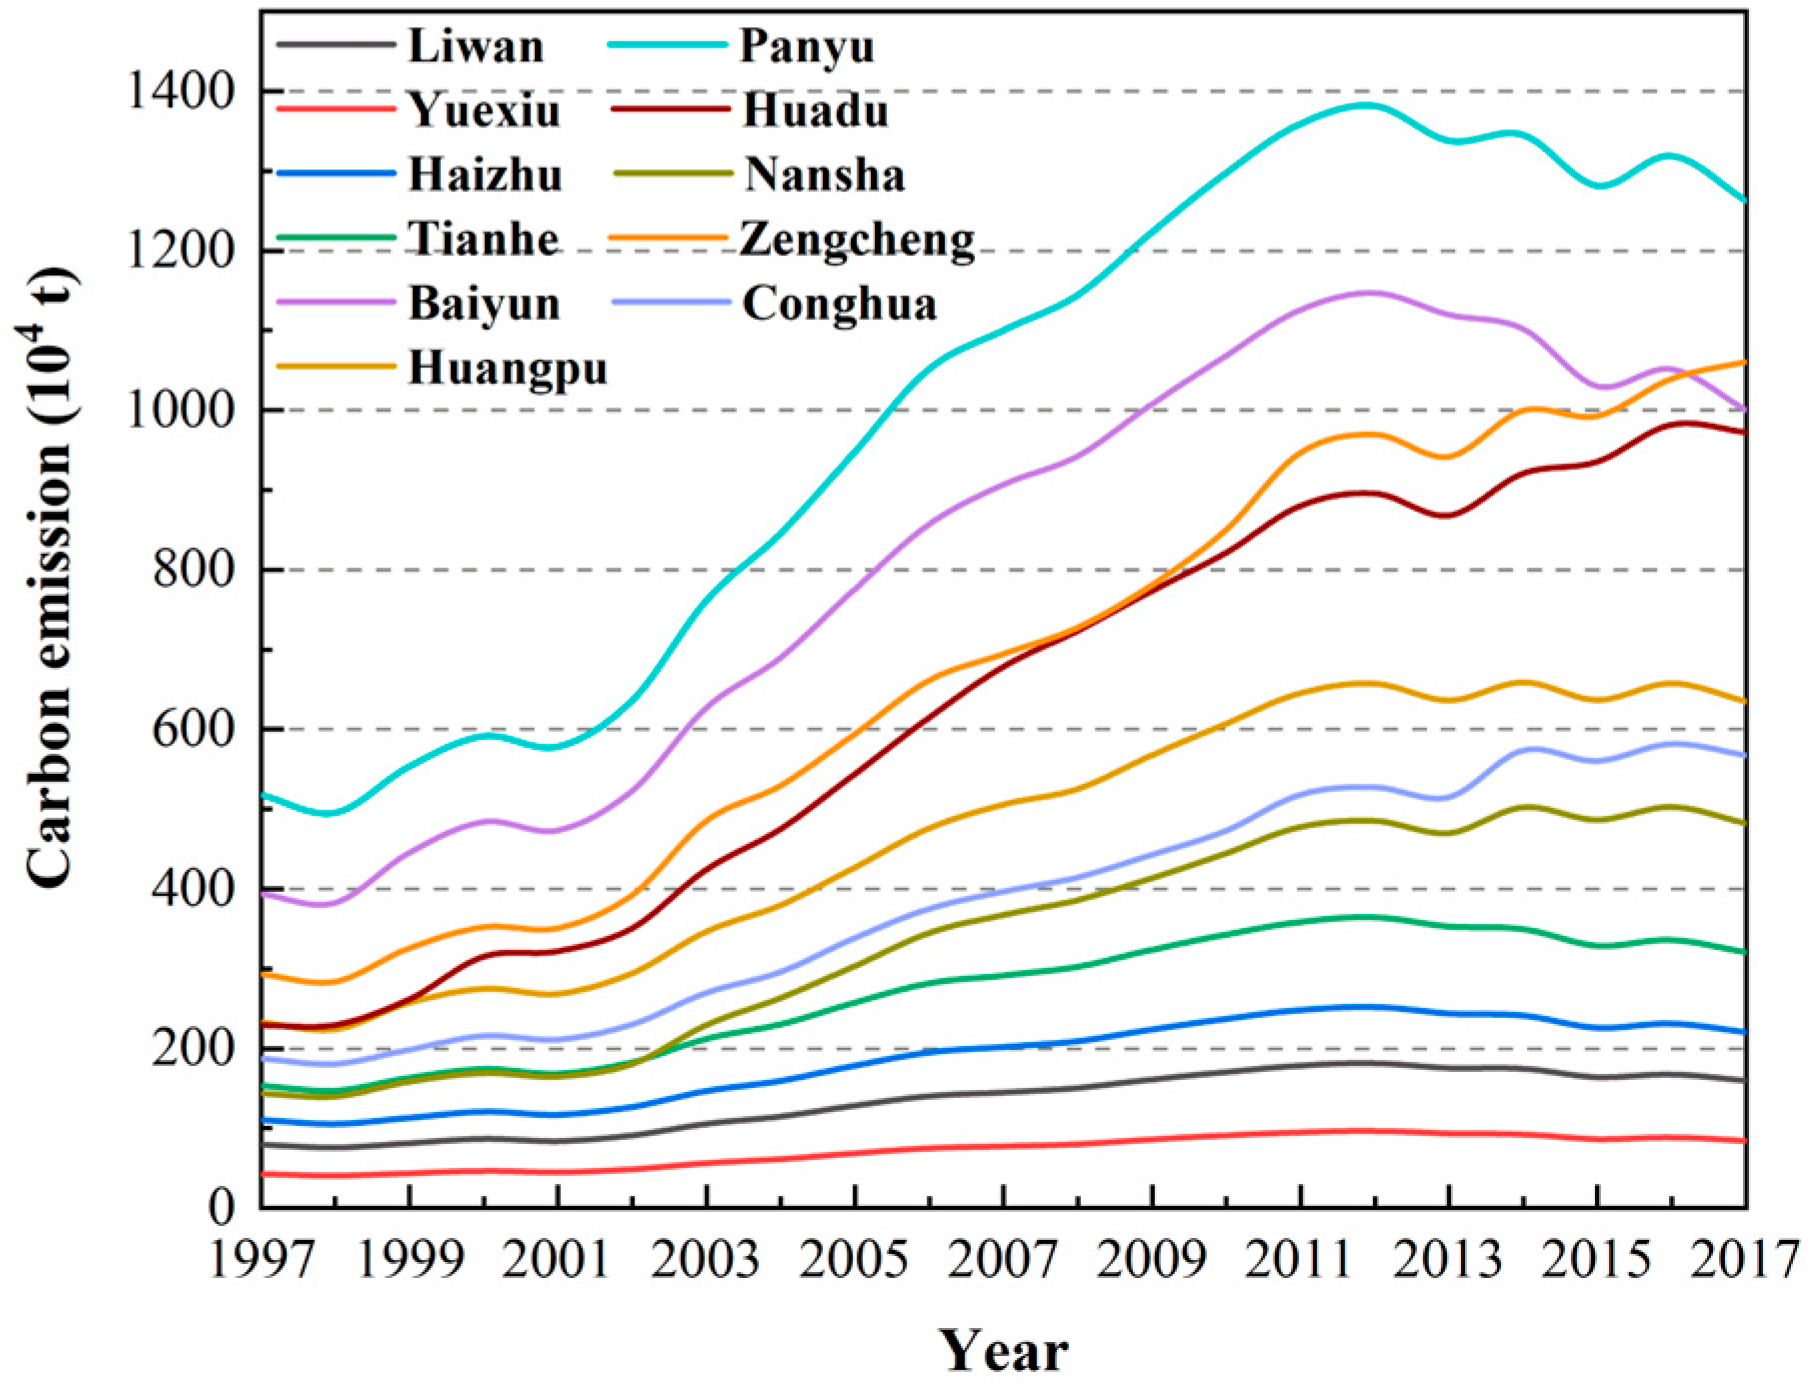
3.3. Identifying CE Characteristics

As illustrated in Figure 8, CE grew slowly before 2002 and rapidly from 2002 to 2011, then gradually fell from 2011 to 2016. Among the administrative regions, Guangzhou, Panyu, Baiyun, and Huangpu showed rapid increases. Moreover, the comprehensive energy consumption of the six industrial energy-consuming industries (the electricity and heat generation industry, the metal and mineral products industry, the petroleum and coal processing industry, the chemical raw material manufacturing industry, the non-ferrous metal industry, and the ferrous metal industry) is still as high as 5,827,700 tons of standard coal, accounting for 75.5% of the CEs of approximately 14,317,000 tons. CEs increased by 68.1 percent in 10 years, and CO2 emissions from the construction sector have continued to grow, overtaking the industrial sector as the city’s largest CO2 emitter.

3.4. Reasons behind CS and CE Characteristics

According to these findings, we hypothesized that certain crucial reasons have an impact on CS and CE. These elements include the following: (1) variations in urban planning during different phases, and (2) inadequate political guidance concerning urban spaces.
Firstly, discrepancies in urban planning during different developmental stages have caused significant disparities between the population density and the distribution of green spaces in urban regions. In the past, Guangzhou experienced substantial benefits from the implementation of reform and opening-up policies, leading to a rapid increase in construction land [38,39]. Consequently, some green spaces were replaced, and older urban areas experienced swift development. Subsequently, the population density escalated quickly, while land availability gradually diminished. Consequently, there was insufficient space to establish expansive and comprehensive urban areas. As the city expanded and positioned itself as an industrial hub, urban plans began incorporating areas that were primarily designated for industrial production, commercial use, and housing. This planning approach has likely contributed to spatial inequality in terms of community satisfaction and engagement spaces.
Secondly, there has been a lack of emphasis on the development of green spaces as a consequence of inadequate political leadership. Existing research indicates that in the context of global competition, capital cities actively prioritize the provision of green spaces to enhance their urban images [40]. However, cities tend to place greater importance on socioeconomic development, while the construction of green spaces receives comparatively less attention. When faced with conflicts related to land use, preference is given to land-use functions that generate economic benefits. Additionally, there is a low rate of policy implementation, further exacerbating the issue.

4. Demand Priority Evaluation of Green Spaces

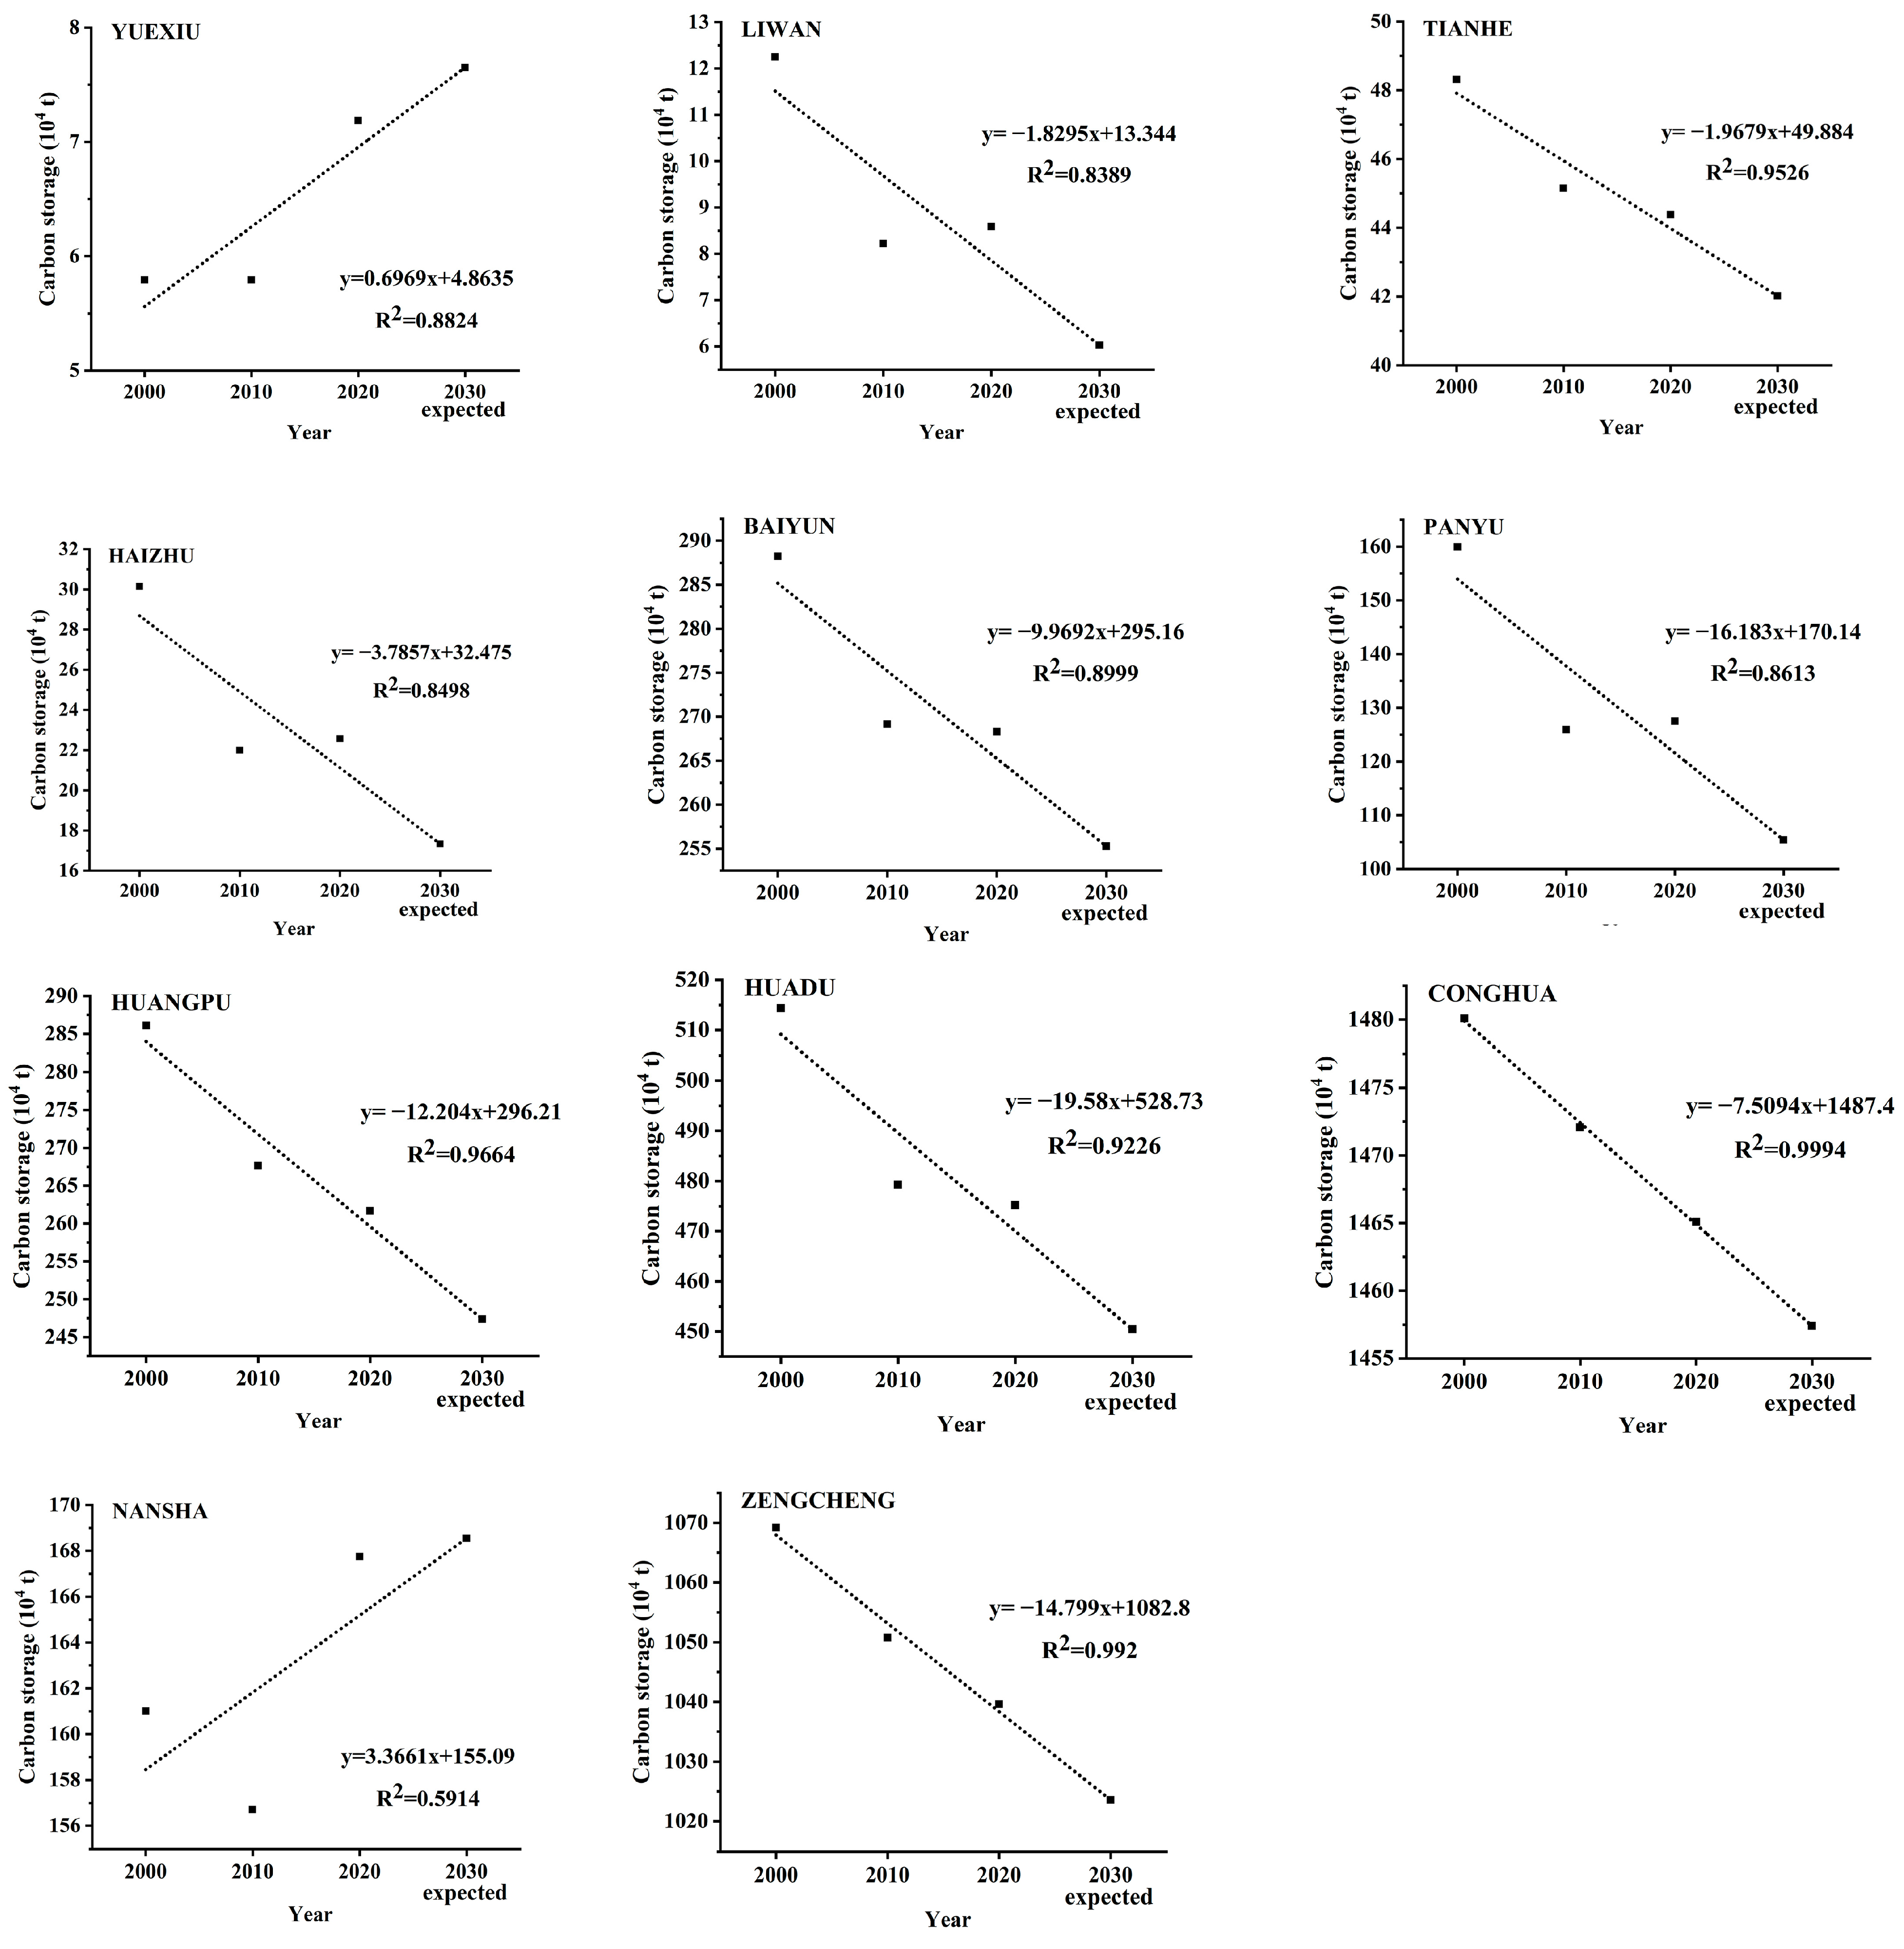
4.1. Prediction of Carbon Storage

The year 2030 is expected to be the carbon emission peak in China; therefore, the line-fitting method was used to predict CS in 2030. The results show that the CS in most districts has been declining from 2000 to 2020 and is expected to further decline to a lower level in 2030 (Figure 9). The Liwan District has the largest rate of decline, followed by the Haizhu District and the Panyu District. As the largest carbon sinks in Guangzhou, the Conghua District and the Zengcheng District appear to be in an insignificant downward trend. Starting with the smallest CS among the 11 districts, the Yuexiu District has been increasing its CS at a slow rate.

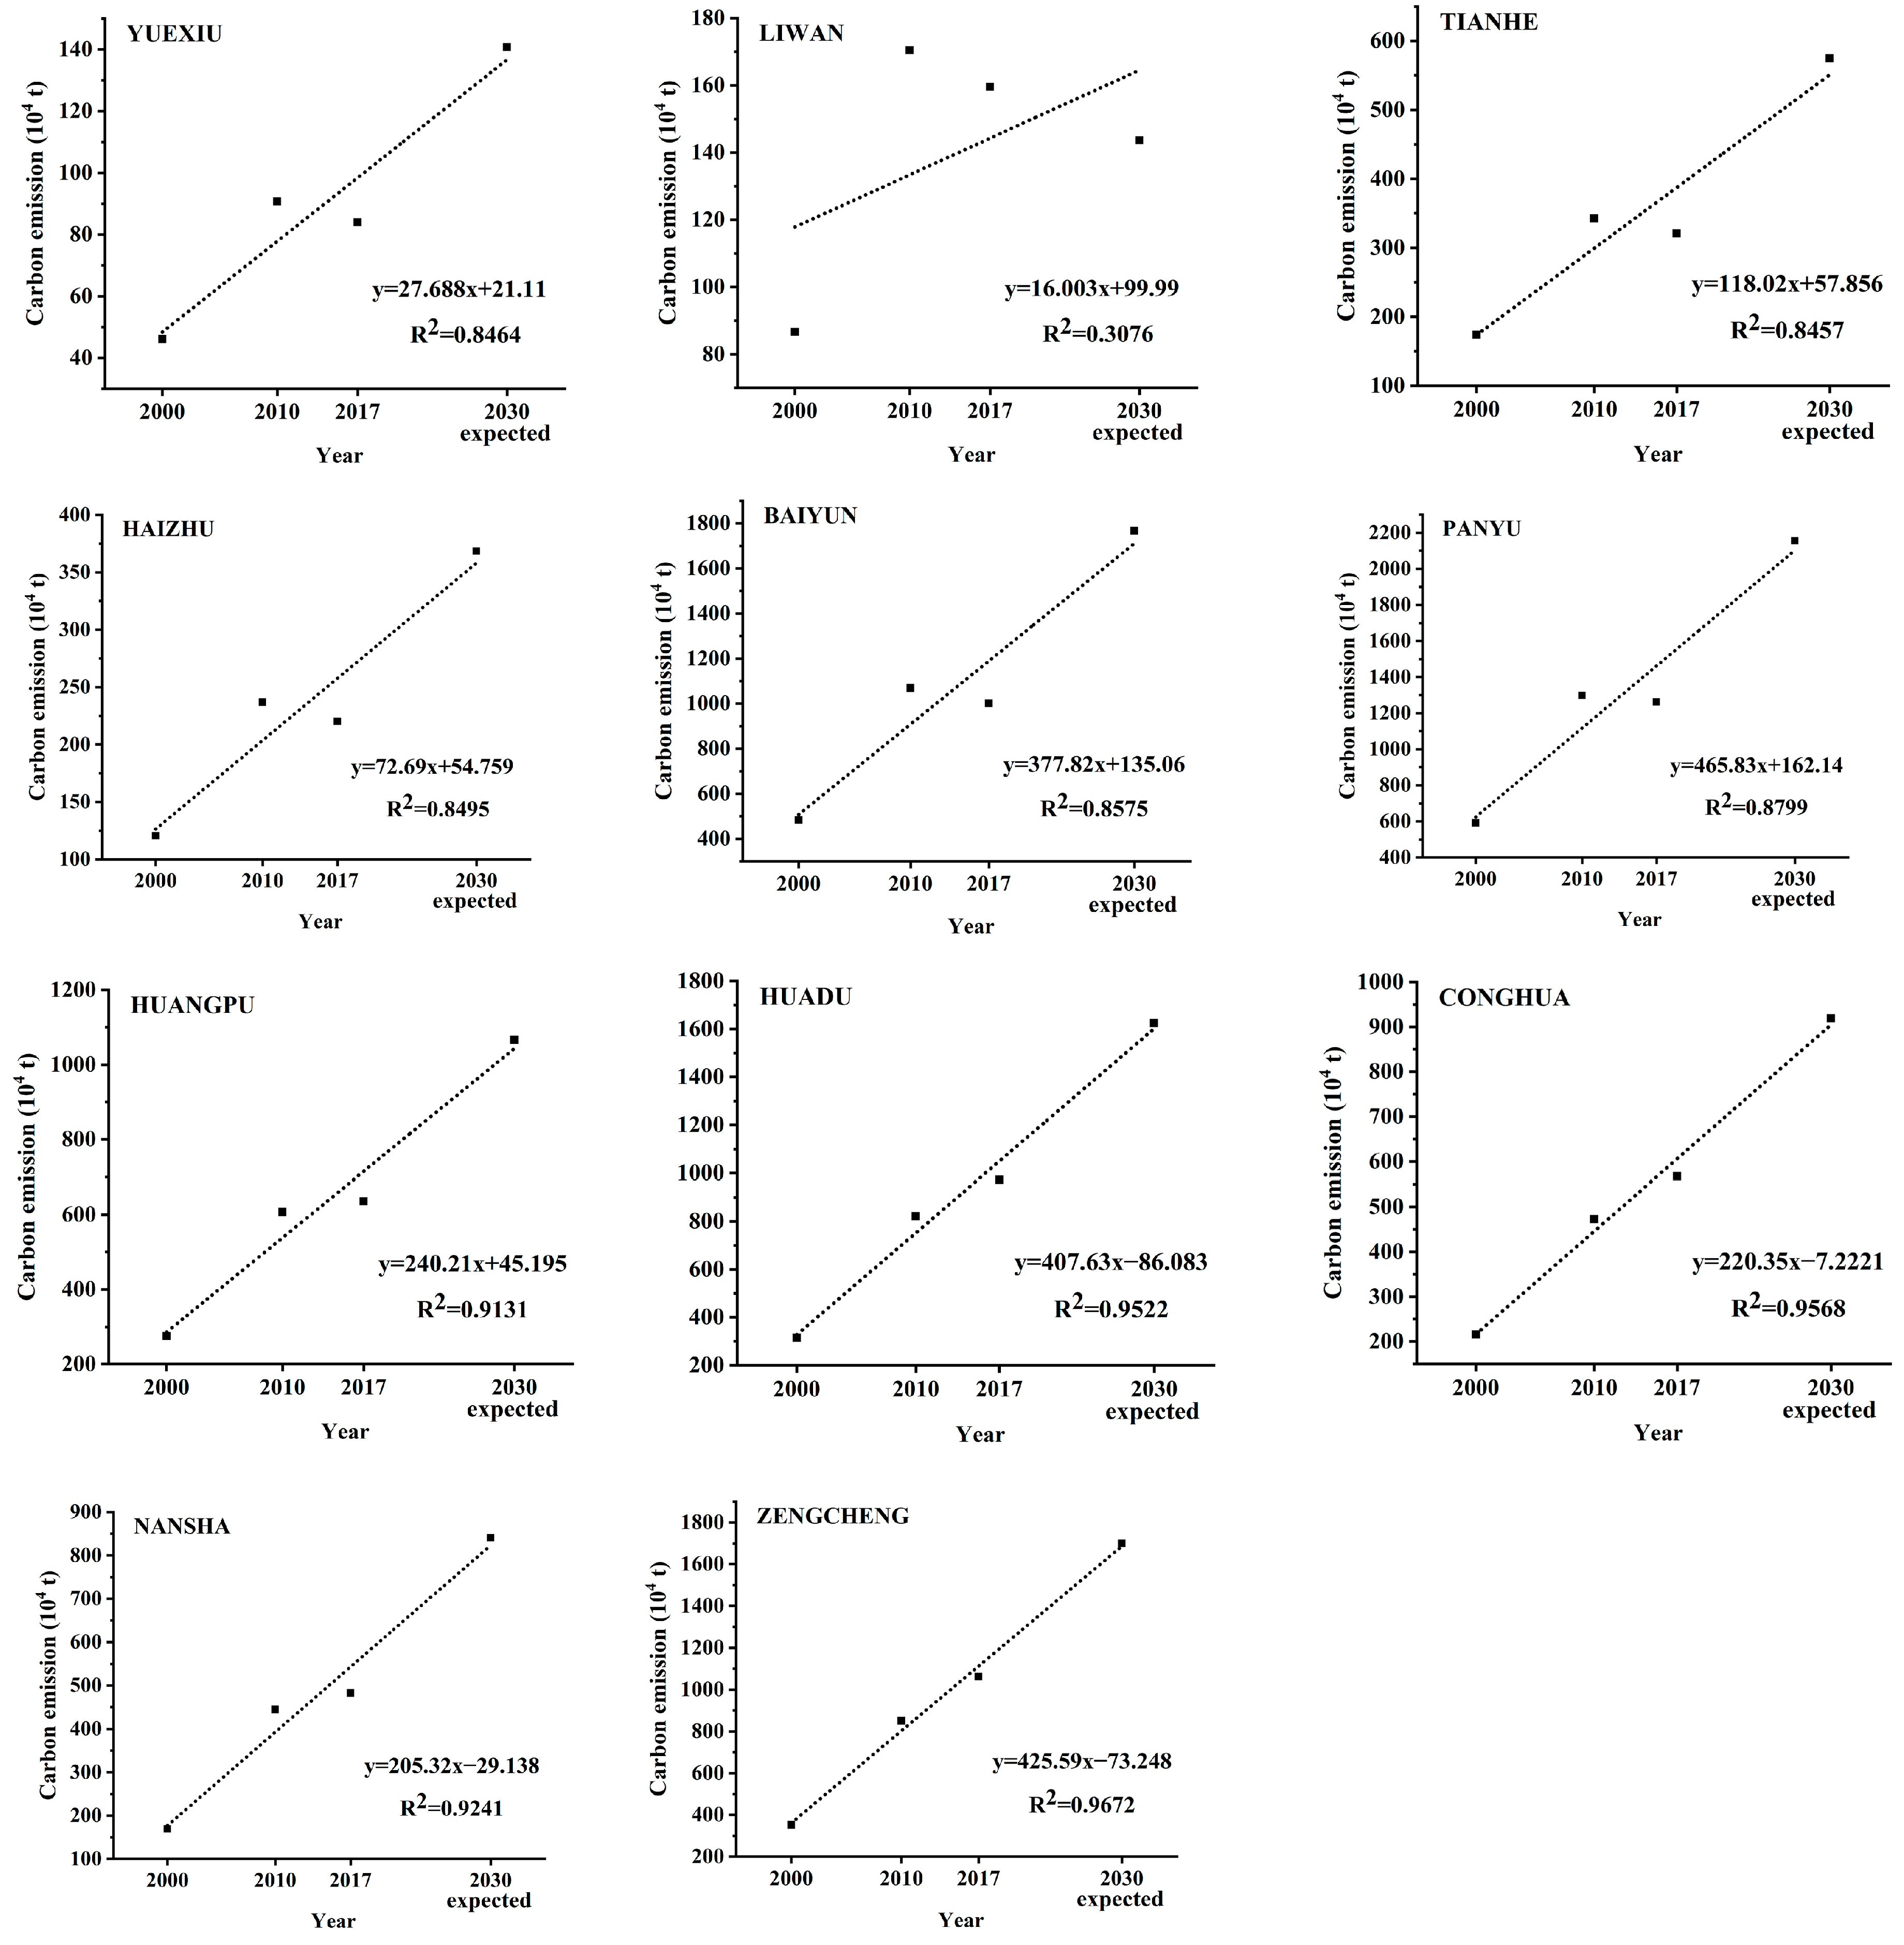
4.2. Prediction Result Analysis of Carbon Emissions

As the year 2030 will be the CE peak in China, the prediction of CEs was used for the growth rate method. The line fitting method is improved and designed to predict CS. However, as the electricity consumption is stabilized and the CEs from power plants are controlled, the effect of CS reduction will become increasingly significant. According to the CS prediction results, the CEs in most parts of Guangzhou will reach approximately double the number of the current statistics in the year 2030 (Figure 10).

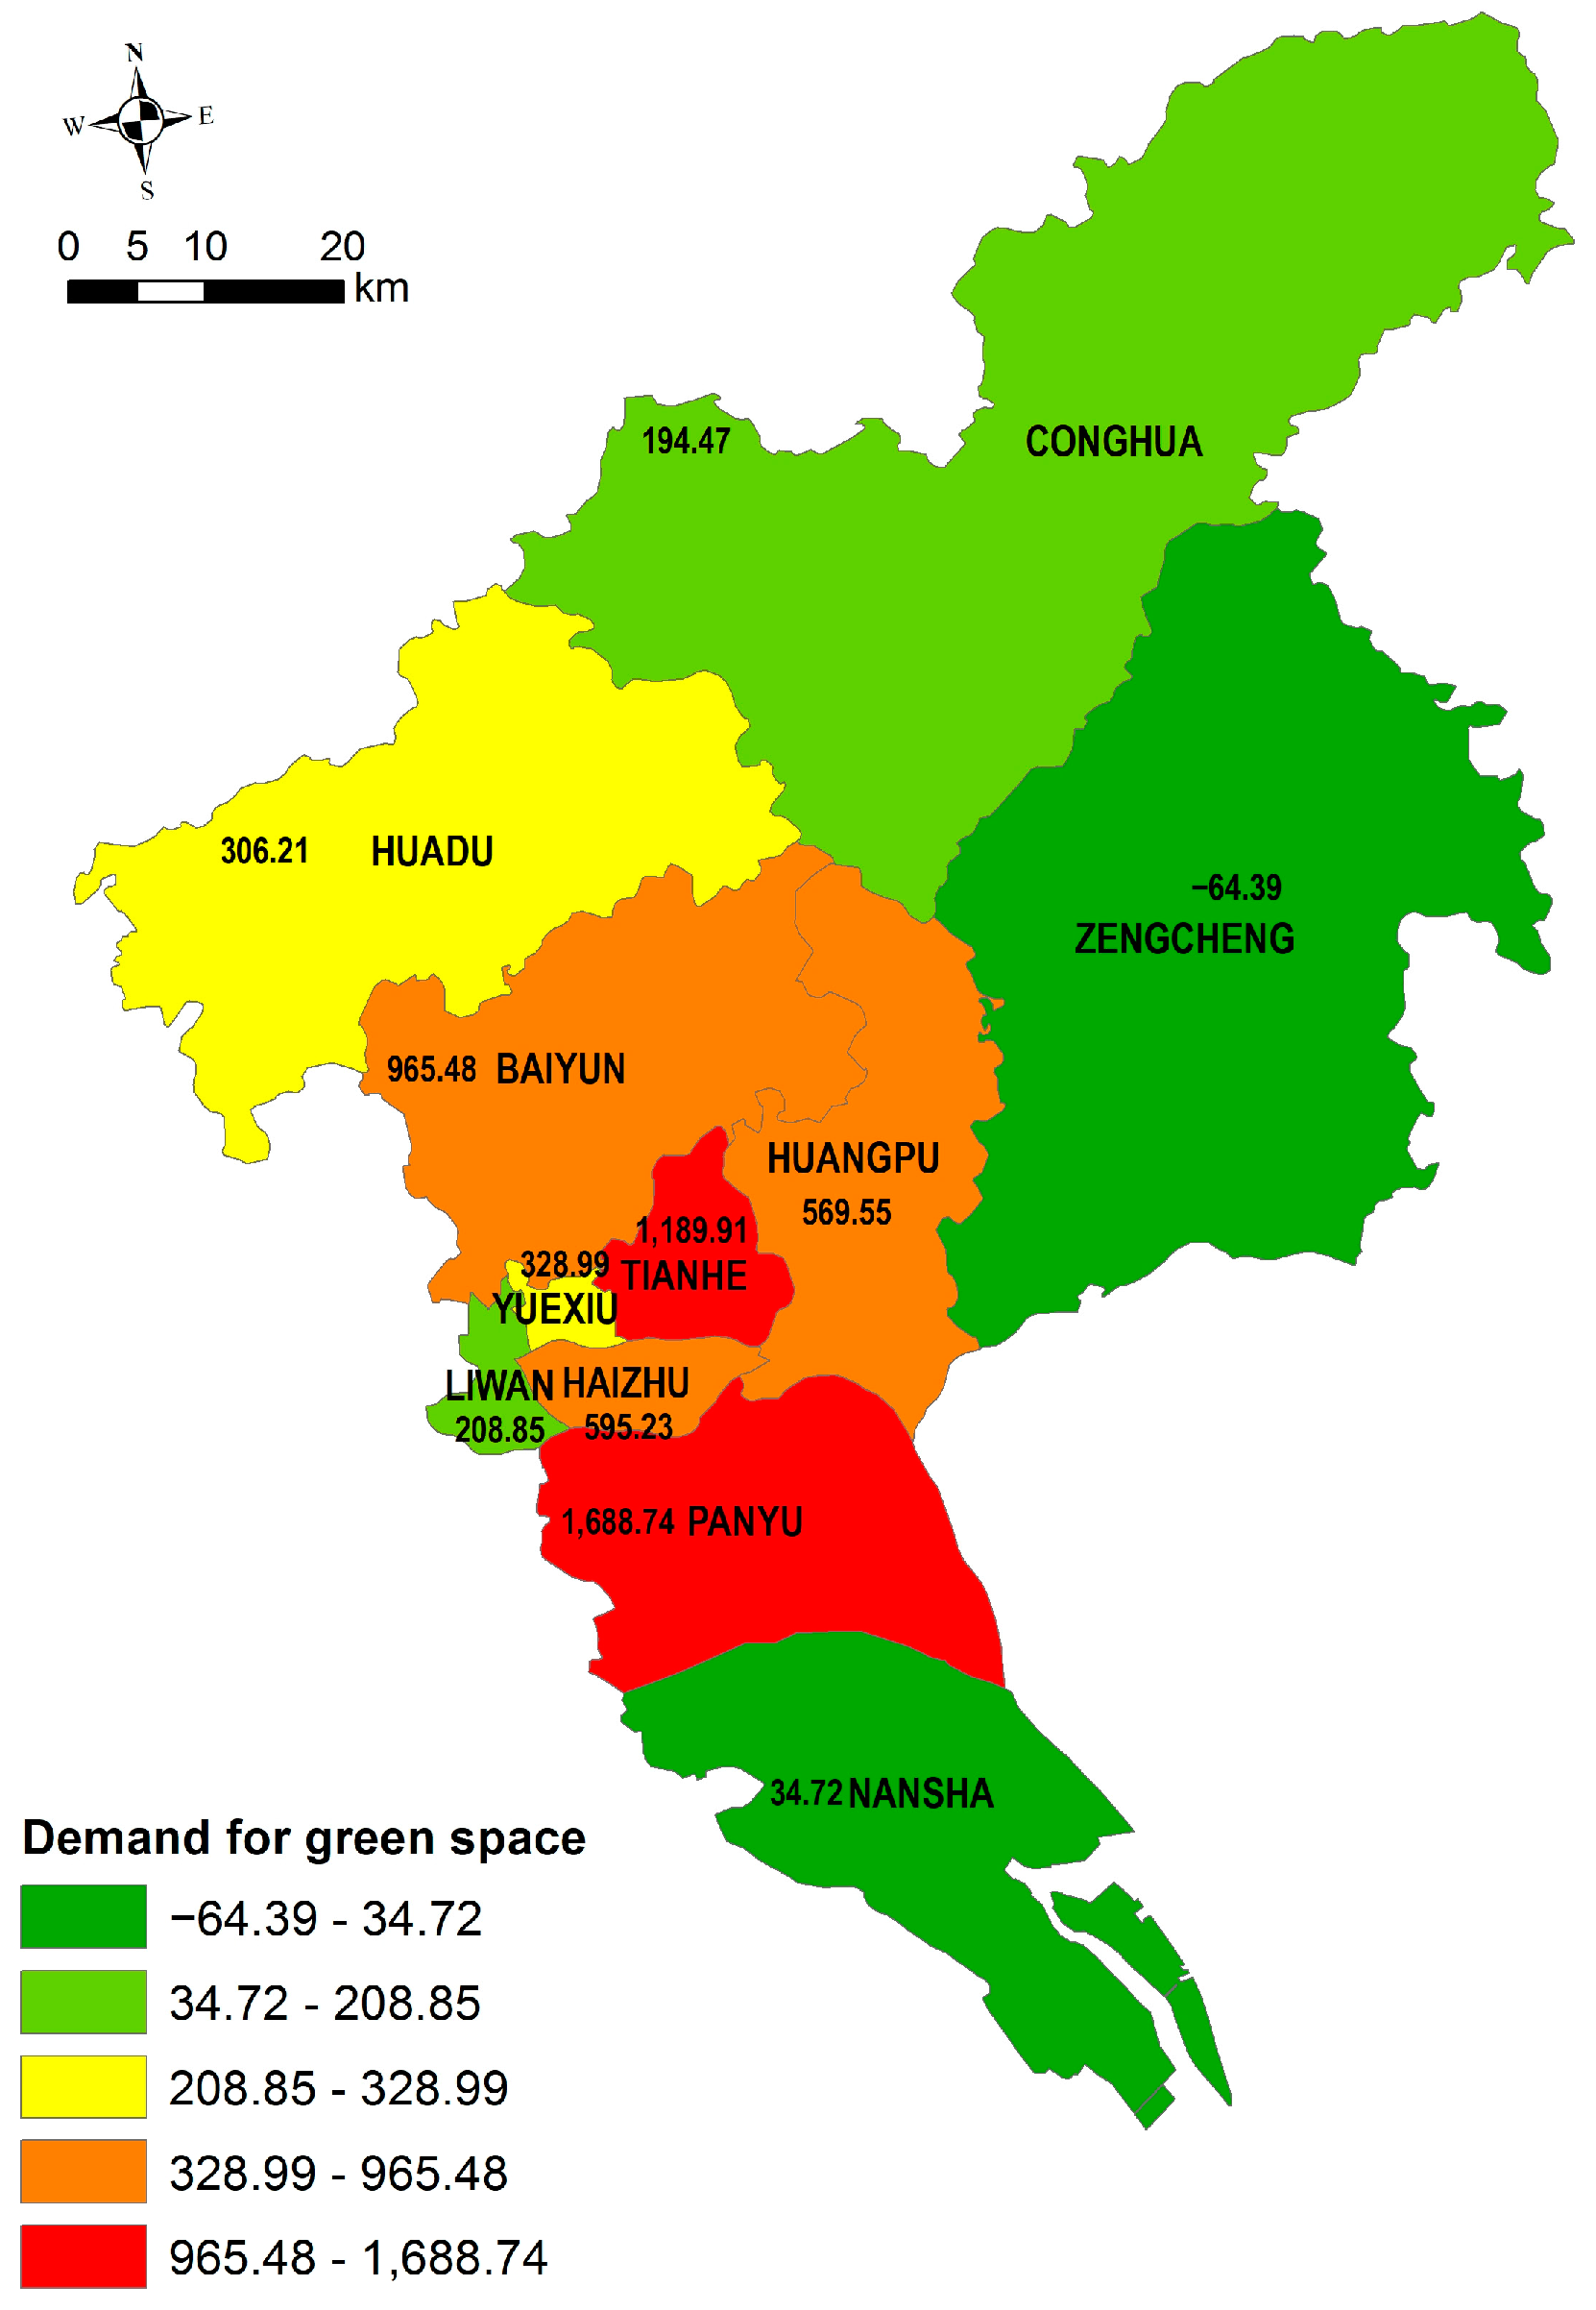
4.3. Demand Priority of Green Space

CS and CE were strongly linked to green space in the above analysis, but they were not the only two factors used to evaluate the green space demand in different districts. Returning to the literature review, the scholars’ understanding of green space demand is as follows: (1) Green space demand refers to the consumption of ecosystem products and services by humans within a specific timeframe [41]. (2) Green space demand encompasses individual preferences for specific attributes of ecosystem services, such as location, time, and opportunity cost [42]. (3) Green space demand represents the consumption or expected acquisition of ecosystem services by society [43]. Understanding and quantifying ecosystem services and their perceptions is crucial for effective green space management. The distribution of green spaces and their relation to urban development and economic factors influence demand. Analyzing these factors informs better management strategies [44,45,46,47]. In this study, we adopted the third perspective, considering both currently obtained and expected ecosystem services. To express the green space demand in different districts, we considered factors such as the gap between carbon emissions and storage, population density, and average land GDP. The gap between carbon emission and storage reflects the human consumption of green spaces, while a higher population density indicates a greater number of demands for green space services. However, population densities and average GDPs may fluctuate significantly in highly developed regions. To address this, we applied a logarithmic transformation to dampen extreme fluctuations without compromising the overall distribution trend. The formula used for this calculation is as follows:
X = Xa × lg(Xb) × lg(Xc)
where X is the demand for green space, Xa is the gap between carbon emissions and carbon storage (104 t), Xb is the population density (1000 people per square kilometer), and Xc represents the GDP per capita (100 million dollars).
The results (Table 4 and Figure 11) show that the Panyu and Tianhe Districts exhibited the top demand priority for green space construction. In this sense, the supply of green spaces must be planned to prioritize these two districts. Therefore, it is necessary to increase small green spaces as much as possible to relieve the pressure on green spaces and meet the basic requirements of residents via policymakers.

4.4. Implementation Difficulty

The data obtained from the local government suggests that the reduction in urban green spaces in Panyu and Tianhe can be partly attributed to the rapid appreciation of land value. In the study area, the residential and commercial land use yields greater financial rewards for the government, who are the landowners, compared to urban green spaces. Consequently, the government tends to allocate green spaces for residential and commercial purposes. Another significant factor is the densification of existing developed areas. Consequently, our findings recommend focusing on enhancing land use practices and creating open spaces with high utilization rates. Additionally, exploring opportunities to increase green spaces, such as green roofs or repurposing transportation structures, would improve the connectivity of green spaces and enhance equity in terms of access to these spaces.

5. Conclusions

Climate change due to carbon emissions is a global issue exacerbated by modernization and urbanization. Limited land space in Guangzhou hinders urban development and necessitates research on green space demand. This study focused on carbon neutrality, as green spaces play a crucial role in absorbing emissions. Our work fills a gap in evaluating the carbon perspective of green space demand and proposes a scheme based on population and economic development.
Based on the above analysis, we addressed the following research questions: (1) During 2000–2010, CS experienced a significant decline, particularly in central urban areas, due to human-driven urban expansion. In contrast, rural regions saw an increase in carbon storage due to afforestation and the conversion of farmland into forests. (2) Carbon emissions in Guangzhou grew slowly before 2002, rapidly from 2002 to 2011, then gradually declined until 2016. Panyu, Baiyun, and Huangpu saw notable and rapid increases in emissions. (3) To quantify green space demand in different districts, factors such as CEs, storage gap, population density, and average land GDP need to be considered. In highly developed regions, population density and average GDP may fluctuate significantly. To address this, logarithmic techniques can be used in statistical analyses to reduce the impact of extreme fluctuations and capture the overall distribution trend for further analysis. Our main conclusions are as follows: (1) A demand priority evaluation framework for green space that, considering carbon neutrality, should be developed to assess spatial disparities between supply and demand. (2) Insufficient supply was observed in the central area, characterized by high land value in the city. This study’s main contribution is developing a demand priority evaluation of green space from the perspective of carbon neutrality by using Guangzhou as an example. However, limited financial resources in developing cities necessitate prioritizing green space demands. Future research should gather data from different time points to improve the accuracy and investigate the decline and degradation of green spaces from various ecosystem service perspectives, enhancing our understanding of effective green space conservation in rapidly urbanizing developing cities.

Author Contributions

Methodology, K.F.; Validation, K.F. and S.X.; Formal analysis, L.X. and S.X.; Investigation, L.X.; Data curation, K.F. and S.X.; Writing—original draft, K.F.; Writing—review & editing, Y.H.; Project administration, Y.H. All authors have read and agreed to the published version of the manuscript.

Funding

This research was funded by Guangzhou “14th Five-Year Plan” for the development of philosophy and social sciences program in the year 2022 grant number 2022GZGJ195.

Institutional Review Board Statement

Not applicable.

Informed Consent Statement

Not applicable.

Data Availability Statement

Data was obtained from Chinese Academy of Science’s Data Center for Resources and Environmental Sciences (https://www.resdc.cn/) and Guangzhou Statistics Bureau (http://tjj.gz.gov.cn/stats_newtjyw/zyxz/tjnjdzzz/).

Conflicts of Interest

The authors declare no conflict of interest.

References

  1. Ahmadi, P.; Rosen, M.A.; Dincer, I. Greenhouse Gas Emission and Exergo-Environmental Analyses of a Trigeneration Energy System. Int. J. Greenh. Gas Control 2011, 5, 1540–1549. [Google Scholar] [CrossRef]
  2. Pathak, H. Greenhouse Gas Emissions and Mitigation in Agriculture. Greenh. Gases Sci. Technol. 2015, 5, 357–358. [Google Scholar] [CrossRef]
  3. Wolf, S.; Eugster, W.; Potvin, C.; Turner, B.L.; Buchmann, N. Carbon Sequestration Potential of Tropical Pasture Compared with Afforestation in Panama. Glob. Chang. Biol. 2011, 17, 2763–2780. [Google Scholar] [CrossRef]
  4. Sun, W.; Liu, X. Review on carbon storage estimation of forest ecosystem and applications in China. For. Ecosyst. 2020, 7, 4. [Google Scholar] [CrossRef] [Green Version]
  5. Liang, Y.; Hashimoto, S.; Liu, L. Integrated assessment of land-use/land-cover dynamics on carbon storage services in the Loess Plateau of China from 1995 to 2050. Ecol. Indic. 2021, 120, 106939. [Google Scholar] [CrossRef]
  6. Chen, J.; Xu, C.; Gao, M.; Li, D. Carbon Peak and Its Mitigation Implications for China in the Post-Pandemic Era. Sci. Rep. 2022, 12, 3473. [Google Scholar] [CrossRef]
  7. Zheng, H.; Ge, L. Carbon Emissions Reduction Effects of Sustainable Development Policy in Resource-Based Cities from the Perspective of Resource Dependence: Theory and Chinese Experience. Resour. Policy 2022, 78, 102799. [Google Scholar] [CrossRef]
  8. Salvati, L.; Ferrara, C. Do Changes in Vegetation Quality Precede Urban Sprawl? Area 2013, 45, 365–375. [Google Scholar] [CrossRef]
  9. Zhang, Y.; Meng, W.; Yun, H.; Xu, W.; Hu, B.; He, M.; Mo, X.; Zhang, L. Is urban green space a carbon sink or source?—A case study of China based on LCA method. Environ. Impact Assess. Rev. 2022, 94, 106766. [Google Scholar] [CrossRef]
  10. Ignatieva, M.; Haase, D.; Dushkova, D.; Haase, A. Lawns in Cities: From a Globalised Urban Green Space Phenomenon to Sustainable Nature-Based Solutions. Land 2020, 9, 73. [Google Scholar] [CrossRef] [Green Version]
  11. Lahoti, S.; Lahoti, A.; Joshi, R.K.; Saito, O. Vegetation Structure, Species Composition, and Carbon Sink Potential of Urban Green Spaces in Nagpur City, India. Land 2020, 9, 107. [Google Scholar] [CrossRef] [Green Version]
  12. Morris, J. Agricultural Land Drainage, Land Use Change and Economic Performance. Land Use Policy 1992, 9, 185–198. [Google Scholar] [CrossRef]
  13. Richards, D.R.; Passy, P.; Oh, R.R.Y. Impacts of Population Density and Wealth on the Quantity and Structure of Urban Green Space in Tropical Southeast Asia. Landsc. Urban Plan. 2017, 157, 553–560. [Google Scholar] [CrossRef]
  14. Chengzhi, C.; Juan, L.; Wen, Z.; Schiraldi, M.M. Un-Sustainability of Global Ecosystem Based on the Carrying Capacity of Agro-Ecosystem. Res. Crops 2014, 15, 281. [Google Scholar] [CrossRef]
  15. OECD Home|OECD ILibrary. Available online: https://www.oecd-ilibrary.org/sites/9789264305304-en/index.html?itemId=/content/publication/9789264305304-en (accessed on 19 April 2023).
  16. Celia, M.A. Geological Storage of Captured Carbon Dioxide as a Large-Scale Carbon Mitigation Option. Water Resour. Res. 2017, 53, 3527–3533. [Google Scholar] [CrossRef]
  17. Kang, F.; He, Y.; Li, B.; Du, H. Carbon for Energy Storage and Conversion. Carbon 2012, 50, 342. [Google Scholar] [CrossRef]
  18. Cowell, S.J. Changes in Land Use and Land Cover: A Global Perspective. Glob. Environ. Change 1995, 5, 161–162. [Google Scholar] [CrossRef]
  19. Kwon, H.; Kim, J. Application of InVEST Urban Cooling Model to Evaluate Surface Cooling Capacity of Urban Green Areas. J. Assoc. Korean Geogr. 2022, 11, 449–463. [Google Scholar] [CrossRef]
  20. Chen, T.; Wang, M.; Liu, J. Evaluation of Ecosystem Services in Macao Based on InVEST Model. Urbanie Urbanus Resilient Cities 2022, 7, 24–39. [Google Scholar] [CrossRef] [PubMed]
  21. Chen, T.; Zhao, Y.; Yang, H.; Wang, G.; Mi, F. Recreational Services from Green Space in Beijing: Where Supply and Demand Meet? Forests 2021, 12, 1625. [Google Scholar] [CrossRef]
  22. Wu, H.; Liu, L.; Yu, Y.; Peng, Z. Evaluation and Planning of Urban Green Space Distribution Based on Mobile Phone Data and Two-Step Floating Catchment Area Method. Sustainability 2018, 10, 214. [Google Scholar] [CrossRef] [Green Version]
  23. Luo, C.; Li, X. Assessment of Ecosystem Service Supply, Demand, and Balance of Urban Green Spaces in a Typical Mountainous City: A Case Study on Chongqing, China. Int. J. Environ. Res. Public Health 2021, 18, 11002. [Google Scholar] [CrossRef]
  24. Udara Willhelm Abeydeera, L.H.; Wadu Mesthrige, J.; Samarasinghalage, T.I. Global Research on Carbon Emissions: A Scientometric Review. Sustainability 2019, 11, 3972. [Google Scholar] [CrossRef] [Green Version]
  25. Xiao, D.; Niu, H.; Guo, J.; Zhao, S.; Fan, L. Carbon Storage Change Analysis and Emission Reduction Suggestions under Land Use Transition: A Case Study of Henan Province, China. Int. J. Environ. Res. Public Health 2021, 18, 1844. [Google Scholar] [CrossRef]
  26. Wang, W.; Wu, T.; Li, Y.; Zheng, H.; Ouyang, Z. Matching Ecosystem Services Supply and Demand through Land Use Optimization: A Study of the Guangdong-Hong Kong-Macao Megacity. Int. J. Environ. Res. Public Health 2021, 18, 2324. [Google Scholar] [CrossRef]
  27. Ramaiah, M.; Avtar, R. Urban Green Spaces and Their Need in Cities of Rapidly Urbanizing India: A Review. Urban Sci. 2019, 3, 94. [Google Scholar] [CrossRef] [Green Version]
  28. Yang, Q.; Kang, Q.; Huang, Q.; Cui, Z.; Bai, Y.; Wei, H. Linear Correlation Analysis of Ammunition Storage Environment Based on Pearson Correlation Analysis. J. Phys. Conf. Ser. 2021, 1948, 012064. [Google Scholar] [CrossRef]
  29. Haase, A. Green Spaces and Their Social Functions: Specific Challenges in Urban Spaces of Arrival. In Human Nature Interactions; Ieva Misiune Daniel Depellegrin; Springer: Cham, Switzerland, 2022; pp. 273–284. [Google Scholar] [CrossRef]
  30. Zhang, Y.; Mavoa, S.; Zhao, J.; Raphael, D.; Smith, M. The Association between Green Space and Adolescents’ Mental Well-Being: A Systematic Review. Int. J. Environ. Res. Public Health 2020, 17, 6640. [Google Scholar] [CrossRef]
  31. Sun, Q.; Wu, Z.; Tan, J. The Relationship between Land Surface Temperature and Land Use/Land Cover in Guangzhou, China. Environ. Earth Sci. 2011, 65, 1687–1694. [Google Scholar] [CrossRef]
  32. Deery, D.; Jimenez-Berni, J.; Jones, H.; Sirault, X.; Furbank, R. Proximal Remote Sensing Buggies and Potential Applications for Field-Based Phenotyping. Agronomy 2014, 4, 349–379. [Google Scholar] [CrossRef] [Green Version]
  33. Lehmann, J.; Kinyangi, J.; Solomon, D. Organic Matter Stabilization in Soil Microaggregates: Implications from Spatial Heterogeneity of Organic Carbon Contents and Carbon Forms. Biogeochemistry 2007, 85, 45–57. [Google Scholar] [CrossRef]
  34. Chan, L.Y.; Lau, W.L.; Zou, S.C.; Cao, Z.X.; Lai, S.C. Exposure Level of Carbon Monoxide and Respirable Suspended Particulate in Public Transportation Modes While Commuting in Urban Area of Guangzhou, China. Atmos. Environ. 2002, 36, 5831–5840. [Google Scholar] [CrossRef]
  35. Fang, K.; Azizan, S.A.; Wu, Y. Low-Carbon Community Regeneration in China: A Case Study in Dadong. Sustainability 2023, 15, 4136. [Google Scholar] [CrossRef]
  36. Cohen, G. Forecasting Bitcoin Trends Using Algorithmic Learning Systems. Entropy 2020, 22, 838. [Google Scholar] [CrossRef]
  37. Alam, M.A.; Emura, K.; Farnham, C.; Yuan, J. Best-Fit Probability Distributions and Return Periods for Maximum Monthly Rainfall in Bangladesh. Climate 2018, 6, 9. [Google Scholar] [CrossRef] [Green Version]
  38. Lo, C.P. Economic Reforms and Socialist City Structure: A Case Study of Guangzhou, China. Urban Geogr. 1994, 15, 128–149. [Google Scholar] [CrossRef]
  39. Artmann, M.; Bastian, O.; Grunewald, K. Using the Concepts of Green Infrastructure and Ecosystem Services to Specify Leitbilder for Compact and Green Cities—The Example of the Landscape Plan of Dresden (Germany). Sustainability 2017, 9, 198. [Google Scholar] [CrossRef] [Green Version]
  40. Burkhard, B.; Kroll, F.; Nedkov, S.; Müller, F. Mapping ecosystem service supply, demand and budgets. Ecol. Indic. 2012, 21, 17–29. [Google Scholar] [CrossRef]
  41. Liu, W. Tenure-Based Housing Spatial Patterns and Residential Segregation in Guangzhou under the Background of Housing Market Reform. Sustainability 2022, 14, 4567. [Google Scholar] [CrossRef]
  42. Schroter, M.; Barton, D.N.; Remme, R.P.; Hein, L. Accounting for capacity and flow of ecosystem services: A conceptual model and a case study for Telemark, Norway. Ecol. Indic. 2014, 36, 539–551. [Google Scholar] [CrossRef]
  43. Villamagna, A.M.; Angermeier, P.L.; Bennett, E.M. Capacity, pressure, demand, and flow: A conceptual framework for analyzing ecosystem service provision and delivery. Ecol. Complex. 2013, 15, 114–121. [Google Scholar] [CrossRef]
  44. Chen, J.; Jiang, B.; Bai, Y.; Xu, X.; Alatalo, J. Quantifying ecosystem services supply, and demand shortfalls and mismatches for management optimization. Sci. Total Environ. 2019, 650, 1. [Google Scholar] [CrossRef] [PubMed]
  45. Jia, Q.; Jiao, L.; Lian, X.; Wang, W. Linking supply-demand balance of ecosystem services to identify ecological security patterns in urban agglomerations. Sustain. Cities Soc. 2023, 15, 104497. [Google Scholar] [CrossRef]
  46. Tian, Y.; Wu, H.; Zhang, G.; Wang, L.; Zheng, D.; Li, S. Perceptions of ecosystem services, disservices, and willingness-to-pay for urban green space conservation. J. Environ. Manag. 2020, 260, 110140. [Google Scholar] [CrossRef]
  47. Zhu, Z.; Li, J.; Chen, Z. Green space equity: Spatial distribution of urban green spaces and correlation with urbanization in Xiamen, China. Environ. Dev. Sustain. 2023, 25, 423–443. [Google Scholar] [CrossRef]
Figure 1. Location map of Guangzhou (Data source: Chinese Academy of Sciences’ Data Center for Resources and Environmental Sciences).
Sustainability 15 11199 g001
Figure 2. Guangzhou land use for the year 2020 (data source: Chinese Academy of Sciences’ Data Center for Resources and Environmental Sciences).
Sustainability 15 11199 g002
Figure 3. InVEST model flowchart (Source: authors).
Sustainability 15 11199 g003
Figure 4. Land type change in Guangzhou from 2000 to 2020 (Source: authors).
Sustainability 15 11199 g004
Figure 5. Change and dynamic attitude of land type area in Guangzhou from 2000 to 2020 (km2) (data source: Chinese Academy of Sciences’ Data Center for Resources and Environmental Sciences).
Sustainability 15 11199 g005
Figure 6. (a) CS map in the year 2000; (b) CS map in the year 2010; (c) CS map in the year 2020. Data source: Chinese Academy of Sciences’ Data Center for Resources and Environmental Sciences.
Sustainability 15 11199 g006
Figure 7. (a) CS change from 2000; (b) CS change from 2020. Data source: Chinese Academy of Sciences’ Data Center for Resources and Environmental Sciences.
Sustainability 15 11199 g007
Figure 8. CEs in Guangzhou. Data source: Guangzhou Statistical Yearbook.
Sustainability 15 11199 g008
Figure 9. Prediction of CS in 2030 in Guangzhou. Data source: Chinese Academy of Sciences’ Data Center for Resources and Environmental Sciences.
Sustainability 15 11199 g009
Figure 10. Prediction of CEs in 2030 in Guangzhou. Data source: Guangzhou Statistical Yearbook.
Sustainability 15 11199 g010
Figure 11. Priority demand evaluation in different districts in Guangzhou. Data source: Chinese Academy of Science’s Data Center for Resources and Environmental Sciences, Guangzhou Yearbook.
Sustainability 15 11199 g011
Table 1. The carbon emission factor of energy consumption and unit price in Guangzhou, China.
WaterElectricityFuel
Carbon emission factor0.91 kg/t [35]0.5810 t CO2/MWH [35]2.31 kg/L [35]
Unit price(a) 13.86 dollars/m3/month (under 26 m3/month)
(b) 20.79 dollars/m3/month (27–34 m3/month)
(c) 27.72 dollars/m3/month (above 34 m3/month)
(a) 4.76 dollars/MWH/month (under 260 MWH/month)
(b) 5.11 dollars/MWH/month (261–600 MWH/month)
(c) 6.86 dollars/MWH/month (above 601 MWH/month)
92 gasoline is 61.6 dollars/L
Table 2. Land type area and proportion in Guangzhou from 2000 to 2020 (km2) (data Source: Chinese Academy of Sciences’ Data Center).
Land Types200020102020
AreaProportionAreaProportionAreaProportion
cultivated land2588.1235.89%2114.5029.33%2077.9128.82%
woods3126.8543.37%3053.2142.34%3040.0342.16%
grassland109.071.51%103.561.44%96.981.34%
water area579.238.03%559.947.77%522.677.25%
construction land805.0011.16%1377.0619.10%1470.6720.40%
unused land2.080.03%2.080.03%2.090.03%
Table 3. Carbon density table of land type in Guangzhou (t/km2). Data source: resource and environmental science and data center.
Land TypesAboveground Carbon DensitySubsurface Carbon Density of VegetationSoil Carbon DensityCarbon Density of Dead Organic Matter
cultivated land13502701734100
woods583014581973350
grassland30113531600100
water area21000
construction land1209312480
unused land210011360
Table 4. Demand priority of green spaces in different districts in Guangzhou.
YuexiuTianheNanshaLiwanHuangpuHuaduHaizhuPanyuConghuaBaiyunZengcheng
Xc (100 million dollars)6.606.146.182.127.761.862.852.070.961.282.07
Xb (1000 people/km2)30.6423.341.0819.742.521.7220.135.120.374.680.83
Xa (104 t)132.99532.54672.21137.55818.631172.80350.972050.12−538.731510.57676.76
Disclaimer/Publisher’s Note: The statements, opinions and data contained in all publications are solely those of the individual author(s) and contributor(s) and not of MDPI and/or the editor(s). MDPI and/or the editor(s) disclaim responsibility for any injury to people or property resulting from any ideas, methods, instructions or products referred to in the content.

