Article

Using Kano Model to Understand an Effect of Specialization and Perceived Risk on Demand for Services in Marine Tourism

1
Department of Tourism, Dongseo University, Busan 48058, Republic of Korea
2
Korea Tourism Organization, Busan 48058, Republic of Korea
*
Author to whom correspondence should be addressed.
Sustainability 2023, 15(14), 11180; https://doi.org/10.3390/su151411180
Submission received: 2 May 2023 / Revised: 3 July 2023 / Accepted: 7 July 2023 / Published: 18 July 2023
(This article belongs to the Collection Advances in Marketing and Managing Tourism Destinations)

Abstract

:
This paper attempted to combine the Kano model and the service blueprint for quality management in marine tourism services. It also investigated the influence of customer characteristics, focusing on services that customers directly experience. Data were collected from those who experienced marine leisure in Korea in the past three years, and an analysis of differences between groups was conducted. The difference analysis showed significant differences in the frequency of service quality factors for men and women in six service items, and beginners showed significant differences in four items in the career comparison. Specialization and perceived risk were set as independent variables, and regression analysis was performed by setting the Timko coefficient as a dependent variable. The results showed that specialization did not significantly affect the customer satisfaction coefficient or the customer dissatisfaction coefficient. However, perceived risk had a significant negative effect on the customer satisfaction coefficient and a significant positive effect on the customer dissatisfaction coefficient. To attract those who strongly perceive risks as customers, a service strategy focusing on service elements that minimize complaints is more effective. In addition, it was found that women have a strong demand for both service elements that increase satisfaction and service elements that reduce dissatisfaction.

1. Introduction

The World Tourism Organization (UNWTO) has the following as the top 10 future tourism trends: beaches, sports, cruises, cities, ecology, farming and fishing villages, culture, adventure, theme parks, and international conferences. Beaches, sports, cruises, ecology, and farming and fishing villages are all based on marine spaces. As individual quality of life is emphasized and interest in leisure activities increases, the demand for nautical tourism is expected to increase over time [1]. In the academic field, both the number of papers published and the number of cited publications related to marine tourism have increased since 2007 [2].
From 2001 to 2020, only a few papers related to service quality and nautical tourism were published in journals listed in Scopus. The papers that have been published mainly deal with verifying the impact of hospitality service quality on satisfaction [3] or deriving service quality factors that need to be improved immediately [4] through the IPA matrix [5]. In fact, the service satisfaction of marine tourists in Korea was very low. In a 2019 survey, service satisfaction with surfing/windsurfing was 59.46 points/100, and service satisfaction with marine kayaking/canoeing was 65.01 points/100 [6]. Although there have been numerous studies on the service quality of marine tourism, why have they not contributed to the increase in service satisfaction? In order to improve the satisfaction of participants in marine tourism, new research methods must be considered in the academic field. Thus, this paper uses several new approaches compared to previous studies. First, the independent variable is replaced with a specific service provided at each stage of the customer experience rather than a service attribute. Through observation and interviews, it builds a service blueprint and derives the service required by customers.
Second, a research method of classifying satisfaction two-dimensionally between satisfaction and dissatisfaction will be attempted. While the one-dimensional approach suggests that higher perceived service quality leads to higher customer satisfaction, the Kano model deduces that improving service quality may not always lead to higher customer satisfaction. In other words, service quality and customer satisfaction show a nonlinear pattern, and satisfaction levels and dissatisfaction levels may also be independent [7]. Therefore, Kano’s model can provide implications for more substantial research in customer satisfaction [8]. Kano’s model has been widely used to evaluate existing and future elements of a product or service, but few studies have been conducted in the context of navigational marine tourism [9].
Third, it must be possible to compare the results derived from the Kano model according to consumer characteristics. Studies using the Kano model considered consumers as a single group. Strengthening services to satisfy all customers increases costs and results in profitability problems. Therefore, finding a group that strongly demands services or has high satisfaction or revisits and then establishing service strategies to meet their needs is desirable [10,11]. Since marine tourism requires professional skills, satisfaction, dissatisfaction, and demand for services may differ depending on the specialization degree, mainly since previous studies have found that the importance of service attributes and motivation differs according to the specialization degree [12,13,14]. No study has combined specialization level and the Kano model.
It is also important to consider how to create new demand by selecting segments that have yet to actively participate in marine tourism and providing services that solve their psychological constraints. Participants in marine tourism usually have a fear of risk [15,16]. The perceived risk may also affect differences in satisfaction and dissatisfaction levels or demand for services.
This study aims to understand the effect of specialization level and perceived risk for customers participating in marine tourism on satisfaction, dissatisfaction, and demand for marine tourism services. Observations, in-depth interviews, and surveys were conducted with individuals who participated in marine tourism in Korea. The results offer implications for providing customized services for marine tourism according to the level of specialization and perceived risk.

2. Literature Review

2.1. Customer Satisfaction in Marine, Coastal, and Nautical Tourism

Nautical, marine, and coastal tourism do not have universal definitions. Orams [17] defines marine tourism as focusing on the marine environment as a recreational activity related to traveling away from the residence. Sari et al. [3] proposed the scope of marine tourism to be all recreational tourism activities related to the sea. Ecorys [18] proposed that marine tourism refers to marine activities such as boating, yachting, cruises, and water sports, as well as land services and infrastructure.
Tourism, leisure, and recreational-oriented activities occur in coastal areas and coastal waters. Ecorys [18] proposed that marine tourism is less sea-centric and includes recreational, sports, and leisure activities, as well as beach-based tourism. Natural tourism is a broader term, including lakes, rivers, and other underwater environments where tourists can enjoy boating activities. Nautical tours include cruise tourism, marine sports, and recreational, boat, or yacht charter. Another form of recreational tourism has recently emerged, where individuals travel for maritime and underwater activities, such as rowing, kayaking, sailing, jet skiing, and sports fishing [2]. Spinelli and Benevolo [5] also note recreation, sports, entertainment, and other needs and include all means of transportation. Since this paper aims to study services based on customer characteristics such as specialization level and perceived risk, services performed in marine tourism were set as the research subject.
The most critical services in marine leisure tourism were program safety, the convenience of facilities, accessibility, program expertise, and equipment purchase and rental cost [3]. In addition, communication, reliability, credibility, responsiveness, tangibles, and understanding customers have been verified as factors significantly affecting marine tourism satisfaction [4].

2.2. Specialization in Outdoor Recreation

Specialization was proposed by Bryan [19] in 1977, and numerous studies have been conducted on specialization as an important concept that represents customer characteristics in leisure recreation. According to previous studies, people who participate in recreational activities tend to have different skills, attitudes, and expectations related to the activity depending on their degree of specialization [20]. Empirical studies have been conducted on leisure recreational activities such as hiking, camping, fishing, searching, and card play. They verified that the participants’ specialization levels affect participation motivation, location selection, involvement, and satisfaction, which provided critical implications for market segmentation [12,13]. Regarding marine leisure tourism, Anderson and Loomis [21] reported that the higher the level of specialization in scuba diving, the higher the selection attributes, satisfaction, and attitude toward the environment, and Kwon et al. [14] also said that the level of specialization of yacht participants affects involvement and satisfaction.
The issue in recreational specialization research is how to measure specialization, and researchers have agreed that recreational specialization is a multidimensional concept [20,22,23,24]. Early studies approached recreational specialization mainly from a behavioral perspective, such as the frequency of participation, financial investment, and the amount of equipment possessed. Bryan [19] said the preference for equipment, technology, and activity locations expresses recreational specialization. Research has also been conducted from a cognitive perspective, such as individual knowledge and skills. Approaches have also used psychological levels, such as the centrality of life, importance, level of self-expression, and enduring involvement. Buchanan [25] first attempted to give emotional meaning to recreational activities, such as psychological importance and involvement related to status or achievement opportunities. McIntyre and Pigram [26] also expressed emotional factors as emotions, including personal feelings about participation indicating attractiveness, self-expression, and centrality, and referred to them as continuing involvement. The level of specialization in recreation has been measured based on three criteria: cognition, emotion, and behavior. Scott and Shafer [20] expressed emotional factors as commitments and approached them in three dimensions: behavior, knowledge and skills, and commitment.

2.3. Perceived Risk

Tourists participating in marine tourism intentionally pursue thrills and perceive fear, a general expression of risk, as a positive emotion [15]. They prefer sparse routes and actively participate in adventure tourism activities [27]. However, the majority of marine tourists recognize the risks of certain tourism activities, including water sports such as diving, snorkeling, and surfing [16]. In fact, in a study of diving tourism in Malaysia, the diver’s safety perception had a more serious impact on the individual divers than their satisfaction [28].
Perceived risk is each individual’s intuitive risk judgment and can be defined as a subjective judgment made when each individual evaluates dangerous activities or skills that exist in the external world [29]. In the decision-making process, each individual expects uncertainty or dangerous consequences for the other target object (e.g., risk perception) and makes decisions to reduce uncertainty or risk [30]. Park et al. [31] investigated the effect of the perceived risk of marine sports participants on participation motivation and re-participation intention and found that significant gender differences occurred in the established path model; also, perceived risk had a negative effect on participation motivation, which then influenced the intention to revisit. A study of women traveling alone also found that perceived risk changed the image of the destination and affected their intention to visit [32].
Many previous studies have defined tourists’ risk perception as cognitive factors and identified their effects. Recently, studies have shown that emotional factors (or predicted emotions) have a significant impact on shaping tourists’ perceived risk or determining follow-up behaviors [33,34]. The perceived risks that tourists feel because of specific events, phenomena, and risk factors occurring at tourist destinations are being studied by researchers in the context of the need for tourism management, including emotional risk perception [35]. In this study, both cognitive risk perception and emotional risk perception are included as variables to understand their effects.

2.4. Kano Model and Blueprint

Herzberg et al. [36] found that the factors that satisfy employees (motivation factors) and dissatisfy them (hygiene factors) are different. For example, suppose the level of salary or benefits is low. In that case, problems such as neglect of work or turnover are mass-produced through dissatisfaction, but raising their levels does not increase job satisfaction. Factors that do increase satisfaction are items such as the delegation of authority or a sense of achievement, and work satisfaction increases when these factors are satisfied, but these factors not being satisfied does not lead to dissatisfaction [37].
Kano et al. [38] proposed a new quality evaluation model of customer satisfaction by applying Herzberg et al. [36]’s motivation–hygiene theory to services. In Herzberg’s two-factor theories, “motivation” represents a satisfaction trigger for employees, corresponding to the “attractive” quality of the Kano model, and hygiene represents a dissatisfaction prevention factor corresponding to the “must-have” quality of the Kano model [38].
Over the past 30 years, the Kano model [38] has been modified and expanded by incorporating more categories to measure customer satisfaction [39,40] and has become increasingly popular in tourism research. In particular, one study on service marketing attempted to use the Kano model to maximize customer satisfaction effectively. Another study classified the quality attributes of various airline services or tourist destinations according to culture [41,42], combined with the Kano model and fuzzy quality function deployment (FQFD), to maximize Ban-DohWang’s annuality in 2015. To improve the failure of service quality in the logics center, the Kano model and FMEA methods were used [43]. These studies used the Kano model to define service attributes, present positive and negative situations for the criteria, and confirm service demand. However, the derived results had to be reinterpreted to see what services should be specifically performed. There is room for personal bias in embodying academically obtained results into services in the field.
Accordingly, studies have attempted to combine the Kano model with blueprints. The service blueprint is a map or flowchart illustrating all essential tasks and activities during the service delivery process and is designed to visualize the service process [44,45]. The blueprint systematically lists and classifies the customer’s experiences from their point of contact to prepare the physical environment, customer response services, and back-office support services during each interaction. MVP tests investigate customer responses and check the process’s potential service failure points or lead time [45,46]. Therefore, using blueprints allows for a clear understanding of service items and customer satisfaction at all points [47]. Chang and Yang [48] attempted to combine the Kano model and service blueprint in the Taiwanese government’s Adult Day Care Service to reorganize the service area. Suzianti and Chairunnisa [49] analyzed Indonesia’s public transportation services by combining the Kano model with SST Qual, QFD, and a blueprint, which contributed to selecting the priority of each service according to the blueprint’s goal. Therefore, in marine tourism, the application of research to combine the Kano model and blueprints will create new demand by distinguishing core services corresponding to motivating factors.

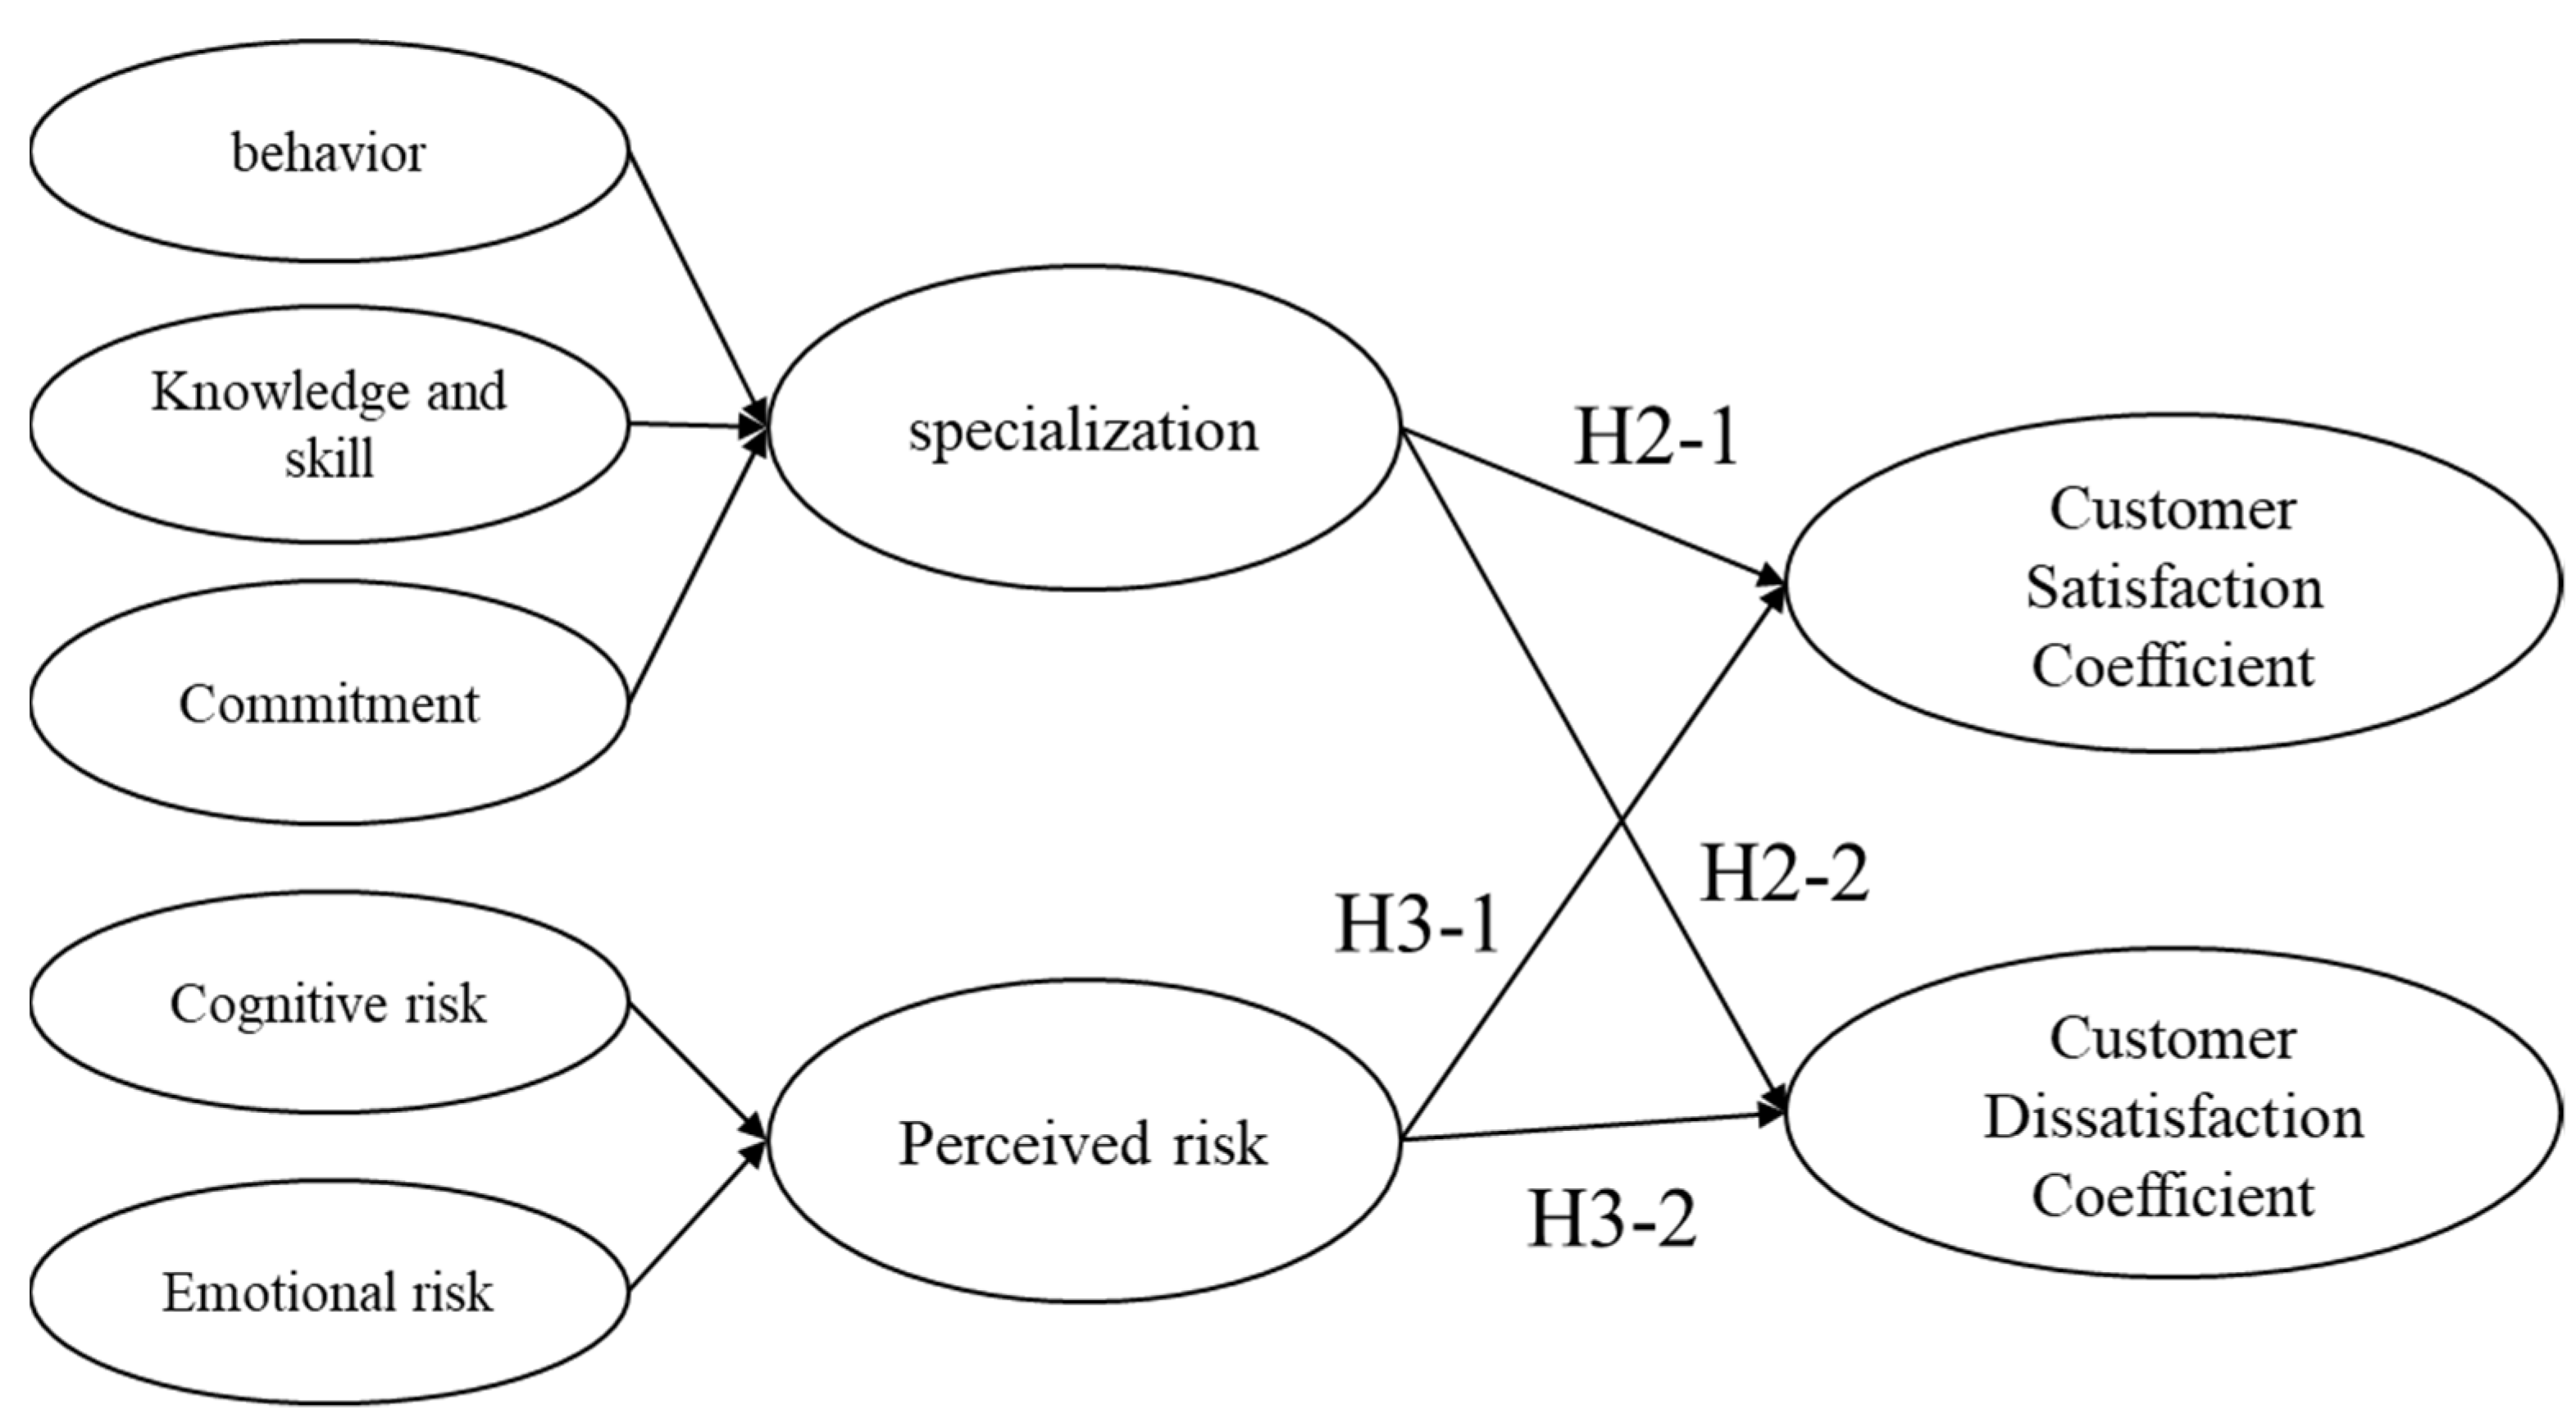
3. Conceptual Model and Hypothesis Development

This paper attempts to verify the effect of the level of specialization and perceived risk of marine tourism on service demand based on a literature review. The first hypothesis is to derive participant characteristics representing the level of specialization and perceived risk and to verify the difference by classifying the group. Basfirinci and Mitra [41] studied the effect of airlines’ service quality attributes on customer satisfaction in a multicultural context. The results showed that respondents from two countries, the United States and Turkey, prioritized service quality attributes differently; this contributed to establishing different airline marketing strategies. Therefore, Hypothesis 1 was set focusing on the difference between career and gender, which are participant characteristics that differ significantly according to the level of specialization and perceived risk and the results are shown in Figure 1.
H1. 
Depending on the characteristics of participants participating in marine leisure sports, there are significant differences in the demand for services required at each stage of the blueprint.
H1-1. 
There are significant differences in the demand for services required at each stage of the blueprint according to the gender of the customers participating in marine leisure sports.
H1-2. 
There are significant differences in the demand for services required at each stage of the blueprint according to the customers’ marine leisure sports experiences.
Previous studies have found that the importance of bird-related attributes increases as the finder’s level of specialization increases [12,24,50]. Furthermore, studies on marine leisure sports have shown that the level of specialization affects leisure satisfaction [14], with the strongest motivation for the most specialized surveyor to see various species [13]. Hypotheses 2 and 3 were established based on these previous studies, proposing that the level of specialization and the perceived risk also affect the service demand.
H2. 
The level of specialization in marine leisure sports affects the demand for service.
H2-1. 
The level of specialization in marine leisure sports affects the customer satisfaction coefficient.
H2-2. 
The level of specialization in marine leisure sports affects the customer dissatisfaction coefficient.
H3. 
The perceived risk level of marine leisure sports affects the demand for service.
H3-1. 
The perceived risk level of marine leisure sports affects the customer satisfaction coefficient.
H3-2. 
The perceived risk level of marine leisure sports affects the customer dissatisfaction coefficient.

4. Methodology

The overall process of this study is as follows. First, Study 1 involved observations and in-depth interviews to create blueprints for marine leisure sports. Through this, the service was listed, and the blueprint was completed, focusing on the customer’s temporal experience. After that, a questionnaire based on the Kano model was completed, expert verification was conducted, and 50 individuals participated in a pilot test. Based on the results, the questionnaire was modified to make it easier to understand and fit the original purpose, and the final survey had 301 participants and the research method is shown in Table 1.

4.1. Qualitative Method

Observations and preliminary interviews were conducted with eight participants to represent the various services and experiences faced by customers in marine tourism in the blueprint. Based on the Busan Tourism Organization [51] survey results, 4 clusters of single women in their 20’s and 30’s, unmarried partners in their 20’s and 30’s, single men in their 20’s, and families were selected in the order of high participation. To this end, one or two teams were openly recruited for each cluster, and eight people shared their marine leisure sports experiences and participated in interviews. In-depth interviews were conducted at the Marine Leisure Center at Gwangalli Beach in Busan, and on 19 May 2021, participants experienced paddleboarding for 2.5 h from 10 a.m. to 12:30 p.m.; in-depth interviews were conducted from 1 p.m. to 4 p.m. and information on the interview participants is shown in Table 2 below.
Through walk-through auditions and field interviews applied by Fitzsimmons and Maurer [52] to restaurants, research participants were asked to state each contact point that occurred from when they arrived at the marine leisure sports center until they finished their experience, including what they saw and heard, and to state the cognitive and emotional reactions at the time. Through this, customers’ marine tourism was classified into 13 processes in 4 stages, and 29 detailed services were derived. The four stages consisted of guidance, pre-training, implementation, and completion. The first stage was classified as a guidance system, physical facilities, and equipment; the second stage was instructor qualification, the attitude of an instructor, and posture practice; the third stage was the enjoyment of the scenery, recreation, and photography; and the fourth stage was the check out and food/beverage.
In addition, 13 processes were classified into functional clues, mechanic clues, and human clues based on Berry et al. [53]. Functional clues refer to the process and system of service and are the criteria for judging reliability. Mechanic clues refer to the physical environment, such as facilities, equipment, furniture, arrangement, and lighting. Human clues are the gestures, facial expressions, and tone of speech provided by the employees, and customers judge the sincerity of the service through these. Functional clues were the guidance system, posture practice, photography, check out, and food/beverage, and physical clues were classified as physical facilities, equipment, enjoyment of the scenery, and check out. Human clues included the guidance system, instructor qualification, the instructor’s attitude, and photography as shown in Table 3.

4.2. Quantitative Method

4.2.1. Measurement Item

A basic scale was created according to the literature review, and the scale was supplemented by triangulating the representatives of marine leisure sports companies and three academic experts. The pilot test was performed, including 50 individuals who had experience with marine leisure sports, and the reliability and validity of measurement items were assessed.
Specialization is defined as a multidimensional concept of behavioral, cognitive, and emotional dimensions that gradually become specialized in the process of continuously participating in marine tourism. Specialization consists of behavior (experience), cognition (knowledge and skill), and commitment, and each variable has 4~5 items. The scale was completed by referring to Scott and Shafer [20], McIntyre and Pigram [26], and Kim and Song [23].
Perceived risk is defined as the uncertainty or risk that tourists feel when it is difficult to predict the outcome after deciding to participate in tourism activities. Perceived risk consists of cognitive risk and emotional risk, and each item had 4 response options. The scale was finalized with reference to Janssen et al. [33], Jun [34].
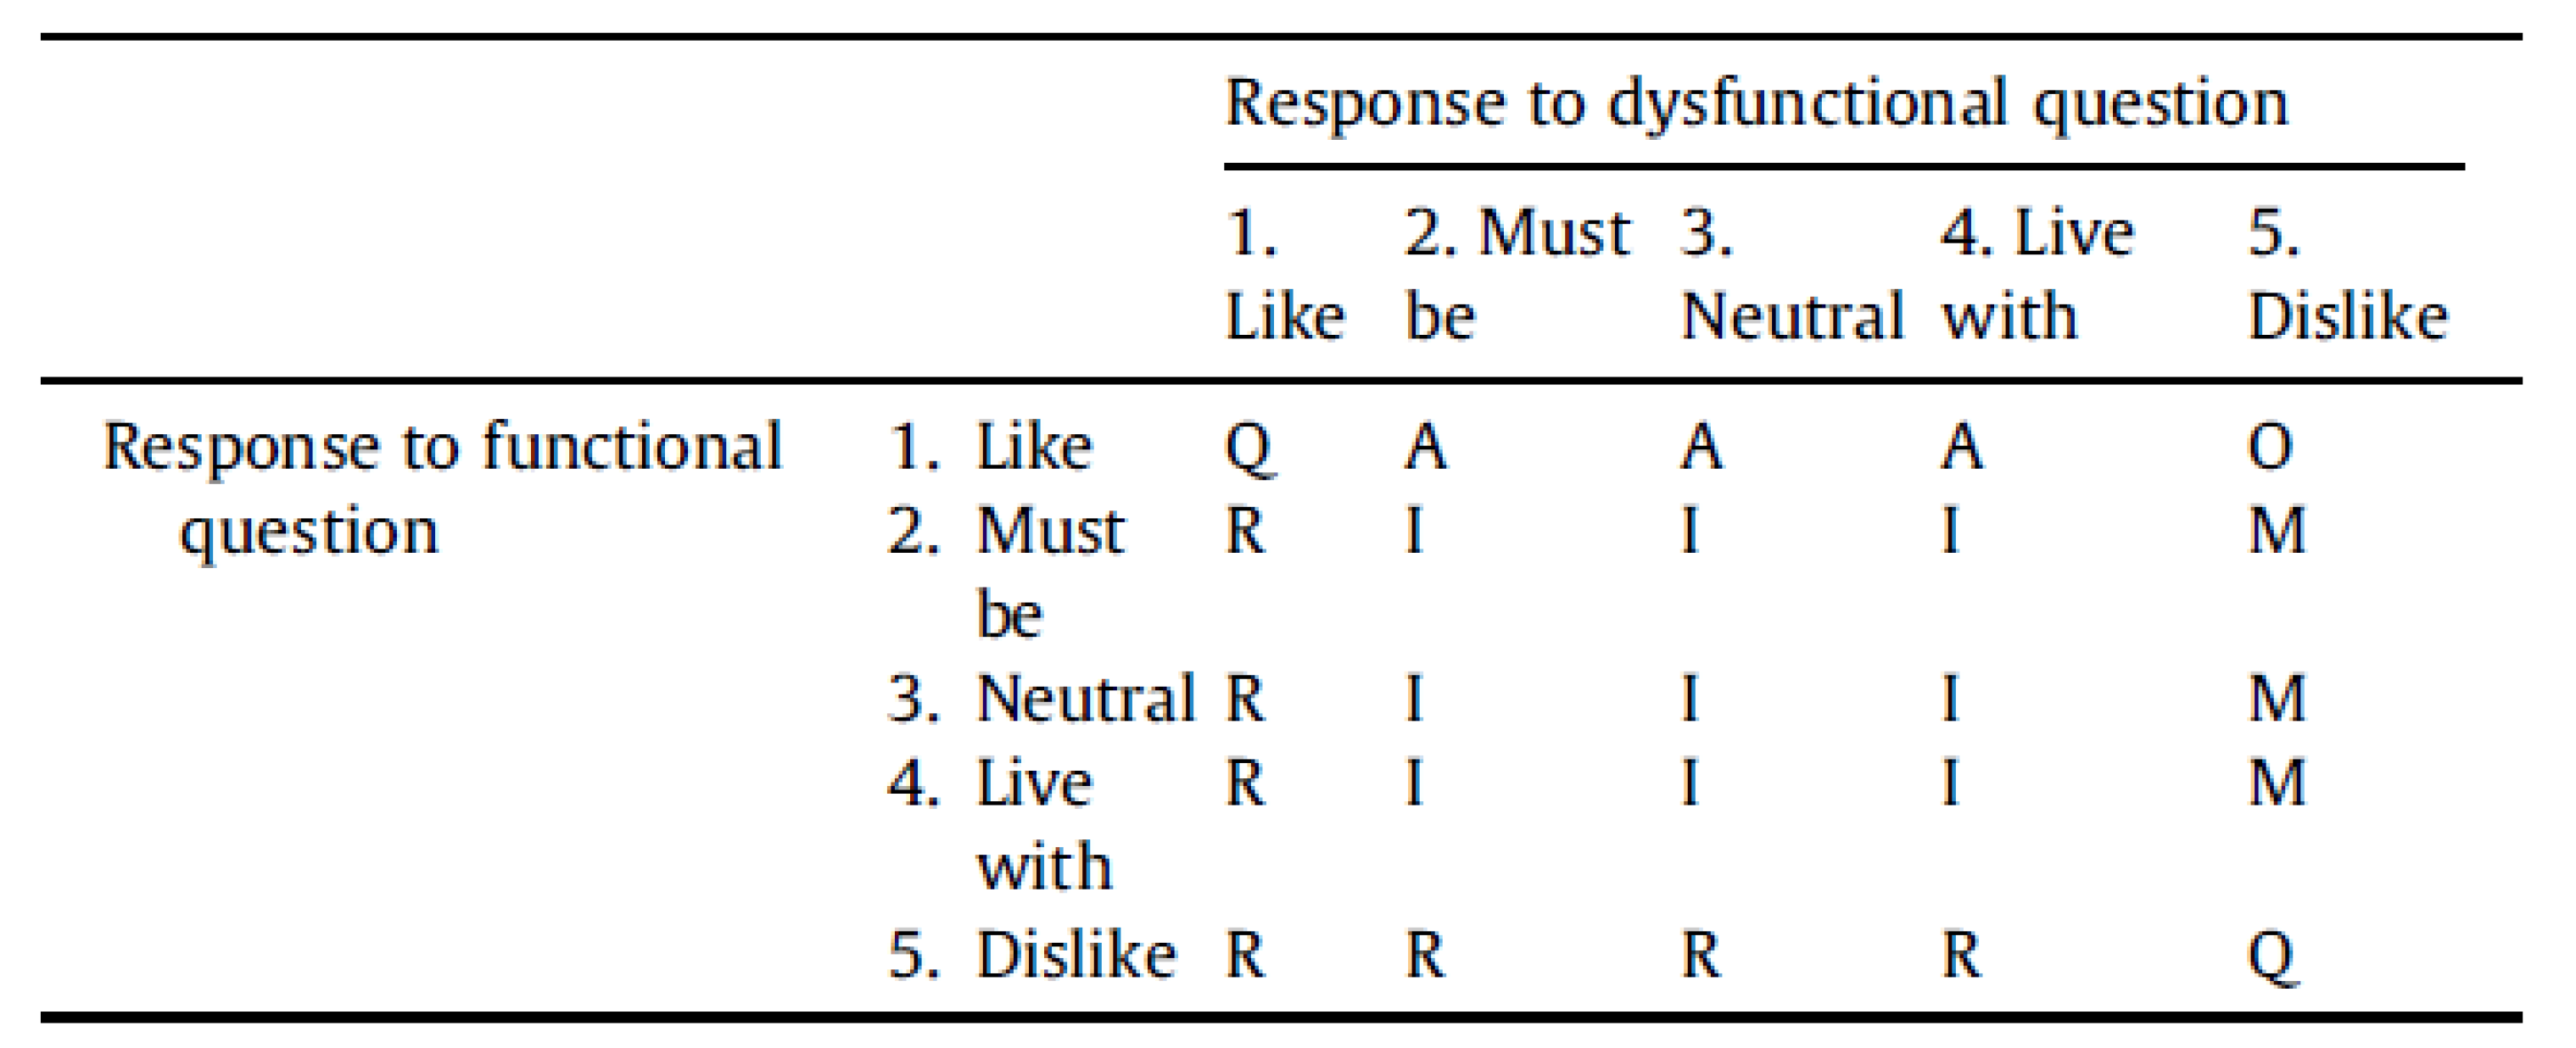
  • Service quality element by Kano model
Service demand is defined as a coefficient indicating to what level the service is desired. The questionnaire on Kano classification is designed in a dual way with functional and dysfunctional questions for each item [7,54]. Assuming that specific services are provided, respondents were asked to choose the appropriate answer among “like”, “must-be”, “indifferent”, “live with”, and “dislike”. Next, assuming that a specific service is not provided, dysfunctional questions were presented [55]. Based on this, each service was organized into the following quality elements: attractive (A), one-dimensional (O), must-be (M), indifference (I), and reverse (R). First, the attractive quality factor (A) refers to an element that is satisfied when the physical situation is satisfied but does not cause dissatisfaction even if it is not satisfied. The second, the one-dimensional quality factor (O) means an element that is satisfied when the physical situation is satisfied and not satisfied when it is not satisfied. Third, the must-be quality factor (M) is an element that increases dissatisfaction when the expected factors are not met but does not necessarily increase the level of customer satisfaction even if they are satisfied. Fourth, the indifference factor (I) is a factor that does not affect satisfaction or dissatisfaction even if it is met or not met. Lastly, reverse quality factors (R), contrary to must-be quality factors, are not satisfied when the expected factors are met and satisfied when they are not, and they have a negative effect on customer satisfaction [56]. The Kano evaluation table are shown in Figure 2.
2.
Timko coefficient
In the Kano model, when determining the quality characteristics, the quality level is determined by the highest frequency value. Therefore, even with the same quality factor, there is a limit to representing the difference between the relatively high-quality-level element and the low-quality-level element numerically [57]. In addition, if the frequency difference between each quality factor is insufficient, it may not be reasonable to classify it as a determined quality factor [54]. To compensate for this problem, Timko [57] applied the customer satisfaction coefficient to measure the increase in satisfaction when experiencing a particular service and, conversely, how much dissatisfaction decreases when not experiencing a specific service [40]. At this time, the Better and Worse coefficients are used, where the closer the Better coefficients (customer satisfaction coefficient) are to 1, the stronger the degree of customer satisfaction and the stronger the Worse coefficient (customer dissatisfaction coefficient), indicating customer dissatisfaction, and the closer they are to 0, the weaker the degree of satisfaction or dissatisfaction that is being evaluated [58]. The description of the Timko coefficient is shown in Table 4.
The Timko coefficient has been effectively used to represent the level of satisfaction and dissatisfaction with each service attribute. If the Timko coefficient is calculated for an individual rather than a service attribute, a customer satisfaction coefficient and a customer dissatisfaction coefficient representing the overall service demand level for each individual can be derived. A group with a high customer satisfaction coefficient will more actively demand services that increase their satisfaction, and a group with a high customer dissatisfaction coefficient will demand services that reduce dissatisfaction. Since this study aims to find services that will increase the demand for marine tourism and determine the factors influencing this tendency, this coefficient will perform a function suitable for the dependent variable. Therefore, these two coefficients to be calculated for each individual will be used as dependent variables for Hypotheses 2 and 3.

4.2.2. Data Collection

Data were collected about those who have experienced marine leisure sports in Korea within the past three years (2019–2021). Examples of marine tourism include surfing, kayaking, paddleboarding, water skiing, no-boating, water biking, wakeboarding, canoeing, dinghy sailing, and windsurfing.
Data were collected from 301 participants through an online survey (Dataspring Korea) from 4 May to 9 May 2022. The initial intention was to identify people with marine leisure sports experience over the past year, but because of COVID-19 restrictions, it was determined that this was not a suitable target. Therefore, the time was set to three years.

4.2.3. Research Analysis

For analysis, the response results were coded using the Microsoft Excel 2016 program according to Kano’s quality attribute classification table, and frequency analysis was conducted. In addition, for the customer satisfaction coefficient, the Better coefficient and Worse coefficient for each item were calculated by applying Timko’s customer satisfaction coefficient calculation equation to the frequency of the quality attribute classification of the Kano model. After that, using SPSS 27.0, the chi-square difference between quality factors according to individual characteristic variables was analyzed, and confirmatory factor analysis of the level of specialization, perceived risk, and the structural model was conducted using AMOS.

5. Results

5.1. Demographic Characteristics

Table 5 shows the demographic characteristics and behavioral characteristics of the 301 respondents.
Table 6 shows the characteristics of respondents.

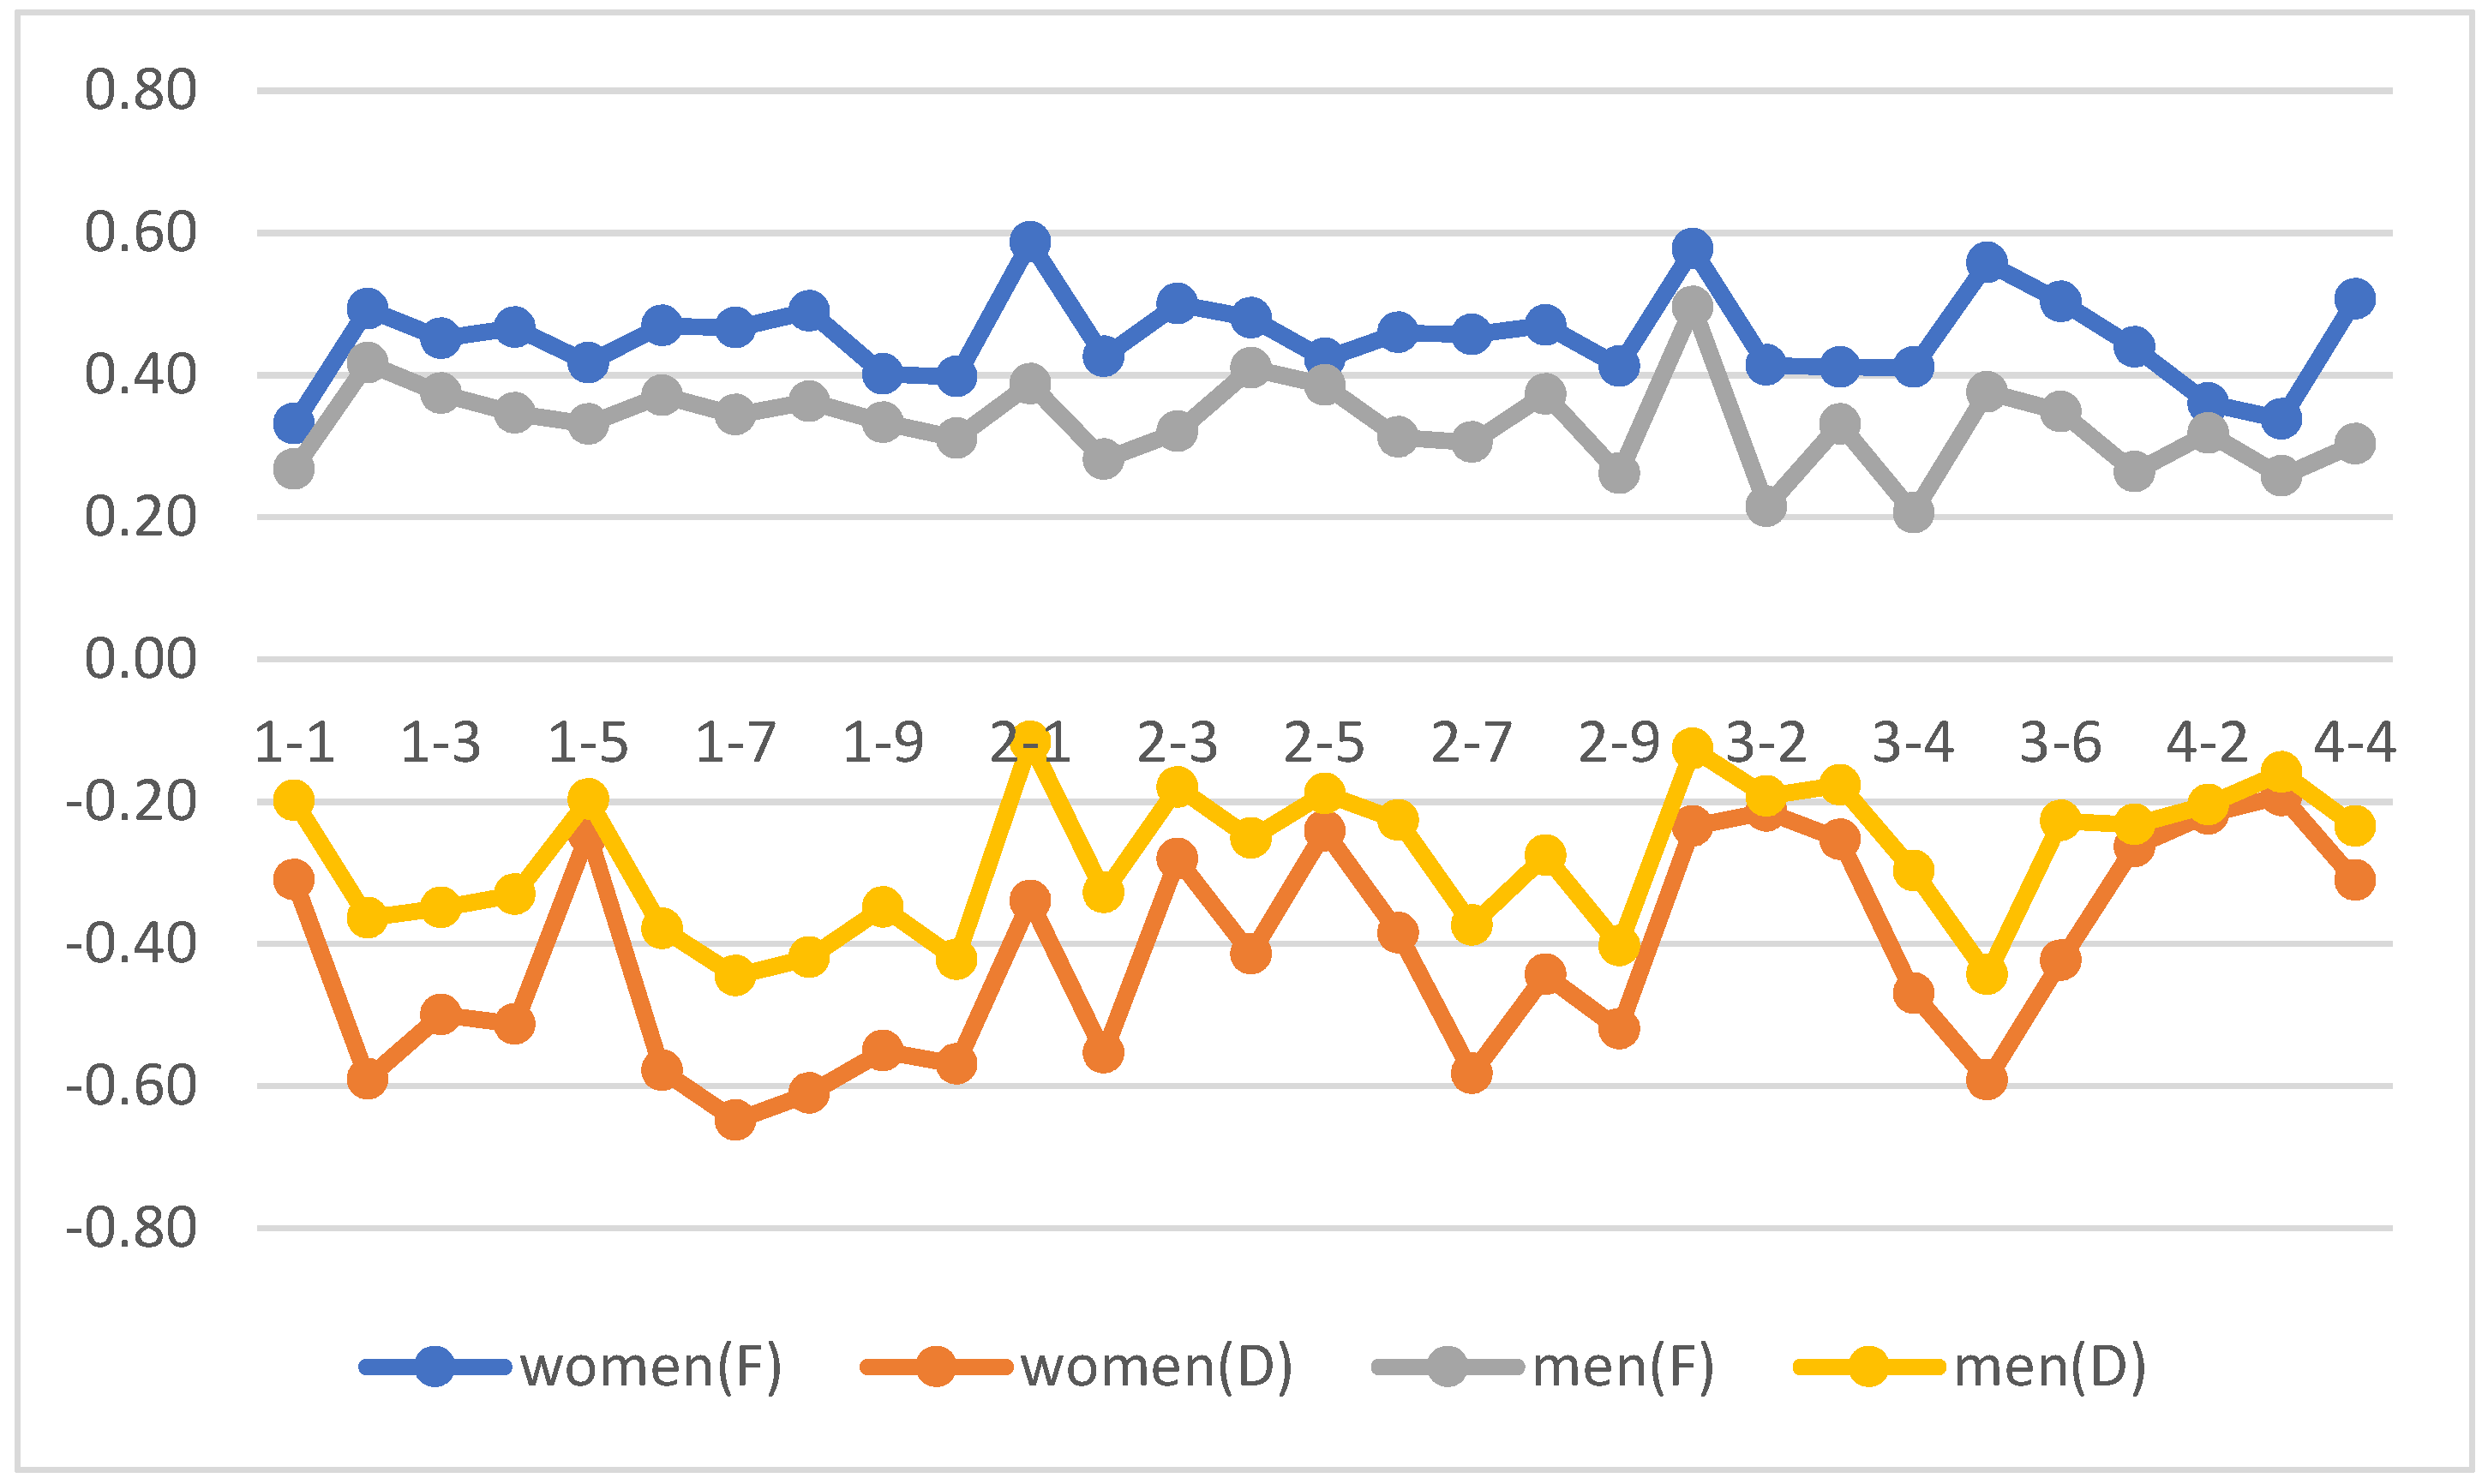
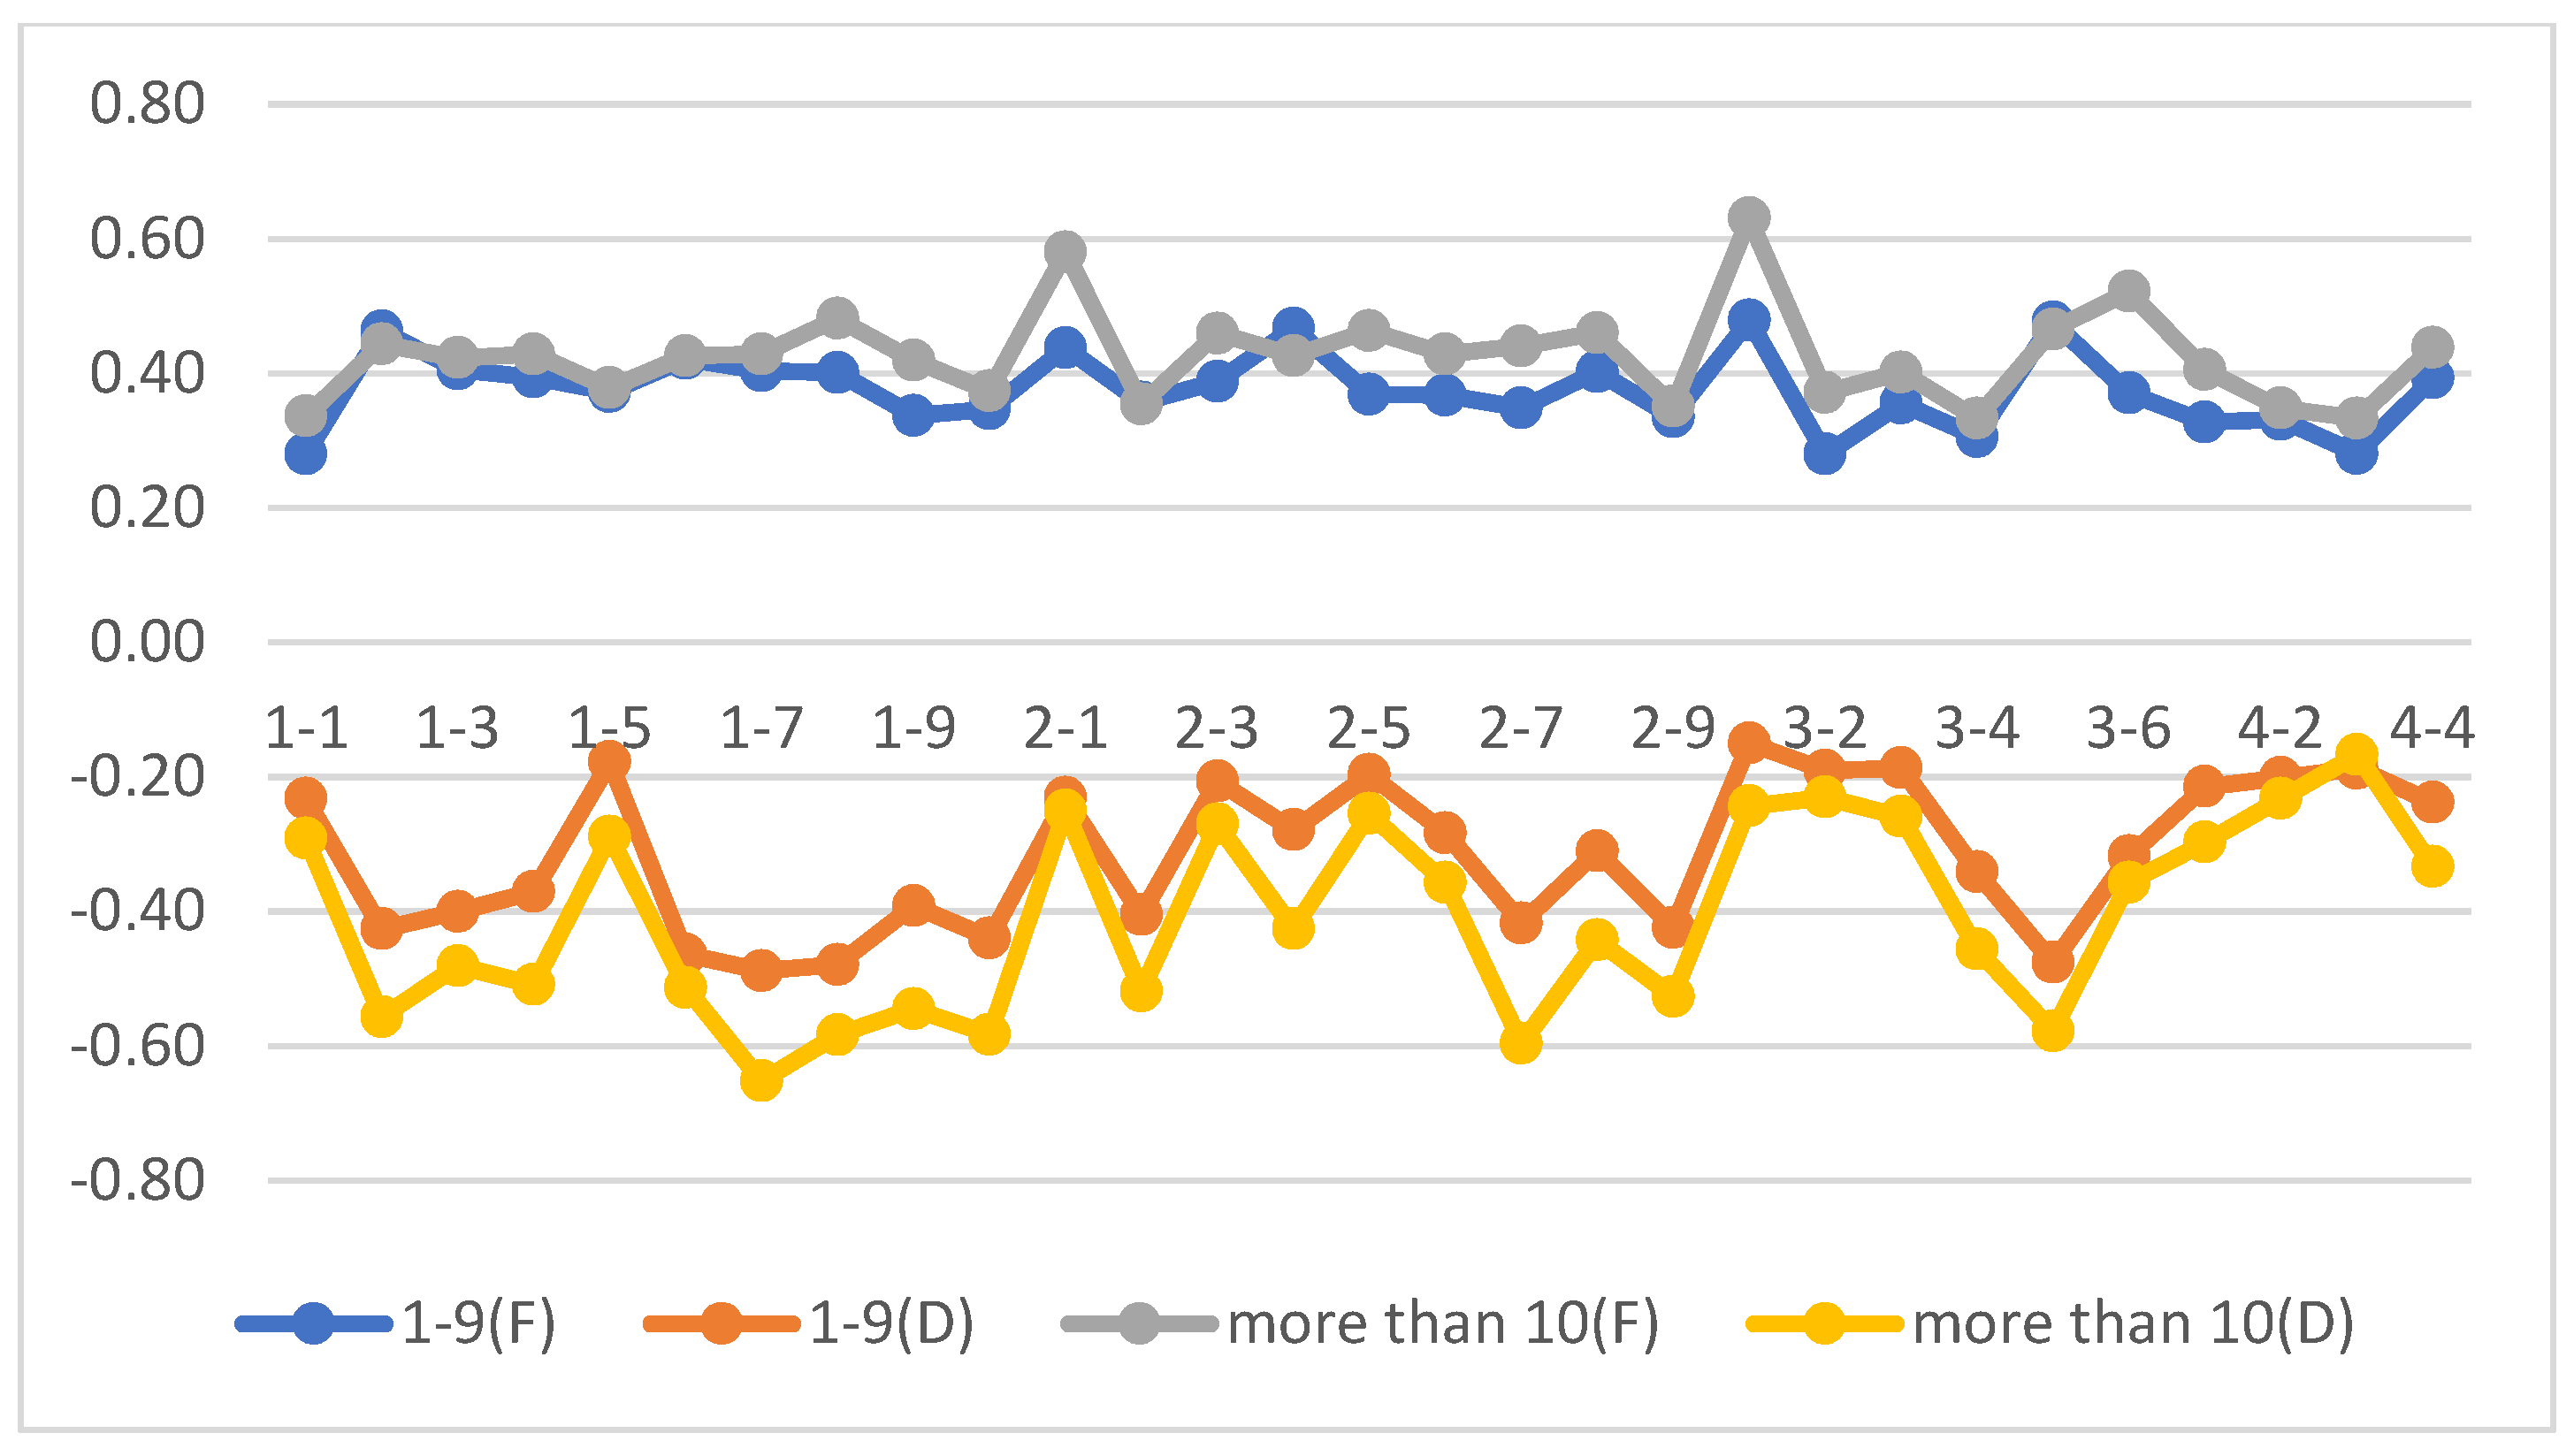
5.2. Group Differences by Gender, Frequency of Participation in Kano Classification, and Satisfaction Coefficient

After analysis, all 29 services provided by the Marine Leisure Center were classified as indifference quality elements. In addition, in terms of the Timko coefficient, only the beauty of the surrounding scenery had a satisfaction coefficient exceeding 0.5. Overall, unlike studies in other fields, unusual results showed that the no attractive quality factor (A) or one-way quality factor (O) was derived. For the dissatisfaction coefficient, the cleanliness of the toilet, the sanitary condition of the equipment, the quarantine condition of the equipment, guidance on wearing the equipment, and the comfort of the shower facilities were found to exceed −0.5. The interior design, life vest, suit selection, instructor’s career, reputation, humor, beautiful scenery, farewell greetings, recommendation to visit again, simple drinks such as beer, snacks such as hot dogs, photo/video purchase, and discount coupon scored lower than −0.25. Even if the service was not provided, there were no complaints.
The analysis conducted by classifying gender and career by individual characteristics showed a significant difference between groups. First, in the comparison by gender, men evaluated all service items as indifference quality elements, and significant differences in the frequency of women’s service quality elements were found among service items. Six elements showed statistically significant differences between men and women in the frequency of the Kano model classification evaluation: friendly response, toilet cleanliness, equipment hygiene, faithful education, comfort of shower facilities, and surrounding scenery, as shown in Table 7. The surrounding landscape was classified as an attractive quality element for women.
In the comparison of men and women centered on the Timko coefficient, the satisfaction coefficient for functional questions assuming that the service was provided was high for women, and the dissatisfaction coefficient for dysfunctional questions assuming that the service was not provided tended to be significantly lower for women than for men (Figure 3).
As Figure 4 shows in the fourth quadrant matrix, the service quality requirement level is very low for men, as the Timko coefficient is concentrated in the upper left, whereas for women, it is relatively evenly distributed in the fourth quadrant. In particular, the coefficient of dissatisfaction if the service would not have been provided is high. It is difficult to determine if a separate group was not classified and only identified as a whole.
Second, when compared by experience, beginners with one to nine experiences were evaluated as indifference quality factors in all service items, and there was a significant difference between the service quality needs of experienced people in nine service items. In addition, the classification evaluation of the Kano model also showed differences in four items (friendly response, kindness of instructors, faithful education, and comfort of shower facilities), as shown in Table 8.
There was no difference in the satisfaction coefficient for functional questions assuming that the service was provided in the career comparison centered on the Timko coefficient, but in the dissatisfaction coefficient for dysfunctional questions assuming that the service was not provided, experienced individuals tended to be lower than beginners (Figure 5).
As Figure 6 shows in the fourth quadrant matrix, the service quality requirement level is very low for beginners because the Timko coefficient is concentrated in the upper left, whereas experienced people are relatively evenly distributed in the third quadrant. In particular, the coefficient of dissatisfaction if the service would not have been provided is high. It is also difficult to find if a separate group was not classified and was identified only as a whole.

5.3. Preliminary Analysis

Confirmatory factor analysis for each variable showed that there were no factors with a multi-correlation index (SMC) lower than 0.4, the factor load was within the range of 0.701 to 0.908, and all CRs were statistically significant at 1.965, securing convergence validity. The AVE value of the constituent concept was in the range of 0.938 to 0.946, all items were above the reference Changed as belowvalue of 0.50, and the CR value of all items was between 0.974 and 0.985, securing concept reliability at a very high level. Evaluation results based on the model’s suitability index χ2 = 426.605 (df = 199, p = 0.000), CMIN/df = 2.144, IFI = 0.953, NFI = 0.915, CFI = 0.953, and RMSEA = 0.062. Except for χ2 statistics that vary sensitively depending on the number of samples and measurement variables, all indices showed suitable values (Table 9).
To assess discriminant validity, the average variance extracted (AVE) for each scale was compared with the squared correlation between all pairs of variables. For each variable, the squared correlation was lower than the AVE, indicating acceptable discriminant validity [59]. Descriptive statics and correlation coefficients (Pearson’s r) between the variables are presented in Table 10.

5.4. Evaluation of the Structural Model

To improve the suitability of the model, gender, a variable that showed a clear difference in the analysis of Hypothesis 1, was included as a control variable. Evaluation results based on the model’s suitability index χ2 = 35.051 (df = 13, p = 0.001), CMIN/df = 2.696, IFI = 0.985, NFI = 0.976, CFI = 0.984, and RMSEA = 0.075. Except for χ2 statistics that vary sensitively depending on the number of samples and measurement variables, all indices showed suitable values.
As Table 11 shows in the results, analysis through the structural equation showed that specialization did not have a significant effect on either the customer satisfaction coefficient or the customer dissatisfaction coefficient. In general, if the level of specialization is high, motivation for or satisfaction with marine leisure sports is high. However, specialization did not affect the demand for more attractive quality elements or one-dimensional quality elements and also did not affect the demand for more must-be quality elements or one-dimensional quality elements.
Next, the perceived risk had a significant effect on the customer satisfaction coefficient (β = −0.360, p < 0.001) and the customer dissatisfaction coefficient (β = 0.497, p < 0.001). The squared multiple correlations of the dependent variable were 0.310 for the customer satisfaction coefficient and 0.180 for the customer dissatisfaction coefficient. It means the proportion of variance from the independent variable was 31.0% of satisfaction and 18.0% of dissatisfaction. There was a very unusual tendency in the direction in which the perceived risk affected the dependent variable. The higher the perceived risk, the lower the customer satisfaction coefficient and the higher the customer dissatisfaction coefficient. It can be interpreted that those who perceive more risk cannot accept various services that induce satisfaction. On the other hand, those who perceived more risk tended to have a stronger demand for services that correspond to hygiene factors that create dissatisfaction.
Therefore, hypothesis H2-1 and hypothesis H2-2 were not supported, and hypothesis H3-1 and hypothesis H3-2 were supported.

6. Discussion

Marine tourism is gradually becoming popular as the social demand for quality of life increases, but the level of satisfaction with marine tourism services in Korea is very low. However, strengthening services increases costs, and since most marine tourism companies are too small, they cannot afford to invest in new services. Therefore, it is most effective to find segments that contribute to the company’s profitability and understand and respond to their needs. As a segment that satisfies this condition, the specialization degree and perceived risk were proposed based on previous studies. The relationship between these two independent variables and service demand was analyzed through a t-test and a structural equation model.
First, the frequency of service quality factors was analyzed by dividing the data into two groups based on career and gender, representing specialization and perceived risk. The difference analysis showed significant differences in the frequency of service quality factors for men and women in six service items (friendly response, toilet cleanliness, equipment hygiene, faithful education, shower comfort, and surrounding landscape). These results are similar to those of Park et al. [31], in which there were significant differences in motivation and intention to re-participate between genders.
Second, in the career comparison, beginners showed significant differences in four items (friendly response, teacher kindness, faithful education, and comfort in shower facilities) in the classification evaluation of the Kano model. In another career comparison centered on the Timko coefficient, there was no difference in the satisfaction coefficient for positive questions assuming that the service was provided. However, for the dissatisfaction coefficient for negative questions assuming that the service was not provided, the experienced tended to score lower than beginners. Instead, it was found that people with greater experience were more likely to be disappointed when the service was not provided.
However, the structural equation analysis results showed that specialization did not significantly affect the customer satisfaction coefficient and the customer dissatisfaction coefficient. It supports the result of Bentz et al. [60] that the frequency of visits does not increase as the level of specialization in marine leisure increases and the result of Scott and Shafer [20] that the level of specialization does not have a linear relationship with attitudes or behaviors. The perceived risk had a significant negative effect on the customer satisfaction coefficient and a significant positive effect on the customer dissatisfaction coefficient. These results support the research findings that perceived physical and psychological risks directly affect revisit intentions [31,32,61] and that safety concerns reduce enjoyment [62].

7. Conclusions

This study found that marine tourism participants did not actively require services and tended to be indifferent. However, while those who perceived risk strongly showed no interest in service elements that increased satisfaction, they were very sensitive to service elements that minimize dissatisfaction. Therefore, it can be suggested that a service strategy focusing on service elements that minimize dissatisfaction is needed to secure those who perceive risk strongly as customers.

7.1. Theoretical Implication

In terms of marine tourism service quality management, it was academically meaningful to attempt to find service elements suitable for satisfaction and hygiene elements in the two dimensions of satisfaction and dissatisfaction. In addition, combining the Kano model and the service blueprint and then organizing the independent variable as a service that customers directly encounter is also a new attempt in the marine tourism field. This study’s novel attempt to clarify the difference according to customer characteristics through Kano model analysis should be continued in the future. Specifically, using the Timko coefficient to evaluate the degree of demand for each service for each individual and using it as a dependent variable was novel. Through this, it was possible to understand the effect of customer characteristics on the degree of demand for services that increase satisfaction and reduce dissatisfaction.

7.2. Managerial Implication

In the field of marine tourism, research on service quality has been conducted without consideration of customer segments. As most marine tourism companies are small, they often cannot afford to invest in large-scale services. By specifying the main segment, this study created a service blueprint to meet their needs. This study shows that focusing on services that reduce dissatisfaction is necessary to actively attract perceived high-risk people, who are new potential customers in the marine tourism sector. The degree of risk perception is highly related to gender. As shown in the results of the analysis of differences between men and women, men were found to be indifferent to marine tourism services, but women were found to have strong demands for both service elements that increase satisfaction and service elements that reduce dissatisfaction. In order to create new demand for marine tourism in the future, a service strategy that focuses on women is required.

7.3. Limitations and Future Research

Many previous studies classified services as related to attractive quality factors. However, in this study, unexpected results were that attractive quality factors were only found for women and experienced people. Most people responded that the service was unnecessary for marine tourism. In this regard, there is room to think of the possibility that the regional characteristics of Korea, such as the culture and perception of marine tourism, have influenced the research results. Overall, additional research is needed to derive marine tourism services that will contribute to new demand growth in the future.

Author Contributions

Methodology, J.K. and K.L.; Formal analysis, J.K. and K.L.; Investigation, J.K. and K.L.; Writing—original draft, J.K. and K.L.; Writing—review & editing, K.L.; Supervision, J.K. All authors have read and agreed to the published version of the manuscript.

Funding

This research was funded by Dongseo University, grant number DSU-202203.

Institutional Review Board Statement

Not applicable.

Informed Consent Statement

Not applicable.

Data Availability Statement

Not applicable.

Conflicts of Interest

The authors declare no conflict of interest.

References

  1. KMI. Activation of Marine Leisure through Settlement of Surfing Culture; Korea Marine Institute: Seoul, Republic of Korea, 2019; Volume 122. [Google Scholar]
  2. Martínez Vázquez, R.; Milán García, J.; De Pablo Valenciano, J. Analysis and trends of global research on nautical, maritime and marine tourism. J. Mar. Sci. Eng. 2021, 9, 93. [Google Scholar] [CrossRef]
  3. Sari, F.O.; Bulut, C.; Pirnar, I. Adaptation of hospitality service quality scales for marina services. Int. J. Hosp. Manag. 2016, 54, 95–103. [Google Scholar] [CrossRef]
  4. Jang, D.; Cho, W.J. IPA on the 4Ps of marketing mix for developing marine leisure tourism in South Korea. Glob. Bus. Financ. Rev. 2018, 23, 27–37. [Google Scholar] [CrossRef]
  5. Spinelli, R.; Benevolo, C. Towards a new body of marine tourism research: A scoping literature review of nautical tourism. J. Outdoor Recreat. Tour. 2022, 40, 100569. [Google Scholar] [CrossRef]
  6. KMI. The Development Plan of Marine Leisure and Tourism Industry; Korea Marine Institute: Seoul, Republic of Korea, 2019. [Google Scholar]
  7. Chen, C.C.; Chuang, M.C. Integrating the Kano model into a robust design approach to enhance customer satisfaction with product design. Int. J. Prod. Econ. 2008, 114, 667–681. [Google Scholar] [CrossRef]
  8. Mikulić, J.; Prebežac, D. The Kano model in tourism research: A critical note. Ann. Tour. Res. 2016, 61, 25–27. [Google Scholar] [CrossRef]
  9. Shen, Y.; Kokkranikal, J.; Christensen, C.P.; Morrison, A.M. Perceived Importance of and satisfaction with marina attributes in sailing tourism experiences: A Kano model approach. J. Outdoor Recreat. Tour. 2021, 35, 100402. [Google Scholar] [CrossRef]
  10. Mentzer, J.T.; Flint, D.J.; Hult, G.T.M.; Tomas, M. Logistics service quality as a segment-customized process. J. Mark. 2001, 65, 82–104. [Google Scholar] [CrossRef]
  11. Nella, A.; Christou, A. Extending tourism marketing: Implications for targeting the senior tourists’ segment. J. Tour. Herit. Serv. Mark. 2016, 2, 36–42. [Google Scholar] [CrossRef]
  12. Hvenegaard, G.T. Birder specialization differences in conservation involvement, demographics, and motivations. Hum. Dimen. Wildl. 2002, 7, 21–36. [Google Scholar] [CrossRef]
  13. Kim, A.K.; Keuning, J.; Robertson, J.; Kleindorfer, S. Understanding the birdwatching tourism market in Queensland, Australia. Anatolia 2010, 21, 227–247. [Google Scholar] [CrossRef]
  14. Kwon, Y.H.; Cheung, Y.K.; Ahn, B.W. Effect of outdoor sports participants on leisure facilitation, recreation specialization, and leisure satisfaction: Yacht and golf participants. Int. J. Environ. Res. Public Health 2021, 18, 8128. [Google Scholar] [CrossRef] [PubMed]
  15. Mura, P. “Scary… but I like it!” Young tourists’ perceptions of fear on holiday. J. Tour. Cult. Chang. 2010, 8, 30–49. [Google Scholar] [CrossRef]
  16. Wilks, J.; Atherton, T. Health and safety in Australian marine tourism: A social, medical and legal appraisal. J. Tour. Stud. 1994, 5, 2–16. [Google Scholar]
  17. Orams, M.B. Marine Tourism: Development, Impacts and Management; Routledge: Oxfordshire, UK, 1999. [Google Scholar]
  18. Ecorys, M. Study in Support of Policy Measures for Maritime and Coastal Tourism at EU Level; Ecorys: Rotterdam, The Netherlands, 2013. [Google Scholar]
  19. Bryan, H. Leisure value systems and recreational specialization: The case of trout fisherman. J. Leis. Res. 1977, 9, 174–187. [Google Scholar] [CrossRef]
  20. Scott, D.; Shafer, C.S. Recreational specialization: A critical look at the construct. J. Leis. Res. 2001, 33, 319–343. [Google Scholar] [CrossRef]
  21. Anderson, L.E.; Loomis, D.K. Normative Standards for Coral Reef Conditions: A Comparison of SCUBA Divers by Specialization Level. J. Leis. Res. 2012, 44, 257–274. [Google Scholar] [CrossRef]
  22. Jun, J.; Kyle, G.; Graefe, A.; Manning, R. An identity-based conceptualization of recreation specialization. J. Leis. Res. 2015, 47, 425–443. [Google Scholar] [CrossRef]
  23. Kim, H.; Song, H. Measuring hiking specialization and identification of latent profiles of hikers. Landsc. Ecol. Eng. 2017, 13, 59–68. [Google Scholar] [CrossRef]
  24. Scott, D.; Thigpen, J. Understanding the birder as a tourist: Segmenting visitors to the Texas hummer/bird celebration. Hum. Dimen. Wildl. 2003, 8, 199–218. [Google Scholar] [CrossRef]
  25. Buchanan, T. Commitment and leisure behavior: A theoretical perspective. Leis. Sci. 1985, 7, 401–420. [Google Scholar] [CrossRef]
  26. McIntyre, N.; Pigram, J.J. Recreation specialization reexamined: The case of vehicle-based campers. Leis. Sci. 1992, 14, 3–15. [Google Scholar] [CrossRef]
  27. Lepp, A.; Gibson, H. Sensation seeking and tourism: Tourist role, perception of risk and destination choice. Tour. Manag. 2008, 29, 740–750. [Google Scholar] [CrossRef]
  28. Yang, C.L.; Khoo-Lattimore, C.; Nair, V. Tourist risk perception at marine destination in Malaysia. In Proceedings of the 12th ApacCHRIE Conference, Subang Jaya, Malaysia, 24–26 May 2014. [Google Scholar]
  29. Slovic, P. Perception of risk. Science 1987, 236, 280–285. [Google Scholar] [CrossRef]
  30. Sönmez, S.F.; Graefe, A.R. Determining future travel behavior from past travel experience and perceptions of risk and safety. J. Travel Res. 1998, 37, 171–177. [Google Scholar] [CrossRef] [Green Version]
  31. Park, S.S.; Rhim, Y.T.; Kim, M.J.; Kim, S.K.; Yoo, J.I. The influence of perceived risk on participation motivation and re-participation intention in marine sports. J. Coast. Res. 2014, 72, 96–100. [Google Scholar] [CrossRef]
  32. Thuan, D.; Nguyen, A.; Hsu, L. Exploring visit intention to India among Southeast Asian solo female travelers. Tour. Manag. 2022, 25, 100725. [Google Scholar]
  33. Janssen, E.; van Osch, L.; Lechner, L.; Candel, M.; de Vries, H. Thinking versus feeling: Differentiating between cognitive and affective components of perceived cancer risk. Psychol. Health 2012, 27, 767–783. [Google Scholar] [CrossRef]
  34. Jun, M.J. Effects of potential tourists’ risk perceptions and changes in destination image on travelers’ decision-making. J. Tour. Leis. Res. 2021, 33, 41–60. [Google Scholar] [CrossRef]
  35. Schroeder, A.; Pennington-Gray, L.; Korstanje, M.; Skoll, G. Managing and marketing tourism experiences: Extending the travel risk perception literature to address affective risk perceptions. In The Handbook of Managing and Marketing Tourism Experiences; Sotiriadis, M., Gursoy, D., Eds.; Emerald Group Publishing Limited: Bradford, UK, 2016. [Google Scholar] [CrossRef]
  36. Herzberg, F.; Mausner, B.; Snyderman, B. The Motivation to Work; Wiley: Hoboken, NJ, USA, 1959. [Google Scholar]
  37. Alegre, J.; Garau, J. Tourist satisfaction and dissatisfaction. Ann. Tour. Res. 2010, 37, 52–73. [Google Scholar] [CrossRef]
  38. Kano, N.; Seraku, N.; Takahashi, F. Attractive quality and must be quality. J. Jpn. Soc. Qual. Control 1984, 14, 39–48. [Google Scholar]
  39. Madzík, P. Increasing Accuracy of the Kano model—A case study. Total Qual. Manag. Bus. Excell. 2018, 29, 387–409. [Google Scholar] [CrossRef]
  40. Shahin, A.; Pourhamidi, M.; Antony, J.; Hyun Park, S. Typology of Kano Models: A critical review of literature and proposition of a revised model. Int. J. Qual. Reliab. Manag. 2013, 30, 341–358. [Google Scholar] [CrossRef]
  41. Basfirinci, C.; Mitra, A. A cross cultural investigation of airlines service quality through integration of servqual and the Kano model. J. Air Transp. Manag. 2015, 42, 239–248. [Google Scholar] [CrossRef]
  42. Pawitra, T.A.; Tan, K.C. Tourist Satisfaction in Singapore—A perspective from Indonesian tourists. Manag. Serv. Qual. 2003, 13, 399–411. [Google Scholar] [CrossRef]
  43. Tang, L.L.; Chen, S.H.; Lin, C.C. Integrating FMEA and the Kano model to improve the service quality of logistics centers. Processes 2021, 9, 51. [Google Scholar] [CrossRef]
  44. Chuang, P.-T. Combining service blueprint and FMEA for service design. Serv. Ind. J. 2007, 27, 91–104. [Google Scholar] [CrossRef]
  45. Shostack, G.L. Designing services that deliver. Harv. Bus. Rev. 1984, 62, 133–139. [Google Scholar]
  46. Patrício, L.; Fisk, R.P.; Falcão e Cunha, J. Designing multi-interface service experiences. J. Serv. Res. 2008, 10, 318–334. [Google Scholar] [CrossRef]
  47. Go, M.; Kim, I. In- Flight NCCI Management by combining the Kano model with the service blueprint: A comparison of frequent and infrequent flyers. Tour. Manag. 2018, 69, 471–486. [Google Scholar] [CrossRef]
  48. Chang, D.; Yang, S. Combining Kano model and service blueprint for adult day care service—A case study in Taiwan. In Proceedings of the 2010 International Conference on Service Systems and Service Management, Tokyo, Japan, 28–30 June 2010; pp. 1–5. [Google Scholar]
  49. Suzianti, A.; Chairunnisa, A. Designing service blueprint of self-service technology (SST) based public transportation service in indonesia using SSTQual, Kano model, and QFD. In Proceedings of the MATEC Web Conference, Surakarta, Indonesia, 11–12 June 2018; p. 237. [Google Scholar] [CrossRef] [Green Version]
  50. Cole, J.S.; Scott, D. Segmenting participation in wildlife watching: A comparison of casual wildlife watchers and serious birders. Hum. Dimen. Wildl. 1999, 4, 44–61. [Google Scholar] [CrossRef]
  51. Busan Tourism Organization. Survey of Busan Marine Leisure Experience Visitors; Busan Tourism Organization: Busan, Republic of Korea, 2021. [Google Scholar]
  52. Fitzsimmons, J.A.; Maurer, G.B. A walk-through audit to improve restaurant performance. Cornell Hotel Restaur. Admin. Q. 1991, 31, 95–100. [Google Scholar] [CrossRef]
  53. Berry, L.L.; Wall, E.A.; Carbone, L.P. Service clues and customer assessment of the service experience: Lessons from marketing. Acad. Manag. Perspect. 2006, 20, 43–57. [Google Scholar] [CrossRef] [Green Version]
  54. Oh, J.C.; Yoon, S.J.; Park, B. A Structural approach to examine the quality attributes of e-shopping malls using the Kano Model. Asia Pac. J. Mark. Logist. 2012, 24, 305–327. [Google Scholar] [CrossRef]
  55. Palumbo, F. Developing a new service for the digital traveler satisfaction: The smart tourist App. Int. J. Digit. Acc. Res. 2015, 15, 33–67. [Google Scholar] [CrossRef] [Green Version]
  56. Busacca, B.; Padula, G. Understanding the relationship between attribute performance and overall satisfaction. Mark. Intell. Plan. 2005, 23, 543–561. [Google Scholar] [CrossRef]
  57. Timko, M. An experiment in continuous analysis. In Kano’s Method for Understanding Customer-Defined Quality; Walden, D., Ed.; Center for Quality of Management Inc.: Cambridge, MA, USA, 1993. [Google Scholar]
  58. Matzler, K.; Fuchs, M.; Schubert, A.K. Employee satisfaction: Does Kano’s model apply? Total Qual. Manag. Bus. Excell. 2004, 15, 1179–1198. [Google Scholar] [CrossRef]
  59. Bagozzi, R.P.; Yi, Y.; Nassen, K.D. Representation of measurement error in marketing variables: Review of approaches and extension to three-facet designs. J. Econ. 1998, 89, 393–421. [Google Scholar] [CrossRef]
  60. Bentz, J.; Lopes, F.; Calado, H.; Dearden, P. Managing marine wildlife tourism activities: Analysis of motivations and specialization levels of divers and whale watchers. Tour. Manag. Perspect. 2016, 18, 74–83. [Google Scholar] [CrossRef]
  61. Bentz Yin, E.; Chew, T.; Jahari, S.A. Destination image as a mediator between perceived risks and revisit intention: A case of post-disaster Japan. Tour. Manag. 2014, 40, 382–393. [Google Scholar] [CrossRef]
  62. Tseng, Y.; Kyle, G.T.; Shafer, C.S.; Graefe, A.R.; Bradle, T.A.; Schuett, M.A. Exploring the Crowding–Satisfaction Relationship in Recreational Boating. Environ. Manag. 2009, 43, 496–507. [Google Scholar] [CrossRef] [PubMed]
Figure 1. Research model.
Sustainability 15 11180 g001
Figure 2. Kano evaluation table. Source: Kano et al. [38]. Note: (Q) questionable, (A) attractive, (R) reverse, (I) indifference, (M) must-be, (O) one-dimensional.
Sustainability 15 11180 g002
Figure 3. Differences in Timko coefficient by gender.
Sustainability 15 11180 g003
Figure 4. Differences in Timko coefficient by gender based on quadrants.
Sustainability 15 11180 g004
Figure 5. Differences in Timko coefficient by frequency of attending marine leisure.
Sustainability 15 11180 g005
Figure 6. Differences in Timko coefficient by frequency of participation based on quadrants.
Sustainability 15 11180 g006
Table 1. Research method.
MethodSequence
Qualitative method ① Observation and in-depth interviews of marine tourism participants
② Create service blueprints based on customer experience
Quantitative method③ Complete Kano model survey and expert verification
④ Pilot test for 50 people
⑤ Main survey of 301 people
Table 2. Interview participants.
ClusterParticipantsGenderAgeOccupationPre-Experience
Women in their 20s and 30sAFemale20’sMarine tourismX
BFemale30’sTravel agencyPaddleboarding
Lovers in their 20s and 30sCMale20’sInsuranceX
DFemale20’sInsuranceX
Mem in their 20sEMale20’sUniversity studentX
FMale20’sUniversity studentX
FamiliesGFemale30’sTourism serviceX
HFemale30’sExhibition facilitiesSurfing Paddleboarding
Table 3. Customer experience of blueprint in marine tourism.
StagesProcessesServicesClue
GuidanceGuiding systemStaff dress, friendly response, guidance systemfunctional and human
Physical facilitiesInterior design, changing room, and toilet cleanlinessmechanic
EquipmentEquipment hygiene, equipment diversity, instructions for usemechanic
Pre-trainingInstructor qualificationsCareer, certificate, reputationhuman
Instructor attitudeKindness, sense of humor, mutual communicationhuman
Posture practiceFaithful safety education, number of students, warm-up exercisefunctional and human
ImplementEnjoyment of the scenerySurrounding scenerymechanic
RecreationCompetitive play programfunctional
PhotographyPhotography servicefunctional and human
FinishCheck outReturn equipment, comfort of shower facilities, change of clothesmechanic and functional
Food/beverageDrinks, simple food servedfunctional
Table 4. Timko coefficient.
Better CoefficientWorse CoefficientReference
(A + O)
(A + O + M + I)
(−1) X(O + M) (A + O + M + I)A: Number of attractive quality elements
O: Number of one-dimensional quality elements
M: Number of must-be quality elements
I: Number of indifferent quality elements
Table 5. Descriptive statistics.
Variablen%Variablen%
Gender Companion
Male14347.5Alone3411.2
Female15852.5Friend19965.7
Age Family6320.8
20~296722.3Other51.7
30~3913043.2Occupation
40~497123.6Company employee21169.6
50~59268.6Owner of a business185.9
60 and over72.3Professional3511.6
Education level Student216.9
High school diploma or less237.6Housewife82.6
Bachelor’s degree20568.1Other82.6
Graduate degree7324.3
Table 6. Characteristics of respondents.
Variablen%Variablen%
Frequency of attending marine leisure activities
First time82.66–10 times4615.2
2–3 times4815.8More than 10 times11939.3
4–5 times8026.4
Item (duplicated check)
Surfing19865.8Canoe11337.5
Kayak11738.9Dinghy yacht3612.0
Paddleboarding9932.9Windsurfing10936.2
Water ski16655.1Water-propelled board5618.6
Rowboat4615.3Cable water ski8427.9
Water cycle6421.3Kite board4113.6
Wakeboard10534.91
Table 7. Analysis of gender differences.
Service AttributesKano’s Quality CategoriesMaleFemaleχ2Classification EvaluationSatisfaction CoefficientDissatisfaction Coefficient
MaleFemaleMaleFemaleMaleFemale
Friendly response of information desk staffAttractive21 (14.7%)14 (8.9%)15.817 **IndifferentOne-dimensional0.420.49−0.36−0.59
One-dimensional34 (23.8%)57 (36.1%)
Must-be14 (9.8%)28 (17.7%)
Indifferent64 (44.8%)45 (28.5%)
Reverse6 (4.2%)6 (3.8%)
Questionable4 (2.8%)8 (5.1%)
Cleanliness of the toiletAttractive11 (7.7%)10 (6.3%)12.822 *IndifferentOne-dimensional0.340.47−0.45−0.65
One-dimensional34 (23.8%)60 (38.0%)
Must-be24 (16.8%)36 (22.8%)
Indifferent60 (42.0%)43 (27.2%)
Reverse8 (5.6%)5 (3.2%)
Questionable6 (4.2%)4 (2.5%)
Equipment hygieneAttractive17 (11.9%)12 (7.6%)17.495 **IndifferentOne-dimensional0.360.49−0.42−0.61
One-dimensional29 (20.3%)61 (38.6%)
Must-be23 (16.1%)30 (19.0%)
Indifferent56 (39.2%)47 (29.7%)
Reverse11 (7.7%)6 (3.8%)
Questionable7 (4.9%)2 (1.3%)
Faithful safety educationAttractive16 (11.2%)13 (8.2%)17.060 **IndifferentOne-dimensional0.310.46−0.37−0.58
One-dimensional24 (16.8%)56 (35.4%)
Must-be26 (18.2%)32 (20.3%)
Indifferent66 (46.2%)51 (32.3%)
Reverse6 (4.2%)2 (1.3%)
Questionable5 (3.5%)4 (2.5%)
Comfort of shower facilitiesAttractive10 (7.0%)16 (10.1%)10.963 *IndifferentOne-dimensional0.380.56−0.44−0.59
One-dimensional41 (28.7%)66 (41.8%)
Must-be18 (12.6%)21 (13.3%)
Indifferent65 (45.5%)45 (28.5%)
Reverse6 (4.2%)5 (3.2%)
Questionable3 (2.1%)5 (3.2%)
Surrounding landscapeAttractive51 (35.7%)61 (38.6%)10.618 *IndifferentAttractive0.500.58−0.13−0.23
One-dimensional13 (9.1%)25 (15.8%)
Must-be4 (2.8%)10 (6.3%)
Indifferent60 (42.0%)54 (34.2%)
Reverse5 (3.5%)5 (3.2%)
Questionable10 (7.0%)3 (1.9%)
Note: * p < 0.05, ** p < 0.01.
Table 8. Differences analysis based on experience frequency.
Service AttributesKano’s Quality CategoriesBeginnerExpertχ2Classification EvaluationSatisfaction CoefficientDissatisfaction Coefficient
BeginnerExpertBeginnerExpertBeginnerExpert
Friendly response of Information Desk StaffAttractive23 (12.6%)12 (10.1%)13.737 **IndifferentOne-dimensional0.460.44−0.43−0.56
One-dimensional52 (28.6%)39 (32.8%)
Must-be17 (9.3%)25 (21.0%)
Indifferent70 (38.5%)39 (32.8%)
Reverse10 (5.5%)2 (1.7%)
Questionable10 (5.5%)2 (1.7%)
Kindness of instructorAttractive41 (22.5%)18 (15.1%)14.445 *IndifferentIndifferent0.470.43−0.28−0.43
One-dimensional36 (19.8%)31 (26.1%)
Must-be10 (5.5%)18 (15.1%)
Indifferent78 (42.9%)48 (40.3%)
Reverse11 (6.0%)2 (1.7%)
Questionable6 (3.3%)2 (1.7%)
Faithful safety educationAttractive14 (7.7%)15 (12.6%)22.780 ***IndifferentOne-dimensional0.350.44−0.42−0.60
One-dimensional47 (25.8%)33 (27.7%)
Must-be26 (14.3%)32 (26.9%)
Indifferent88 (48.4%)29 (24.4%)
Reverse2 (1.1%)6 (5.0%)
Questionable5 (2.7%)4 (3.4%)
Comfort of shower facilitiesAttractive15 (8.2%)11 (9.2%)16.353 **IndifferentOne-dimensional0.480.47−0.48−0.58
One-dimensional64 (35.2%)43 (36.1%)
Must-be15 (8.2%)24 (20.2%)
Indifferent72 (39.6%)38 (31.9%)
Reverse11 (6.0%)0 (0.0%)
Questionable5 (2.7%)3 (2.5%)
Note: * p < 0.05, ** p < 0.01, *** p < 0.001.
Table 9. Confirmative factor analysis.
Variables and Measurement ItemsStandardized Factor LoadingAverage Variance ExtractedComposite Reliability
SpecializationBehavior 0.9460.986
I spend more time than others0.742
I Participate more often than others0.762
I spend a lot of money0.794
I have a wide range of equipment0.812
I have more experience than others0.755
Knowledge and skill 0.9400.987
I have a lot of knowledge.0.797
I can explain the principle.0.783
I have acquired a skill.0.783
I have a high standard.0.813
Commitment 0.9380.987
It’s my true self.0.701
It means a lot to me.0.749
There are many acquaintances related to marine sports.0.730
Whenever I have time, I go to marine sports.0.816
My life revolves around marine sports.0.833
Perceived riskCognitive risk 0.9440.985
It will probably have negative consequences.0.814
It will have a negative impact.0.835
An unexpected accident will happen.0.820
It will negatively affect my quality of life.0.850
Emotional risk 0.9450.985
I somehow don’t feel easy about it.0.822
It feels scary0.908
I’m worried.0.857
I’m nervous for some reason.0.736
Note: All factor loadings were significant (p < 0.001).
Table 10. Descriptive statistics and correlations.
Variables1234
1. Specialization(0.970)
2. Perceived risk0.096 (0.973)
3. Customer satisfaction coefficient−0.160 **−0.327 **
4. Customer dissatisfaction coefficient0.192 **0.510 **−0.677 **
Average3.4122.6240.390−0.333
Standard Deviation0.79890.94070.30010.2998
** p < 0.01. No. Values in parentheses are the square root of the AVEs of the corresponding constructs.
Table 11. Significance analysis of direct effect in hypothetical models.
Hypo. No.PathBβSEtpHypothesis
Adoption
H2-1Specialization → Customer Satisfaction Coefficient−0.03−0.0820.021−1.4580.145rejected
H2-2Specialization → Customer Dissatisfaction Coefficient0.030.0810.0191.5740.115rejected
H3-1Perceived risk → Customer Satisfaction Coefficient−0.138−0.3600.020−6.823 ***0.000accepted
H3-2Perceived risk → Customer Dissatisfaction Coefficient 0.1910.4970.0209.646 ***0.000accepted
*** p < 0.001.
Disclaimer/Publisher’s Note: The statements, opinions and data contained in all publications are solely those of the individual author(s) and contributor(s) and not of MDPI and/or the editor(s). MDPI and/or the editor(s) disclaim responsibility for any injury to people or property resulting from any ideas, methods, instructions or products referred to in the content.

