Article

The Impacts of Land Use Changes on Water Yield and Water Conservation Services in Zhangjiakou, Beijing’s Upstream Watershed, China

1
Department of Municipal and Environmental Engineering, Hebei University of Architecture, Zhangjiakou 075000, China
2
Hebei Key Laboratory of Water Quality Engineering and Comprehensive Utilization of Water Resources, Hebei University of Architecture, Zhangjiakou 075000, China
3
Key Laboratory of Agricultural Water Resources, Center for Agricultural Resources Research, Institute of Genetics and Developmental Biology, Chinese Academy of Sciences, Shijiazhuang 050021, China
*
Author to whom correspondence should be addressed.
Sustainability 2023, 15(14), 11077; https://doi.org/10.3390/su151411077
Submission received: 7 May 2023 / Revised: 17 June 2023 / Accepted: 11 July 2023 / Published: 15 July 2023

Abstract

:
The Water Conservation Functional Zone and Ecological Environmental Supporting Zone (the Capital Two Zones in China), Zhangjiakou (ZJK) City, situated in China, has played a key role in mitigating water scarcity pressure on Beijing via delivering sustainable and high-quality water yield, as well as water conservation services aimed at maintaining the ecological functions of the Capital Two Zones. However, the changing mechanism for both water yield and water conservation services instigated by the combined impacts of human activities and climate change remains poorly understood. In this study, we used the Integrated Valuation of Ecosystem Services and Trade-offs Tools (InVEST) model to analyze the changes in water yield and water conservation services, revealing the impacts of different land use scenarios. The results showed significant forest and impervious land area increment, while the water surface area decreased sharply from 1990 to 2020, with obvious urbanization expansion in ZJK during the period. Average annual water yield and water conservation from 1990 to 2020 were recorded at 48.98 mm and 2.35 mm, respectively. Precipitation emerged as the primary driver of water yield and conservation service changes, while the south of ZJK generally exhibited higher water yield and conservation service than the north of ZJK. Results also indicate that grassland had the highest water yield, with an average of 56.60 mm, followed by forest (55.66 mm) and shrub (55.07 mm). Further, the forest had the highest water conservation value (3.73 mm), followed by shrub (2.56 mm), and grassland (2.37 mm), respectively. The return of cropland to forest scenario had the most substantial decrease in water yield. Findings suggest that precipitation has a direct impact on water yield and conservation services via the amount of atmospheric water input, while land use alteration contributes to changes in regional-scale water.

1. Introduction

Ecosystem services refer to the benefits that humans derive from natural ecosystems [1], which are essential for human survival and social development, particularly in relation to water resources [2]. The water yield service is a kind of ecosystem provisioning service that represents the amount of water available for direct human use [3] and is defined as the difference between precipitation and evapotranspiration [4]. The water conservation service is a kind of ecosystem regulating service that refers to the process and ability of ecosystems to retain water through interception, infiltration, and storage of precipitation at a certain spatial and temporal scale, including through forest canopies, apoplast, soil, lakes, and reservoirs. The ability of water conservation not only meets the ecosystem’s demand for water, but also provides water resources to external and downstream areas [5]. As the demand for water for human living intensifies [6,7], assessment of regional water yield and water conservation has become a key topic of research, vital for the rational use of water resources and promotion of sustainable regional development [8].
The formation of water resources is a complex process influenced by various factors such as precipitation intensity, soil permeability, slope, and vegetation. Consequently, evaluating water yield is highly dependent on models that can capture or provide a simplified quantitative approach for the main processes shaping water resources [9]. Currently, two primary methods are used to assess water yield and conservation—the water balance method [10] and hydrological model-based methods [11]. The latter includes models such as Soil and Water Assessment Tool [12,13], the Integrated Valuation of Ecosystem Services and Trade-offs Tools (InVEST) [14,15], and the Artificial Intelligence for Ecosystem Services [16,17]. In particular, the InVEST model is a visualization tool capable of quantitatively assessment ecosystem services across various scenarios. This model is widely used globally and regionally to evaluate water yield and ecosystem services due to its ability to use fewer input data when compared to other models [18].
Climate change and land-use change are two major factors influencing water yield and water conservation [19]. Climate change is highly sensitive to local hydrology [20], while changes in land use can impact water conservation and water yield by altering ecosystem structure and function, including through various land-use types, scales, and intensities [21]. Thus, land use change can partly reflect the impact of human activities [22]. Studies have found that incorporating land use change scenarios into water yield evaluation can explain past dynamics and support decision-making for the future [23]. Many models, e.g., the GeoSOS-FLUS model and the Markov-PLUS model, were used to simulate future land scenarios. However, model-based scenarios evaluation generally only reflect land use change [23,24], making it difficult to understand the impact of specific land use conversions on water yield. To address this, scenario design methods based on the current land use landscape are implemented [25]. To explore the impact of climate change on water conservation and water yield, scenarios were designed while keeping other conditions consistent. Long time series analysis is crucial for understanding temporal and spatial variability in water yield and water conservation due to the lack of high-quality annual data. Fully understanding these dynamics can better inform policies and management decisions [25].
The Zhangjiakou (ZJK) City located in the northwestern region of the Beijing City, playing a significant role in water conservation and ecological environment support functions in the Beijing–Tianjin–Hebei region. Over the past two decades, ZJK has implemented several national ecological construction projects, including the “Grain for Green” project, Beijing-Tianjin Sand-storm Source Project, and Three North Shelterbelt Forest Project, resulting in an increase in forest coverage rate and a decrease in land sanding. Based on the InVEST model, Liu et al. [25] assessed the impacts of land use changes on water-related ecosystem services in the northern area of Hebei province. Their findings indicate that forest expansion and grassland shrinkage have significantly altered local water-related ecosystem services, resulting in moderate declines in water purification and water yield, but a significant enhancement in soil conservation. In a separate study, Liu et al. [26] quantified the impacts of land use changes and climate dynamics on water yield in the agro-pastoral ecotone of northern China. They found that annual water yield increased and exhibited an upward trend during 2000–2019, with climate change and land-use changes responsible for 88% and 12% of water yield variations, respectively. Another study by Li et al. [27] analyzed the spatial and temporal differences in water conservation function in ZJK based on the InVEST model. Their findings indicated that ZJK’s water yield showed a weak upward trend, while the water conservation rate showed a slight downward trend in the past 35 years (1981–2015), and precipitation was the main influencing factor for the change in water yield and water conservation, followed by land use change. An evaluation of water conservation function in ZJK by Huang et al. [28] based on the InVEST model found that precipitation is the main restricting factor for influencing ZJK’s water conservation, and the contributions of different land use to water conservation are different, with grassland contributed the most. However, few studies have assessed the long-term impact of climate and land use changes on water yield and water conservation in ZJK, and little research takes land use change scenarios into account. This study aims to fill this gap by quantitatively estimating the spatial and temporal variability of water yield and water conservation in ZJK from 1990 to 2020 based on the InVEST model. Furthermore, scenarios were set to reveal the impact of climate change and land use changes on water yield and water conservation. The results of this study may provide valuable data and scientific references for the construction of ZJK Capital Water Conservation Functional Area and Ecological Environment Support Area (the Capital Two Zones).

2. Study Area, Data, and Methods

2.1. Study Area

ZJK is geographically situated in the northwestern region of Hebei Province, China, between the longitude 113°50′~116°30′ E and latitude 39°30′~42°10′ N (Figure 1), covering an area of 36,965 km2. It is located at the junction of the Inner Mongolia Plateau and the North China Plain, with high elevation in the northwest and low elevation in the southeast [28]. Based on the topographical transition zone between the plateau and the plain, ZJK could be divided into two distinctive natural regions: North Zhangjiakou (NZJK) and South Zhangjiakou (SZJK). The NZJK is arid with an average annual precipitation ranging from 277 to 496 mm, and its primary vegetation types are cropland and grassland. Meanwhile, the NZJK area experiences an annual average air temperature of between 1 °C and 3 °C. In contrast, SZJK receives abundant precipitation compared to NZJK, with an average annual precipitation between 408 to 651 mm, and an annual average air temperature ranging from 6 and 8 °C, and its primary vegetation types are forest and cropland. Generally, ZJK has a total precipitation of 17.21 billion m3, while with the total water resources stand at 1.52 billion m3, according to Hebei’s 2020 Water Resources Bulletin. While both Beijing and ZJK, located within the Haihe River basin, share the same ecological boundary and face significant water scarcity challenges, ZJK plays a crucial role in providing water conservation and ecological support to Beijing. Therefore, the assessment of water yield and water conservation capacity of ZJK is crucial for its conservation efforts and supporting Beijing’s ecological environment [11].

2.2. Data

The input data for driving the InVEST model include land use, precipitation, reference evapotranspiration, digital elevation model (DEM), soil, and watershed boundaries data. The specific data sources and their detail information are shown in (Table 1).

2.3. Methods

2.3.1. Calculate Water Yield Based on the InVEST Model

The water yield in ZJK was assessed using the InVEST model [14], which integrates regional climate, topography, land use type, and soil characteristics to calculate water yield based on the Budyko water-heat coupling equilibrium assumption [26,30]. The total annual water yield (Y) for each pixel (x) in the study area is estimated as the annual precipitation (Px) in the total catchment area minus the actual annual evapotranspiration (AETxj) in the total catchment area, which is based on the principle that the difference between the input precipitation and the output actual evapotranspiration of a grid in the basin is the water yield of the grid, and the more water yield per unit area indicates the higher water yield [31,32].
Y x j = ( 1 A E T x j P x ) × P x
where Yxj is the water yield (mm) on raster pixel x of type j land cover; Px is the total annual precipitation on raster pixel x; AETxj is the actual annual evapotranspiration on raster pixel x of type j land cover [33]. Where AETxj/Px is the ratio of actual evapotranspiration to precipitation, which is calculated based on the improved method of Zhang [34].
A E T x j P x = 1 + w x + R x j 1 + w x R x j + ( 1 R x j )
w x = Z × A W C x P x + 1.25
R x j = k i j + E T 0 P x
A W C x = M i n ( M S D x , R D x ) × P A W C x
P A W C x = 55.509 0.132 × S A N 0.003 × ( S A N ) 2 0.55 × S I L 0.006 × ( S I L ) 2 0.783 × C L A + 0.007 × ( C L A ) 2 2.688 × C + 0.501 × ( C ) 2
E T 0 = 0.0013 × 0.408 × R A × ( T a v g + 17 ) × ( T D 0.0123 P ) 0.76
where Rxj is the ratio of potential evapotranspiration ET0 to precipitation Px, Budyko dryness index; wx is a dimensionless non-physical parameter describing natural climate-soil properties, with an upper limit of 5, which represents the ratio of annual water demand of vegetation to annual precipitation. Z is the seasonal constant, the value range is 1–30, and the total water resources in the Hebei Provincial Water Resources Bulletin are used to calibrate the value; AWCx is the soil available water capacity; MSDx is the maximum root burial depth of the soil; RDx is plant root depth for different land use types (mm), Kij is the plant evapotranspiration coefficient; ET0 is the potential evapotranspiration in grid x (mm/d), calculated by the Hargreaves formula, and RA is the solar atmospheric top layer radiation (MJ/m2). Tavg is the mean value of maximum and minimum temperature in the study area (°C), TD is the difference between the average maximum and minimum temperature in the study area (°C); PAWCx is the plant available water capacity (%), SAN is the soil sand particle (%), SIL is the soil powder particle (%), CLA is the soil clay particle (%), and C is the soil organic carbon content [35].

2.3.2. Calculation of Water Conservation

Based on the results of the water yield derived from the InVEST model, the results of the water conservation of the study area were extracted, analyzed, and calculated by the ArcMap software, and the specific calculation method was:
W C = min ( 1 , 249 v ) × min ( 1 , 0.9 T I 3 ) × min ( 1 , K S 300 ) × Y
T I = lg ( D r a i n a g e A r e a S o i l d e p t h × P e r c e n t s l o p e )
ln ( K s ) = 20.62 0.96 × ln ( C l a y ) 0.66 × ln ( S a n d ) 0.46 × ln ( O C ) 8.43 × B D
where: WC is the water conservation (mm); v is the flow rate coefficient; Y is the water yield (mm); Ks is the soil saturation hydraulic conductivity (cm/d); TI is the topographic index; Drainage Area indicated by the number of catchment grids; Soil_depth is the soil depth (mm); Percent_slope is the percentage slope (%), Clay is the soil clay content (%), Sand is the soil sand content (%), OC is the soil organic carbon content (%), and BD is the soil bulk weight (g/cm3) [9,36].

2.3.3. Trend Analysis

Based on the linear regression analysis method of pixel, the temporal and spatial change trend of water yield and water conservation of each raster can be calculated through the numerical changes in a single pixel within a fixed time, and the trend line slope of the multi-year linear regression equation of a single pixel is the interannual change rate [37]. In this study, the method was used to analyze the change trend of water yield and water conservation in ZJK from 1990 to 2020 as follows:
s l o p e = n × i = 1 n i × W Y i i = 1 n i i = 1 n W Y i n × i = 1 n i 2 ( i = 1 n i ) 2
s l o p e = n × i = 1 n i × W R i i = 1 n i i = 1 n W R i n × i = 1 n i 2 ( i = 1 n i ) 2
where slope is the slope of the trend line, the interannual rate of change in water yield and water conservation, in units (mm/a). WYi indicates the water yield value (mm) in the i year; WRi indicates the water conservation value (mm) in the i year; i is the annual variable, i = 1, 2, 3,......, 31; and n = 31 is the number of years monitored. When slope > 0, it means that the water yield and water conservation are increasing, and vice versa.

2.3.4. Scenarios Settings

In order to obtain the impact of land use change on water yield, different land use change scenarios were designed. Based on the land use and DEM data in ZJK in 2020, we transform the original raster into the scenario raster that we interested based on reclassification tool in ArcMap. The detail information of future vegetation restoration scenarios was shown in Table 2.
To further explore the effects of precipitation and land use change on water yield and water conservation, two scenarios were set up in this study. Scenario 4 (S4): the precipitation data in 1990 was kept consistent, while land use data were changed to 2005 and 2020, respectively. Thus, the influence of land use change on water yield and water conservation from 1990–2005 and 1990–2020 can be estimated. Scenario 5 (S5): land use data in 1990 remain unchanged during the simulation; only change the precipitation data to 2005 and 2020, respectively. Compared with the 1990 baseline data, the impact of precipitation changes on water yield and water conservation from 1990 to 2005 and 1990 to 2020 can be revealed.
The extent to which land use change and precipitation change contribute to changes in water yield and water conservation in ZJK can be quantified by the following equation [38]:
R l = Δ l Δ p + Δ l × 100 %
R p = Δ p Δ p + Δ l × 100 %
where Rl indicates the contribution rate of land use change to regional water yield or water conservation change. Rp indicates the contribution rate of precipitation change to changes in regional water yield or water conservation. ∆l and ∆p represent the changes in water yield or water conservation under the land use change scenario and the precipitation change scenarios, respectively.

3. Results

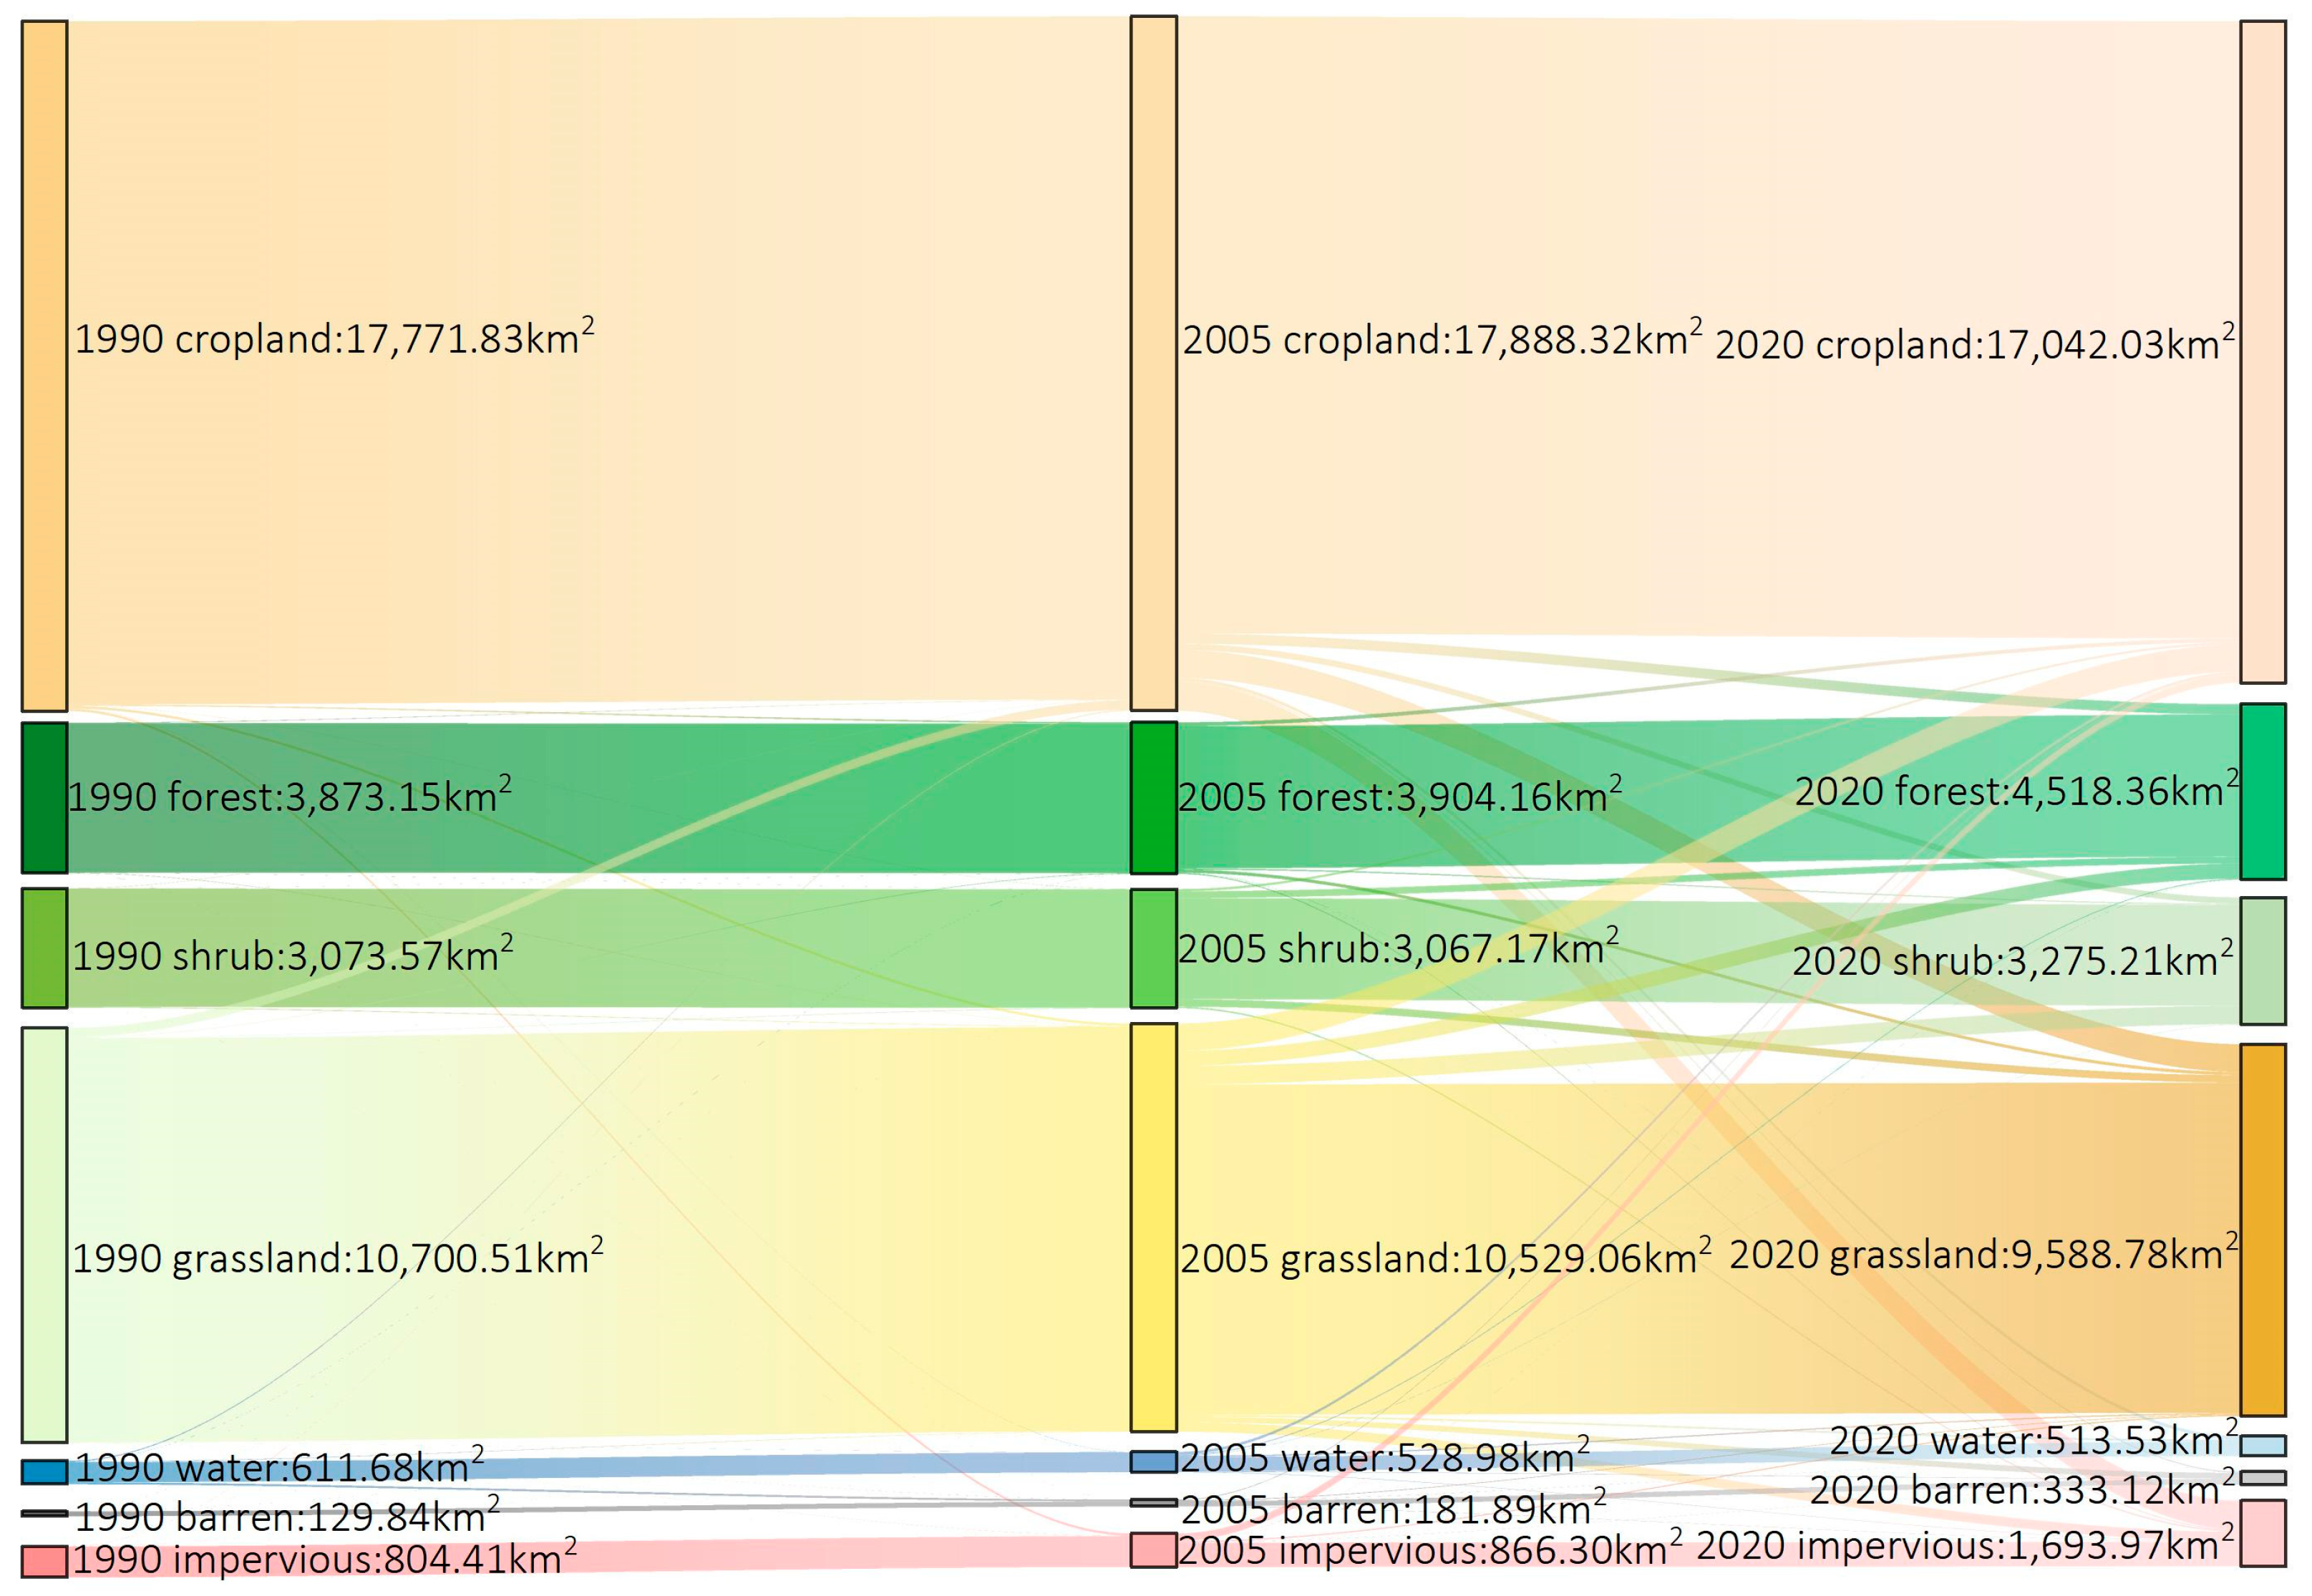
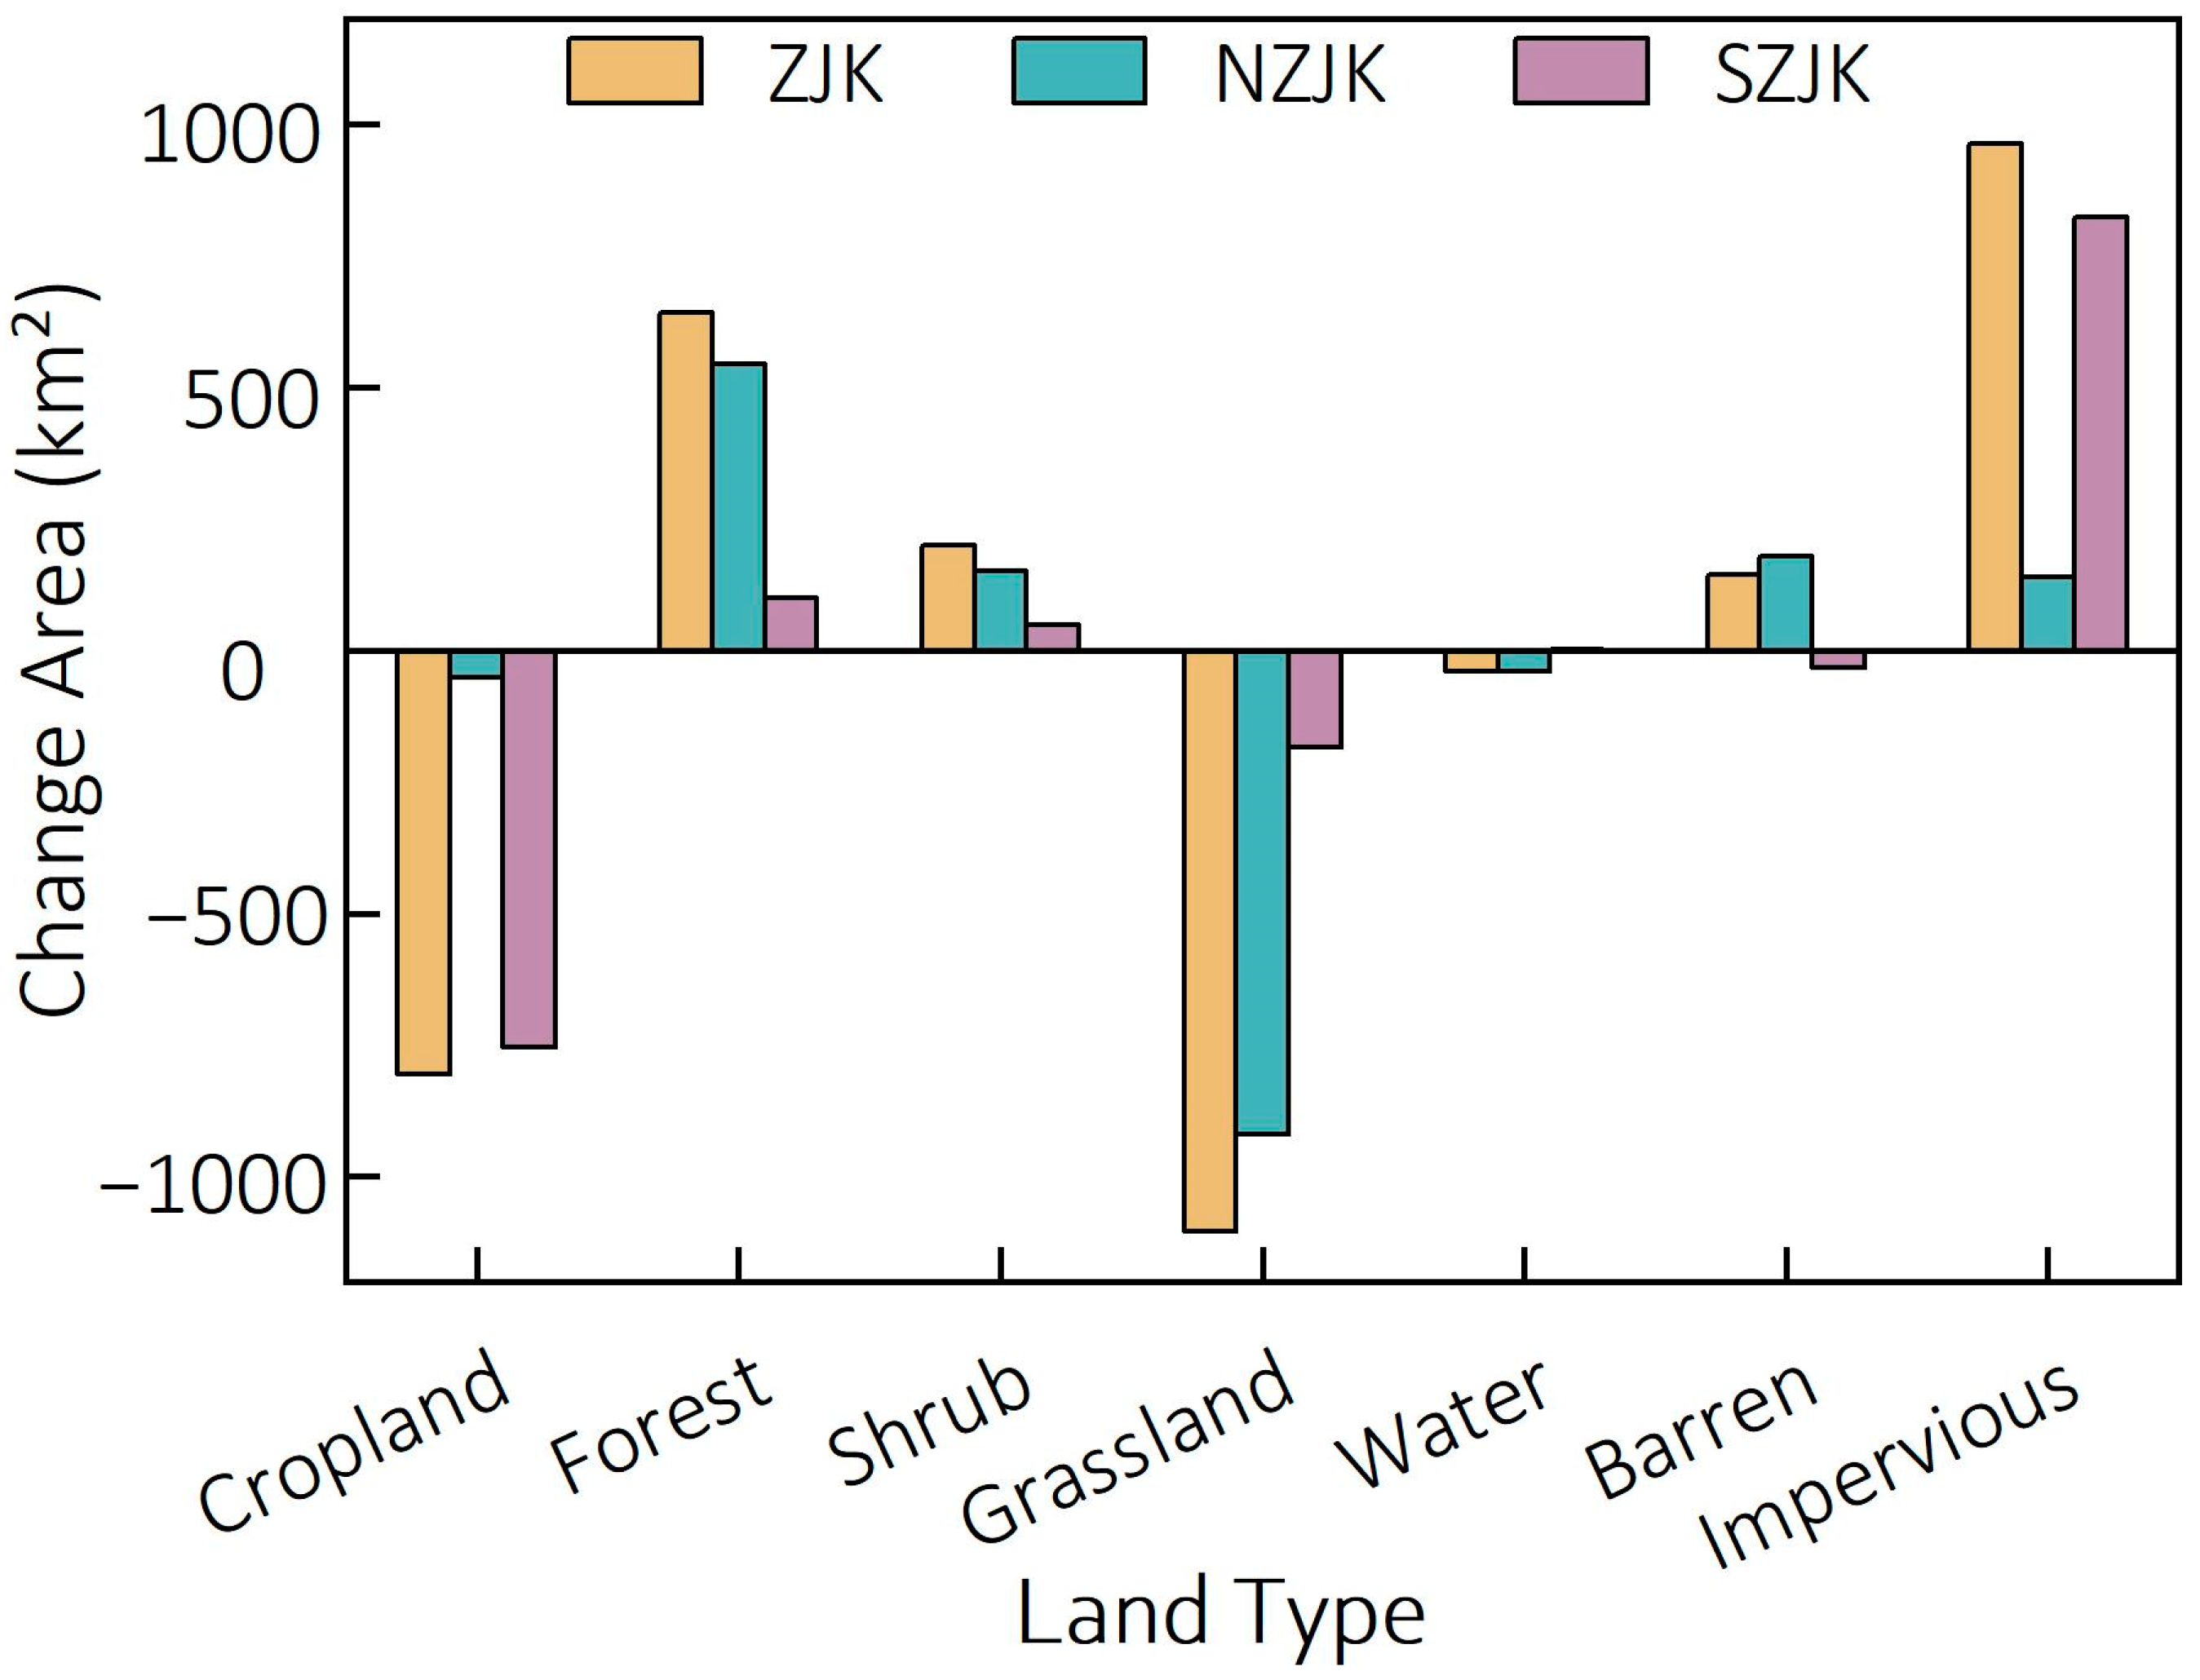
3.1. Land Use Change Characteristics in ZJK

Land use types in ZJK were generally divided into seven categories, including cropland, forest, shrub, grassland, water, barren, and impervious (Figure 2). Different land use types in ZJK changed and transformed significantly from 1990 to 2020 (Figure 2, Figure 3 and Figure 4). Overall, cropland covers the largest area from 1990 to 2020, while water occupy relative smaller area compared with other land use types. However, the area of cropland and grassland decreased while the area of forest and impervious increased in ZJK from 1990 to 2020. The area of cropland decreased by 729.80 km2, the area of grassland decreased by 1111.73 km2, and the area of water decreased by 98.15 km2 from 1990 to 2020, respectively. However, the forest area increased by 645.21 km2, the shrub area increased by 201.64 km2, the impervious increased significantly by 889.56 km2, and the area of barren increased by 203.28 km2 during this period, respectively.
Generally, the changes in land use in the north and south of ZJK are generally consistent but with little different. Forest, shrub, barren and impervious in the NZJK are significantly increased, with an increase of 546.83 km2, 151.72 km2, 237.23 km2, and 141.04 km2, respectively; while the area of grassland, cropland and water were decreased, with a decrease of 926.37 km2, 51.37 km2, and 99.30 km2, respectively. Moreover, forest, shrub, impervious and water in SZJK are increased, with an increase of 98.31 km2, 49.76 km2, 748.90 km2, and 1.15 km2, respectively; while the area of cropland, grassland, and barren decreased by 679.00 km2, 184.86 km2, and 33.79 km2, respectively (Figure 3).

3.2. Spatiotemporal Changes in Water Yield and Water Conservation

3.2.1. Calibration and Validation of InVEST

According to the data of the Hebei Provincial Water Resources Bulletin, ZJK covers an area of 36,956 km2, with multi-year average water resource of 14.27 billion m3. Repeated simulation of the calculation of water yield, when Z = 4.4, can ensure that the annual water yield and the total water resources are close, the average water output is 15.60 billion m3, the relative error is 9%. The results of the InVEST model have confidence.

3.2.2. Spatiotemporal Changes in Water Yield

Water yield from 1990 to 2020 was estimated based on the InVEST model driving with climate data and annually land use data in ZJK (Figure 5). Generally, annual average water yield in ZJK showed a decreasing trend, with an average water yield of 48.98 mm and an average total water yield of 18.10 billion m3, respectively. The highest water yield is 106.13 mm in 1990, followed by 103.61 mm in 2016. The changes in water yield are generally consistent with the changes in precipitation that there was abundant precipitation in 1990 and 2016 as well based on the statistics of the Water Resources Bulletin. Regarding to different subregions, the average water yield from 1990 to 2020 in the NZJK and the SZJK are 40.45 mm and 53.23 mm, and the average total water yield from 1990 to 2020 in the NZJK and the SZJK are 5.20 billion m3 and 12.30 billion m3, respectively. The average water yield and the spatial trend of the water yield in ZJK from 1990 to 2020 was show in (Figure 6). Spatially, water yield from 1990 to 2020 mainly occurs in SZJK, where with the highest forest cover in the SZJK, while the water yield of these high-value areas showed a downward trend. However, the water yield of grasslands in the western region increased. while the water yield of grassland in the western region showed an increasing trend. Overall, water yield in the eastern region of ZJK showed a downward trend. The average water yield in the NZJK is low, and it is increasing in the western region of the NZJK.

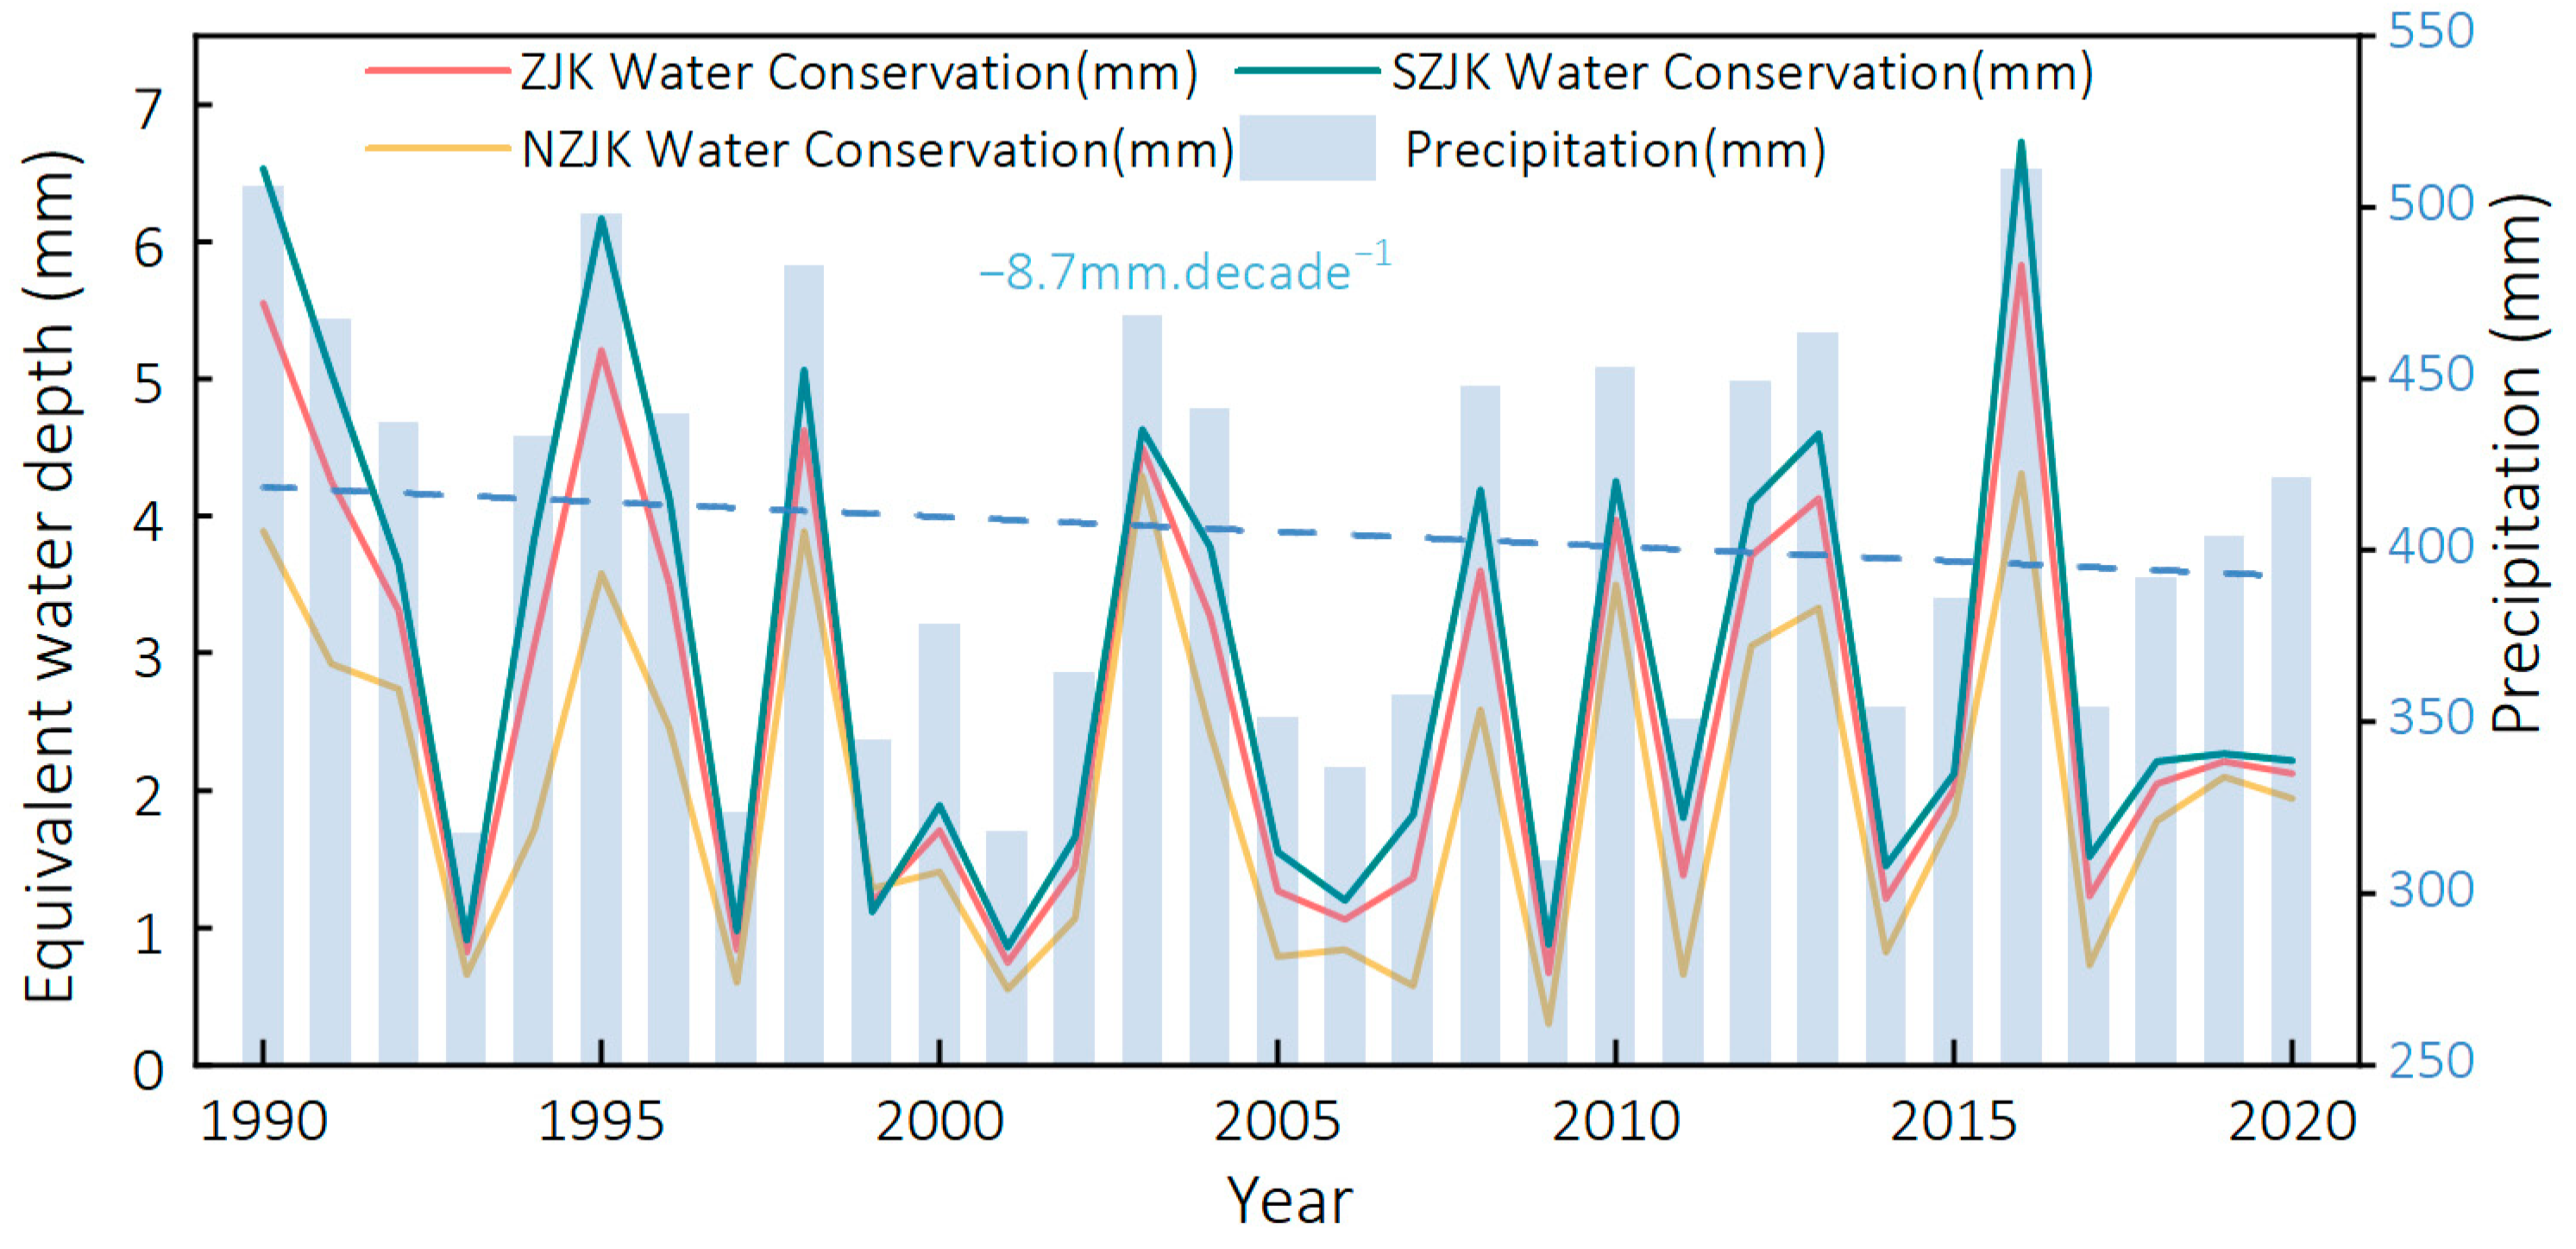
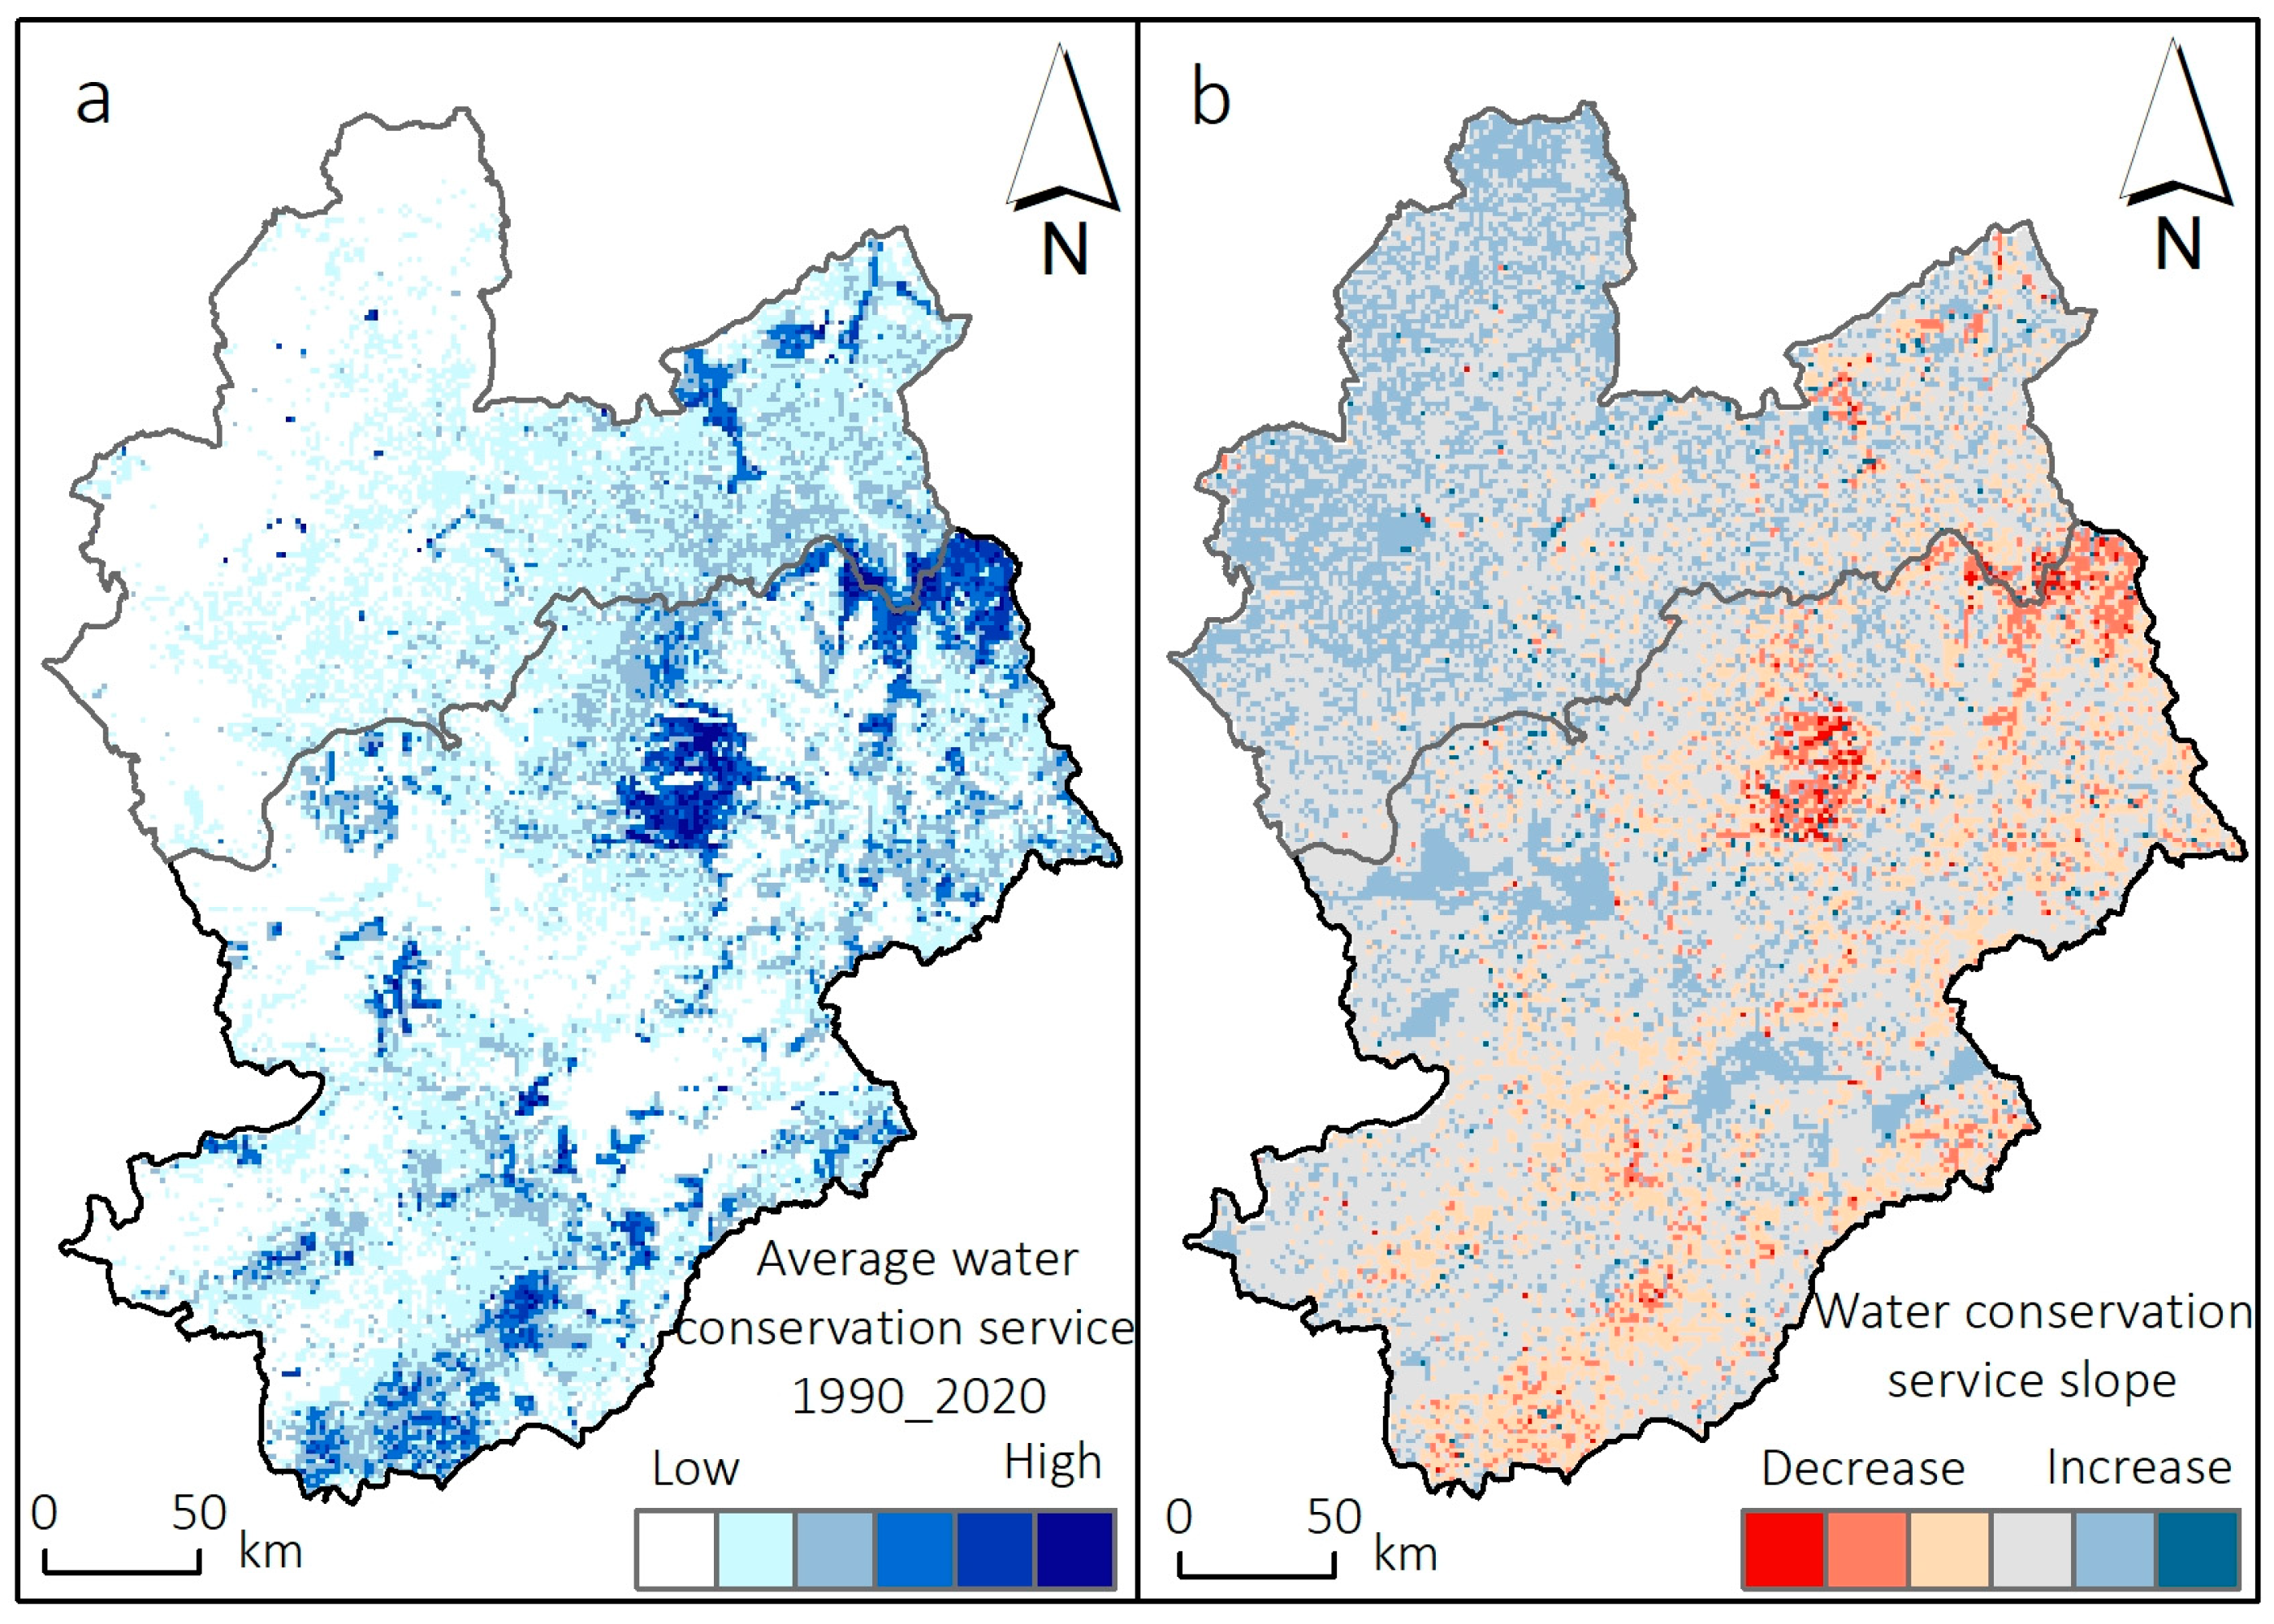
3.2.3. Spatiotemporal Changes in Water Conservation

Generally, the water conservation capacity in ZJK shows a decreasing trend from 1990 to 2020 (Figure 7). Specifically, average water conservation capacity in ZJK from 1990 to 2020 is 2.64 mm, equal to the water volume of 0.98 billion m3. The highest water conservation capacity occurs in 2016, with average water conservation capacity is 5.83 mm and the total water conservation capacity is 2.16 billion m3. Average water conservation capacity in SZJK is higher than that in the NZJK. Average water conservation capacity and average total water conservation in the NZJK from 1990–2020 are 2.01 mm and 0.28 billion m3; and average water conservation capacity and average total water conservation in the SZJK from 1990–2020 are 3.00 mm and 0.69 billion m3, respectively. Both the NZJK and the SZJK have the highest water conservation capacity in 2016. The water conservation capacity is 4.31 mm and 6.73 mm in the NZJK and the SZJK, respectively, and with the total water conservation capacity in the NZJK and the SZJK are 0.60 billion m3 and 1.56 billion m3, respectively. In terms of water conservation in the whole ZJK, although water conservation in the SZJK occupies relatively higher proportion compared with that in the NZJK. The average water conservation and the spatial trend of water conservation in ZJK from 1990–2020 were shown in (Figure 8). Spatially, the distribution of water conservation and their trends are generally consistent with their distributions of water yield (Figure 7 and Figure 8), with the increasing trend of water conservation occurs from west to east.

3.2.4. Response of Land Use Type in Annual Water Yield and Water Conservation

Land use change is a factor that can affect the nature, processes, and components of ecosystem services, and is an important driver for changing water yield and water conservation function. The impacts of different land use changes on water yield and water conservation were further analyzed based on zonal statistics, the contribution to water yield and water conservation in 6 years (1990, 2000, 2005, 2010, 2015, 2020) were extracted regarding to different land use types. Grassland is the largest contributor to water yield, followed by forest, and its order from high to low is grassland > forest > shrub > impervious > barren > cropland > water (Figure 9a). Due to the ability of forest to intercept precipitation is greater than that of grassland, so forest is the largest contributor to water conservation, followed by shrub and grassland, with 2.57 mm and 2.38 mm, respectively. The order from highest to lowest is forest > shrub > grassland > cropland > impervious > barren > water (Figure 9b).

3.3. Projections of Water Yield and Water Conservation under Changes in Land Use Scenarios and Climate Scenarios

Water yields under the S, S1, S2 and S3 vegetation restoration scenarios are 36.89 mm, 36.38 mm, 36.36 mm, and 36.76 mm based on the InVEST model, respectively. The future forest and grassland restoration scenarios (S2 and S3) showed decreases in water yield compared with the 2020 baseline. Water yield in ZJK decline 0.51 mm, or 0.19 billion m3 under the water buffer zone scenario, the forest increase 969 km2 (+13.73%) by adding 100-m buffer strips among the rivers. Water yield was decline in the returning farmland to forests scenario by the forest increase 560 km2 (+7.93%) and consequent decreased the water yield by 0.53 mm, or 0.20 billion m3. After the transition from cropland to grassland, the grassland increases 969 km2 (+5.89%) leading to a moderate decline in water yield by 0.13 mm, or 0.048 billion m3.
Under the scenarios of constant land use and changing precipitation (Figure 10a,c), the average water yield depths in 2005 and 2020 for S4 are 26.55 mm and 56.26 mm, which are 79.58 mm and 49.87 mm lower than the real situation in 1990, and the total water yield are 2.94 billion m3 and 1.84 billion m3, respectively. The average depth of water yield of each category changes obviously and shows a decreasing trend, which is consistent with the regularity of precipitation; the depth of water conservation in 2005 and 2020 are 1.39 mm and 2.96 mm, which are reduced by 4.16 mm and 2.59 mm, respectively, compared with the real situation in 1990, and the total water conservation is reduced by 0.15 billion m3 and 0.10 billion m3, respectively. The simulation results show that when the land use cover is kept constant and the precipitation changes, the water yield and water conservation change significantly.
Under the scenario of constant precipitation and change in land use (Figure 10b,d), the average water yield depths in 2005 and 2020 for S5 are 105.21 mm and 104.62 mm, which are 0.92 mm and 1.51 mm lower than the real scenario in 1990, and the total water yield in ZJK is 0.34 billion m3 and 0.56 billion m3 lower, respectively. The average water yield depth of each category does not change significantly; the water yield depth in 2005 and 2020 is 5.76 mm and 5.87 mm, respectively, which increases 0.21 mm and 0.32 mm, respectively, compared with 1990, and its total water yield increases 0.078 billion m3 and 0.12 billion m3, respectively, when precipitation remains unchanged and the land use changes, the changes in water yield and water conservation are not significant.
During the period from 1990–2005, the contributions of precipitation change and land use change to water yield were −98.85% and −1.1%, respectively, and the contributions to water conservation were −105.31% and 5.3%, respectively; during the period from 1990–2020, the contributions of precipitation change and land use change to water yield were −97% and −2.93%, respectively, and the contribution to water conservation was −114.09% and 14.1%, respectively. The effect of precipitation change on water yield and water conservation is more significant, while the effect of land use change on water yield and water conservation is not significant.

4. Discussion

4.1. Changes in Water Yield and Water Conservation over the Past 31 Years

From 1990–2020, the “Grain for Green” project has yielded significant results. However, due to the unreasonable land reclamation and abandonment, overgrazing, and other human activities, surface water in the NZJK has been shrinking year by year [25], leading to drying up of waters, decreased water area, and increased impervious area. With the expansion of ZJK urbanization, our focus must be on both increasing water yield, the capacity of an ecosystem to supply water, and water conservation, the storage capacity of water resources [26]. The type of land use significantly determines the water conservation capacity of soil, including soil saturation water conductivity, depth, and plant available water conservation, with forests experiencing a decrease in water yield due to their deeper root systems and stronger transpiration. Grasslands and croplands have similar regulating effects on precipitation compared to forests but differ in plant species and root depth. The area of barren land increases while the area of impervious land significantly elevates, leading to a slight increase in water yield and conservation capacity. While different land types have varying impacts on water yield and conservation capacity, overall, changes remain stable and insignificant.

4.2. Implications of Revegetation on Water Yield and Water Conservation

Water yield and water conservation are vital ecosystem services that play a crucial role in the ecohydrological cycle. These services not only determine the amount of water available to humans from an ecosystem, but also closely maintains regional water security [9]. The correlation between water yield, water conservation, evapotranspiration, precipitation, land use, and human activities was analyzed over the study period [39]. The results demonstrate that the spatiotemporal distribution of water yield and water conservation is influenced by precipitation and land use change. Precipitation is a key factor affecting changes in water conservation. High-intensity human activities alter land use and subsequently affect the flow production concentration, leading to a decrease in water yield [40]. A denser vegetation cover decreases the likelihood of runoff formation, but subsurface runoff increases, thereby fostering water availability. A decline in water yield does not necessarily imply a reduction in ecological supply. Changes in land use type determine the soil’s water conservation capacity, with different saturation water conductivity, soil depth, and plant available water conservation varying across different land use types. Transferring land between different use types may result in a shift in water yield and water conservation, with forest cover experiencing a decrease in water yield due to its effective interception of precipitation through its deeper root system and stronger transpiration. Conversely, the increased forest area improved water conservation capacity. Grassland and cropland have similar precipitation through its regulation effects as forests, with variations dependent on plant species, density, and root depth. Barren land areas experience an increase in both their water yield and water conservation capacity, while the expansion of impervious areas leads to slight improvements. Although the impacts of different land types on water yield and conservation capacity vary, the overall change remains stable.
The effect of afforestation on soil and water conservation function exhibits clear spatial heterogeneity. The implementation of “Grain for Green” projects has generally resulted in a significant decrease in the water resources yield capacity of ecosystems, which is consistent with previous research [41]. In the western region of the ZJK area, where returning cropland to forest projects have been recently implemented, water yield tends to increase, but due to the presence of abundant forest and grassland resources, the water yield potential is reduced as precipitation is consumed by vegetation. Forests intercept precipitation, increase solar radiation reflection, and humidify air through plant evapotranspiration. Trees also provide shading, resulting in a relatively moist soil surface; however, their own transpiration can reduce surface runoff. While increasing in forests and grasslands improves water conservation capacity, high levels of vegetation can reduce the water yield function of ecosystems. Artificial afforestation typically requires additional soil moisture to support rapid growth, which causes trees to deeply root underground to absorb groundwater and lower the water table. However, in semi-arid and arid regions, rainwater cannot replenish groundwater promptly, leading to soil drying near the surface and subsequently increased wind and water erosion. Despite the buffer zone’s impact on reducing water yield, it can protect river quality and enhance soil and water conservation around water sources. Revegetation (including afforestation) reduces water yield but has a positive influence on the water cycle by accelerating water vapor exchange, as research has shown.
In this study, the water yield and water conservation in the SZJK were found to be the primary contributors to the overall ZJK. While some extreme years saw a slight decrease, on average the SZJK still had higher levels of water yield and water conservation compared to the NZJK. The reduction in water availability in SZJK is linked to the area’s unique geographical location, which has resulted in an increase in barren land and a decrease in available water resources. Conversely, while the cropland in NZJK is suitable for mechanical planting, severe water scarcity has led to major challenges for agricultural activities. The western part of the NZJK has seen an increase in water yield and conservation, highlighting the need for rational land resource management to protect the region’s water resources. For this reason, strengthening ecological construction efforts in NZJK, including the utilization of barren lands, is particularly important [42]. Additionally, there is considerable spatial heterogeneity in the impact of afforestation on soil and water conservation functions. In line with the “Grain for Green” policy, this study recommends prioritizing forestation on arable land with slopes greater than 15°, where mechanical planting is not practical. Overall, these findings can offer guidance for policymakers seeking to improve water conservation and land management in these regions.

4.3. Limitations and Uncertainties

The InVEST model operates on the principle of water balance, and its annual assessment only consider the total annual production, omitting any variations in runoff during different periods; Moreover, the effects of surface runoff on local water conservation differ between dry and rainy seasons, an aspect not accounted for in the model. Additionally, the model solely considers natural factors and does not address the impact of human activities on water resource conservation. Despite the uncertainties associated with its realistic simulation, the InVEST model provides a straightforward structure with accessible parameters, enabling it to reflect the spatial characteristics of water catchment. Consequently, it has gained recognition among domestic and foreign scholars as a suitable tool for evaluating a range of ecosystem services [43]. However, future scenarios are likely to have more unpredictable elements, necessitating reliable data to validate results. Nonetheless, this study’s methodology and findings offer comprehensive insights into water yield and water conservation.
In this study, all results are presented in interannual units. The scenario simulation only considers the impact of a single land use change on water yield, without taking potential climate changes into account. Therefore, the results should only be used as a reference for managers. To improve the water-holding capacity of ecosystems, it is necessary to consider local climatic and environmental conditions and implement ecological protection and conservation policies. This requires taking into account natural, social, and policy factors to promote ecosystem diversity, stability, and sustainability. It is also important to evaluate the value of each land type in an integrated way, while ensuring the principle of ecological diversity. For instance, cropland cannot all be planted with trees or grass since farmers need to grow food and create economic value. Spatial heterogeneity exists between different regional ecosystems, which will affect the overall regional distribution, allocation, and utilization of water resources [44]. Therefore, to better understand spatial heterogeneity, quantitative evaluation of water conservation function and further exploration of temporal variation and spatial distribution patterns are the realistic needs. To this end, promoting forest, lake, and wetland restoration, and improving the fallow rotation system for cropland are crucial steps towards enhancing overall ecosystem health.

5. Conclusions

From 1990 to 2020, the area covered by forests and water increased, while impervious surfaces expanded due to urbanization. The average water yield and water conservation from 1990 to 2020 were 48.98 mm and 2.35 mm, respectively, with higher spatial distribution in SZJK as compared to NZJK. Different land use types had varying impacts on water yield and water conservation, with the highest water yield occurred in grassland (56.60 mm/a, 16.01%), followed by forest (55.66 mm/a, 15.62%), shrub (55.07 mm/a, 15.27%), impervious surface (54.96 mm/a, 15.24%), barren land (47.21 mm/a, 13.04%), cropland (45.19 mm/a, 12.53%), and water area (43.66 mm/a, 12.25%). Average water conservation and contribution rate to water conservation under different land use types, land use type with the highest water conservation is forest (3.73 mm/a, 29.43%), and followed by shrub (2.57 mm/a, 19.85%), grassland (2.37 mm/a, 18.23%), cropland (1.59 mm/a, 12.12%), impervious surface (1.12 mm/a, 8.58%), barren land (1.02 mm/a, 7.42%), and water area (0.57 mm/a, 4.29%). Precipitation was identified as the primary factor causing changes in water yield and water conservation, while land use distribution determined regional spatial changes. From 1990 to 2020, precipitation change contributed −97% and land use change contributed −2.93% to water yield, while precipitation change contributed −114.09% and land use change contributed 14.1% to water conservation. Temporal changes in water yield and water conservation were primarily caused by precipitation, while regional spatial changes were determined by land use distribution according to scenario simulations. Our findings suggest the need to afforest slopes > 15° and restore grassland > 6° for better water conservation, while grassland restoration is beneficial for water yield. Establishing regional vegetation restoration thresholds can reduce trade-offs between water supply and vegetation restoration consumption.

Author Contributions

Conceptualization, H.P.; L.Z. designed research; L.Z. and M.L. performed research; Y.W. and Y.L. collected related data; L.Z. writing—original draft preparation; Y.-J.S. and H.P. writing—review and editing. All authors have read and agreed to the published version of the manuscript.

Funding

This research was funded by the Hebei Provincial Key R&D Programme (No. 22377001D), Natural Science Foundation of China (No. 41701017) and the Science Foundation of Hebei Education Department (No. ZD2022015).

Institutional Review Board Statement

Not applicable.

Informed Consent Statement

Not applicable.

Data Availability Statement

Not applicable.

Acknowledgments

This study was supported by the Hebei Provincial Key R&D Programme (No. 22377001D), Natural Science Foundation of China (No. 41701017) and the Science Foundation of Hebei Education Department (No. ZD2022015).

Conflicts of Interest

The authors declare no conflict of interest.

References

  1. Costanza, R.; d’Arge, R.; de Groot, R.; Farber, S.; Grasso, M.; Hannon, B.; Limburg, K.; Naeem, S.; O’Neill, R.V.; Paruelo, J.; et al. The value of the world’s ecosystem services and natural capital. Nature 1997, 387, 253–260. [Google Scholar] [CrossRef]
  2. Ram, Y.; Kay Smith, M. An assessment of visited landscapes using a Cultural Ecosystem Services framework. Tour. Geogr. 2019, 24, 523–548. [Google Scholar] [CrossRef]
  3. Fan, M.; Shibata, H.; Chen, L. Spatial conservation of water yield and sediment retention hydrological ecosystem services across Teshio watershed, northernmost of Japan. Ecol. Complex. 2018, 33, 1–10. [Google Scholar] [CrossRef]
  4. Sun, G.; Zhou, G.; Zhang, Z.; Wei, X.; McNulty, S.G.; Vose, J.M. Potential water yield reduction due to forestation across China. J. Hydrol. 2006, 328, 548–558. [Google Scholar] [CrossRef]
  5. Wang, Y.; Ye, A.; Qiao, F.; Li, Z.; Miao, C.; Di, Z. Review on connotation and estimation method of water conservation. South–North Water Transf. Water Sci. Technol. 2021, 19, 1041–1071. (In Chinese) [Google Scholar]
  6. Razzaq, A.; Qing, P.; Naseer, M.; Abid, M.; Anwar, M.; Javed, I. Can the informal groundwater markets improve water use efficiency and equity? Evidence from a semi-arid region of Pakistan. Sci. Total Environ. 2019, 666, 849–857. [Google Scholar] [CrossRef]
  7. Razzaq, A.; Liu, H.; Xiao, M.; Mehmood, K.; Shahzad, M.A.; Zhou, Y. Analyzing past and future trends in Pakistan’s groundwater irrigation development: Implications for environmental sustainability and food security. Environ. Sci. Pollut. Res. 2023, 30, 35413–35429. [Google Scholar] [CrossRef]
  8. Hu, W.; Li, G.; Gao, Z.; Jia, G.; Wang, Z.; Li, Y. Assessment of the impact of the Poplar Ecological Retreat Project on water conservation in the Dongting Lake wetland region using the InVEST model. Sci. Total Environ. 2020, 733, 139423. [Google Scholar] [CrossRef]
  9. Yang, D.; Liu, W.; Tang, L.; Chen, L.; Li, X.; Xu, X. Estimation of water provision service for monsoon catchments of South China: Applicability of the InVEST model. Landsc. Urban Plan. 2019, 182, 133–143. [Google Scholar] [CrossRef]
  10. Li, M.; Liang, D.; Xia, J.; Song, J.; Cheng, D.; Wu, J. Evaluation of water conservation function of Danjiang River Basin in Qinling Mountains, China based on InVEST model. J. Environ. Manag. 2021, 286, 112212. [Google Scholar] [CrossRef]
  11. Pan, T.; Zuo, L.; Zhang, Z.; Zhao, X.; Sun, F.; Zhu, Z.; Liu, Y. Impact of Land Use Change on Water Conservation: A Case Study of Zhangjiakou in Yongding River. Sustainability 2021, 13, 22. [Google Scholar] [CrossRef]
  12. Lee, S.; Yeo, I.Y.; Lang, M.W.; Sadeghi, A.M.; McCarty, G.W.; Moglen, G.E.; Evenson, G.R. Assessing the cumulative impacts of geographically isolated wetlands on watershed hydrology using the SWAT model coupled with improved wetland modules. J. Environ. Manag. 2018, 223, 37–48. [Google Scholar] [CrossRef]
  13. Malagò, A.; Bouraoui, F.; De Roo, A. Diagnosis and Treatment of the SWAT Hydrological Response Using the Budyko Framework. Sustainability 2018, 10, 1373. [Google Scholar] [CrossRef] [Green Version]
  14. Sharp, R.; Tallis, H.T.; Ricketts, T. InVEST 3.2.0 User’s Guide; The Natural Capital Project, Stanford University, University of Minnesota, The Nature Conservancy, and World Wildlife Fund: Bogota, Colombia, 2015. [Google Scholar]
  15. Benra, F.; De Frutos, A.; Gaglio, M.; Álvarez-Garretón, C.; Felipe-Lucia, M.; Bonn, A. Mapping water ecosystem services: Evaluating InVEST model predictions in data scarce regions. Environ. Model. Softw. 2021, 138, 104982. [Google Scholar] [CrossRef]
  16. Bagstad, K.J.; Semmens, D.J.; Winthrop, R. Comparing approaches to spatially explicit ecosystem service modeling: A case study from the San Pedro River, Arizona. Ecosyst. Serv. 2013, 5, 40–50. [Google Scholar] [CrossRef]
  17. Martinez-Lopez, J.; Bagstad, K.J.; Balbi, S.; Magrach, A.; Voigt, B.; Athanasiadis, I.; Villa, F. Towards globally customizable ecosystem service models. Sci. Total Environ. 2019, 650, 2325–2336. [Google Scholar] [CrossRef]
  18. Zhang, Y.; Zhang, B.; Ma, B.; Yao, R.; Wang, L. Evaluation of the water conservation capacity of the Weihe River Basin based on the Integrated Valuation of Ecosystem Services and Tradeoffs model. Ecohydrology 2022, 15, e2465. [Google Scholar] [CrossRef]
  19. Rhatyn, S.; Rotenberg, E.; Ramati, E.; Tatarinov, F.; Tas, E.; Yakir, D. Differential impacts of land use and precipitation on “ecosystem water yield”. Water Resour. Res. 2018, 54, 5457–5470. [Google Scholar] [CrossRef]
  20. Li, X.; Yu, X.; Wu, K.; Feng, Z.; Liu, Y.; Li, X. Land-use zoning management to protecting the Regional Key Ecosystem Services: A case study in the city belt along the Chaobai River, China. Sci. Total Environ. 2021, 762, 143167. [Google Scholar] [CrossRef]
  21. Li, L.; Xu, E. Scenario analysis and relative importance indicators for combined impact of climate and land-use change on annual ecosystem services in the Karst mountainous region. Ecol. Indic. 2023, 147, 109991. [Google Scholar] [CrossRef]
  22. Measho, S.; Chen, B.; Pellikka, P.; Trisurat, Y.; Guo, L.; Sun, S.; Zhang, H. Land use/land cover changes and associated impacts on water yield availability and variations in the Mereb-Gash river basin in the horn of Africa. J. Geophys. Res. Biogeosciences 2020, 125, e2020JG005632. [Google Scholar] [CrossRef]
  23. Sun, L.; Yu, H.; Sun, M.; Wang, Y. Coupled impacts of climate and land use changes on regional ecosystem services. J. Environ. Manag. 2023, 326, 116753. [Google Scholar] [CrossRef] [PubMed]
  24. Duan, X.; Chen, Y.; Wang, L.; Zheng, G.; Liang, T. The impact of land use and land cover changes on the landscape pattern and ecosystem service value in Sanjiangyuan region of the Qinghai-Tibet Plateau. J. Environ. Manag. 2023, 325, 116539. [Google Scholar] [CrossRef] [PubMed]
  25. Liu, M.; Min, L.; Zhao, J.; Shen, Y.; Pei, H.; Zhang, H.; Li, Y. The Impact of Land Use Change on Water-Related Ecosystem Services in the Bashang Area of Hebei Province, China. Sustainability 2021, 13, 716. [Google Scholar] [CrossRef]
  26. Pei, H.; Liu, M.; Shen, Y.; Xu, K.; Zhang, H.; Li, Y.; Luo, J. Quantifying impacts of climate dynamics and land-use changes on water yield service in the agro-pastoral ecotone of northern China. Sci. Total Environ. 2022, 809, 151153. [Google Scholar] [CrossRef]
  27. Li, Y.; Fan, J.; Liao, Y. Analysis of spatial and temporal differences in water conservation function in Zhangjiakou based on the InVEST model. Pratacultural Sci. 2020, 37, 1313–1324. (In Chinese) [Google Scholar]
  28. Huang, J.; Fan, J.; He, X. InVEST-model based Evaluation of Water Conservation Function in Zhangjiakou Area, China. Mt. Res. 2021, 39, 327–337. (In Chinese) [Google Scholar]
  29. Yang, J.; Huang, X. The 30 m annual land cover datasets and its dynamics in China from 1990 to 2021. Earth Syst. Sci. Data 2022, 13, 3907–3925. [Google Scholar] [CrossRef]
  30. Budyko, M.I. Climate and Life; Academic Press: New York, NY, USA, 1974. [Google Scholar]
  31. Hamel, P.; Guswa, A.J. Uncertainty analysis of a spatially explicit annual water-balance model: Case study of the Cape Fear basin, North Carolina. Hydrol. Earth Syst. Sci. 2015, 19, 839–853. [Google Scholar] [CrossRef] [Green Version]
  32. Zhang, L.; Fu, B.; Lü, Y. Balancing multiple ecosystem services in conservation priority setting. Landsc. Ecol. 2014, 30, 535–546. [Google Scholar] [CrossRef]
  33. Zhang, H.; Pang, Q.; Hua, Y.; Li, X.; Liu, K. Linking ecological red lines and public perceptions of ecosystem services to manage the ecological environment: A case study in the Fenghe River watershed of Xi’an. Ecol. Indic. 2020, 113, 106218. [Google Scholar] [CrossRef]
  34. Zhang, L.; Hickel, K.; Dawes, W.R.; Chiew, F.; Western, A.W.; Briggs, P. A rational function approach for estimating mean annual evapotranspiration. Water Resour. Res. 2004, 40, W02502. [Google Scholar] [CrossRef]
  35. Jia, G.; Hu, W.; Zhang, B.; Li, G.; Shen, S.; Gao, Z.; Li, Y. Assessing impacts of the Ecological Retreat project on water conservation in the Yellow River Basin. Sci. Total Environ. 2022, 828, 154483. [Google Scholar] [CrossRef]
  36. Xu, H.; Zhao, C.; Wang, X.; Chen, S.; Shan, S.; Chen, T.; Qi, X. Spatial differentiation of determinants for water conservation dynamics in a dryland mountain. J. Clean. Prod. 2022, 362, 132574. [Google Scholar] [CrossRef]
  37. Wang, Y.; Ye, A.; Peng, D.; Miao, C.; Di, Z.; Gong, W. Spatiotemporal variations in water conservation function of the Tibetan Plateau under climate change based on InVEST model. J. Hydrol. Reg. Stud. 2022, 41, 101064. [Google Scholar] [CrossRef]
  38. Chen, Y.; Gong, A.; Zeng, T.; Yang, Y. Evaluation of water conservation function in the Xiongan New Area based on the comprehensive index method. PLoS ONE 2020, 15, e0238768. [Google Scholar] [CrossRef]
  39. Yang, J.; Xie, B.; Zhang, D. Climate and land use change impacts on water yield ecosystem service in the Yellow River Basin, China. Environ. Earth Sci. 2021, 80, 72. [Google Scholar] [CrossRef]
  40. Pei, H.; Liu, M.; Jia, Y.; Zhang, H.; Li, Y.; Xiao, Y. The trend of vegetation greening and its drivers in the Agro-pastoral ecotone of northern China, 2000–2020. Ecol. Indic. 2021, 129, 108004. [Google Scholar] [CrossRef]
  41. Wang, Y.; Wang, H.; Liu, G.; Zhang, J.; Fang, Z. Factors driving water yield ecosystem services in the Yellow River Economic Belt, China: Spatial heterogeneity and spatial spillover perspectives. J. Environ. Manag. 2022, 317, 115477. [Google Scholar] [CrossRef]
  42. Liu, M.; Jia, Y.; Zhao, J.; Shen, Y.; Pei, H.; Zhang, H.; Li, Y. Revegetation projects significantly improved ecosystem service values in the agro-pastoral ecotone of northern China in recent 20 years. Sci. Total Environ. 2021, 788, 147756. [Google Scholar] [CrossRef]
  43. Wang, T.; Gong, Z. Evaluation and analysis of water conservation function of ecosystem in Shaanxi Province in China based on “Grain for Green” Projects. Environ. Sci. Pollut. Res. 2022, 29, 83878–83896. [Google Scholar] [CrossRef] [PubMed]
  44. Lian, X.; Qi, Y.; Wang, H.; Zhang, J.; Yang, R. Assessing Changes of Water Yield in Qinghai Lake Watershed of China. Water 2020, 12, 11. [Google Scholar] [CrossRef] [Green Version]
Figure 1. Location and elevation of Zhangjiakou including North Zhangjiakou and South Zhangjiakou.
Sustainability 15 11077 g001
Figure 2. Spatial characteristics of land use in Zhangjiakou (ZJK), North Zhangjiakou (NZJK) and South Zhangjiakou (SZJK) in 1990, 2010 and 2020.
Sustainability 15 11077 g002
Figure 3. Land use transfer in Zhangjiakou from 1990–2005 (left column to middle column), 2005–2020 (middle column to right column).
Sustainability 15 11077 g003
Figure 4. Changes in different land use types in Zhangjiakou (ZJK), North Zhangjiakou (NZJK) and South Zhangjiakou (SZJK) from 1990–2020.
Sustainability 15 11077 g004
Figure 5. Changes in water yield in Zhangjiakou (ZJK), North Zhangjiakou (NZJK), and South Zhangjiakou (SZJK) from 1990 to 2020.
Sustainability 15 11077 g005
Figure 6. Average water yield service (a) and slope (b) from 1990 to 2020.
Sustainability 15 11077 g006
Figure 7. Changes in water conservation in Zhangjiakou (ZJK), North Zhangjiakou (NZJK) and South Zhangjiakou (SZJK) from 1990 to 2020.
Sustainability 15 11077 g007
Figure 8. Average water conservation capacity (a) and its slope (b) from 1990 to 2020 in Zhangjiakou.
Sustainability 15 11077 g008
Figure 9. Different land use type contribution rate to water yield (a) and water conservation (b).
Sustainability 15 11077 g009
Figure 10. Impact of land use (a,c) and precipitation change (b,d) on water yield and water conservation.
Sustainability 15 11077 g010
Table 1. Data sources used in this study.
The Name of the DataSourcing and ProcessingTypeResolution
Land cover(https://www.zenodo.org/record/4417810#.YSpGFI4zaUn) [29]Raster30 m
DEMThe Geospatial Data Cloud (http://www.gscloud.cn)Raster90 m
PrecipitationThe National Earth System Science Data Center (http://www.geodata.cn)Raster1000 m
Reference crop evapotranspirationThe National Earth System Science Data Center (http://www.geodata.cn)Raster1000 m
World soil datasetThe National Glacier and Permafrost Desert Science Data Center
(https://www.crensed.ac.cn/portal/)
Raster1000 m
Sub-watershed boundariesProduced by the Hydrological Analysis Tool in the ArcMap softwareVector
Table 2. Vegetation restoration scenario.
SceneDescriptionVariation
S Base scenario Land use in 2020
S1 Water source buffer belt
scenario
A buffer zone is set up 100 m near the water, the buffer land type is set to forest land, and the type of impervious near the water area remains unchanged. It can control soil erosion, reduce pollution, purify water quality, and protect water sources.The area of forest land increased by 560 km2;
S2 Returning farmland to forests scenarioCropland with slopes greater than 6° is not easy to cultivate and is not suitable for the use of agricultural machinery, and in the 2020 land-use raster data, barren and cropland with slopes above 6° were converted to forest land.The area of forest land increased by 969 km2;
S3 Returning farmland to grassland scenarioForest land has the function of conserving water sources, but its own transpiration effect is large, while grass has less water demand and less evaporation, so it is necessary to compare the impact of returning farmland to forest and grassland on water yield. Cropland with slopes greater than 6° is not easy to cultivate and is not suitable for the use of agricultural machinery, and in the 2020 land-use raster data, unused land and cropland with slopes above 6° were converted to grassland.The area of grassland increased by 969 km2.
Disclaimer/Publisher’s Note: The statements, opinions and data contained in all publications are solely those of the individual author(s) and contributor(s) and not of MDPI and/or the editor(s). MDPI and/or the editor(s) disclaim responsibility for any injury to people or property resulting from any ideas, methods, instructions or products referred to in the content.

