Article

Spatial–Temporal Change Analysis and Multi-Scenario Simulation Prediction of Land-Use Carbon Emissions in the Wuhan Urban Agglomeration, China

1
School of Resources and Environment Engineering, Wuhan University of Technology, Wuhan 430070, China
2
School of Civil Architecture and Engineering, Wuhan Huaxia University of Technology, Wuhan 430073, China
3
Zhejiang Spatiotemporal Sophon Bigdata Co., Ltd., Ningbo 315101, China
*
Author to whom correspondence should be addressed.
Sustainability 2023, 15(14), 11021; https://doi.org/10.3390/su151411021
Submission received: 4 May 2023 / Revised: 6 July 2023 / Accepted: 11 July 2023 / Published: 14 July 2023

Abstract

:
In the context of global warming, the Wuhan Urban Agglomeration is actively responding to China’s carbon peak and carbon neutrality goals and striving to achieve a reduction in carbon sources and an increase in carbon sinks. Therefore, it is critical to investigate carbon emissions from land use. This study uses the carbon emission coefficient method to calculate carbon emissions from land use in the Wuhan Urban Agglomeration, analyzes its temporal and spatial changes and differences in urban structure, and couples with the Markov–PLUS model to simulate and predict the carbon emissions of four scenarios of land use in 2035. The research found the following: (1) during the Wuhan “1+8” City Circle stage, carbon sources and emissions increased steadily, with average annual growth rates of 1.92% and 1.99%, respectively. Carbon sinks remained stable and then decreased, with an average annual growth rate of −0.46%. (2) During the Wuhan Metropolitan Area stage—except for 2020 and 2021, which were affected by COVID-19—carbon sources, sinks, and emissions continued to grow in general, and the average annual growth rates increased to 4.46%, 1.58%, and 4.51%, respectively. (3) In terms of urban structure differences, Wuhan is a high-carbon optimization zone; Xianning, Huangshi, and Huanggang are ecological protection zones; other cities, such as Ezhou, Xiaogan, and Xiantao are comprehensive optimization zones; and there is no low-carbon development zone. (4) The multi-scenario simulation results show that carbon sources and emissions are the highest under the economic development scenario, with values of 100.2952 and 9858.83 million tons, respectively, followed by cropland protection, natural development, and low-carbon development scenarios. Under low-carbon development, carbon sinks were the highest, with values of 1.9709 million tons, followed by natural development, economic development, and cropland protection scenarios. The research results are conducive to the formulation of carbon peak and neutrality goals as well as low-carbon development plans for the Wuhan Urban Agglomeration.

1. Introduction

With the rapid development of the world economy, the resulting environmental pollution problems have become increasingly apparent. In recent years, global warming caused by greenhouse gas emissions has become more and more serious [1,2,3,4]. The United Nations Intergovernmental Panel on Climate Change (IPCC) pointed out in the report “Climate Change 2022: Impacts, Adaptation and Vulnerability” that global temperatures have increased by 1.06 °C compared to pre-industrial levels; if this rises to 1.5 °C, nearly 8% of the world’s farmland will be unusable, which would be a disaster for mankind [5,6]. In September 2020, General Secretary Xi Jinping promised at the 75th session of the United Nations General Assembly that China will achieve a carbon peak by 2030 and carbon neutrality by 2060 [7]. Therefore, reducing the emissions of greenhouse gases, especially carbon dioxide, has become a severe challenge facing the world at present. A large number of studies have shown that land-use and land-cover change (LUCC) is an important factor affecting carbon emissions and absorption [8]. LUCC changes the land-use type, and then affects the surface economy and human activities in the region, resulting in a change in carbon emissions and absorption, thereby affecting the balance of the carbon budget [9]. Therefore, it is of great significance to study carbon emissions from land use to realize these carbon peak and carbon neutrality goals and control climate warming.
To date, a large number of studies on land-use carbon emissions have been conducted from multiple angles and aspects at home and abroad [10], including the calculation of emissions on multiple scales and for different regions and methods [11,12,13]; influencing factors [14,15]; economic, social, and ecological effects [7,16]; optimization and control methods [17,18], and predictions [19,20,21]. The calculation of land-use carbon emissions can be summarized in two categories: “top-down” methods, starting from the social economy, including material balance, emission coefficients, actual measurements, and factor decomposition, and “bottom-up” methods, starting from ecological nature, including model simulations, sample plot inventories, and remote sensing estimations [22]. Among them, the carbon emission coefficient method is widely used because of its simple operation and wide application range. For example, Jie Xu et al. [23] used this method to calculate the carbon emissions of different land-use types in Meishan City (except for built-up land, for which they used the carbon emission coefficient of energy consumption to indirectly perform an estimation). On the basis of the abovementioned method, Zhouliang Cao et al. [24] integrated people’s breathing into the carbon emissions of built-up land in Shaanxi Province, which increased the accuracy of the results. Cavalcante Leite Christiane et al. [25] used this method to calculate the carbon emissions of LUCC, energy consumption, and other secondary sources in southern Brazil, and Alejandro Carpio et al. [26] used it to calculate the carbon dioxide emissions and absorption caused by LUCC in the process of urban expansion in Mexico. The prediction of land-use carbon emissions is mainly based on the prediction of changes in land-use types and then calculated through carbon emission coefficients. At present, commonly used models for land-use change predictions include Markov, cellular automaton (CA) [19], conversion of land use and its effects on a small regional extent (CLUE-S) [20], future land-use simulation (FLUS) [21], and so on. For example, Beroho Mohamed et al. [27] predicted the land use and cover of the Mediterranean Basin in Morocco in 2038, 2058, and 2050 based on the CA–Markov model; in the verification results, the kappa coefficient was 0.73. Liting Chen et al. [28] simulated and analyzed land use in the Raohe River Basin in 2035 based on the Markov–FLUS coupling model, with scenarios, such as inertial development, farmland protection, and ecological priority, in order to optimize land space allocation under different development goals. Kaiqi Zhang et al. [29] coupled the InVEST model carbon-storage module and the GeoSOS–FLUS model and analyzed the spatiotemporal characteristics of carbon storage within six districts and eleven counties in the city of Guilin from 2000 to 2040 based on land-use data and future land prediction results in different scenarios. However, the CA model does not explore the relationship between land-use spatial change and spatial driving factors, which may lead to low simulation accuracy. CLUE-S belongs to the spatial model, which strengthens the spatial allocation module but ignores the possibility of the conversion of nondominant land types, resulting in low accuracy. The FLUS model only performs follow-up simulations based on the land-use data of the first period and does not have time attributes, resulting in insufficient simulation accuracy. The patch-generating land-use simulation model (PLUS) [30] is a rule-mining framework based on the land-expansion analysis strategy (LEAS) and a CA model based on multi-type random seeds (CARSs). This model not only retains the calculation process of the suitability probability based on the driving factors in the FLUS model, but also combines the sample training based on the conversion of various types of land-use data between the two periods in the CA model. Compared with other models, it can better improve the simulation accuracy of land-use types. Fanghu Sun et al. [31], for Anhui Province, analyzed the temporal and spatial evolution characteristics of land-use types and carbon storage from 1990 to 2018 by coupling the carbon storage module of the InVEST and PLUS models and predicted the change trends of carbon storage in 2034 and 2050 for natural development and ecological protection scenarios. Ziyao Wang et al. [32] used Bortala Mongolian Autonomous Prefecture as an example to conduct ecological zoning planning by coupling the InVEST-HFI-PLUS model to evaluate the habitat quality and human footprint index in the study area, as well as to dynamically evaluate the level of ecosystem services in different scenarios. In previous studies on land-use carbon emissions, the selection of carbon emission coefficients was a crucial step. The regional differences in carbon emission coefficients of built-up land are significant; therefore, selecting a suitable coefficient for the research area is urgent. Previous studies on predicting carbon emissions were often only conducted by limiting the quantity transfer of land-use types. This is a single method, with which it is difficult to truly simulate the real situation. Therefore, how to better simulate the quantity and spatial changes of land-use types in different scenarios, and thus simulate land-use carbon emissions, needs improvement.
Since Hubei Province first proposed the concept of the Wuhan Urban Agglomeration in April 2003, it has been committed to creating the Wuhan “1+8” City Circle to drive the development of cities around Wuhan. As the economic center of Hubei Province, Wuhan’s economy is developing rapidly; however, it also produces a high level of carbon emissions. However, the economic volume of Wuhan makes it difficult to drive the development of the entire City Circle. In 2017, Hubei Province proposed to delineate the Wuhan Metropolitan Area within the scope of the “1 h commuting circle” as an optimization of the City Circle. Taking transportation first, the “146” spatial pattern of one core (Wuhan), four belts (Wuehuanghuang, Wuxian, Hanxiao, and Wuxian urban belts), and six pairs (Ezhou, Huangshi, Xiaogan, Huanggang, Xianning, and Xiantao) was constructed to promote the coordinated development of regional society, economy, and ecology in all aspects [33,34,35,36]. Questions worth studying since the establishment of the Wuhan Urban Agglomeration include: what is the development trend of the carbon emissions of the cities and counties within this range, after delineating the Wuhan Metropolitan Area? What changes have occurred in the carbon emissions of each city and county compared with the previous ones? Finally, what is the future development trend?
Therefore, based on the carbon emission coefficient method, this paper modifies factors through energy data to study land-use carbon emissions in the Wuhan Urban Agglomeration in two stages. Coupled with the Markov and PLUS models, this paper simulates and predicts carbon emissions from land use under different scenarios in 2035 by limiting the quantity and space of land use. The study of land-use carbon emissions in this region cannot only reflect the development process and pattern of the Wuhan Urban Agglomeration, but can also provide effective theoretical support and suggestions for future development planning through scenario simulation predictions. The carbon emission factor correction and land-use transfer restriction methods applied by the research institute are also expected to improve the universality of land-use carbon emission research and provide suggestions and references for it in different regions of the world.

2. Materials and Methods
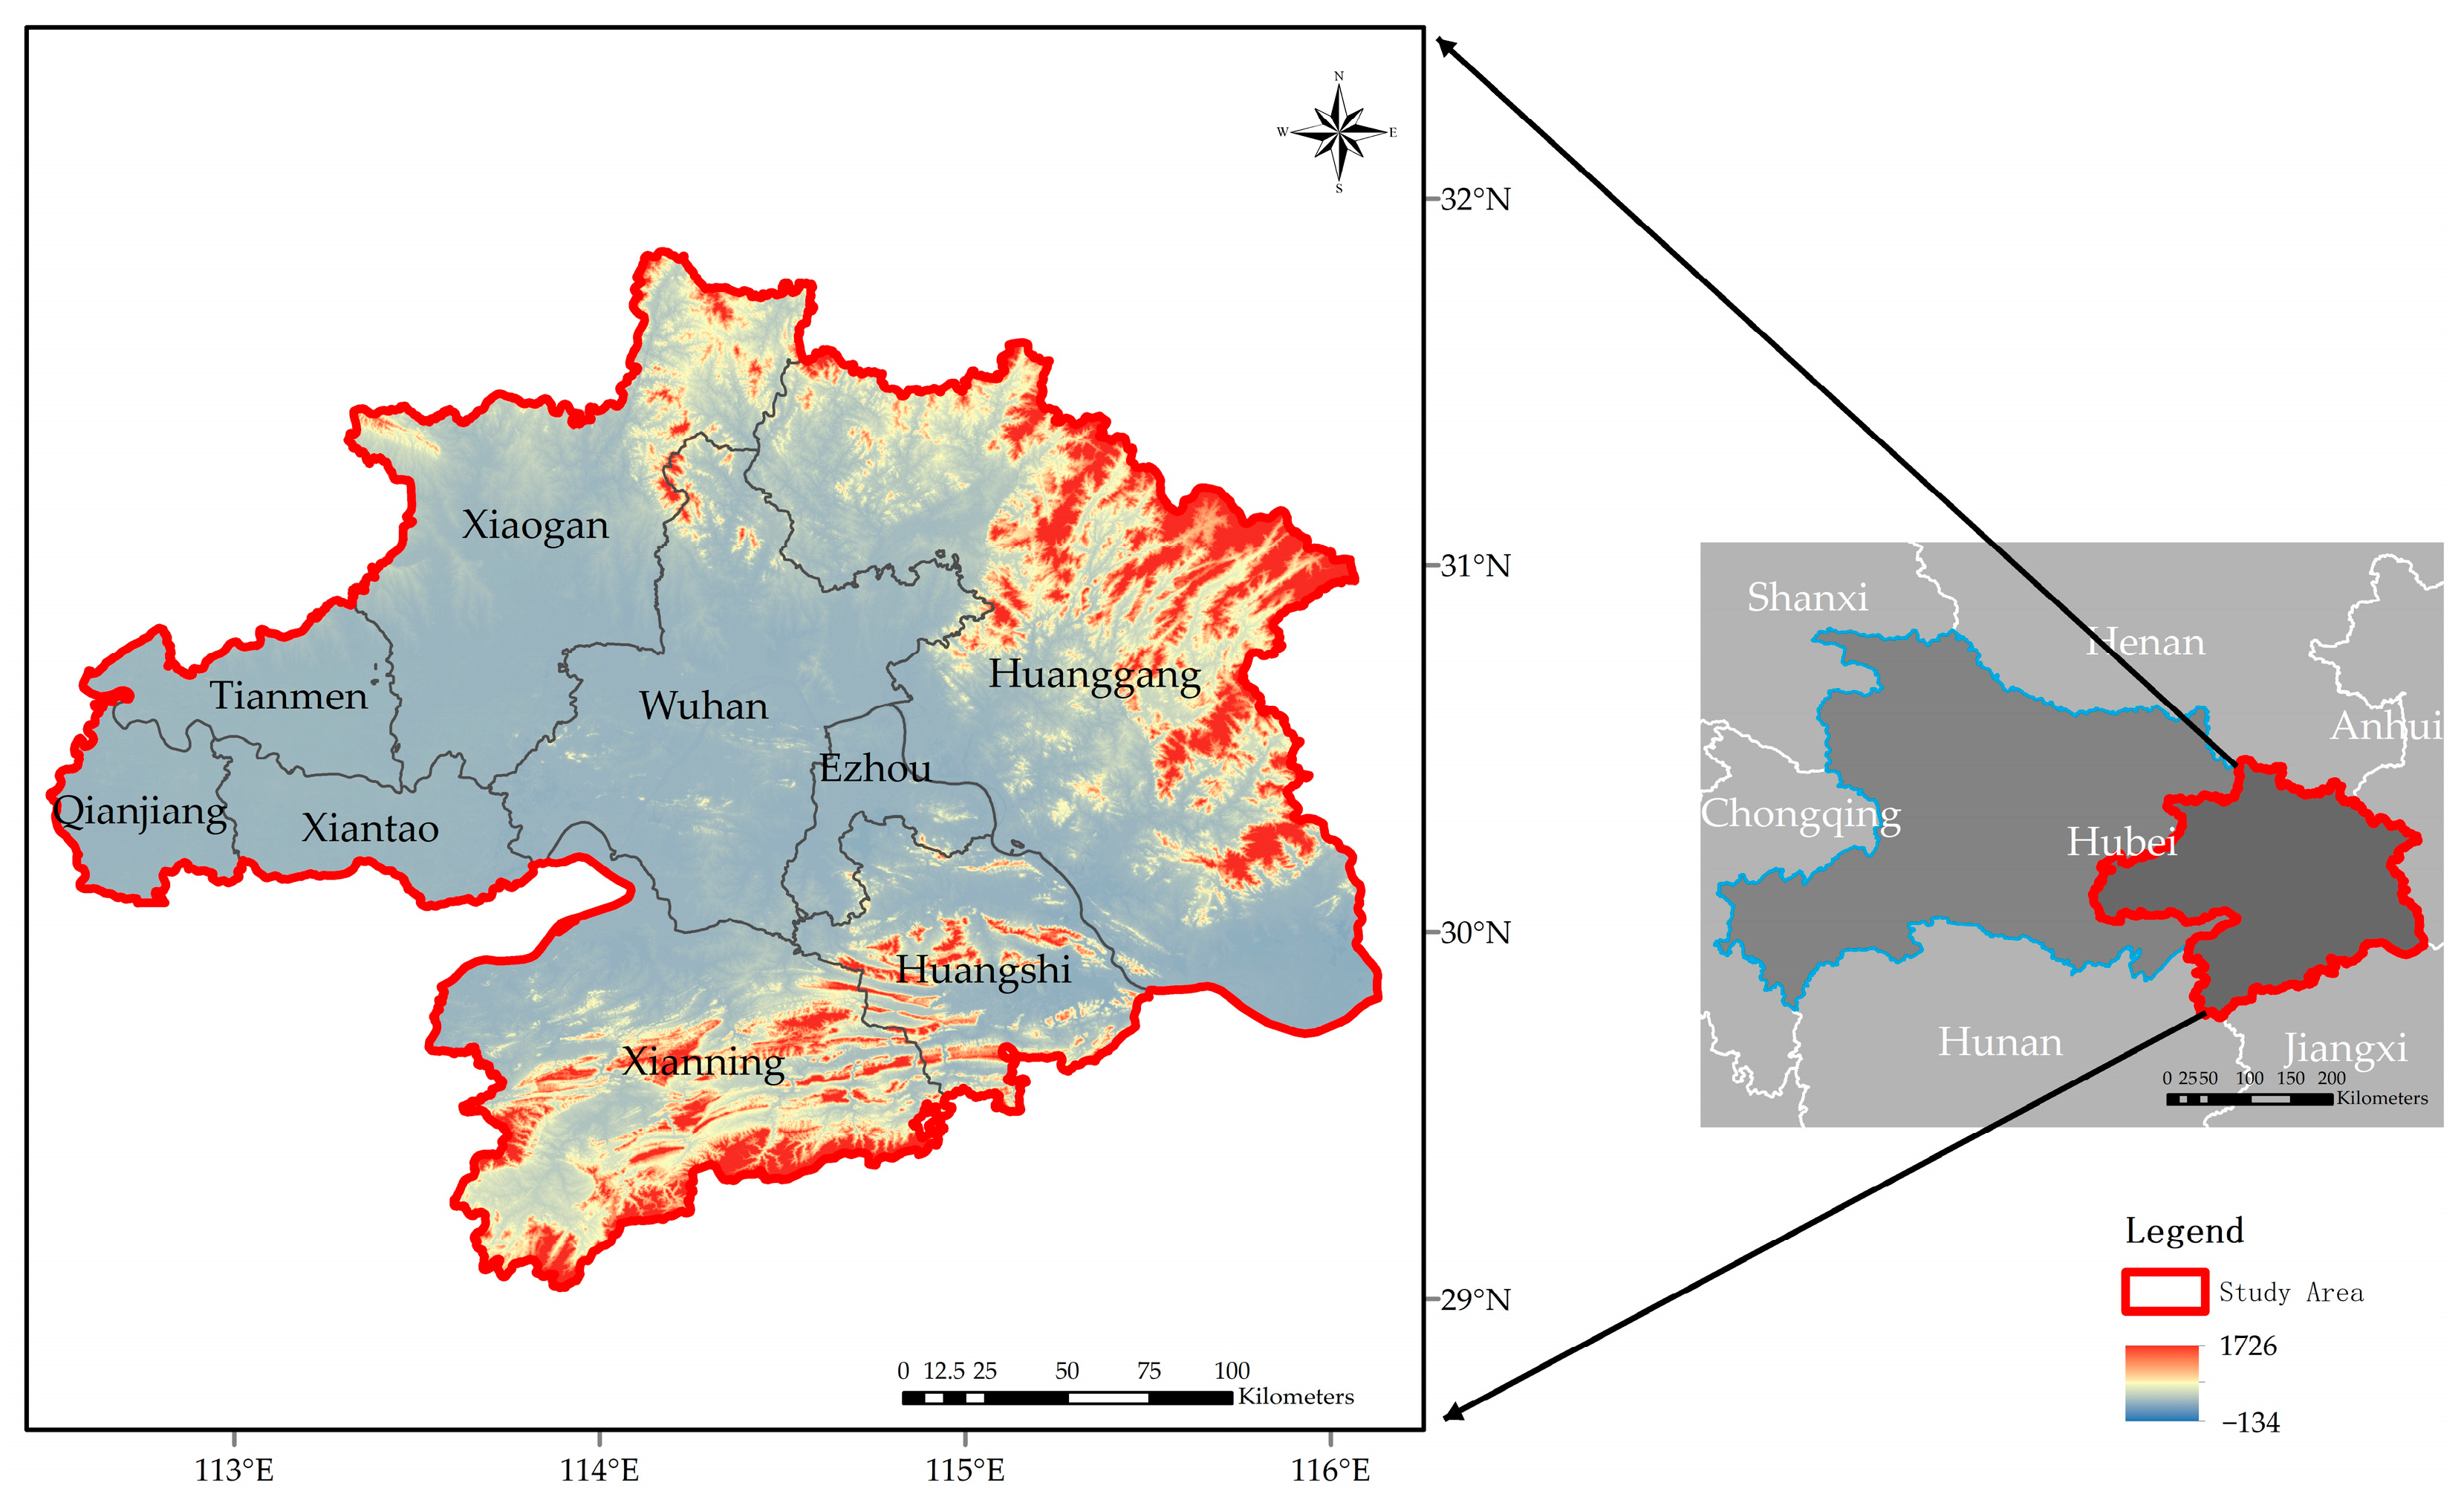
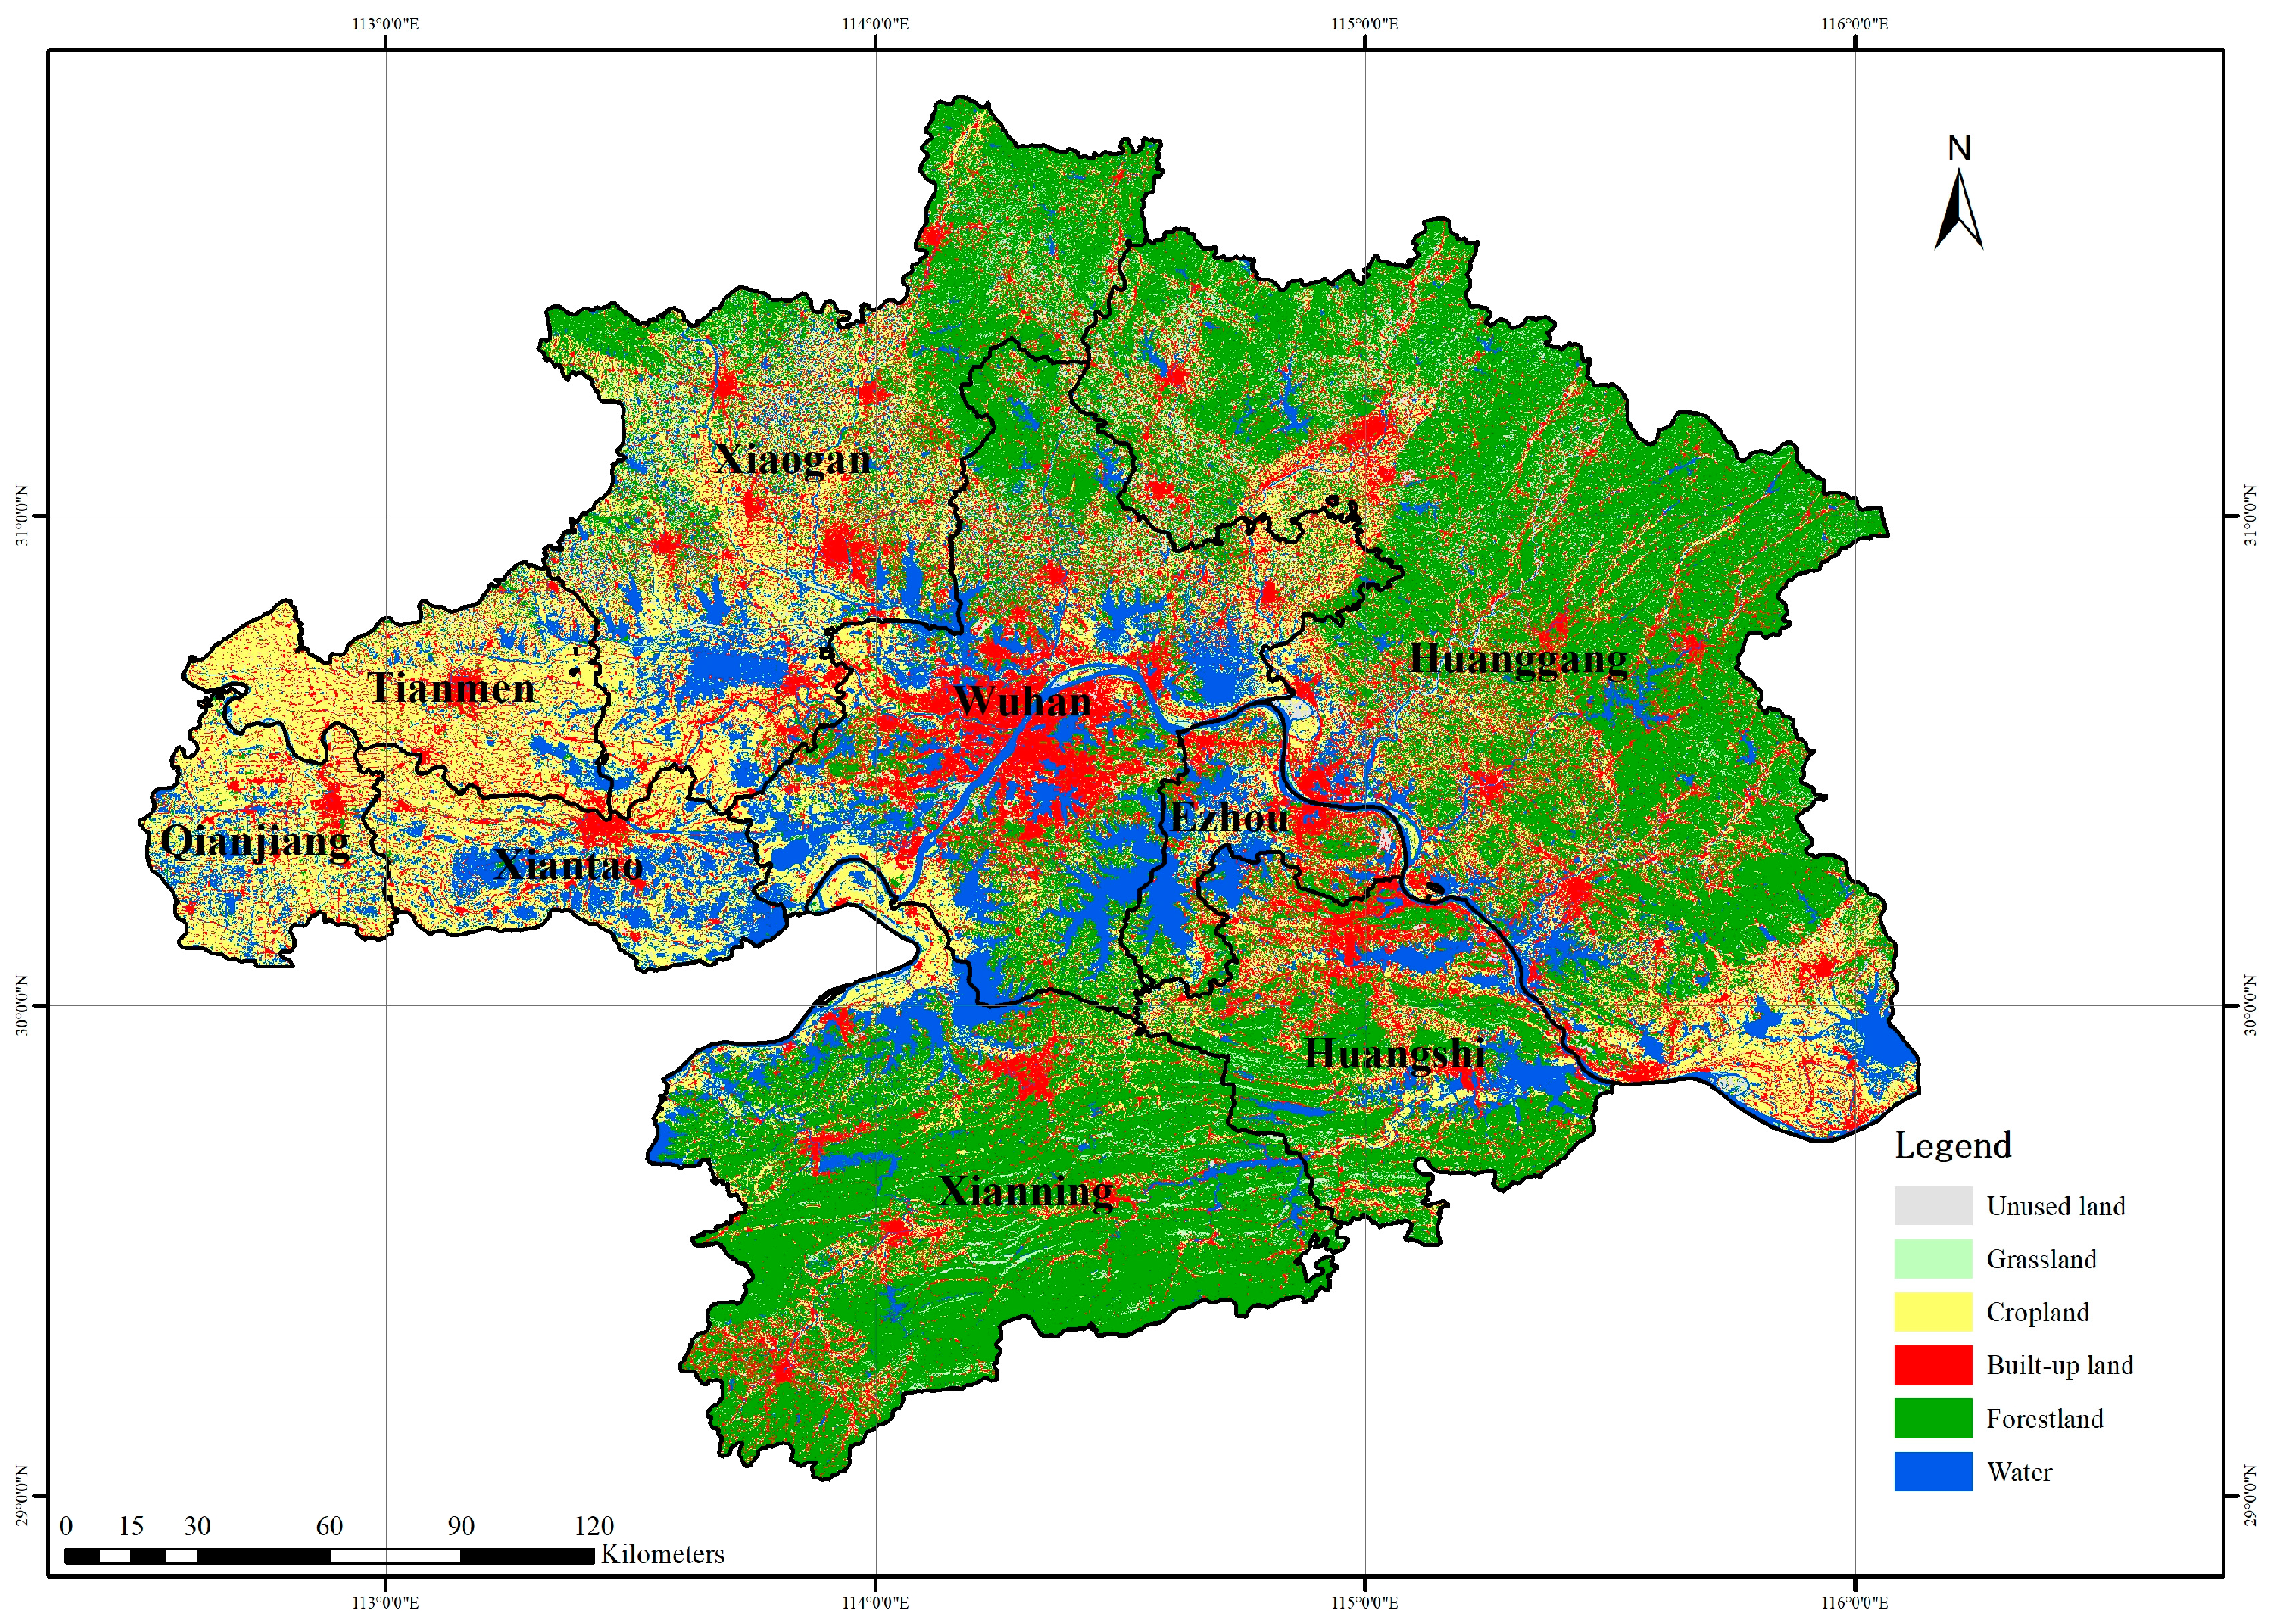
2.1. Study Area

The Wuhan Urban Agglomeration (Figure 1) is centered in Wuhan City, with a radius of about 100 km. It is divided into nine cities, namely, Wuhan, Huangshi, Ezhou, Xiaogan, Huanggang, Xianning, Xiantao, Tianmen, and Qianjiang, with a total area of 58,025 square kilometers, accounting for 31.21% of the province’s total area. In 2020, the resident population was 3248.88 million, accounting for 55.16% of the province’s population; the gross domestic product (GDP) was CNY 26,361.01 billion, accounting for 60.38% of the province’s GDP [37]. With the advantages, such as its unique location, dense industry and personnel distribution, and national strategic support, the Wuhan Urban Agglomeration has developed rapidly and has become an important strategic fulcrum for the development of Hubei Province and the central region. According to the “14th Five-Year Plan for Natural Resources Protection and Development of Hubei Province” promulgated in 2021, reaching carbon peak and neutrality is an opportunity and a challenge for the province, which is taking the lead in realizing the green development in Central China. As a pioneer in the economic, social, and ecological development of Hubei Province, the Wuhan Urban Agglomeration views the realization of carbon peak and neutrality goals as an important task.

2.2. Data Sources

In this study, 1 km of land-use data in 2000, 2005, 2010, and 2015 was used to calculate land-use carbon emissions, in order to explore their spatiotemporal patterns in the Wuhan Urban Agglomeration during the Wuhan “1+8” City Circle” stage. Sentinel-2 images (10 m) from 2017 to 2022 were used for supervision classification to obtain land-use types; land-use carbon emission calculations were conducted to explore the spatiotemporal patterns of land-use carbon emissions in the Wuhan Urban Agglomeration during the Wuhan Metropolitan Area stage; and the emission results from 2020 were selected to explore the regional differences. According to the relevant research [38,39,40], and considering the availability, quantification, and correlation of the data with land-use types, a total of 12 factors (Table 1), including terrain, meteorology, soil, location, economy, and grain resources, were selected as the driving factors of the PLUS model to simulate and predict land-use changes and land-use carbon emissions. The data sources needed for the experiment are listed in Table 2.

2.3. Data Processing

The supervised classification of land-use types was conducted. Sentinel-2 remote sensing images from 2017 to 2022 were selected, and after preprocessing techniques, such as radiometric calibration and atmospheric correction, a classification was conducted in ENVI5.3. The classification system was based on the planning division of the 2007 national standard “Classification of Land Use Status”, combined with the existing situation of the Wuhan City Circle, and divided the land-use types into cropland, forest land, grassland, water, built-up land, and unused land. These were combined with Google Earth images to establish interpretation signs and obtain the final land-use type data. The slope was calculated using the slope tool in Arcgis 10.4.1 using DEM data. The shortest distances of highways, railways, and water systems were calculated using the Euclidean distance tool in Arcgis10.4.1 using road network and water system data.

2.4. Methods

2.4.1. Calculating Land-Use Carbon Emissions

This study used the carbon emission coefficient method to calculate land-use carbon emissions, including carbon absorption (carbon sinks) generated by forest land, grassland, water, and unused land, and carbon emissions (carbon sources) generated by cropland and built-up land. Cropland, forest land, grassland, water, and unused land were calculated using the direct measurement method [41], and the calculation formula is as follows:
C d i r e c t = C i = A i F i
where C d i r e c t is the direct carbon emission; C i represents the carbon sources and carbon sinks of the i-th land-use type (positive value is carbon source, negative value is carbon sink); A i is the area of the i-th land-use type; and F i is the carbon emission coefficient of the i-th land-use type. For cropland, there were significant differences in carbon emissions due to different crops planted in different regions. Therefore, this study determined the carbon emission coefficient of cropland suitable for the Wuhan Urban Agglomeration based on the research on land-use carbon emissions in Hubei Province [41]. The regional differences in land-use types, other than built-up land and cropland, were relatively small. Therefore, for forestland and grassland, based on the research results of Jingyun Fang [42] and combined with other relevant literature [41,43,44,45], this study determined the carbon emission coefficient suitable for the Wuhan Urban Agglomeration by taking the median of its research results. For water, based on the research results of Li Lai [46] and Xiaonan Duan [47], the average value was taken as the carbon emission of water. For unused land, this study determined the carbon emission coefficient commonly used in the relevant literature [41,43,44,45]. The coefficients of cropland, forestland, grassland, water, and unused land were determined to be 0.497, −0.581, −0.021, −0.253, and −0.005 t(C)/(hm2·a), respectively.
Since 80–90% of the carbon emissions of built-up land come from the combustion of fossil fuels [24,48,49,50], built-up land was calculated using an indirect estimation method [41], and the calculation formula is as follows:
C i n d i r e c t = α β
where C i n d i r e c t is the amount of indirect carbon emissions, α is the conversion of various energy sources into standard coal consumption, and β is the carbon emission coefficient corresponding to standard coal. The results of converting various types of energy into standard coal were obtained from the statistical yearbooks of each city. The carbon emission coefficient was obtained according to IPCC2006, which was 0.5404 t C / t .
Since the statistical yearbooks for 2021 and 2022 have not yet been published, the energy consumption data could not be obtained. Moreover, some cities and counties did not have statistical energy data before 2016. Therefore, the direct measurement method was used again to estimate the carbon emissions of built-up land. The carbon emission coefficient was calculated using the indirect estimation method based on the energy data from previous years and the area of built-up land. The calculation formula is as follows:
F   b = ( C j / A j ) m
where F   b is the carbon emission coefficient of built-up land; C j is the carbon emissions from built-up land in year j , calculated using the indirect estimation method; A j is the built-up land area in the j-th year; and m is the total number of years used to calculate the carbon emission coefficient. The final calculated carbon emission coefficient for built-up land was 102.57 t(C)/(hm2·a).

2.4.2. Evaluation of Land-Use Carbon Emission Pattern

Carbon source intensity ( C e ) [51,52,53] and carbon sink intensity ( C s ) [54,55,56] were selected to more accurately reflect the real situation of land-use carbon emissions in each city. The carbon source intensity indicates the number of carbon sources required per unit of GDP in the region, and the carbon sink intensity indicates the number of carbon sinks generated per unit of land area in the region. The calculation formula is as follows:
C e = E p / G p
C s = S p / A p  
where E p is the total carbon source, G p is the GDP, S p is the total amount of carbon, and A p is the land area.
The economic contribution coefficient of carbon sources (ECC) [41,57,58,59] and the ecological carrying capacity of carbon sinks (ESC) [41,59,60,61] were selected to analyze the carbon emission patterns of cities in the Wuhan Urban Agglomeration. The carbon source economic contribution coefficient is a standard that reflects the economic efficiency of carbon emissions in a region and can measure the contribution of carbon emissions to economic development; the carbon sink ecological carrying coefficient is a standard that reflects the carbon sink absorption capacity in the region and can measure the region’s contribution to carbon absorption. The calculation formula is as follows:
E C C = G n / G E n / E  
E S C = S n / S E n / E  
where G n is the GDP of the nth city and county, G is the GDP of the Wuhan Urban Agglomeration, E n is the total carbon sources in the nth city, E is the total carbon sources in the Wuhan Urban Agglomeration, S n is the carbon accumulation in the nth city, and S is the carbon accumulation of the Wuhan Urban Agglomeration. If E C C > 1 , it means that the city’s carbon source economic contribution and the carbon emission economic efficiency are higher, and vice versa; if E S C > 1 , it indicates that the city’s carbon sink ecological carrying coefficient and the carbon absorption capacity are higher, and vice versa.

2.4.3. Accuracy Verification and Scenario Presupposition of the PLUS Model

The PLUS model is a rule mining framework based on the land-expansion analysis strategy (LEAS) and a CA model based on the multi-type random seed (CARS) [19]. The model is mainly divided into two parts: the first part (LEAS) compares the land-use-type data for the two periods, samples the expansion of various types of land use, and uses the random forest algorithm to mine the driving forces of various factors for the expansion of each land-use type, ultimately capturing their development probabilities and the extent to which all drivers contribute to their expansion. The second part (CARS) combines multi-type random seed generation and the threshold decrease mechanism to dynamically present the land-use change process, including the spatial change, area change, and change curve of each land-use type [62,63,64].
Taking the land use of the Wuhan Urban Agglomeration in 2017 as the starting layer, the land use in 2020 was simulated and the simulation results were compared with the land use at present in 2020. The kappa and FoM coefficients were used to evaluate the prediction results. In the verification results, the kappa coefficient was 0.87, the overall accuracy was 90%, and the FoM coefficient was 0.126. This shows that the PLUS model is more accurate in simulating and predicting the land-use types in the Wuhan Urban Agglomeration, and thus can be used to predict future land-use types.
Based on the development trend and related policies of the Wuhan Urban Agglomeration, this study simulated and predicted land-use types under the four scenarios of natural development, low-carbon development, economic development, and cropland protection through constraints on land-use quantity and land-use spatial transfer, and then predicted the spatial patterns of land-use carbon emissions based on the results. In terms of land-use quantity constraints, we referred to the results of the land-use transfer matrix from 2017 to 2020 and used the Markov model to predict the number of land-use types in 2035 as the input of the PLUS model. In terms of land-use spatial transfer restrictions, according to the matrix under different scenarios, we selected the case where the conversion ratio exceeded 1% of the total area of the land type as the allowed conversion. The specific constraints were as follows: under natural development, the transfer probability of each land-use type remained unchanged and the spatial transfer was not restricted; under low-carbon development, the probability of grassland and forest land transfer to built-up land was reduced by 30%, the probability of built-up land and unused land transfer to grassland and forest land increased by 20% and spatial transfer limited the transfer of forest land to cropland and built-up land; under economic development, the probability of transferring grassland and woodland to built-up land was increased by 20%, the probability of transferring unused land to built-up land was increased by 30%, the probability of transferring built-up land to grassland and forest land was reduced by 30%, and no restrictions were placed on spatial transfer; under cropland protection, the probability of transferring cropland to other land uses was reduced by 30%, and the probability of transferring grassland, forest land, unused land, and built-up land to cropland was increased by 10%. Spatial transfer limited the transfer of cropland to unused land and built-up land.

3. Results

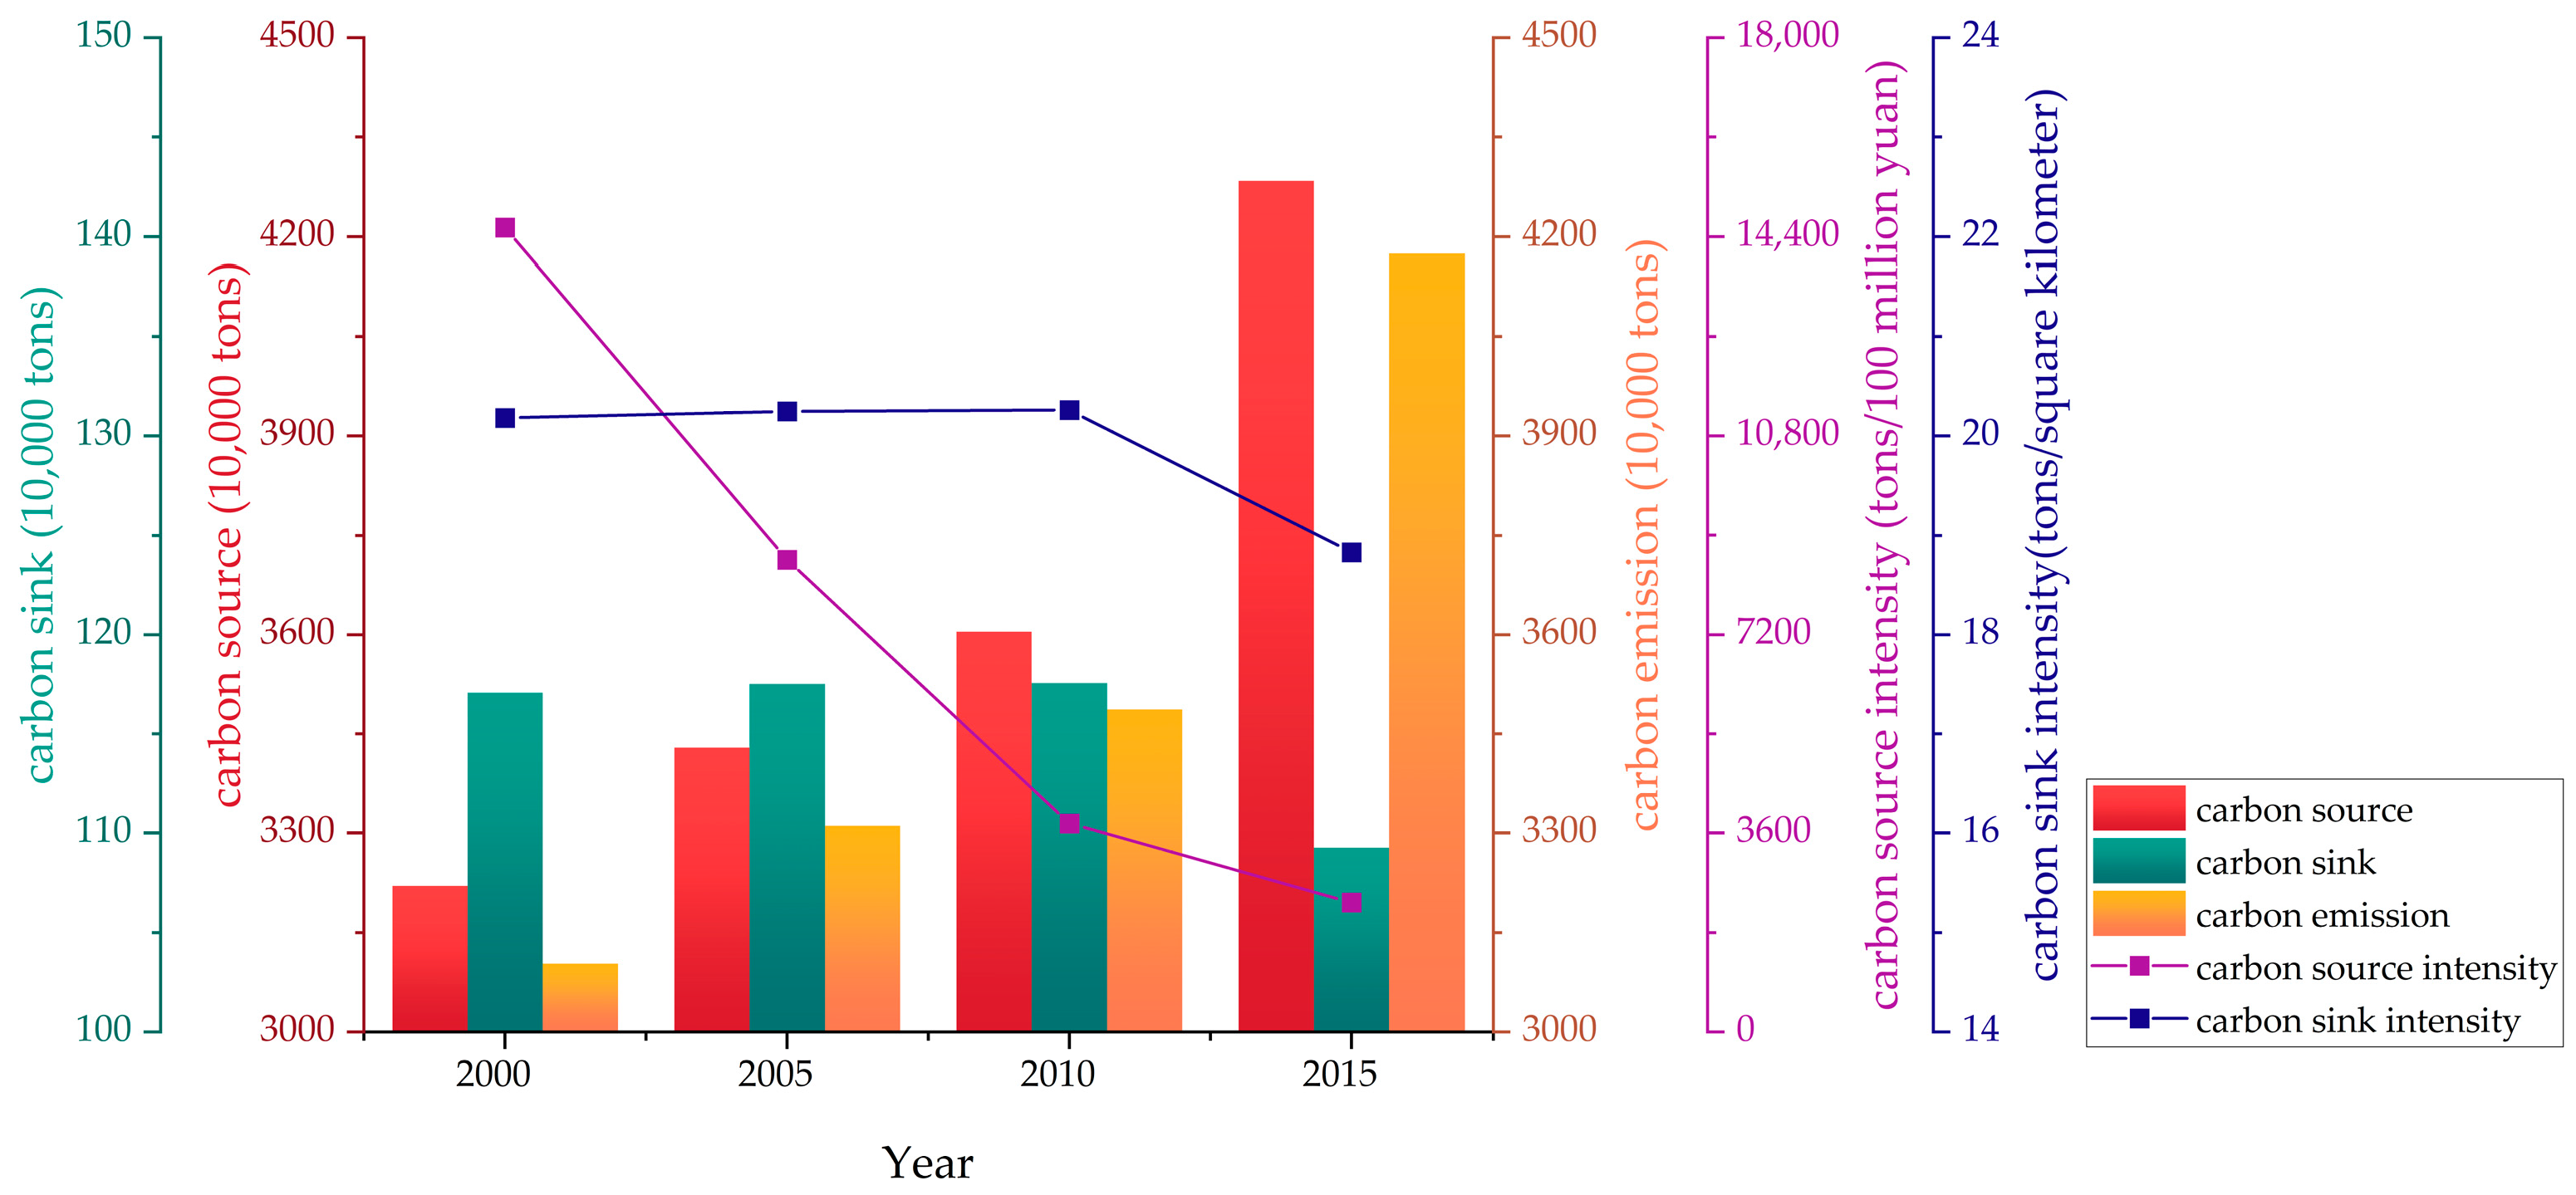
3.1. Trend Analysis of Land-Use Carbon Emissions in the Wuhan Urban Agglomeration from 2000 to 2015

Figure 2 shows the results for the calculations of land-use carbon emissions in the Wuhan Urban Agglomeration in 2000, 2005, 2010, and 2015 using the carbon emission coefficient method. From 2000 to 2015, the number of carbon sources showed a continuous growth trend, with an average annual growth rate of 1.92%. The growth rate from 2000 to 2010 was relatively slow, with an annual average of 1.13%, and the growth rate from 2010 to 2015 was relatively fast, with an annual average of 3.51%. The growth trend of carbon emissions was roughly the same as that of carbon sources, with an annual average of 1.17% from 2000 to 2010 and 3.67% from 2010 to 2015. This may have been because, in 2010, the Wuhan Urban Agglomeration was listed as a key development area in the “12th Five-Year Plan” of the country, and this rapid economic development brought about inevitable carbon emissions; the carbon source intensity decreased significantly from 2000 to 2015, indicating that, with the upgrading of technology and economic development, the number of carbon sources required per unit of GDP was greatly reduced. From 2000 to 2015, carbon sinks decreased slightly, with an average annual growth rate of −0.46%. From 2000 to 2010, the number and intensity of carbon sinks were basically stable, and from 2010 to 2015, there was a slight decline, and the average annual growth rate of carbon sinks was −1.45%. This may have also been due to the transformation of ecological land into built-up land due to rapid economic development, resulting in a reduction in carbon sinks and carbon sink intensity [65]. The results show that, during the period of the Wuhan “1+8” City Circle from 2000 to 2015, the carbon emission of land use in the Wuhan Urban Agglomeration emphasized economic development but ignored ecological protection to a certain extent. This model led to the stagnation—and even a retreat—of the pace of ecological protection, which, in turn, led to the continuous growth of carbon emissions and increasingly serious ecological pollution.

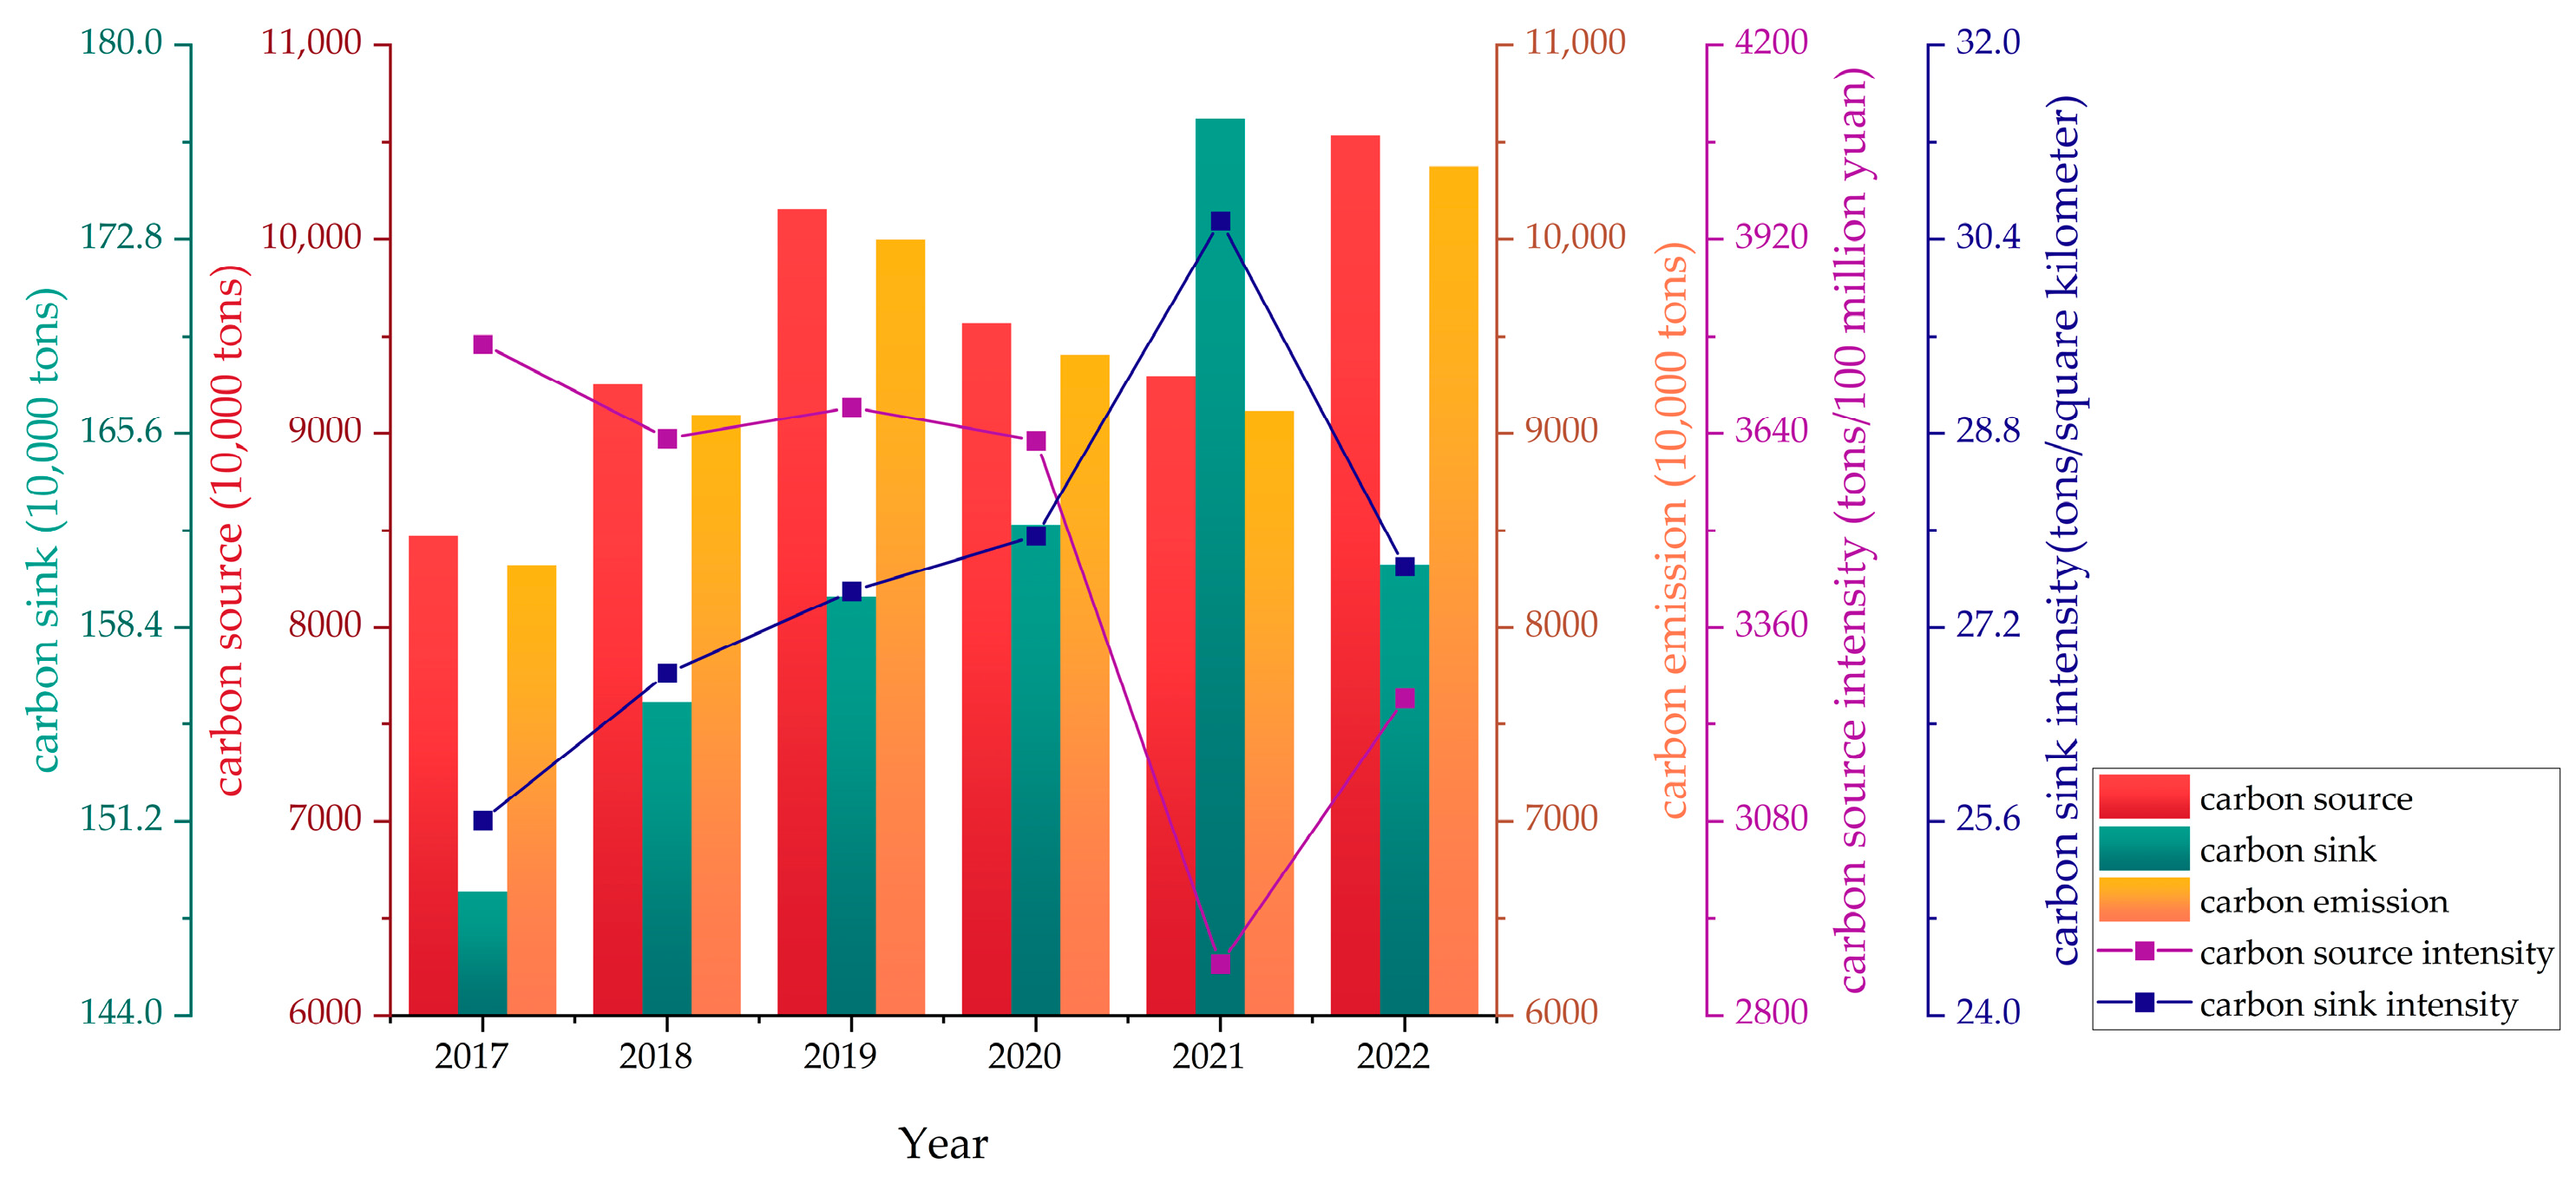
3.2. Trend Analysis of Land-Use Carbon Emissions in the Wuhan Urban Agglomeration from 2017 to 2022

Figure 3 shows the results for the calculations of land-use carbon emissions in the Wuhan Urban Agglomeration from 2017 to 2022 using the carbon emission coefficient method. The average annual growth rates of carbon sources, sinks, and emissions from 2017 to 2022 were 4.46%, 1.58%, and 4.50%, respectively. From 2017 to 2019, the number of carbon sources and emissions showed a continuous growth trend with average annual growth rates of 9.49% and 9.59%, respectively. From 2019 to 2021, it showed a downward trend with average annual growth rates of −4.33% and −4.49%, respectively. From 2021 to 2022, there was a significant rebound, with average annual growth rates of 13.34% and 13.78%, respectively. Perhaps, due to the impacts of COVID-19 in 2020 and 2021, the Wuhan Urban Agglomeration was sealed off in multiple time periods and locations, which led to a stagnant state of urban development [66,67]. Many enterprises that have a greater impact on carbon sources closed down, resulting in a significant reduction in carbon sources and carbon emissions. In 2022, the impact of the pandemic weakened, with only some areas being sealed off from October to November. By December, the restrictions were fully lifted and the economy rebounded. The construction of major enterprises also brought about an increase in carbon emissions. Compared with the sharp reduction in 2000–2015, the carbon source intensity basically remained stable. From 2017 to 2021, the number and intensity of carbon sinks showed a slow growth trend with an average annual growth rate of 4.51%, which was inseparable from the emphasis on ecological green development in Hubei Province in recent years. In 2022, there was a significant downward trend with an average annual growth rate of −9.33%. This may also have been because, in 2022, when the impact of COVID-19 was relatively weak, the economic recovery led to the expansion of the built-up land area and the occupation of ecological land, resulting in a reduction in carbon sinks and carbon sink intensity. The results show that, from 2017 to 2022, the carbon emissions from land use in the Wuhan Metropolitan Area stage not only ensured stable economic development, but also strengthened ecological protection and development. This model ensured that economic development and ecological protection went hand in hand. Although it is still difficult to change the trend of carbon emission growth, it has slowed down to a certain extent. In particular, the two years of COVID-19 restrictions achieved a negative-growth trend for carbon emissions.

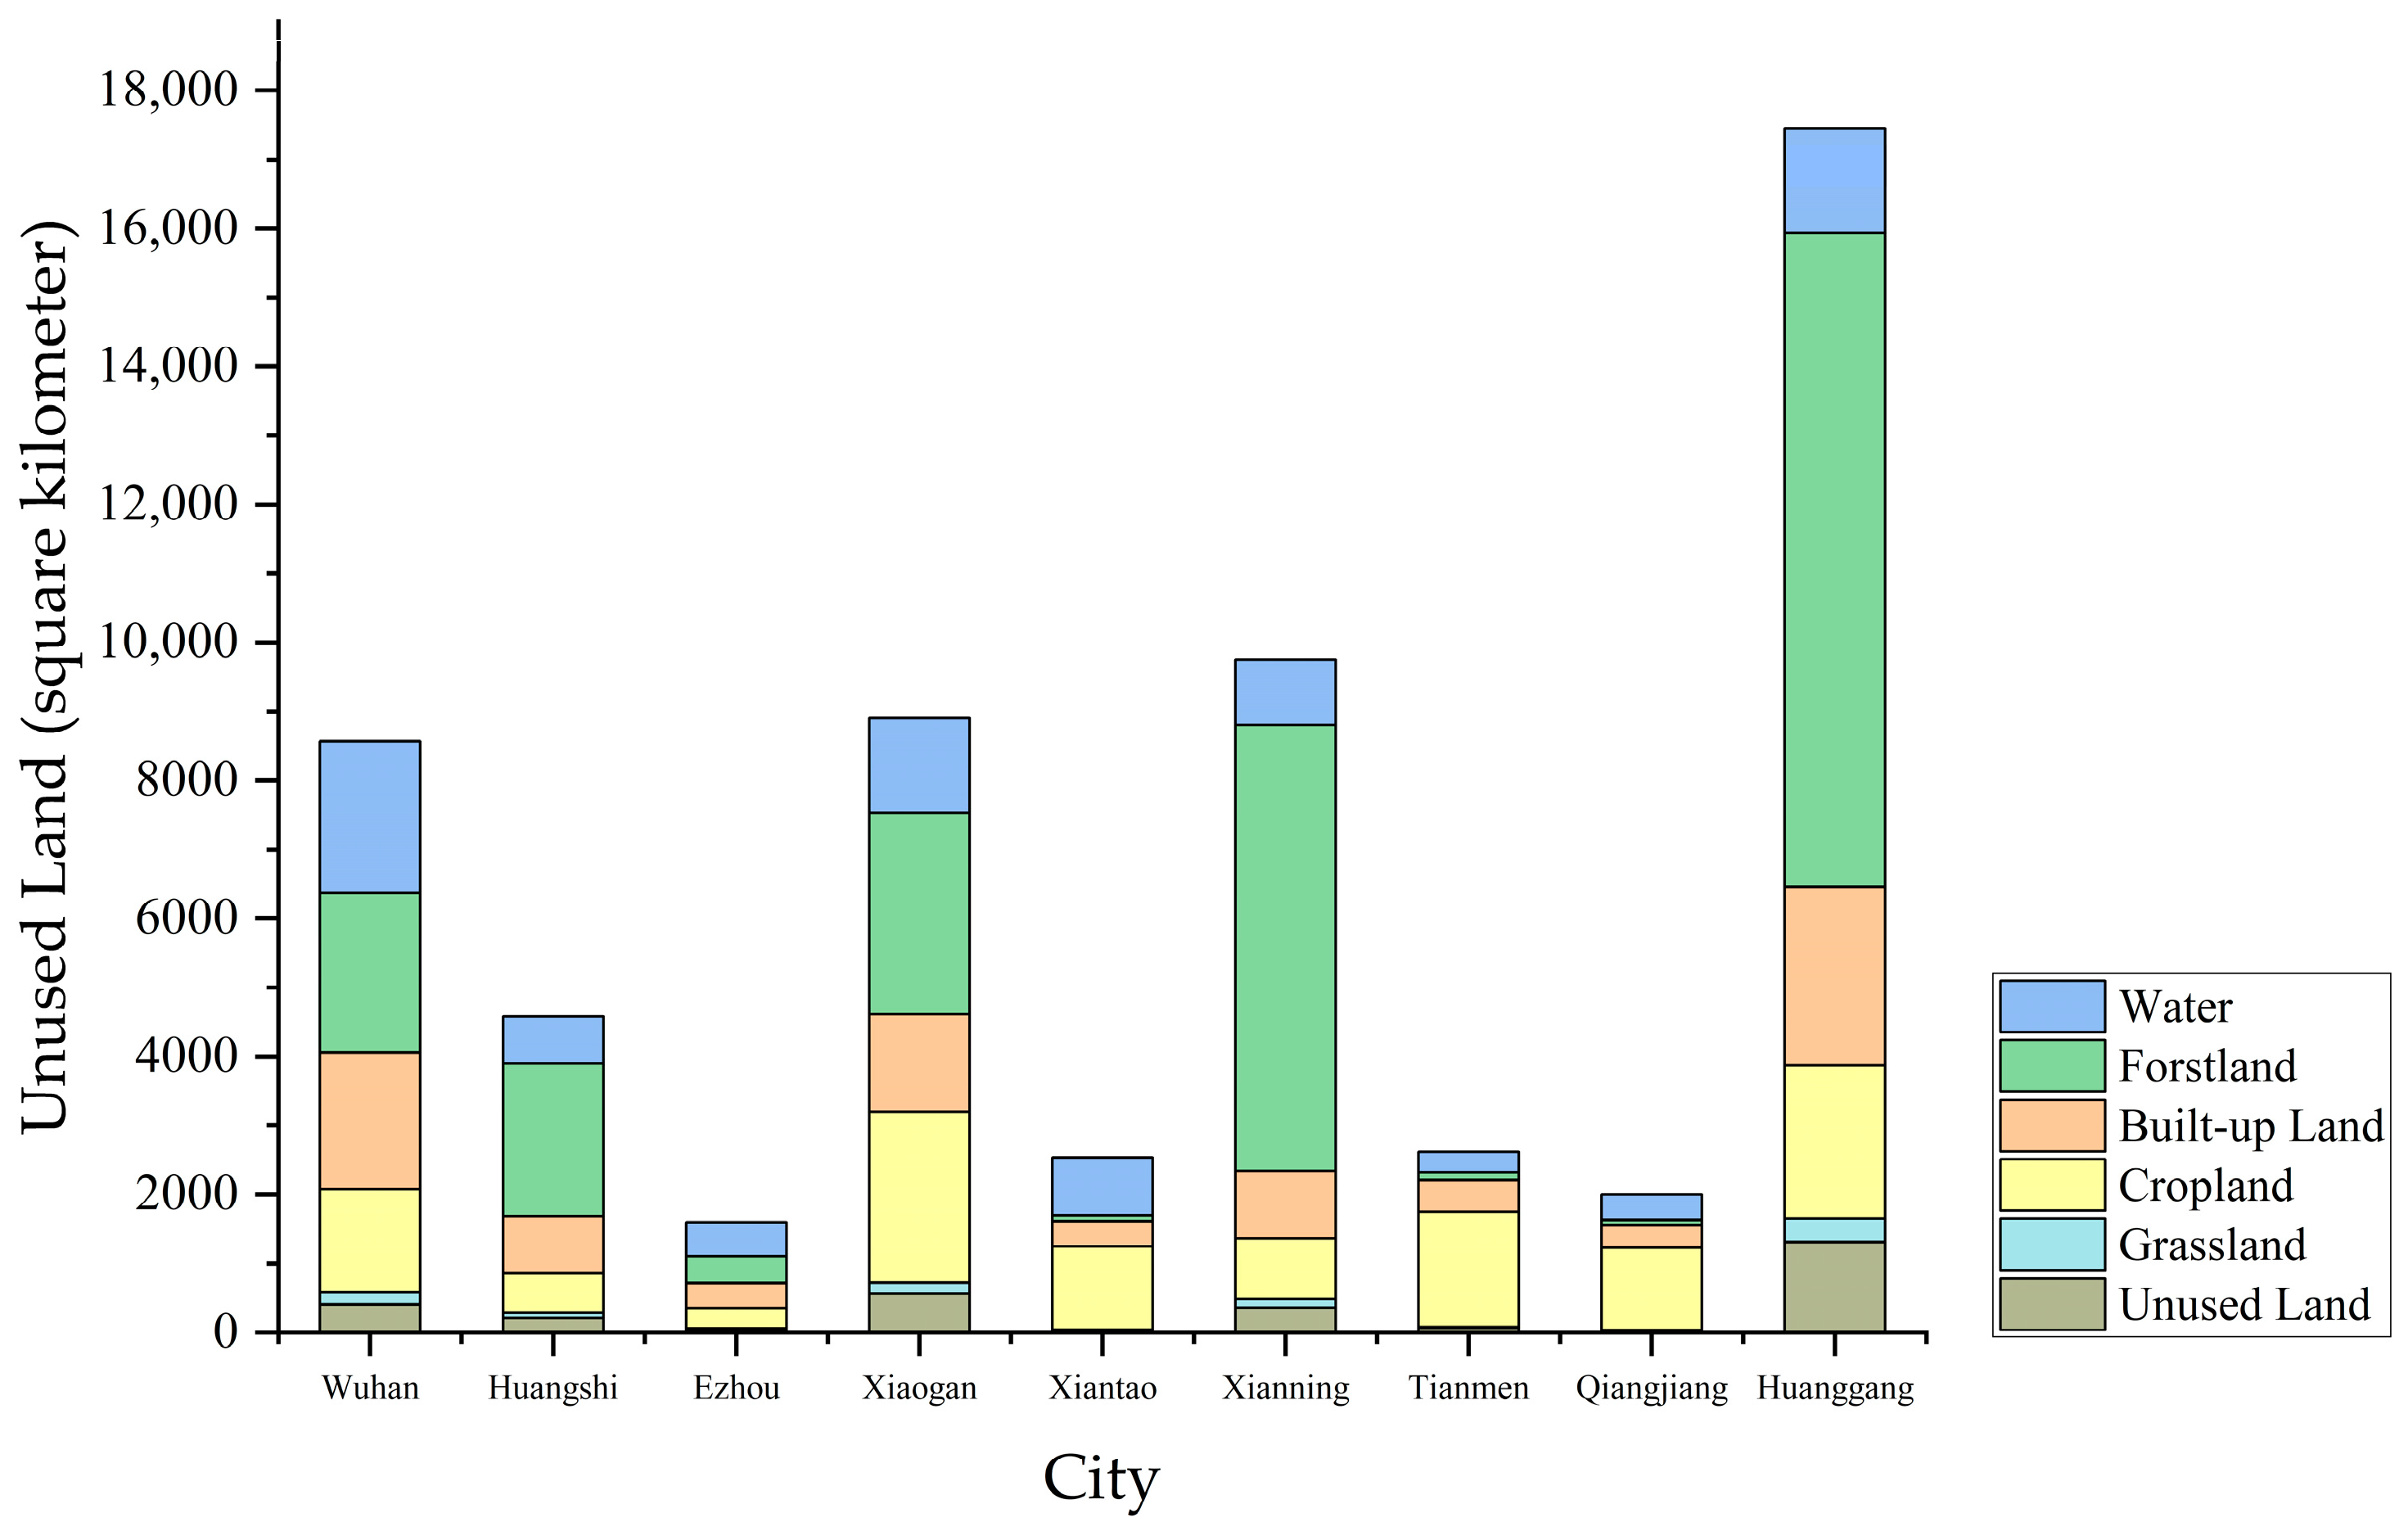
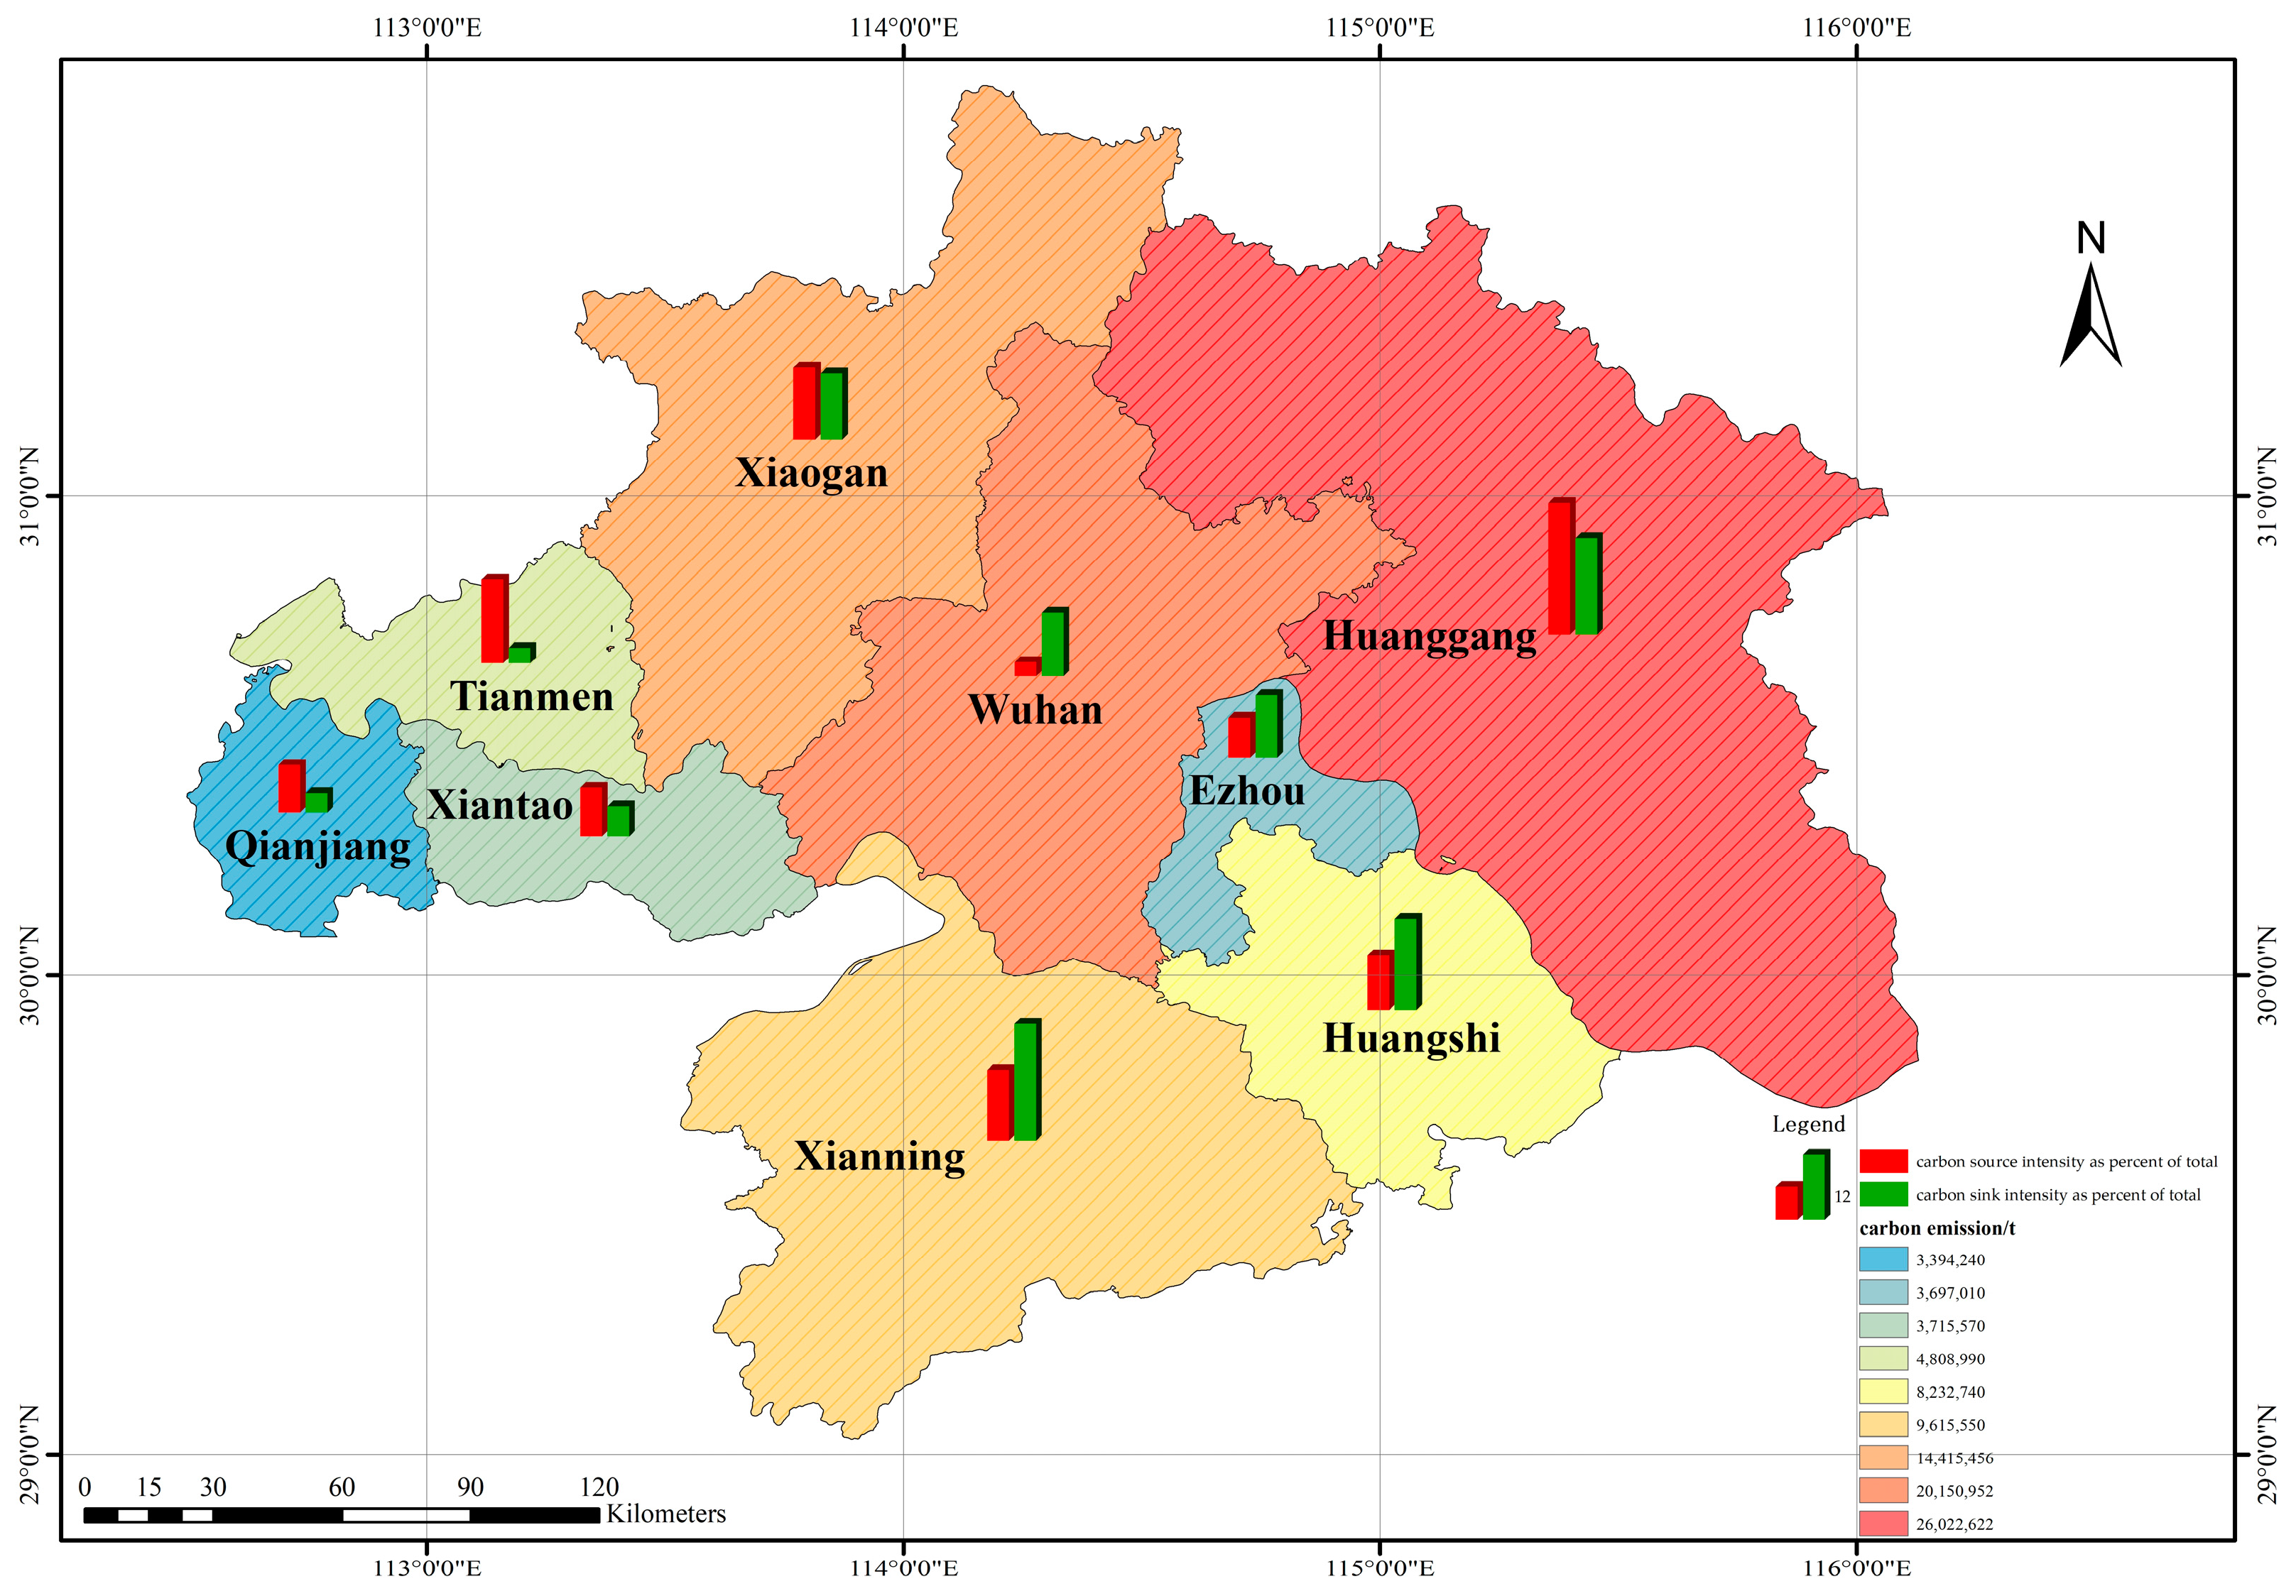
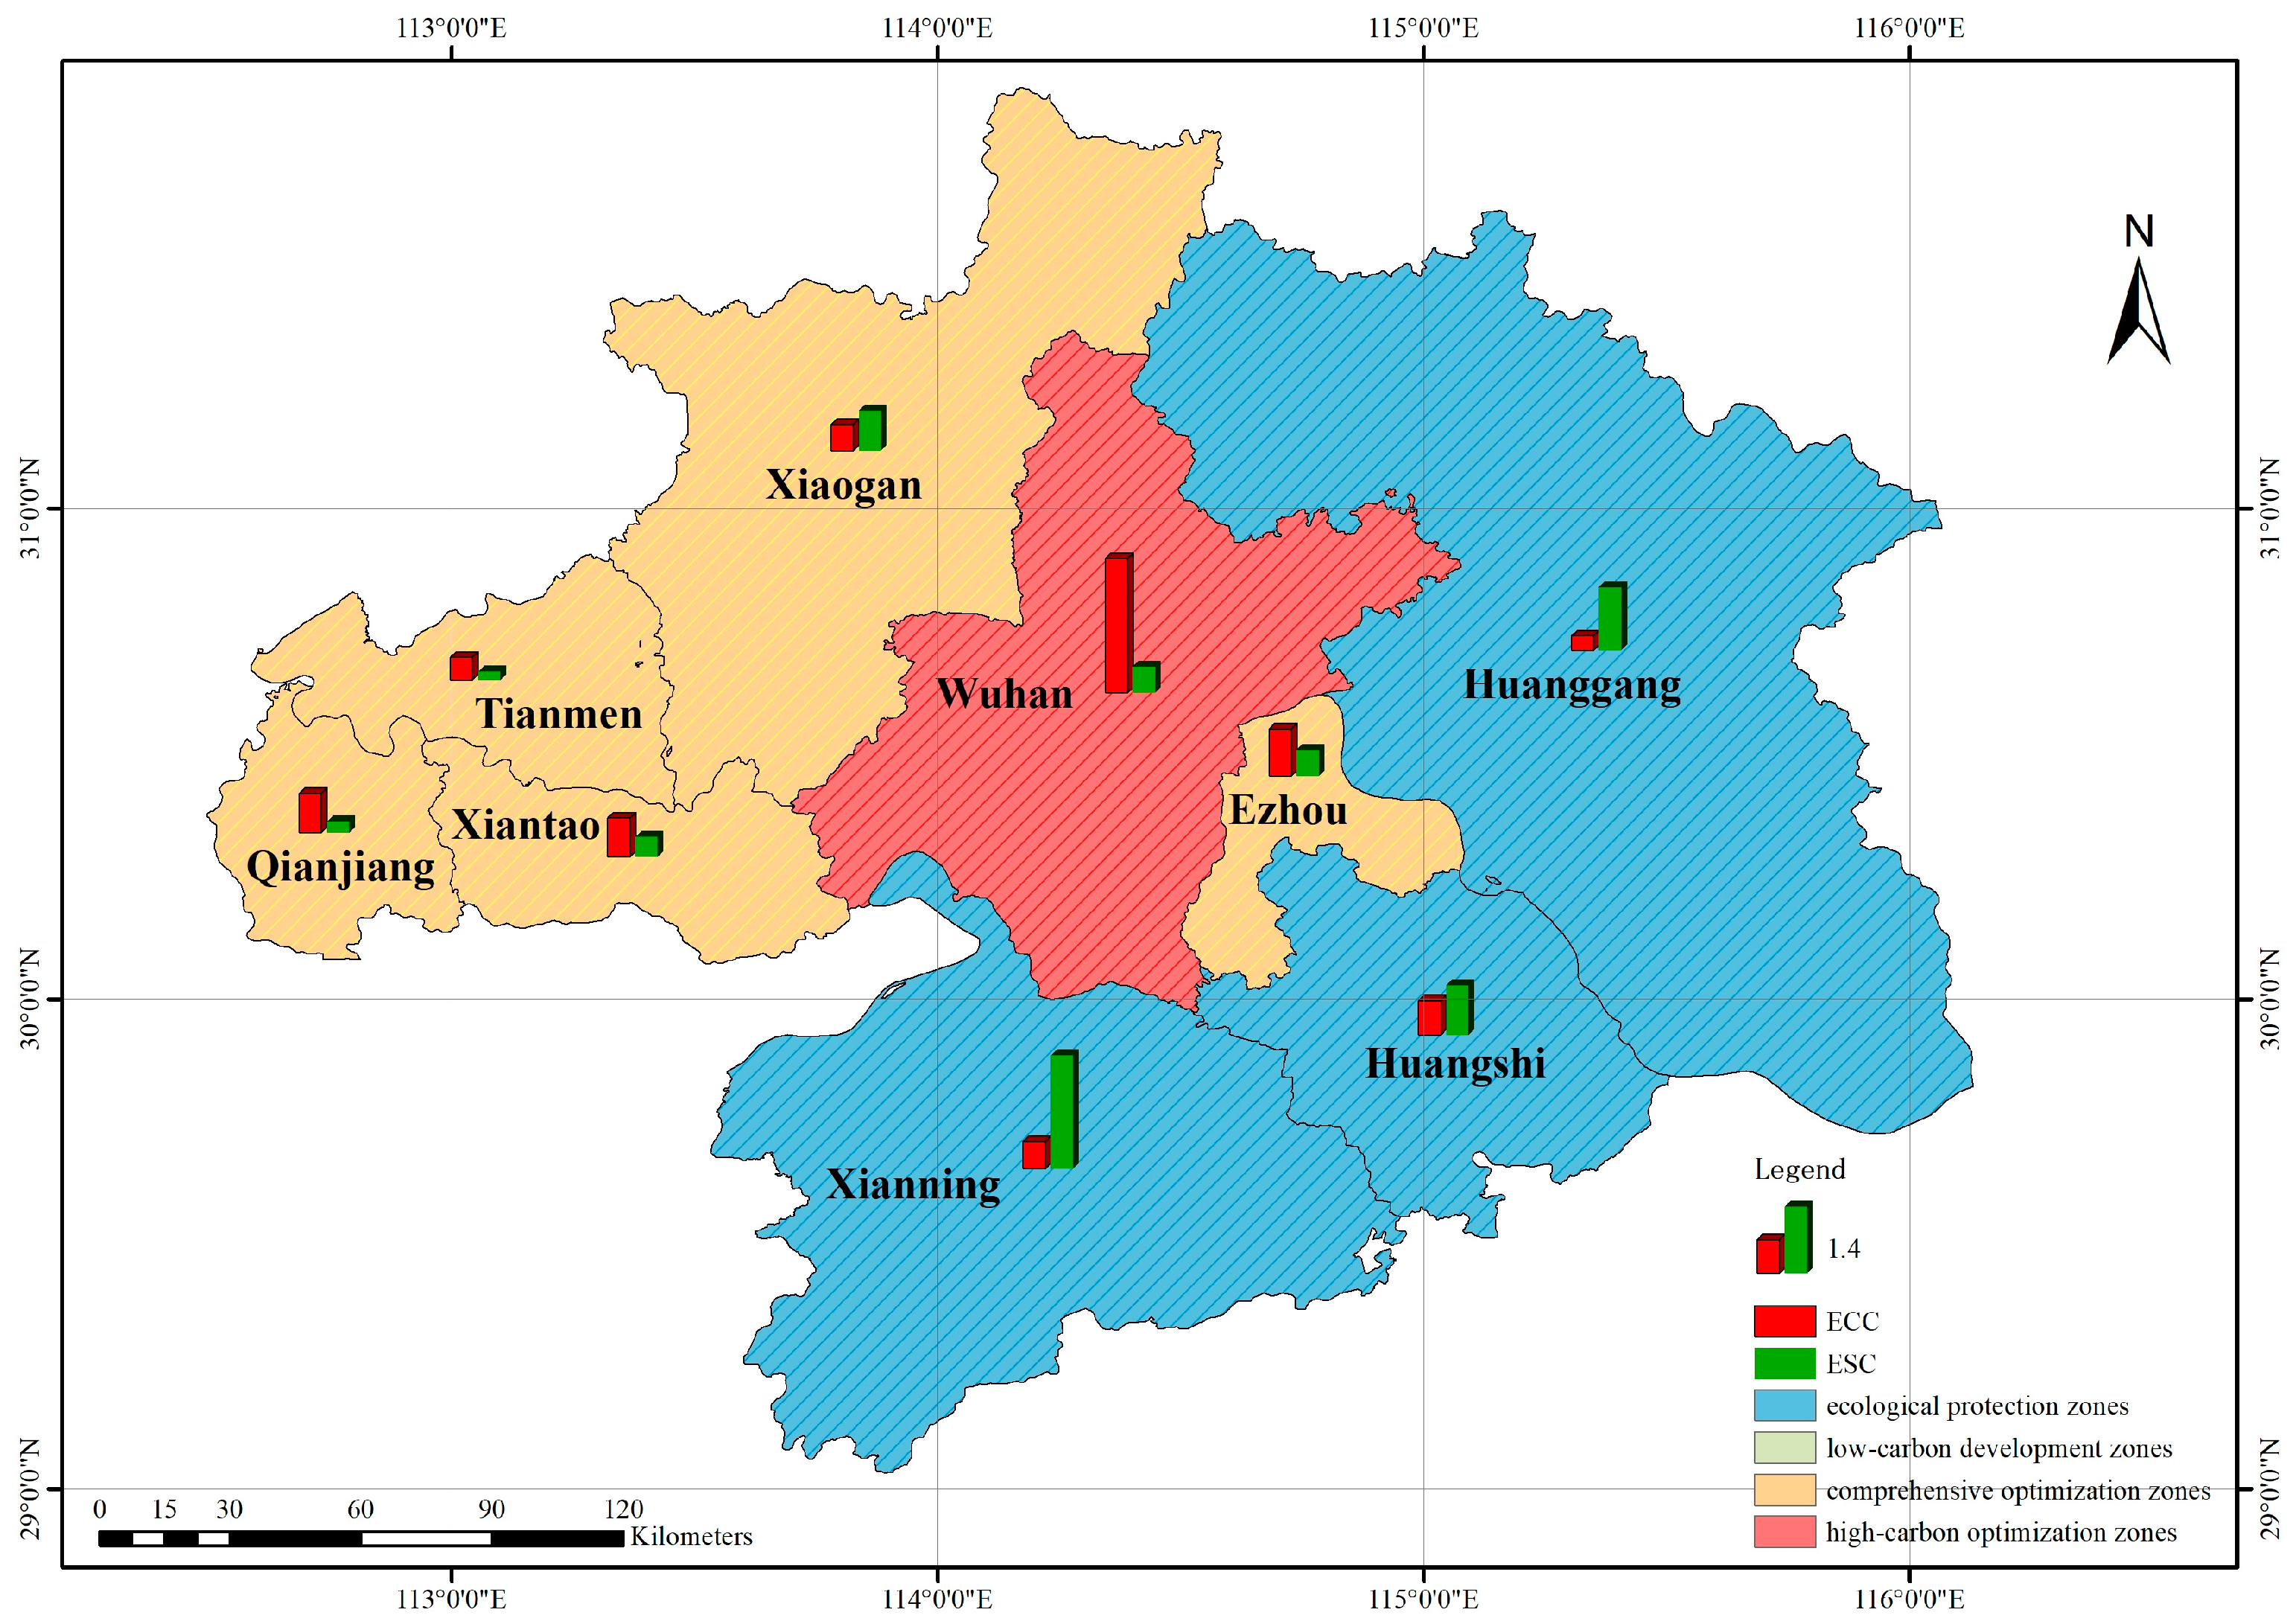
3.3. Differences in the Urban Structure of Carbon Emissions from Land Use in the Wuhan Urban Agglomeration in 2020

From the 2020 map of land-use types in the Wuhan Urban Agglomeration (Figure 4) and the area map of land-use types in each city (Figure 5), it can be seen that the area of forest land is relatively large, accounting for 41.47%, followed by cropland, built-up land, and water, accounting for 20.72%, 15.98%, and 15.02%, respectively. From the perspective of cities, the land-use structures in Huangshi, Xianning, and Huanggang are relatively similar, and forest land accounts for the largest proportion, being greater than 45%. The three cities of Xiantao, Tianmen, and Qianjiang are dominated by cropland, which accounts for more than 45% of the city area. The three cities of Wuhan, Ezhou, and Xiaogan have a relatively balanced area of cropland, forest land, and water. From the perspective of the overall spatial distribution, the built-up land in the Wuhan Urban Agglomeration is concentrated in the downtown area of Wuhan, and the rest of the built-up land is evenly distributed in clusters; most of the water is in the lakes, mainly surrounding the central city of Wuhan; cropland is mainly concentrated on the west side and a small amount is also concentrated on the southeast side; and forest land is mainly distributed in the Mufu Mountains in the south and Dabie Mountains in the northeast.
We used the carbon emission index method to calculate the carbon sources, carbon sinks, carbon emissions, carbon source intensity, carbon sink intensity, carbon source economic contribution coefficient, and carbon sink ecological carrying coefficient for the nine cities in the Wuhan Urban Agglomeration in 2020, as shown in Table 3. Spatial visualization processing was performed on the abovementioned parameters, as shown in Figure 6. In the Wuhan Urban Agglomeration, Huanggang had the largest number of carbon sources, followed by Wuhan. The total carbon sources of the two accounted for 49% of the total amount in the Wuhan Urban Agglomeration. Qianjiang had the lowest number of carbon sources, accounting for only 3.6% of the total amount. This was more consistent with the development of the Wuhan Urban Agglomeration. As the leader in the development of the Wuhan Urban Agglomeration, Wuhan’s economy and development speed far exceed those of other cities, which inevitably leads to a large proportion of carbon sources in Wuhan. As its largest city, Huanggang accounts for 30% of the total area of the Wuhan Urban Agglomeration; therefore, its carbon source is also larger than in the other cities. Huanggang had the largest carbon sink, followed by Xianning. The carbon accumulation of the two accounted for 61% of the Wuhan Urban Agglomeration. The carbon sink of Qianjiang was the smallest, accounting for only 0.8% of the total Wuhan Urban Agglomeration. This was inseparable from the distribution of forest land. The Dabie and Mufu Mountains are in the jurisdictions of Huanggang and Xianning, respectively. They have rich forest resources and, therefore, a large carbon sink. The proportion of carbon emissions was basically the same as the proportion of carbon sources. This was because the carbon accumulation in the Wuhan Urban Agglomeration was relatively low, at only 2% of the total carbon sources. Therefore, it was difficult for the carbon sinks to have a greater impact on the carbon emissions, and the number of carbon sources determined the level of carbon emissions to a certain extent. The carbon source intensity of Wuhan is lower than that of the Wuhan Urban Agglomeration overall, indicating that the number of carbon sources required to produce unit economic benefits is relatively small, and the carbon source utilization efficiency is relatively high. The carbon sink intensities of Huangshi, Xianning, and Huanggang were greater than that of the Wuhan Urban Agglomeration as a whole, indicating that these three cities had more carbon sinks per unit land area and stronger carbon sink absorption capacities.
According to the ECC and ESC, the nine cities in the Wuhan Urban Agglomeration are divided into four types of zones, shown in Table 4. As shown in Figure 7, there is no low-carbon development zone in the Wuhan Urban Agglomeration. Wuhan is the only high-carbon optimization zone and its carbon source economic contribution coefficient is as high as 2.79. Ecological protection zones are concentrated in the east and south, including Xianning, Huangshi, and Huanggang. Among them, the carbon sink ecological carrying coefficient of Huanggang, which was the city that made the greatest contribution to the ecological protection of the Wuhan Urban Agglomeration, was as high as 2.36. The carbon sink ecological carrying coefficient of Huangshi was only 1.03, which shows that Huangshi still has great potential as an ecological protection zone. Comprehensive optimization zones were mainly concentrated in the northwest, including Ezhou, Xiaogan, Xiantao, Tianmen, and Qianjiang. Among them, the economic contribution coefficient of carbon sources in Ezhou was 0.98, and it is very likely to become the next high-carbon optimization zone, making further contributions to the economic development of the Wuhan Urban Agglomeration. The economic contribution coefficient of carbon sources in Tianmen was 0.46 and the ecological carrying coefficient of carbon sinks was 0.17. The road to economic development and ecological protection in Tianmen is long and difficult, and there is still a lot of room for development and progress.
Wuhan, as the only high-carbon optimization zone, is the leader in development and plays an extremely important role in the economic development of the entire Wuhan Urban Agglomeration. However, it should also pay attention to the accumulation of carbon sinks, adopt methods, such as carbon compensation and carbon trading, and strive to make positive contributions to ecological protection. Xianning, Huangshi, and Huanggang are ecological protection zones with a high number of forested areas. They should strictly abide by the bottom-line rules of ecological environment protection, provide full play to their natural advantages, and conduct green development measures. Ezhou, Xiaogan, Xiantao, Tianmen, and Qianjiang are comprehensive optimization zones. While the economic development of these areas is insufficient, the carbon sink function is also poor. They should adjust their industrial structure, optimize their industrial layout, and achieve rapid development, while ensuring the lowest possible carbon levels. There is no low-carbon development zone in the Wuhan Urban Agglomeration, which shows that the positioning of the city’s main functions is quite different, and there is a lack of cities that can both ensure economic development and achieve low-carbon protection. Therefore, cities should develop green industries and strive towards the goal of becoming low-carbon development zones.

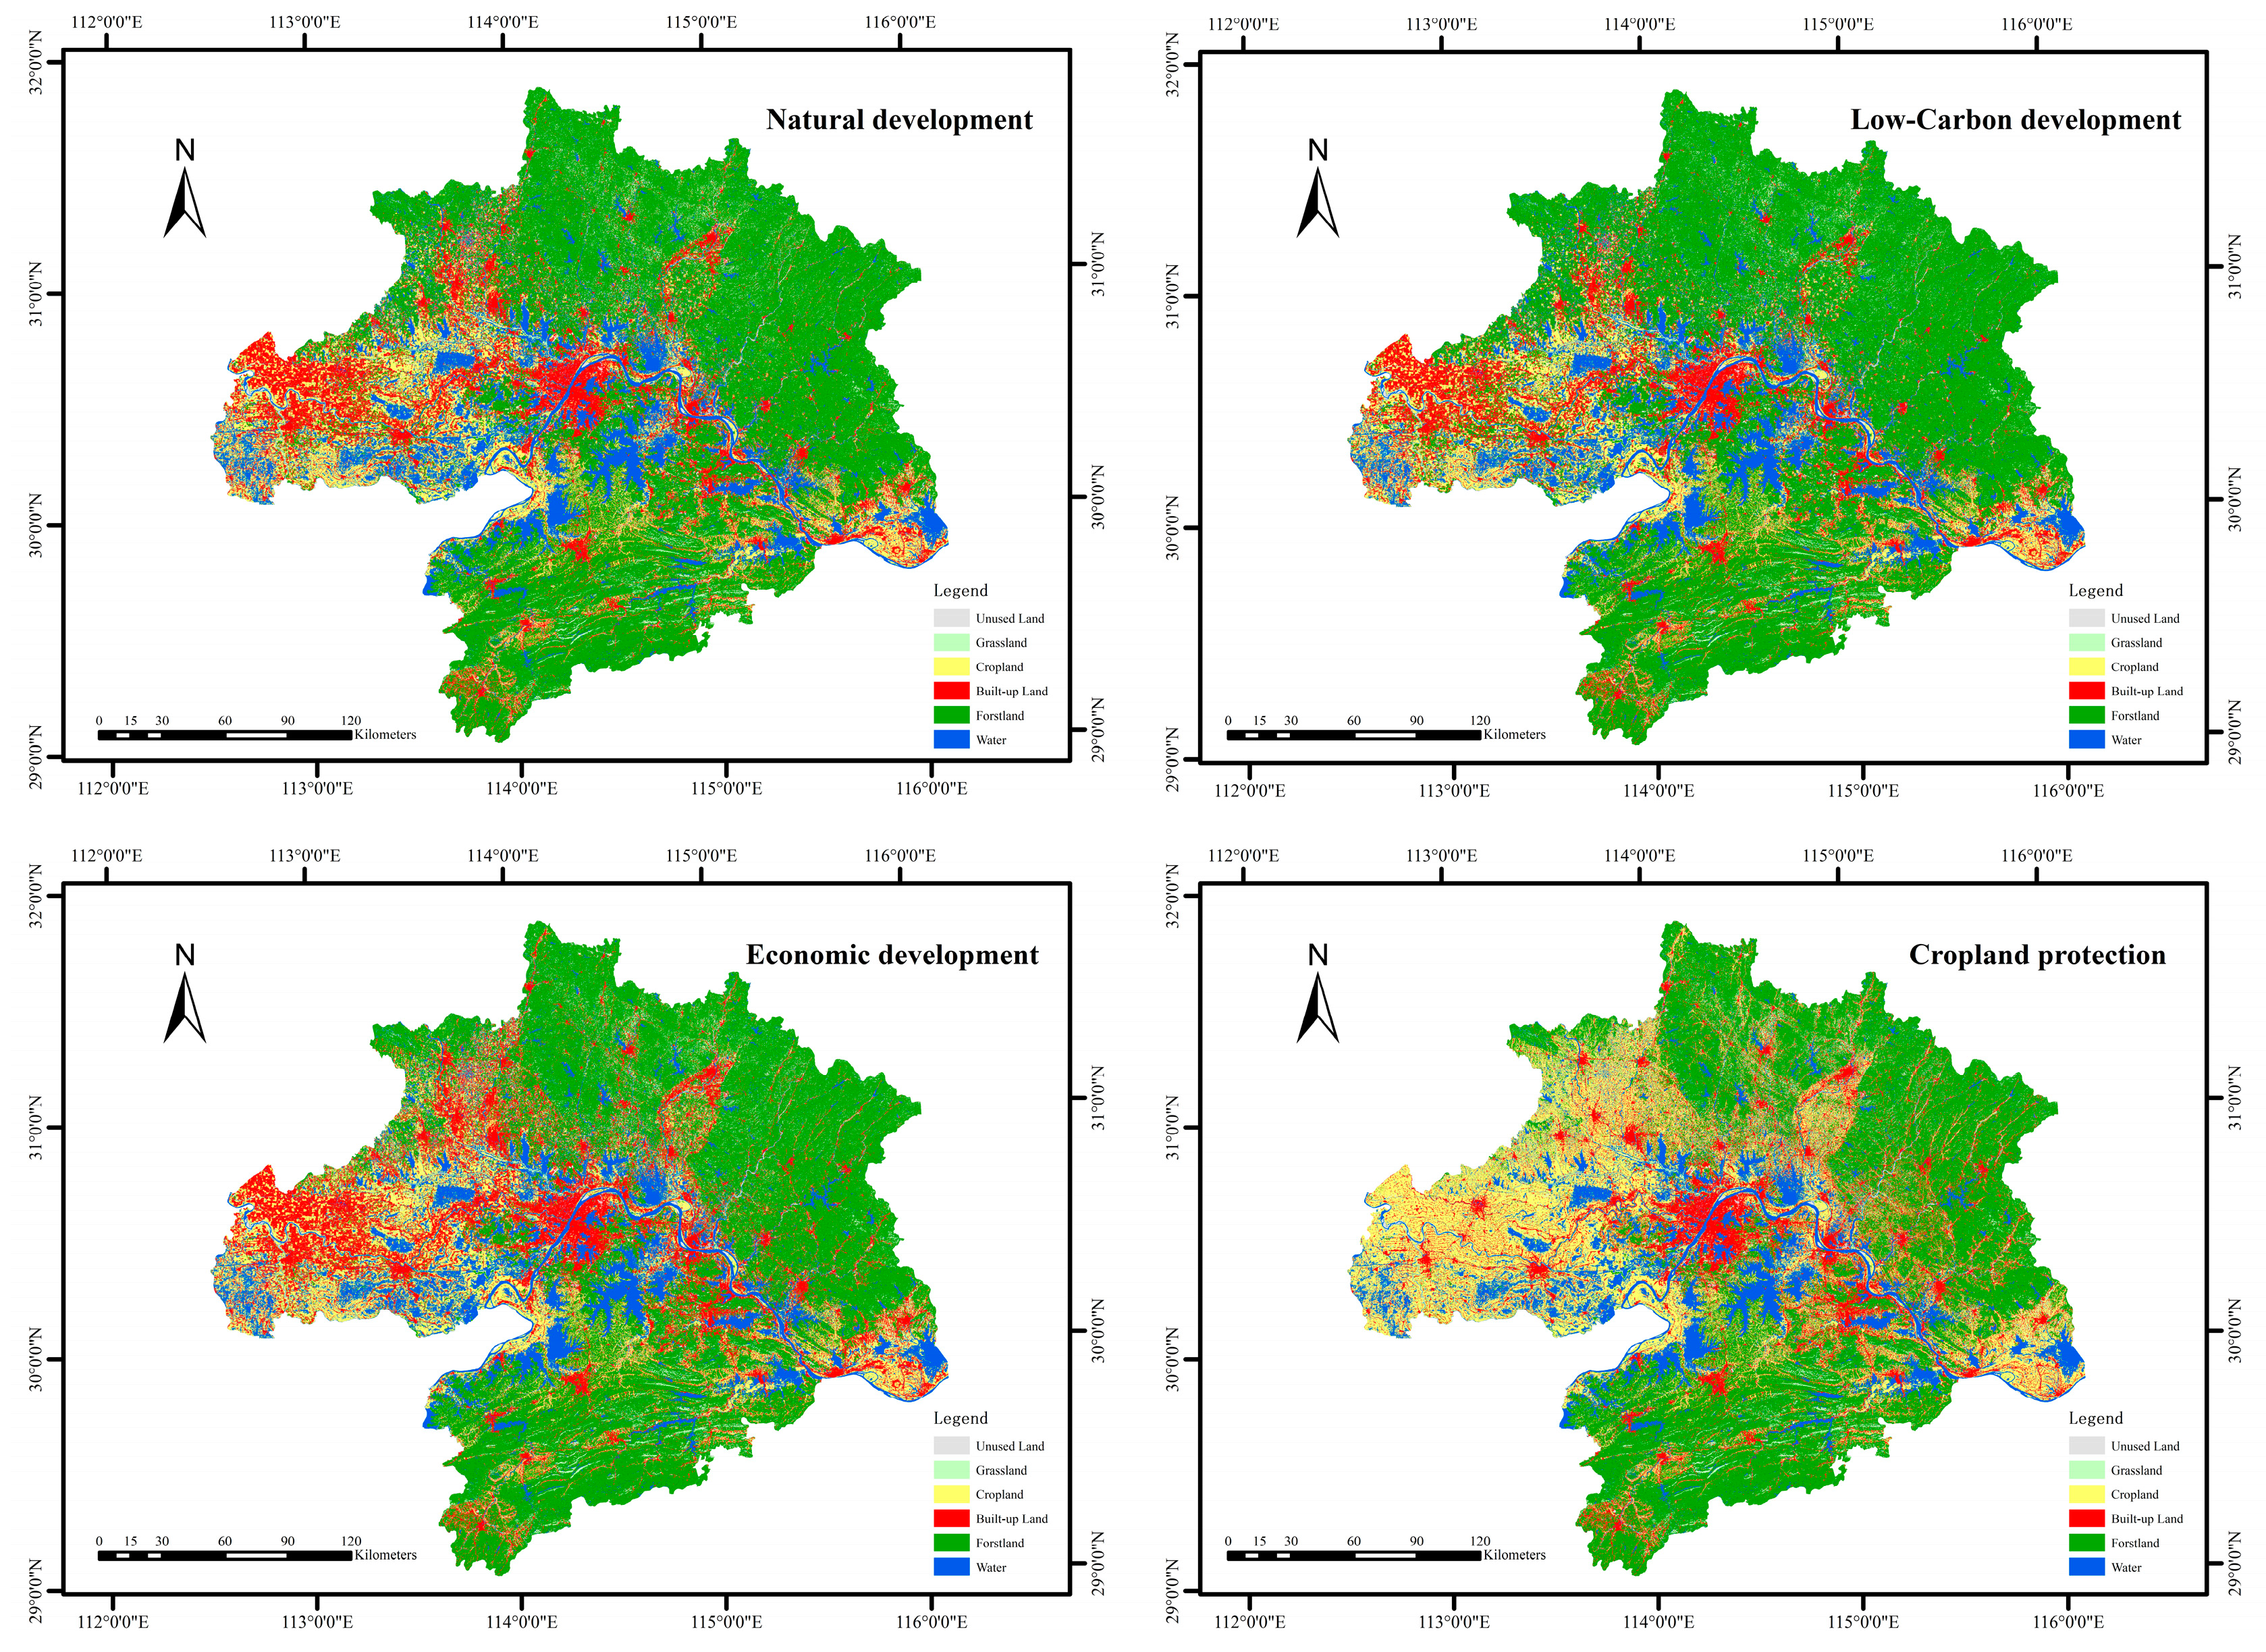
3.4. Prediction of Land-Use Carbon Emissions under a Multi-Scenario Simulation of the Wuhan Urban Agglomeration

The Markov–PLUS model was used to predict the land-use types in natural development, low-carbon development, economic development, and cropland protection scenarios in the Wuhan Urban Agglomeration in 2035. The quantitative results are shown in Table 5 and the spatial results are shown in Figure 8. It can be seen from Table 5 that the unused land area under the four scenarios remains almost unchanged, with only small fluctuations: in terms of grassland area, the three scenarios of low-carbon development, economic development, and cropland protection are almost all the same and are all better than the natural development scenario; the cropland area under the cropland protection scenario is much better than the other three scenarios, followed by economic development, natural development, and low-carbon development; in terms of built-up land area, the economic development scenario is the best, the cropland protection and natural development scenarios are similar, and the low-carbon development is the worst; the forest land area is largest under low-carbon development, followed by natural development, economic development, and cropland protection; the water area under natural development, low-carbon development, and economic development is not very different, while it is the lowest under the cropland protection scenario. It can be seen from Figure 8 that the spatial distribution of unused land and grassland presents little change; the change in the distribution of cropland is mainly due to the fact that, under the cropland protection scenario, there are different degrees of area increase in the west and southeast of the Wuhan Urban Agglomeration, including Qianjiang, Tianmen, Xiantao, the south of Xiaogan, the southwest of Wuhan, and the southeast of Huanggang, compared with the other three scenarios. The change in the distribution of built-up land was mainly due to its expansion, according to the original built-up land area under the economic development scenario. The key expansion areas were the central urban area of Wuhan, the southwest of Tianmen, and multiple urban areas in Xiaogan. The changes in the distribution of forest land were mainly due to low-carbon development. The northeastern and southern regions of the Wuhan Urban Agglomeration included the northern part of Xiaogan and the expansion of forest land in Huanggang, Xianning, and Huangshi. The distribution of water did not change much. The reduced water under the cropland protection scenario was mainly at the edge of the lake and reservoir area, and this part of the area was transformed into built-up land. The main differences in the simulation results of the four different scenarios lie in cropland, built-up land, forest land, and water. Under low-carbon development, the area of forest land increased significantly compared with the other scenarios, while built-up land and cropland decreased slightly. This was mainly because, in the simulated low-carbon scenario, the use of afforestation to reduce carbon caused forest land to occupy built-up land and cropland, and reducing these can also achieve low-carbon development to a certain extent. Under the scenario of economic development, the area of built-up land increased significantly; the area of cropland also increased to a certain extent, compared with natural development and low-carbon development; and the area of forest land decreased. This was because, in the scenario of simulated economic development, vigorously developing the economy led to the continuous expansion of cities and towns, and the area of cropland also increased to meet the basic needs of population expansion, which causes a significant encroachment on forest land, and thus, deforestation. Under the condition of cropland protection, the area of cropland expanded rapidly and the area of forest land and water decreased significantly. This was mainly because, in the context of cropland protection, on the one hand, it was necessary to ensure that cropland would not be encroached on by other land-use types and, on the other hand, its development was realized by pushing the distribution of mountains and reclaiming land from the lakes.
We used the carbon emission index method to further calculate the results of land-use carbon emissions in the Wuhan Urban Agglomeration under a multi-scenario simulation prediction, as shown in Table 6 and Table 7. Overall, the carbon sources in the Wuhan Urban Agglomeration were the highest under the economic development scenario, with 98.5883 million tons, followed by cropland protection, natural development, and low-carbon development; carbon sinks were the highest under the low-carbon development scenario, with 1.9709 million tons, followed by natural development, economic development, and cropland protection; and carbon emissions were ranked in line with carbon sources. Combined with the quantity of each land-use type under the scenario simulation prediction mentioned above, it can be seen that, under the low-carbon development scenario, the considerable increase in the forest land area reduced both the area of built-up land and carbon emissions; under economic development, the built-up land and carbon emissions increased considerably; in the case of cropland protection, the area of cropland increased substantially, most of which was occupied by forest land and water; and the area of built-up land remained stable. Therefore, the increase in carbon emissions was slightly lower. From the city’s point of view, for the scenarios of natural development and low-carbon development, Wuhan had the highest number of carbon sources, while, for the scenarios of economic development and cropland protection, Huanggang surpassed Wuhan in this regard. For the scenarios of natural development, low-carbon development, and economic development, Ezhou had the lowest number of carbon sources, while Qianjiang had the lowest cropland protection. Huanggang was always the city with the most carbon sinks; Qianjiang was the city with the lowest number of carbon sinks under the natural development, low-carbon development, and economic development scenarios; and Tianmen was the city with the lowest number of carbon sinks under the cropland protection scenario. Under the natural development, low-carbon development, and economic development scenarios, Wuhan had the highest carbon emissions and Ezhou had the lowest. Under the cropland protection scenario, Huanggang had the highest carbon emissions, while Qianjiang had the lowest.
It was found that the carbon sources were mainly composed of built-up land; therefore, the change in the built-up land area determined the size of a carbon source, to a certain extent. Therefore, how to control the expansion of built-up land in future planning is particularly important for “source reduction”. On the one hand, it is necessary to perform reasonable planning for the development of the city and to set up a buffer zone for urban expansion in advance at the edge of the city, in case urban development leads to the occupation of forest land and other carbon sink areas. On the other hand, it is necessary to properly control expansion and development, pay more attention to the development mode centered on efficiency, reduce the intensity of carbon sources, and improve the efficiency of carbon source utilization. Carbon sinks are mainly composed of forest land; therefore, increasing the area of forest land is an important means of “increasing sinks”. In future planning, on the one hand, it is necessary to protect the existing forest land and prevent the loss of forest land caused by human factors, such as the expansion and occupation of built-up land, as well as natural factors, such as forest fires. On the other hand, in cities, it is necessary to coordinate and connect green, public, open spaces, such as small parks, small green spaces, and small forests, and build urban green corridors to achieve effective green growth. The number of carbon sources is far higher than the number of carbon sinks. On the one hand, this shows that the impact of carbon sources on carbon emissions is far greater than that of carbon sinks. “Reducing sources” can reduce carbon emissions more rapidly than “increasing sinks”. On the other hand, it also shows that there is still a large gap between the situation at present in the Wuhan Urban Agglomeration and the goal of achieving carbon neutrality. Effectively increasing the number of carbon sinks is a more important means of achieving carbon neutrality after the carbon peak is achieved. From the perspective of cities, by comparing the carbon emission results for the Wuhan Urban Agglomeration in 2020, it can be observed that Wuhan and Huanggang have always been the two cities with the highest proportion of carbon emissions. Carbon emissions in Xiaogan will also gradually increase, and it will become a city with the highest carbon emissions after Wuhan and Huanggang. These three cities will always be the key areas of “source reduction”. The forestland areas in Huanggang, Xiaogan, and Wuhan are the most susceptible to the impact of different planning methods, resulting in considerable changes in carbon sinks, indicating that the forestland in these three cities needs to be protected, and other land-use methods should be avoided as much as possible. The carbon emissions from Tianmen under the cropland protection scenario remain at the same level as in 2020, while the other three scenarios produced a considerable increase. This indicates that Tianmen may be the next key city for vigorous development, and it may also become a high-carbon optimization area that urgently needs to reduce carbon levels. How to reduce the increase in carbon emissions caused by urban development as much as possible is an issue that needs to be focused on in Tianmen’s development planning.

4. Discussion

4.1. Discussion of the Findings

We selected the experimental results from land-use carbon emissions from 2000 to 2015 and compared them with the existing research results for the Wuhan Urban Agglomeration to verify the accuracy of this article. Compared with the results of En Chen [68], the calculated carbon sources, sinks, and emissions in this article were all lower. The reasons for the differences were as follows: En Chen’s research divided cropland into two parts for the calculations, namely, carbon sources and carbon sinks. However, this paper comprehensively calculated the D-value between the carbon sources and carbon sinks of cropland, resulting in less of both. Both calculation methods can be used. The former can reflect the different effects of arable land as a carbon source and sink in more detail, while the latter directly reflects the final presentation state of arable land, making the calculation more convenient. En Chen added carbon emissions from the tertiary industry and population to the calculation of carbon sources for built-up land, while this paper only calculated the carbon emissions generated by energy consumption. Therefore, the carbon sources and carbon emissions calculated in this paper were less than those in En Chen’s research. Compared with the results of Junfeng Zhang et al. [69], the carbon emissions calculated in this paper were higher, and the reasons for the differences were as follows: his research overestimated the carbon sequestration function of cropland, and the overall carbon emissions from the cropland showed carbon sequestration, which led to lower-value research results. In addition, the carbon emissions from transportation introduced in his research are worth further study; however, it is still necessary to consider whether accurate estimates can be achieved to add to the final land-use carbon emission results.
The experimental results show that the Markov–PLUS model presented a significant improvement in the simulation and prediction effect of land use in the Wuhan Urban Agglomeration (kappa coefficient: 0.87; overall accuracy: 90%) compared to Haijun Wang et al. [70], who used the CA-Markov model to simulate built-up land use in the Wuhan urban area (overall accuracy: 80%). This solved the problem of traditional CA models lacking a relationship between impact factors and spatial changes. Compared to Zizheng Zhang et al.’s [71] use of the Markov-FLUS model (kappa coefficient: 0.85), there was a slight improvement, and this paper solved the problem of the lack of temporal attributes in the FLUS model. Compared to Guoping Huang et al.’s [72] use of the CLUE-S model in the Wuchang District, Wuhan City (kappa coefficient: 0.86), there was also a slight improvement, and this paper solved the problem of the CLUE-S model ignoring the possibility of non-dominant land-type transformations. The experimental results show a significant improvement compared to the PLUS model’s research on the other regions, such as Jiening Wang et al.’s [73] simulation and prediction of land use in Shandong Province (kappa coefficient: 0.68), and Ziyao Wang et al.’s [74] simulation and prediction of land use in Beijing (kappa coefficient: 0.77). Compared with the results for the land-use simulation prediction of Yunnan Province (kappa coefficient: 0.89; overall accuracy: 0.93) by Rongyao Wang et al. [75], and of Changsha City (kappa coefficient: 0.91; overall accuracy: 0.95) by Kao Zhang et al. [40], there is still a gap in the research. The reason may be that the spatial resolution of land use in this paper is high; therefore, the prediction accuracy is slightly lower but the accuracy results meet the experimental requirements. In the future, methods can be found for optimization.

4.2. Innovations and Possible Improvement Directions

There were two main aspects to this paper and certain directions for future improvements. First of all, the carbon emission coefficient method was essentially an empirical model [11]. This paper referred to the carbon emission coefficients in the relevant literature; however, those of built-up land in different regions varied greatly and the universality was poor. For example, Kangkang Yu et al. [43] calculated the carbon emission coefficient of built-up land in the Taihu Lake Basin as 65.30   t C / hm 2 · a , and the research results of Na Lu [76] showed that the Chinese built-up land carbon emission coefficient was 40.73   t C / hm 2 · a . Therefore, this study chose to indirectly calculate the carbon emissions of the Wuhan Urban Agglomeration based on the energy data. At the same time, a new problem arose, namely, it was difficult to obtain the energy data for previous years and below the municipal level. Therefore, based on the energy data and the area of built-up land, this study calculated the carbon emission coefficient of built-up land in line with the existing situation of the Wuhan Urban Agglomeration in order to obtain a more accurate result. However, the energy utilization efficiency of built-up land in different periods was still different [77]; therefore, the carbon emission coefficients for the same location during different periods will still present certain differences. Establishing an accurate carbon emission coefficient system to calculate the carbon emissions in different regions, time periods, and scales will be the focus of the future research. This paper explored the carbon emissions from land use in the Wuhan Urban Agglomeration through the changes in the trends of land use carbon emissions and structure between cities. Using the carbon emission coefficient method, the results obtained may be different to the actual value. However, this does not affect the judgment of the development trend obtained through long-term calculations and the structural judgment obtained through the calculations performed for different cities in the region. Through the research on their temporal and spatial differences, coupled with the implementation of relevant policies, it is beneficial to reveal the impact of policy implementation on land-use carbon emissions, and provide theoretical and technical support for subsequent research planning.
Secondly, this paper used the two aspects of land-use quantity constraints and land-use spatial transfer constraints to simulate the scenarios. Compared with other relevant research examples, such as Haishan He et al. [39], who only simulated scenarios based on the constraints of land-use area change, this paper not only realized the changes in land-use areas through quantitative constraints, but also performed more detailed scenario simulations, such as strictly restricting the encroachment on basic farmland by other land-use methods through spatial transfer constraints [78]. The results of this study show that, although the low-carbon development scenario can considerably promote ecological protection, it inevitably hinders economic development. On the contrary, the economic development scenario ignores ecological protection while ensuring rapid economic development. Meanwhile, cropland was strictly protected and thus continuously expanded. These are relatively extreme scenarios, which obviously do not conform to the complex and diverse development scenarios in reality; however, they can show us the consequences of different decisions made from an extreme perspective. Therefore, how to simulate a comprehensive development scenario based on land-use conversion rules and the number of land-use conversions in the future, so as to find a better comprehensive and optimized development scenario, is a research point that needs to be considered.

5. Conclusions

Based on the carbon emission coefficient method, this study analyzed the trend of land-use change in two stages of the Wuhan Urban Agglomeration from 2000 to 2022 and the carbon emission patterns of land use in each city in the Wuhan Urban Agglomeration in 2020. Based on the Markov–PLUS model, this study simulated the carbon emissions of land use in the Wuhan Urban Agglomeration in 2035 under four scenarios. The conclusions are as follows:
  • From 2000 to 2015, before and during the establishment of the Wuhan “1+8” City Circle, the carbon emissions of land use emphasized economic development, but ignored ecological protection to a certain extent.
  • From 2017 to 2022, before and after the establishment of the Wuhan Metropolitan Area, the carbon emission of land use not only ensured stable economic development, but also strengthened ecological protection and development.
  • In terms of urban structure differences, there were significant differences in the positioning of cities’ main functions in the Wuhan Urban Agglomeration, and there was a lack of cities that could both ensure economic development and achieve low-carbon protection.
  • The Markov–PLUS model produced good simulation results for land-use carbon emissions in the Wuhan Urban Agglomeration. The results of this research indicate that limiting the expansion of built-up land and protecting forest land are the optimal and quickest ways to achieve a carbon peak and carbon neutrality. Wuhan, Huanggang, and Xiaogan were key cities for future carbon source reductions, and further attention should be paid to ecological protection for the future development of Tianmen.

Supplementary Materials

The following supporting information can be downloaded at: https://www.mdpi.com/article/10.3390/su151411021/s1, Tables S1–S4: Area of various land use types in Wuhan Urban Agglomeration in 2000–2015.; Tables S5–S8: Land use carbon emissions in Wuhan Urban Agglomeration in 2000–2015.; Tables S9–S14: Area of various land use types in Wuhan Urban Agglomeration in 2017–2022.; Tables S15–S20: Land use carbon emissions in Wuhan Urban Agglomeration in 2017–2022. Table S21: Land use carbon emissions in Wuhan Urban Agglomeration in 2035 under natural development scenario. Table S22: Land use carbon emissions in Wuhan Urban Agglomeration in 2035 under low-carbon development scenario. Table S23: Land use carbon emissions in Wuhan Urban Agglomeration in 2035 under economic development scenario. Table S24: Land use carbon emissions in Wuhan Urban Agglomeration in 2035 under cropland protection scenario.

Author Contributions

Conceptualization, J.Z., H.D. and C.Z.; methodology, J.Z.; software, J.Z.; validation, J.Z., H.D. and S.H.; formal analysis, J.Z. and H.D.; investigation, J.Z., C.Z. and L.Z.; resources, H.D., L.Z. and S.H.; data curation, C.Z.; writing—original draft preparation, J.Z.; writing—review and editing, H.D., C.Z. and S.H.; visualization, J.Z.; supervision, H.D., C.Z. and L.Z.; project administration, H.D. and C.Z.; funding acquisition, C.Z. and L.Z. All authors have read and agreed to the published version of the manuscript.

Funding

This research was funded by the Scientific Research Project of Spatial Planning Institute of Hubei Province, grant number HX463, the Scientific Research Project of Hubei Provincial Department of Natural Resources, grant number HBECC-ZB-ZC22049, and National Natural Science Foundation of China (NSFC), grant number 52079101.

Institutional Review Board Statement

Not applicable.

Informed Consent Statement

Not applicable.

Data Availability Statement

All the data used for the study appear in Section 2.2 in the submitted article and Supplementary Materials.

Acknowledgments

The authors thank the Resource and Environmental Science and Data Center for providing free land-cover, temperature and precipitation, soil-type, and NPP data; the Google Earth Engine for providing Sentinel-2 data; Geospatial Data Cloud for providing DEM data; the National Catalogue Service For Geographic Information for providing road network and water system data; the NOAA for providing NPP/VIIRS data; and the Hubei Provincial Bureau of Statistics for providing economic and energy data.

Conflicts of Interest

The authors declare no conflict of interest.

References

  1. IPCC. Climate Change 2022: Impacts, Adaptation and Vulnerability. Interaction 2022, 50, 33. [Google Scholar]
  2. Talley, T. Call for Expert Reviewers to the U.S. Government Review of the Working Group I Contribution to the Fifth Assessment Report of the Intergovernmental Panel on Climate Change (IPCC), Climate Change 2013: The Physical Science Basis. Fed. Regist. 2012, 77, 59238–59239. [Google Scholar]
  3. Wang, Z.L.; Liu, C.X.; Jiang, Q.X.; Li, S.Q.; Chai, X. Effects of Climate Warming on the Key Process and Index of Black Soil Carbon and Nitrogen Cycle During Freezing Period. Environ. Sci. 2021, 42, 1967–1978. [Google Scholar]
  4. Cai, R.S.; Wang, H.; Zheng, H.Z.; Guo, H.X. Action Against Climate Tipping Points: Carbon Neutrality. China Popul. Resour. Environ. 2021, 31, 16–23. [Google Scholar]
  5. Zhang, X.Q. Methodological Issues Related to Measuring and Monitoring Carbon Stock Changes Induced by Land Use Change and Forestry Activities. Acta Ecol. Sin. 2004, 24, 2068–2073. [Google Scholar]
  6. Maxwell, B.; Olivia, P. Now or Never: How Media Coverage of the IPCC Special Report on 1.5 °C Shaped Climate-Action Deadlines. One Earth 2019, 1, 285–288. [Google Scholar]
  7. Li, L.; Xia, Q.Y.; Dong, J.; Zhang, B. County-Level Carbon Ecological Compensation of Wuhan Urban Agglomeration Under Carbon Neutrality Target: Based on the Difference in Land Use Carbon Budget. Acta Ecol. Sin. 2023, 7, 1–13. [Google Scholar]
  8. Ge, Q.S.; Dai, J.H.; He, F.N.; Pan, Y.; Wang, M.M. Land Use, Land Cover Change and Carbon Cycle in China over the past 300 Years. Sci. China Earth Sci. 2008, 38, 197–210. [Google Scholar]
  9. Yu, F.; Liu, J.; Xia, L.H.; Long, X.C.; Xu, Z.W. Landscape Ecological Risk Assessment in Weibei Dryland Region of Shaanxi Province Based on LUCC. China Environ. Sci. 2022, 42, 1963–1974. [Google Scholar]
  10. Han, J.; Zhou, X.; Xiang, W.N. Progress in Research on Land Use Effects on Carbon Emissions and Low Carbon Management. Acta Ecol. Sin. 2016, 36, 1152–1161. [Google Scholar]
  11. Sun, J.F.; Zhang, Y.; Qin, W.S.; Chai, G.Q. Estimation and Simulation of Forest Carbon Stock in Northeast China Forestry Based on Future Climate Change and LUCC. Remote Sens. 2022, 14, 3653. [Google Scholar] [CrossRef]
  12. Yang, X.H.; Jin, X.B.; Liu, J.; Gu, Z.M.; Zhou, Y.K. Design and Implementation of System Estimating Carbon Emission Induced by Land Use /CoverChange. Bull. Surv. Map. 2019, 4, 54–59. [Google Scholar]
  13. Wang, H.; Jin, Y.J.; Hong, M.M.; Tian, F.; Wang, J.X.; Nie, X. Integrating IPAT and CLUMondo Models to Assess the Impact of Carbon Peak on Land Use. Land 2022, 11, 573. [Google Scholar] [CrossRef]
  14. Zhang, R.Q.; Li, P.H.; Xu, L.P. Effects of Urbanization on Carbon Emission from Land Use in Xinjiang and their Coupling Relationship. Acta Ecol. Sin. 2022, 42, 5226–5242. [Google Scholar]
  15. Feng, J.; Wang, T. Analysis of Influencing Factors and Evolution of Land Use Carbon Emission in China. Soft Sci. 2016, 30, 87–90. [Google Scholar]
  16. Ma, M.J.; Li, Q.; Zhou, W.R. Study of Carbon Ecological Compensation in Yellow River Basin Based on Carbon Neutrality. Yellow River 2021, 43, 5–11. [Google Scholar]
  17. Zhao, R.Q.; Huang, X.J.; Zhong, T.Y.; Chuai, X.W. Carbon Effect Evaluation and Low-Carbon Optimization of Regional Land Use. Trans. Chin. Soc. Agric. Eng. 2013, 17, 220–229. [Google Scholar]
  18. Zeng, Y.N.; Wang, H.M. Optimization of Land Use Structure for Low-Carbon Targets in Haidong City, Qinghai Plateau. Resour. Sci. 2015, 10, 2010–2017. [Google Scholar]
  19. Hu, Y.T.; Li, T.H. Forecasting Spatial Pattern of Land Use Change in Rapidly Urbanized Regions Based on SD-CA Model. Acta Sci. Nat. Univ. Pekin. 2022, 58, 372–382. [Google Scholar]
  20. Bian, Z.H.; Ma, X.X.; Gong, L.C.; Zhao, J.; Zeng, C.F.; Wang, L.C. Land Use Prediction Based on CLUE-S Model Under Different Non-spatial Simulation Methods: A Case Study of the Qinhuai River Watershed. Sci. Geogr. Sin. 2017, 37, 252–258. [Google Scholar]
  21. Liu, X.P.; Liang, X.; Li, X.; Xu, X.; Ou, J.; Chen, Y.; Li, S.; Wang, S.; Pei, F. A Future Land Use Simulation Model (FLUS)for Simulating Multiple Land Use Scenarios by Coupling Human and Natural Effects. Landsc. Urban Plan. 2017, 168, 94–116. [Google Scholar] [CrossRef]
  22. Yi, D.; Ou, M.H.; Guo, J.; Han, Y.; Yi, J.L.; Ding, G.Q.; Wu, W.J. Progress and Prospect of Research on Land Use Carbon Emissions and Low-Carbon Optimization. Resour. Sci. 2022, 44, 1545–1559. [Google Scholar] [CrossRef]
  23. Xu, J.; Pan, H.Y.; Huang, P. Carbon Emission and Ecological Compensation of Main Functional Areas in Sichuan Province Based on LUCC. Chin. J. Eco-Agric. 2019, 27, 142–152. [Google Scholar]
  24. Cao, Z.L.; Zhang, X.R.; Yuan, X.F.; Chen, J.H. Spatio’temporal Variation and Innuencing Factors of CO2 Emission at County ScaIe in Shanxi Province Based on Land Use Change. Bull. Soil Water Conserv. 2022, 58, 376–385. [Google Scholar]
  25. Christiane, C.L.; Marcos, H.C.; Britaldo, S.S.; Letícia, B.V.H. Historical Land Use Change and Associated Carbon Emissions in Brazil from 1940 to 1995. Glob. Biogeochem. Cycles 2012, 26, 1–13. [Google Scholar]
  26. Alejandro, C.; Roberto, P.; Diego, F.L. Urban Form, Land Use, and Cover Change and Their Impact on Carbon Emissions in the Monterrey Metropolitan Area, Mexico. Urban Clim. 2021, 39, 100947. [Google Scholar]
  27. Beroho, M.; Briak, H.; Cherif, E.K. Future Scenarios of Land Use/Land Cover (LULC) Based on a CA-Markov Simulation Model: Case of a Mediterranean Watershed in Morocco. Remote Sens. 2023, 15, 1162. [Google Scholar] [CrossRef]
  28. Chen, L.T.; Cai, H.S.; Zhang, T.; Zhang, X.L.; Zeng, H. Land Use Multi-scenario Simulation Analysis of Rao River Basin Based on Markov-FLUS Model. Acta Ecol. Sin. 2022, 42, 3947–3958. [Google Scholar]
  29. Zhang, K.Q.; Chen, J.J.; Hou, J.K.; Zhou, G.Q.; You, H.T.; Han, X.W. Study on Sustainable Development of Carbon Storage in Guilin Coupled with InVEST and GeoSOS-FLUS Model. China Environ. Sci. 2022, 42, 2799–2809. [Google Scholar]
  30. Liang, X.; Guan, Q.F.; Clarke, K.C.; Liu, S.; Wang, B.; Yao, Y. Understanding the Drivers of Sustainable Land Expansion Using a Patch-generating Land Use Simulation(PLUS)Model: A Case Study in Wuhan, China. Comput. Environ. Urban Syst. 2021, 85, 101569. [Google Scholar] [CrossRef]
  31. Sun, F.H.; Fang, F.M.; Hong, W.L.; Luo, H.; Yu, J.; Fang, L.; Miao, Y.Q. Evolution Analysis and Prediction of Carbon Storage in Anhui Province Based on PLUS and InVEST Model. J. Soil Water Conserv. 2023, 37, 151–158. [Google Scholar]
  32. Wang, Z.Y.; Huang, C.L.; Li, L.; Lin, Q. Ecological Zoning Planning and Dynamic Evaluation Coupled with Invest-HIFI-PLUS Model: A Case Study in Bortala Mongolian Autonomous Prefecture. Acta Ecol. Sin. 2022, 42, 5789–5798. [Google Scholar]
  33. Qin, Z.W. Development Planning and Implementation of Wuhan Urban Agglomeration. China Investig. 2022, CA, 70–72. [Google Scholar]
  34. Chen, H.L.; Peng, K.L.; Huang, K. Correlation and Regional Differences of Land Use Structure and Socio-economic Structure in Wuhan Metropolitan Area. China Land Sci. 2014, 28, 66–73. [Google Scholar]
  35. Lu, F.; Chen, J. Location Superiority and Accessibility Analysis on Wuhan Metropolitan Region. Prog. Geogr. 2008, 27, 68–74. [Google Scholar]
  36. Li, X.J.; Zheng, D.G.; Sun, J.; Ma, X.; Sun, X.M.; Zhang, Y.F. Exploring Regional Coordination in the Comprehensive Planning of Megalopolis: Lessons from Wuhan Metropolitan Area. City Plan. Rev. 2018, 202, 12–18. [Google Scholar]
  37. National Bureau of Statistics. Statistical Bulletin on National Economic and Social Development of Hubei Province in 2020. Hubei Daily, 18 March 2021; p. 4. [Google Scholar]
  38. Zhang, J.; Zhu, W.B.; Wu, S.Y.; Li, S.C. Simulation of Temporal and Special Land Use Changes in Jing-Jin-Ji Urban Agglomeration Using CLUE-S Model. Acta Sci. Nat. Univ. Pekin. 2018, 54, 115–124. [Google Scholar]
  39. He, H.S.; Zhao, Y.H.; Wu, J.S. Simulation of Urban Landscape Pattern Under the Influence of Low Carbon: A Case Study of Shenzhen. Acta Ecol. Sin. 2021, 41, 8352–8363. [Google Scholar]
  40. Zhang, K.; Huang, C.H.; Wang, Z.Y.; Wu, J.Y.; Zeng, Z.Q.; Mu, J.J.; Yang, W.Y. Optimization of “Production-Living-Ecological” Spaces Based on DTTD-MCR-PLUS Model: Taking Changsha City as An Example. Acta Ecol. Sin. 2022, 42, 9957–9970. [Google Scholar]
  41. Wang, Z.Y.; Hu, G.C.; Zhang, Y.; Liu, H.L. Characteristics of Carbon Emission Pattern in Hubei Territorial Space and Its Improvement Measures. Planners 2022, 38, 24–31. [Google Scholar]
  42. Fang, J.Y.; Guo, Z.D.; Piao, S.L.; Chen, A.P. Estimation of Land Vegetation Carbon Sink in China from 1981 to 2000. Sci. China Earth Sci. 2007, 37, 804–812, 842. [Google Scholar]
  43. Yu, K.K.; Wang, Y.H.; Sun, T.; Tian, J.M. Changes and Prediction of Carbon Emission from Different Land Use Types in Taihu Lake Basin. Soils 2022, 54, 406–414. [Google Scholar]
  44. Li, Y.Y.; Wei, W.; Zhou, J.J.; Hao, R.J.; Chen, D.B. Changes in Land Use Carbon Emissions and Coordinated Zoning in China. Environ. Sci. 2022, accepted. [Google Scholar]
  45. Li, W.X. Research on Carbon Emission in Zheng-Bian Integration Area Based on LUCC. Master’s Thesis, Xinjiang Normal University, Urumqi, China, 2019. [Google Scholar]
  46. Lai, L. Carbon Emission Effect of Land Use in China. Ph.D. Thesis, Nanjing University, Nanjing China, 2010. [Google Scholar]
  47. Duan, X.N.; Wang, X.K.; Lu, F.; Ouyang, Z.Y. Carbon Sequestration and its Potential by Wetland Ecosystems in China. Acta Ecol. Sin. 2008, 28, 463–469. [Google Scholar]
  48. Xu, G.Q.; Liu, Z.Y.; Jiang, Z.H. Decomposition Model and Empirical Study of Carbon Emissions for China, 1995–2004. China Popul. Resour. Environ. 2006, 16, 158–161. [Google Scholar]
  49. Su, Y.X.; Chen, X.Z.; Ye, Y.Y.; Wu, Q.T.; Zhang, H.O.; Huang, N.S.; Kuang, Y.Q. The Characteristics and Mechanisms of Carbon Emissions from Energy Consumption in China Using DMSP/OLS Night Light Imageries. Acta Geogr. Sin. 2013, 68, 1513–1526. [Google Scholar]
  50. Fang, J.Y.; Yu, G.R.; Liu, L.L.; Hu, S.J.; Chapin, F.S. Climate Change, Human Impacts, and Carbon Sequestration in China. Proc. Natl. Acad. Sci. USA 2018, 115, 4015–4020. [Google Scholar] [CrossRef] [Green Version]
  51. Li, K.; Jiang, M.D.; Wang, Q. Re-measurement of Regional Complete Carbon Emission Intensity: Based on the Correlations of Carbon Emission and Economics. Acta Sci. Nat. Univ. Pekin. 2022, 58, 308–316. [Google Scholar]
  52. Yuan, Y.; Sun, X.T. Spatial-temporal Evolution and Driving Factors of Inter-provincial Carbon Emission Intensity in China. Environ. Sci. Technol. 2022, 45, 168–176. [Google Scholar]
  53. Wang, S.J.; Huang, Y.Y. Spatial Spillover Effect and Driving Forces of Carbon Emission Intensity at City Level in China. Acta Geogr Sin. 2019, 74, 1131–1148. [Google Scholar] [CrossRef] [Green Version]
  54. Fu, Y.J.; Tian, D.; Hou, Z.Y.; Wang, M.G.; Zhang, N.L. Review on the Evaluation of Global Forest Carbon Sink Function. J. Beijing For. Univ. 2022, 44, 1–10. [Google Scholar]
  55. Lv, S.H.; Zhang, X.P. Analysis of Spatiotemporal Evolution Characteristics of Agricultural Net Carbon Sink in Shandong Province. J. Soil Water Conserv. 2019, 33, 227–234. [Google Scholar]
  56. Jiao, S.L.; Luo, F.J.; Liang, H. Carbon Sink Effect of Chemical Erosion in Yangchang Watershed of Wujiang Source Area. J. Soil Water Conserv. 2012, 5, 44–47, 54. [Google Scholar]
  57. Wang, G.; Zhang, H.B.; Xue, F.; Zhen, Y. Relations between Land Use Carbon Budget and Economic Development at County Level in Chengdu City. J. Nat. Resour. 2017, 32, 1170–1182. [Google Scholar]
  58. Liu, H.J.; Tian, Z.; Shi, Y. Spatial Difference of Carbon Dioxide Emissions and its Bi-dimensional Internal Structural Decomposition and Analysis from 2000 to 2019 in China. Geogr. Res. 2023, 42, 857–877. [Google Scholar]
  59. Yang, J.Y.; Zhang, M.; Duo, L.H.; Xiao, S.; Zhao, Y.Q. Spatial Pattern of Land Use Carbon Emissions and Carbon Balance Zoning in Jiangxi Province. Res. Environ. Sci. 2022, 35, 2312–2321. [Google Scholar]
  60. Xu, Y.; Guo, N.; Ru, K.L.; Fan, S.L. Characteristics and Optimization Strategies of Land Spatial Zoning in Fujian Province from the Perspective of Carbon Neutrality. J. Appl. Ecol. 2022, 33, 500–508. [Google Scholar]
  61. Wei, Y.R.; Chen, S.L. Spatial Correlation and Carbon Balance Zoning of Land Use Carbon Emissions in Fujian Province. Acta Ecol. Sin. 2021, 41, 5814–5824. [Google Scholar]
  62. Sun, X.X.; Xue, J.H.; Dong, L.N. Spatiotemporal Change and Prediction of Carbon Storage in Nanjing Ecosystem Based on PLUS Model and InVEST Model. J. Ecol. Rural Environ. 2023, 39, 41–51. [Google Scholar]
  63. Ji, Y.F.; Jia, L.J.; Yang, L.A.; Li, Y.L.; Dong, Q.H. Spatio-temporal Evolution and Prediction Analysis of Habitat Quality in Yulin City Coupled with InVEST-PLUS Model. J. Soil Water Conserv. 2023, 37, 123–132. [Google Scholar]
  64. Li, X.; Liu, Z.S.; Li, S.J.; Li, Y.X. Multi-Scenario Simulation Analysis of Land Use Impacts on Habitat Quality in Tianjin Based on the PLUS Model Coupled with the InVEST Model. Sustainability 2022, 14, 6923. [Google Scholar] [CrossRef]
  65. Liang, B.Z. Study on Spatio-Temporal Correlation of Land Use Change and Economic Growth of Wuhan Metropolitan Area. Ph.D. Thesis, China University of Geosciences, Wuhan, China, 2017. [Google Scholar]
  66. Liu, Z.; Cui, D.; Deng, C.; Wang, Y.L.; Zhong, H.W.; Le, X.; Zhang, N.; Chen, B.; Ren, X.B.; Wei, W.; et al. Impact on China’s CO2 Emissions from COVID-19 Pandemic. Scientia 2021, 66, 1912–1922. [Google Scholar]
  67. Fu, Z.Y.; Li, Y.W. Scenario Analysis on Carbon Emissions of Hubei Province in 14th Five-Year Plan Under Epidemic Situation. Environ. Sci. Technol. 2022, 45, 221–227. [Google Scholar]
  68. Chen, N. Research on the Regional Differences and Reduction Scheme of Land Use Carbon Emissions in Wuhan Urban Agglomeration. Master’s Thesis, Huazhong Agricultural University, Wuhan, China, 2018. [Google Scholar]
  69. Zhang, J.F.; Zhang, A.L.; Dong, J. Carbon Emission Effect of Land Use and Influencing Factors Decomposition of Carbon Emission in Wuhan urban Agglomeration. Resour. Environ. Yangtze Basin 2014, 5, 595–602. [Google Scholar]
  70. Wang, H.J.; Zeng, F.L. Simulation of Urban Construction Land Expansion Based on CA-MARKOV. Jiangsu Sci. Technol. Inform. 2021, 38, 46–48, 52. [Google Scholar]
  71. Zhang, Z.Z.; Liang, S.Y.; Xiong, Y.Q. Ecosystem Service Tradeoffs in Wuhan Metropolitan Area under Multi-Scenario Land Use Change. J. Agric. Resour. Environ. 2023, 40, 345–357. [Google Scholar]
  72. Huang, G.P.; Suo, F. Simulation Study on Land Use Scenarios in Wuchang District, Wuhan City Based on CLUE-S Model. Technol. Innov. Appl. 2019, 23, 71–72. [Google Scholar]
  73. Wang, J.N.; Wang, W.C.; Hai, M.M. Simulation Analysis of Land Use Change in Shandong Province Based on PLUS Model. Terr. Nat. Resour. Study 2022, 6, 1–8. [Google Scholar]
  74. Wang, Z.Y.; Meng, L.; Li, Q.; Xu, F.; Lin, J. Multi-Scenario Simulation of Land Use and Ecosystem Services in Beijing under the Background of Low-Carbon Development. Acta Ecol. Sin. 2023, 4, 3571–3581. [Google Scholar]
  75. Wang, R.Y.; Zhao, J.S.; Chen, G.P.; Lin, Y.L.; Yang, A.R.; Cheng, J.Q. Coupling PLUS–InVEST Model for Ecosystem Service Research in Yunnan Province, China. Sustainability 2022, 15, 271. [Google Scholar] [CrossRef]
  76. Lu, N. The Research on Carbon Emission Effects of Land Use Change. Ph.D. Thesis, Nanjing Agricultural University, Nanjing, China, 2011. [Google Scholar]
  77. Meng, X.M. Regional Differences and Temporal and Spatial Pattern Evolution of Energy Efficiency in Three Urban Agglomerations—Analysis Based on the Perspective of Sustainable Development. Master’s Thesis, Dongbei University of Finance and Economics, Dalian, China, 2021. [Google Scholar]
  78. Lu, R.C.; Huang, X.J.; Zuo, T.H.; Xiao, S.S.; Zhao, X.F.; Zhang, X.Y. Land Use Scenarios Simulation Based on CLUE-S and Markov Composite Model—A Case Study of Taihu Lake Rim in Jiangsu Province. Sci. Geogr. Sin. 2009, 4, 577–581. [Google Scholar]
Figure 1. Research area of Wuhan Urban Agglomeration.
Sustainability 15 11021 g001
Figure 2. Land-use carbon emission results from 2000 to 2015.
Sustainability 15 11021 g002
Figure 3. Land-use carbon emission results from 2017 to 2022.
Sustainability 15 11021 g003
Figure 4. Land-use types in the Wuhan Urban Agglomeration in 2020.
Sustainability 15 11021 g004
Figure 5. Land-use-type area of each city in the Wuhan Urban Agglomeration in 2020.
Sustainability 15 11021 g005
Figure 6. Carbon emissions from land use in the Wuhan Urban Agglomeration in 2020.
Sustainability 15 11021 g006
Figure 7. Zoning of land-use carbon emissions in the Wuhan Urban Agglomeration in 2020.
Sustainability 15 11021 g007
Figure 8. Prediction of land-use spaces under multi-scenario simulations of the Wuhan Urban Agglomeration in 2035.
Sustainability 15 11021 g008
Table 1. Factors for simulation prediction of land-use change.
CategoryFactorExplanation
TerrainDEMGround elevation information
SlopeSteepness of the ground
MeteorologyAnnual average temperatureRegional temperature information
Total annual precipitationRegional precipitation information
SoilSand contentSoil texture information
Silt content
Clay content
LocationShortest distance from roadThe shortest Euclidean distance from the geometric center of the pixel to the nearest road
Shortest distance from the railwayThe shortest Euclidean distance from the geometric center of the cell to the nearest railway
Shortest distance from the railwayThe shortest Euclidean distance from the geometric center of the pixel to the nearest water system
EconomyGDPSocioeconomic information
Grain ResourcesNPPGrain resource information
Table 2. Data information and sources.
DataUnitTime ResolutionSpatial ResolutionSource
Land-cover data-Year1 kmhttps://www.resdc.cn/, accessed on 10 October 2022
Sentinel-2-15 days10 mhttps://code.earthengine.google.com/, accessed on 21 October 2022
DEMm-30 mhttps://www.gscloud.cn/, accessed on 21 December 2022
Annual average temperature°CYear1 kmhttps://www.resdc.cn/, accessed on 28 December 2022
Total annual precipitationmmYear1 kmhttps://www.resdc.cn/, accessed on 10 January 2023
Soil texture--1 kmhttps://www.resdc.cn/, accessed on 23 January 2023
Road network and water system-Year-https://www.webmap.cn/, accessed on 25 January 2023
NPP/VIIRS-Year500 mhttps://www.ngdc.noaa.gov, accessed on 27 January 2023
NPPg/m2Year1 kmhttps://www.resdc.cn/, accessed on 30 January 2023
Economic energy data-Year-http://tjj.hubei.gov.cn/, accessed on 5 February 2023
Table 3. Carbon emissions from land use in cities in the Wuhan Urban Agglomeration in 2020.
CityCarbon Source (10,000 Tons)Carbon Sink (10,000 Tons)Carbon
Emission (10,000 Tons)
Carbon Source
Intensity (Tons/CNY 100 Million)
Carbon Sink Intensity (Tons/Square Kilometer)ECCESC
Wuhan2034.1719.082015.101302.6122.262.790.55
Huangshi837.9414.67823.275105.2932.000.711.03
Ezhou373.193.49369.703712.5021.870.980.55
Xiaogan1462.0520.501441.556665.2123.030.540.83
Xiantao374.202.65371.564519.8610.430.800.42
Xianning1001.5840.02961.566569.1441.040.552.36
Tianmen482.321.42480.907810.945.410.460.17
Qianjiang340.791.37339.424453.446.820.810.24
Huanggang2661.2959.032602.2612,266.5733.810.301.31
Wuhan Urban Agglomeration9567.53162.229405.313629.4327.961.001.00
Table 4. Carbon emission zoning in the Wuhan Urban Agglomeration.
ZoneDivision ConditionsCity
Low-carbon development zoneECC > 1, ESC > 1/
High-carbon optimization zoneECC > 1, ESC < 1Wuhan
Ecological protection zoneECC < 1, ESC > 1Xianning, Huangshi, Huanggang
Comprehensive optimization zoneECC < 1, ESC < 1Ezhou, Xiaogan, Xiantao, Tianmen, Qianjiang
Table 5. Prediction of land-use quantity under a multi-scenario simulation of the Wuhan Urban Agglomeration in 2035.
Area
(Square Kilometers)
Natural
Development
Low-Carbon
Development
Economic
Development
Cropland
Protection
Unused land2699.832537.372613.762535.16
Grassland1070.201155.301183.451178.97
Cropland8952.758493.959654.1415,260.73
Built-up land8113.617248.819731.448203.85
Forestland28,708.4330,208.2726,347.8222,847.20
Water8480.958382.078495.157999.86
Total area58,025.7658,025.7658,025.7658,025.76
Table 6. Carbon emissions from different land-use types simulated under multi-scenario simulations of the Wuhan Urban Agglomeration in 2035.
Carbon Emission (10,000 Tons)Natural
Development
Low-Carbon
Development
Economic
Development
Cropland
Protection
Unused land−0.13−0.13−0.13−0.13
Grassland−0.22−0.24−0.25−0.25
Cropland44.5042.2147.9875.85
Built-up land8322.137435.109981.538414.69
Forestland−166.80−175.51−153.08−132.74
Water−21.46−21.21−21.49−20.24
Total area8178.017280.239854.568337.18
Table 7. Carbon emissions from land use in different cities under multi-scenario simulations of the Wuhan Urban Agglomeration in 2035.
CityNatural DevelopmentLow-Carbon Development
Carbon Source (10,000 Tons)Carbon Sink (10,000 Tons)Carbon
Emission (10,000 Tons)
Carbon Source (10,000 Tons)Carbon Sink (10,000 Tons)Carbon
Emission (10,000 Tons)
Wuhan1587.7223.401564.321444.2524.701419.54
Huangshi617.0015.25601.75580.3415.51564.83
Ezhou277.814.27273.54245.504.50240.99
Xiaogan1338.9327.971310.961094.8930.491064.40
Xiantao516.723.30513.42460.713.83456.88
Xianning893.7338.89854.84889.2038.97850.23
Tianmen1131.602.821128.791018.503.721014.78
Qianjiang538.551.94536.62505.502.29503.21
Huanggang1464.5570.781393.771242.8473.001169.84
Wuhan Urban Agglomeration8366.62188.618178.017477.32197.097284.70
CityEconomic DevelopmentCropland Protection
Carbon Source (10,000 Tons)Carbon Sink (10,000 Tons)Carbon
Emission (10,000 Tons)
Carbon Source (10,000 Tons)Carbon Sink (10,000 Tons)Carbon
Emission (10,000 Tons)
Wuhan1901.8520.911880.941922.2916.881905.41
Huangshi721.6614.55707.10780.2113.52766.69
Ezhou349.473.77345.69354.743.05351.69
Xiaogan1811.7223.531788.191223.2517.541205.71
Xiantao584.192.68581.51345.672.13343.53
Xianning900.5538.80861.75879.6838.64841.04
Tianmen1247.821.761246.06398.251.02397.23
Qianjiang575.631.56574.07276.541.17275.37
Huanggang1940.8367.321873.502309.6859.352250.34
Wuhan Urban Agglomeration10,029.52174.959858.838490.54153.368337.01
Disclaimer/Publisher’s Note: The statements, opinions and data contained in all publications are solely those of the individual author(s) and contributor(s) and not of MDPI and/or the editor(s). MDPI and/or the editor(s) disclaim responsibility for any injury to people or property resulting from any ideas, methods, instructions or products referred to in the content.

