Article

Production of CO2 Hydrates in Aqueous Mixtures Having (NH4)2SO4 at Different Concentrations; Definition of Consequences on the Process Evolution, Quantification of CO2 Captured and Validation of Hydrates Production as Technique for Ammonium Removal from Waste Water

by
Alberto Maria Gambelli
1,*,
Xhino Rushani
2,
Daniela Pezzolla
1,
Federico Rossi
2 and
Giovanni Gigliotti
1
1
Department of Civil and Environmental Engineering, University of Perugia, Via G. Duranti 93, 06125 Perugia, Italy
2
Engineering Department, University of Perugia, Via G. Duranti 93, 06125 Perugia, Italy
*
Author to whom correspondence should be addressed.
Sustainability 2023, 15(12), 9841; https://doi.org/10.3390/su15129841
Submission received: 16 May 2023 / Revised: 6 June 2023 / Accepted: 19 June 2023 / Published: 20 June 2023

Abstract

:
Carbon dioxide hydrates were formed in fresh water and in aqueous mixtures containing ammonium sulfate, at concentrations equal to 1.9, 6.3, and 9.5 wt%. The moles of hydrates formed were compared, to define the inhibiting strength of the electrolyte solution and the dependence of inhibition from concentration. The addition of salt strongly inhibited the process and the number of hydrates produced passed from 0.204–0.256 moles, obtained in fresh water, to 0.108–0.198 moles, obtained at the lowest concentration tested. The further addition of salt still lowered the production of the hydrates; at the highest concentration tested, only 0.092–0.177 moles were obtained. The pressure-temperature evolutions of the hydrates were then discussed and compared with the ideal process and with the experimental results obtained in demineralised water. Finally, further samples of CO2 hydrates, produced in the presence of 9.5 wt% salt in the aqueous phase (corresponding to 1.5 wt% NH4+), were recovered and dissociated in a separated environment. The liquid phase, resulting from their dissociation, was subjected to spectrophotometric analyses. Its NH4+ content was measured and compared with the initial concentration in water. Therefore, it was possible to quantify the capability of the system to remove the (NH4)2SO4 from the water (involved in hydrate formation) and to concentrate it in the remaining liquid phase. Considering the portion of water involved in hydrates formation, the concentration of ammonium passed from 1.5 wt% to 0.38–0.449 wt%.

1. Introduction

Clathrate hydrates are ice-like crystalline compounds composed of hydrogen-bonded water molecules, which arrange themselves to form an ordered solid lattice [1]. The formation of hydrates is possible in the presence of specific gaseous molecules, whose presence allows the formation of crystalline structures. The molecules of gases are trapped within the cavities formed in the lattice and ensure the stability of the whole structure [2]. For that reason, gases are referred to as “guests”, while water is a “host” [3]. Depending on the type and properties of the guest and on the local thermodynamic conditions, different hydrate structures can be obtained; however, only three of them were found to exist in nature: the cubic structural I (sI), the cubic structural II (sII) and the hexagonal structural H (sH) [4,5]. All these structures take place from five elementary crystalline cavities, distinguished by a specific number. The number is “ n i m i ”, where the base represents the number of edges in the face “i”, while the exponent indicates the number of faces having no edges. Based on this nomenclature, the cages can be referred to as 512, 51262, 51264, 435663 and 51268. The most widespread structure in nature is the cubic sI, since it forms in the presence of guests as methane and carbon dioxide. The presence of hydrocarbons as ethane, propane and butane, leads to the formation of sII [6]. Thus, if natural gas sources contain relevant quantities of these gases, such a structure could be easily encountered. The less diffused structure is the hexagonal sH. For that reason, its existence was definitively confirmed only in 1987 [7]. To form, this structure needs at least two different guests: one having a relatively small size, such as methane or hydrogen sulfate, and one other having a relatively large size, such as 2,2-dimethylbutane [3].
The interest in gas hydrates is mainly due to the enormous quantities of natural gas diffused worldwide under the form of clathrate [8,9]. The quantity of methane, contained in naturally occurring hydrate reservoirs, was estimated to range from 1015 to 1017 m3; therefore, hydrate reservoirs can theoretically provide more than twice the energy which can still be produced with all the conventional energy sources available for humans [10,11]. These natural reservoirs are mainly distributed in deep oceans and in continental margins, where approximately 97% of the known deposits were discovered; the remaining 3% were found in permafrost regions [12].
Nevertheless, the quantities of natural gas hydrates, as soon mentioned, cannot be considered a renewable energy source, since their formation would be slower than their (potential) consumption. However, if appropriately exploited, this source can be made carbon neutral via the so-called replacement strategies. During extraction, the molecules of methane can be replaced with a theoretically equal number of molecules of carbon dioxide. The exchange process was proposed for the first time in 1980, with the triple scope of improving the recovery efficiency for methane, reducing the dissociation of hydrate structures, thus avoiding the local deformation of soils and balancing the emissions associated with the combustion of the extracted methane [13]. Hydrate structures form in the presence of hydrophobic guest species; in this sense, carbon dioxide is an exception [3]. Mainly due to its larger size, the capture of CO2 molecules is easier than those of methane. It can also be explained in terms of the enthalpy of formation, which is equal to −57.98 kJ/mol for methane hydrates and −54.49 kJ/mol for carbon dioxide hydrates. As a consequence of it, once CO2 is injected in proximity to natural gas hydrates, the exchange process occurs spontaneously [14]. Unfortunately, the kinetics of the exchange process is altogether low and several mechanical and physical hindrances occur during the field tests [15,16,17,18].
Since the replacement techniques are far from being competitive and suitable for industrial-scale applications, several researchers opted to keep, the recovery of methane and the storage of carbon dioxide, separated [19,20].
The final disposal of CO2 in deep oceans was proposed for the first time in 1997 [21]. Clathrate structures are capable to host large quantities of gas per unit of volume, until reaching concentrations similar to pressurized vessels [22,23]. The storage of carbon dioxide in the form of hydrates, in deep oceans, is a kinetically favoured process [24,25]. Moreover, it would have high safety standards, both for humans and for the environment. It was proved that, in the presence of appropriate conditions, carbon dioxide would remain in the liquid phase and its density allows us to prevent any leak from the injection area. Moreover, due to the solubility of this gas in water, the formation of hydrates is highly favoured [26,27].
The production of clathrate hydrates is also considered a valid option for energy gas storage and transportation. Gaseous methane can be trapped at temperatures above 0 °C and, at the same time, at pressures lower than 50 bar [28]. The energy density achievable under these conditions is comparable with that of liquid methane which, on the contrary, requires −83 °C and at least 50 bar [29,30].
In addition to the production of energy and the storage and transportation of gases, the unique properties of clathrate hydrates can be advantageously applied in several key sectors; among them: gas mixture separation, food concentration, cold storage, removal of contaminants from water and desalination [31,32,33,34].
This latter application was proposed for the first time in 1940, even though twenty years passed before it started being seriously considered [35,36]. Similar to ice, the crystalline structure of hydrate cannot include ions dissolved in water [37]. Therefore, the production of hydrates in contaminated water allows us to concentrate the hydrates in the aqueous phase, while fresh water can be obtained from the dissociation of hydrates [38].
The presence of salts reduces the activity of water [39,40], or its capability for hydrogen bonding with the surrounding molecules of water, due to the competition between the hydrogen bond forces and the Coulombic forces between the salts and water molecules [41,42].
As a consequence of it, only the formation of hydrates is inhibited in the presence of salts, while the dissociation phase remains unvaried [43]. The inhibiting effect changes as a function of the typology of ions dissolved in water [44] and, in particular, with their size and charge. Smaller ionic sizes and higher charge numbers enhance the process inhibition [45,46]. Conversely, ions having the opposite properties show minor effects on the process and greater quantities of hydrates are produced in their presence. It means that their removal from water is favoured since the removal efficiency is proportional to the quantity of water involved in the formation of hydrates.
Ions with relatively large sizes show lower diffusion in water and a consequent lower action on the process [47]; therefore, their removal is easier [48]. On average, cations have a larger size than anions; however, anions have a stronger interaction with the water molecules in the electrolyte solution. Finally, it was proved that the removal efficiency is similar for anions and cations [47].
The removal of salts from seawater remains the most accredited application of the hydrate-based desalination techniques. However, this method might be advantageously applied in further fields, such as agriculture. The continuous growth in the production of agricultural biomass is becoming an environmental hindrance [49]. During anaerobic digestion, the absence of oxygen makes nitrification limited and leads to the excessive concentration of nitrogen, which condensates under the form of ammonia (NH3) or ammonium ion (NH4+). High concentrations of these species affect the methanogen activity and reduce the overall production of biogas [50].
The currently most adopted techniques, to keep the concentration of these compounds under control, are sorption [51], ammonia stripping and struvite concentration [52]. However, the weight of these phases on the overall process is not negligible from an economic point of view. Thus, the definition of a less energy-intensive and potentially equally effective, strategy, is highly recommended and is attracting numerous investments [53]. For that reason, in the last two decades, several innovative methods, to purify water from contaminants, have been proposed [54,55].
This research aims to experimentally deepen the effect of carbon dioxide hydrates formation and dissociation, due to the release of ammonium sulfate in the aqueous phase, at different initial concentrations. Finally, the composition of water, both involved in hydrate formation and remained in the liquid phase, was analysed, in order to characterize the feasibility of exploiting the hydrate formation process to remove NH4+ from water.

2. Materials and Methods

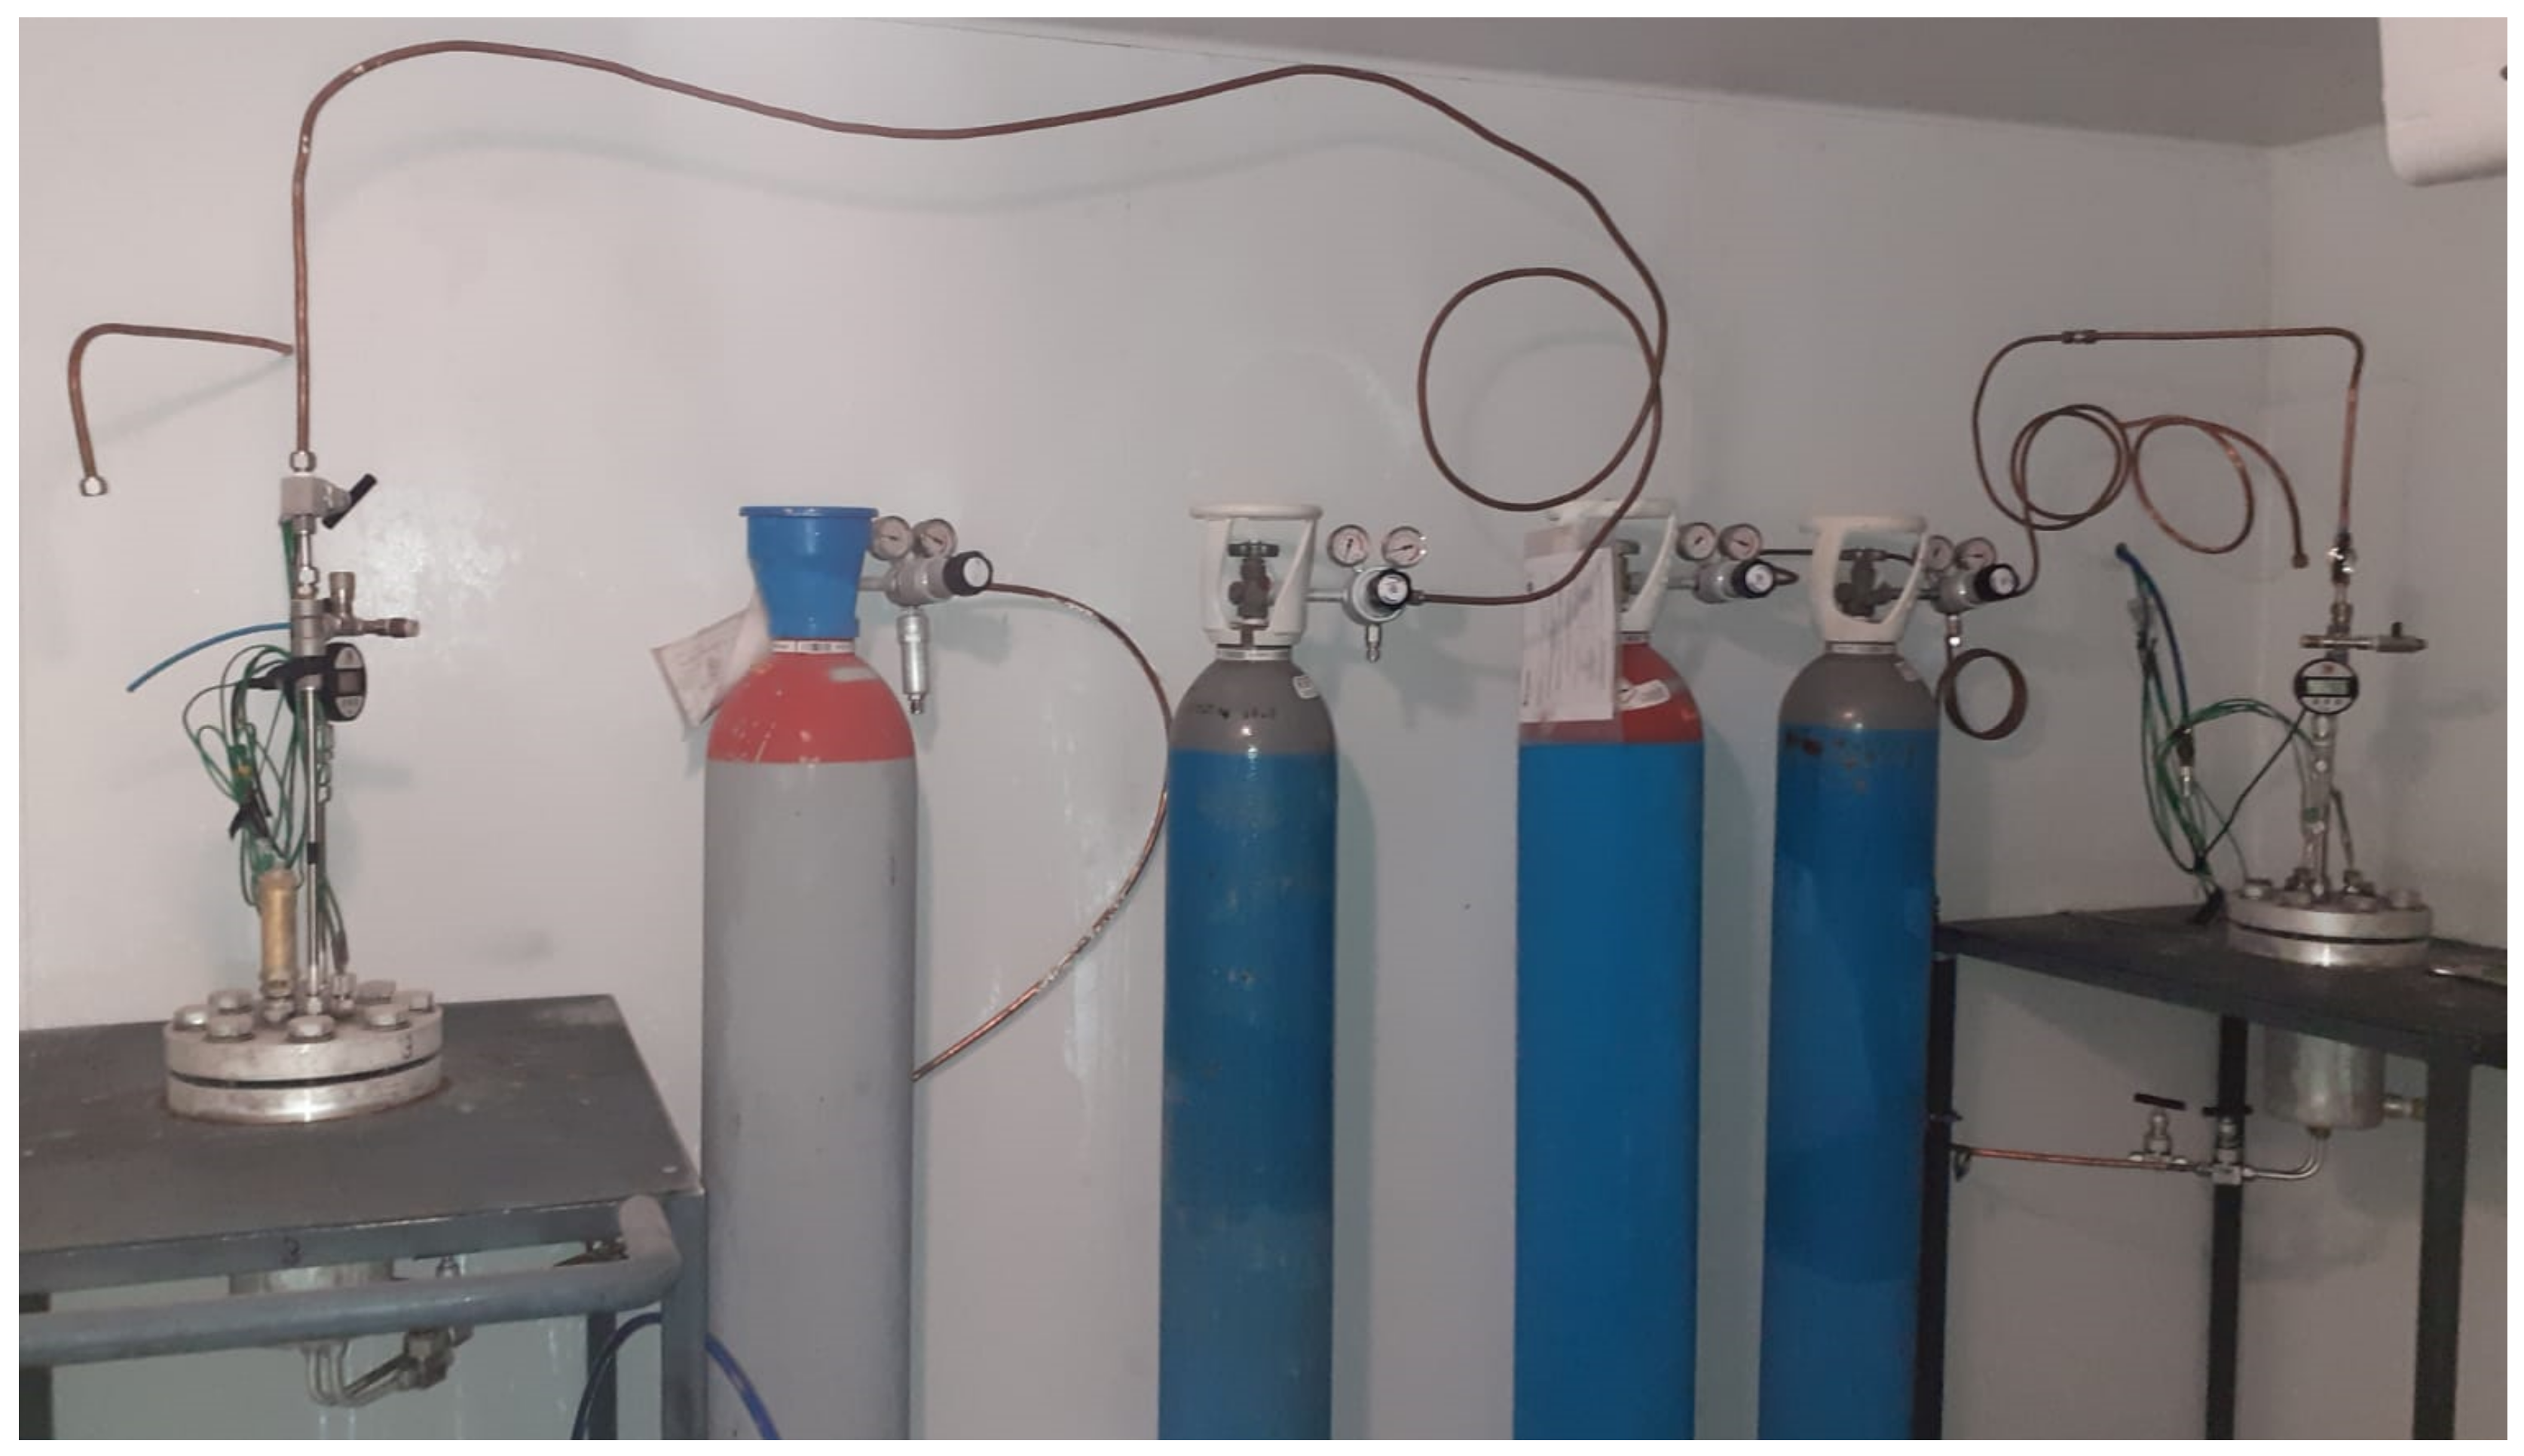
2.1. Experimental Apparatus

Carbon dioxide hydrates were produced in a lab-scale experimental apparatus, composed of two equal unstirred reactors inserted within a cooling room. The reactors are entirely made with 316 stainless steel, in order to avoid corrosion and any possible interaction with the process. The internal volume is 1000 cm3 and the shape is cylindrical. The bottom is sealed with a plate, while the top with a flange, whose tightness is guaranteed by inserting a spiro-metallic gasket (model DN8U PN 10/40 316-FG C8 OR) between the two plates.
Dimensions including the internal and external height and diameters of the two reactors, are provided in Figure 1.
The channels used for gas injection/ejection and for the measured devices are positioned on the flange and at the bottom of the reactors. The perimetral walls are coated with an integrated coil, which can be used for liquid nitrogen circulation when high and fast subcooling is required.
The injection of carbon dioxide was carried out from the top; the related channel is directly connected to a cylinder containing pure CO2, placed within the cooling room (as the reactors) in order for the flowing gas to have the same temperature as the internal volume of the reactors. However, it could be easily performed from the bottom, as preferred. Additionally, the ejection of gases occurs from the top. Figure 2 shows the two reactors and their connection with CO2 cylinders and measured devices.
The internal pressure is measured with a digital manometer, model MAN-SD (by Kobold), with an accuracy equal to ±0.5% of full scale, while six Type K thermocouples, having Class Accuracy 1 (by TC Direct), are used for temperature measurements. The thermocouples were inserted at different depths, for monitoring the whole volume and to detect the occurrence of gradients (since the formation process is exothermic). The experimental procedure followed in this study avoided the formation of gradients. Therefore, the temperature used to describe experiments and produce diagrams, shown in the next section, consists of the mean values of the measurements obtained with all the thermocouples.
The positioning of each sensor is visible in Figure 3, where the depth section for each thermocouple can be also found.
All sensors were connected to a data acquisition system (by National Instrument) controlled in LabView. Since the apparatus has been used for previous studies, more details about it can be found elsewhere in the literature [12].

2.2. Materials

The reactors were filled with 0.744 L of silica sand and 0.236 L of demineralised water/ammonium sulfate mixture ((NH4)2SO4, by J.T. Baker, Phillipsburg, NJ, USA). The sediment consists of spherical glass beads, having diameters between 250 and 400 µm. The porosity of the sediment was measured with a Porosimeter, model Thermo Scientific Pascal 140. It is equal to 35% and considers the porosity of single grains and, mainly, the free space remaining between grains. Such space is of particular importance for the process since hydrates exploit the superficial roughness of grains as a nucleation site and then grow within the porous medium.
Figure 4 confirms this latter assumption as it shows the roughness of the grains (above) and the growth of the CO2 hydrates within the sediment (below).
Finally, ultra-high purity carbon dioxide (purity degree higher than 99.99%) was used for the experiments.

2.3. Experimental Procedure

As explained in the introduction paragraph, this article deals with two different scopes: the thermodynamic characterization of carbon dioxide hydrates formation and dissociation in aqueous solutions, containing different concentrations of ammonium sulfate, and the evaluation of the capability of hydrates to concentrate ions in the liquid phase, with the same aqueous solutions.
Hydrates were first formed in pure demineralised water. Then, the same process was repeated at the following (NH4)2SO4 concentrations:
-
1.9 wt%, corresponding to 0.3 wt% (NH4)2SO4 in the aqueous solution;
-
6.3 wt%, corresponding to 1.0 wt% (NH4)2SO4 in the aqueous solution;
-
9.5 wt%, corresponding to 1.5 wt% (NH4)2SO4 in the aqueous solution.
The porous medium, described in Section 2.2, was used to obtain a more intimate contact, between the gas and water molecules, not only in correspondence with the water-liquid interface, but also along the whole reactor. This arrangement allows us to define the dissociation phase with accuracy and to compare the results achieved with data available in the literature.
Once the internal volume was filled with sand and the selected mixture, the reactors were closed and carbon dioxide was fluxed within. The injection phase was performed at relatively high temperatures (above 15 °C), to prevent the formation of hydrates during the phase. After injection, the reactors were closed and the cooling room was set at 0 °C. The lowering of temperature and the presence of suitable conditions caused the formation of hydrates. The formation process is exothermic and, in small and confined volumes, its occurrence often causes a typical temperature peak. Such a peak is widely visible when the process is carried out at low temperatures. In the present case, the tests started at high temperatures and then the system was gradually lowered. For that reason, the peak, as soon described, is less pronounced. However, it can be easily observed in the diagrams related to hydrates formation in pure demineralized water, where it can be seen as a temporary reversion of the temperature trend, exclusively related to the formation phase. Moreover, the formation phase rarely shows the same trend, even if the process is carried out under the same conditions. The reason can be attributed to several variables, both intrinsic properties of the process, such as memory effect, formation and growth of initial hydrate clusters and nuclei, and also to the environmental parameters, such as the presence of sites feasible for nucleation (their diffusion, physical and geometrical properties), together with concerns related to heat and mass transfer within the formation environment. The stabilization of pressure, at the lowest temperature fixed for the system, signed the end of hydrate formation. The cooling room was then switched off and the increase in temperature brought the dissociation of hydrates. Differently from the previous phase, the dissociation of hydrates is more deterministic and, in the presence of the same process conditions, it always assumes the same trend, since it depends only on heat transfer and not on mass transfer properties. The test finished as soon as the pressure of the system approached its initial value. The thermodynamic conditions have been continuously monitored and, for the production of diagrams, saved every 30 s. The moles of hydrates formed, in correspondence with each salt concentration tested, were calculated by considering the Equation of State for gases, where the compressibility factor was calculated according to the Peng-Robinson Equation, and assuming the molar density of hydrates equal to 0.005986842 mol/m3, as widely reported in the literature [13].
Four tests were carried out for each aqueous mixture, for a total of sixteen experiments (including those carried out in pure demineralised water).
For the second purpose of the study, CO2 hydrates were exclusively formed, according to the procedure previously described. Once the process ended, the reactors were opened and the hydrate phase separated from the liquid one and positioned in a second cooling room, set at −40 °C, to prevent their dissociation at room pressure. Finally, the samples of hydrates were dissociated and the resulting liquid water was used for ammonium ion determination, which was carried out via spectrophotometric analyses (Spectrophotometer model T70, by EsseCi Group).
The determination of NH4+ in the samples was made with Nessler’s reagent. The quantitative determination was possible due to the presence of the iodide and mercury ions contained in the reagent which, in the presence of alkaline conditions, react with the NH4+ and produce a reddish-brown complex of Millon’s base iodide, showing an absorption peak at 490 nm. The absorbance of ammonium ions was used to calculate their concentration in the aqueous mixture, by using the calibration curve provided in Figure 5.

3. Results and Discussion

This experimental section contains two main subheadings. The first describes the formation and dissociation of carbon dioxide hydrates in pure demineralised water and in aqueous mixtures containing different concentrations of ammonium sulfate. The second subheading deals with the colourimetric analyses of water resulting from the dissociation of hydrates and allows us to define the feasibility of using hydrates formation as an option for ions removal from water.

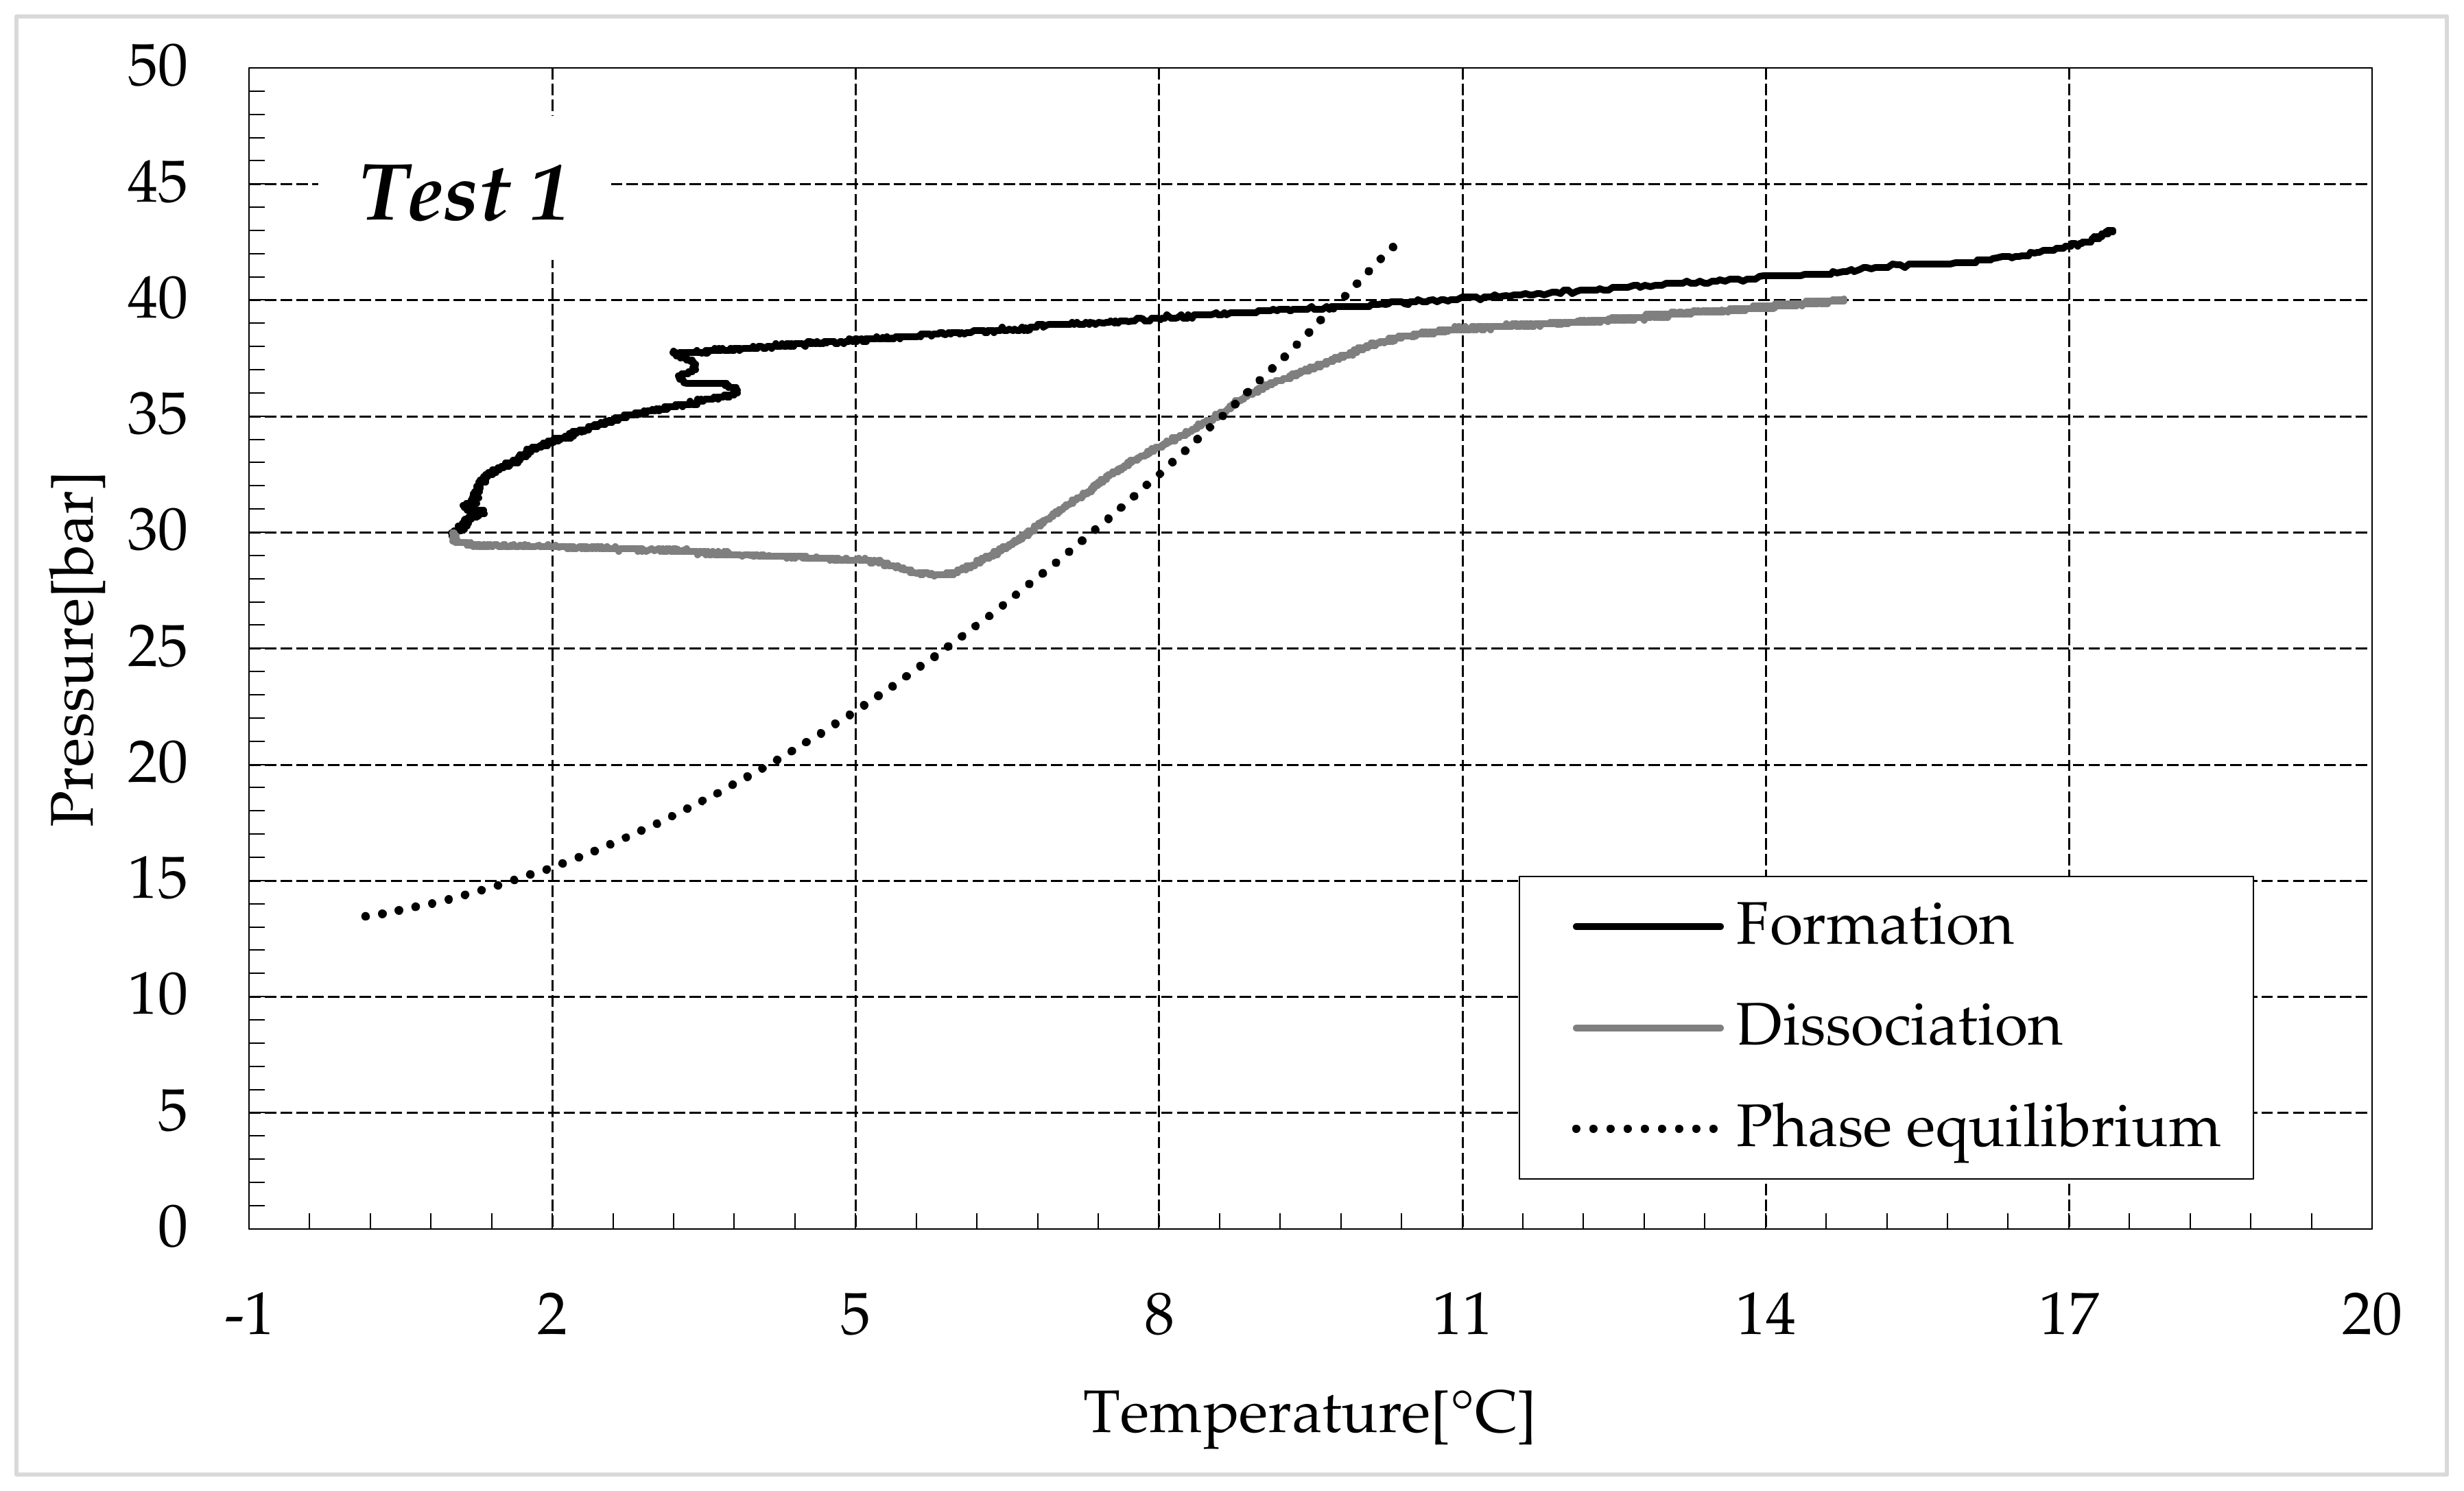
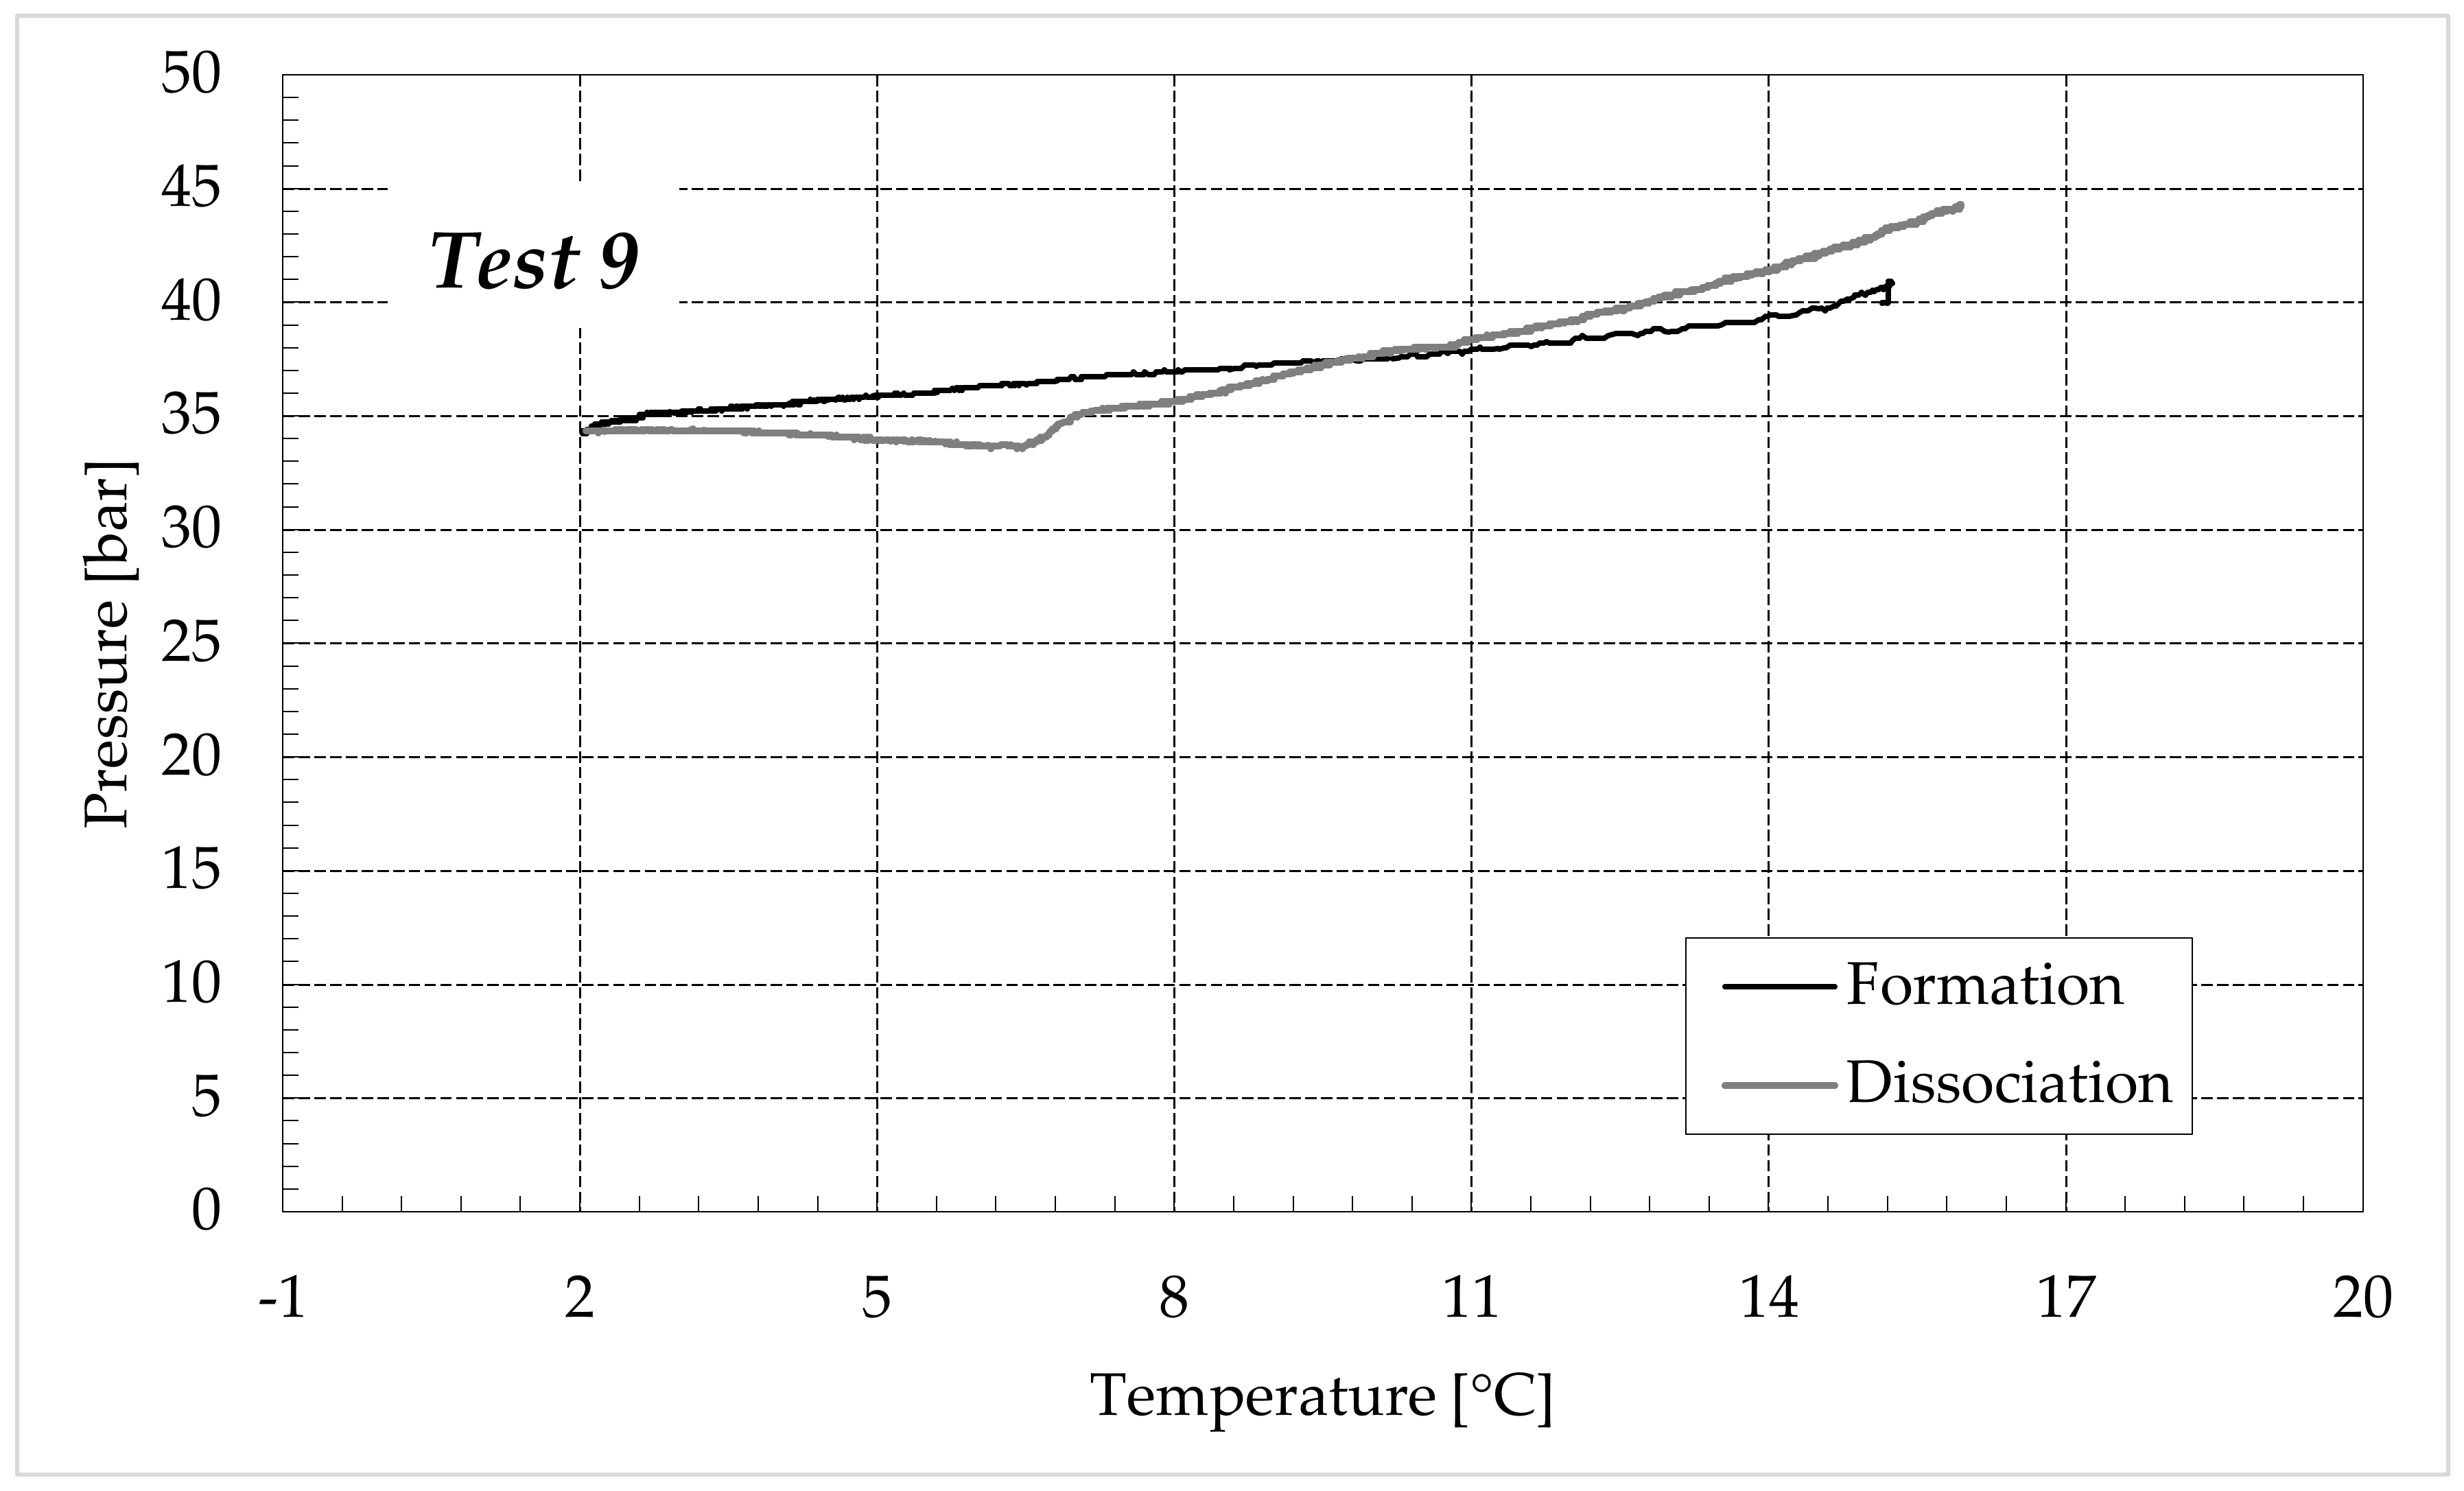
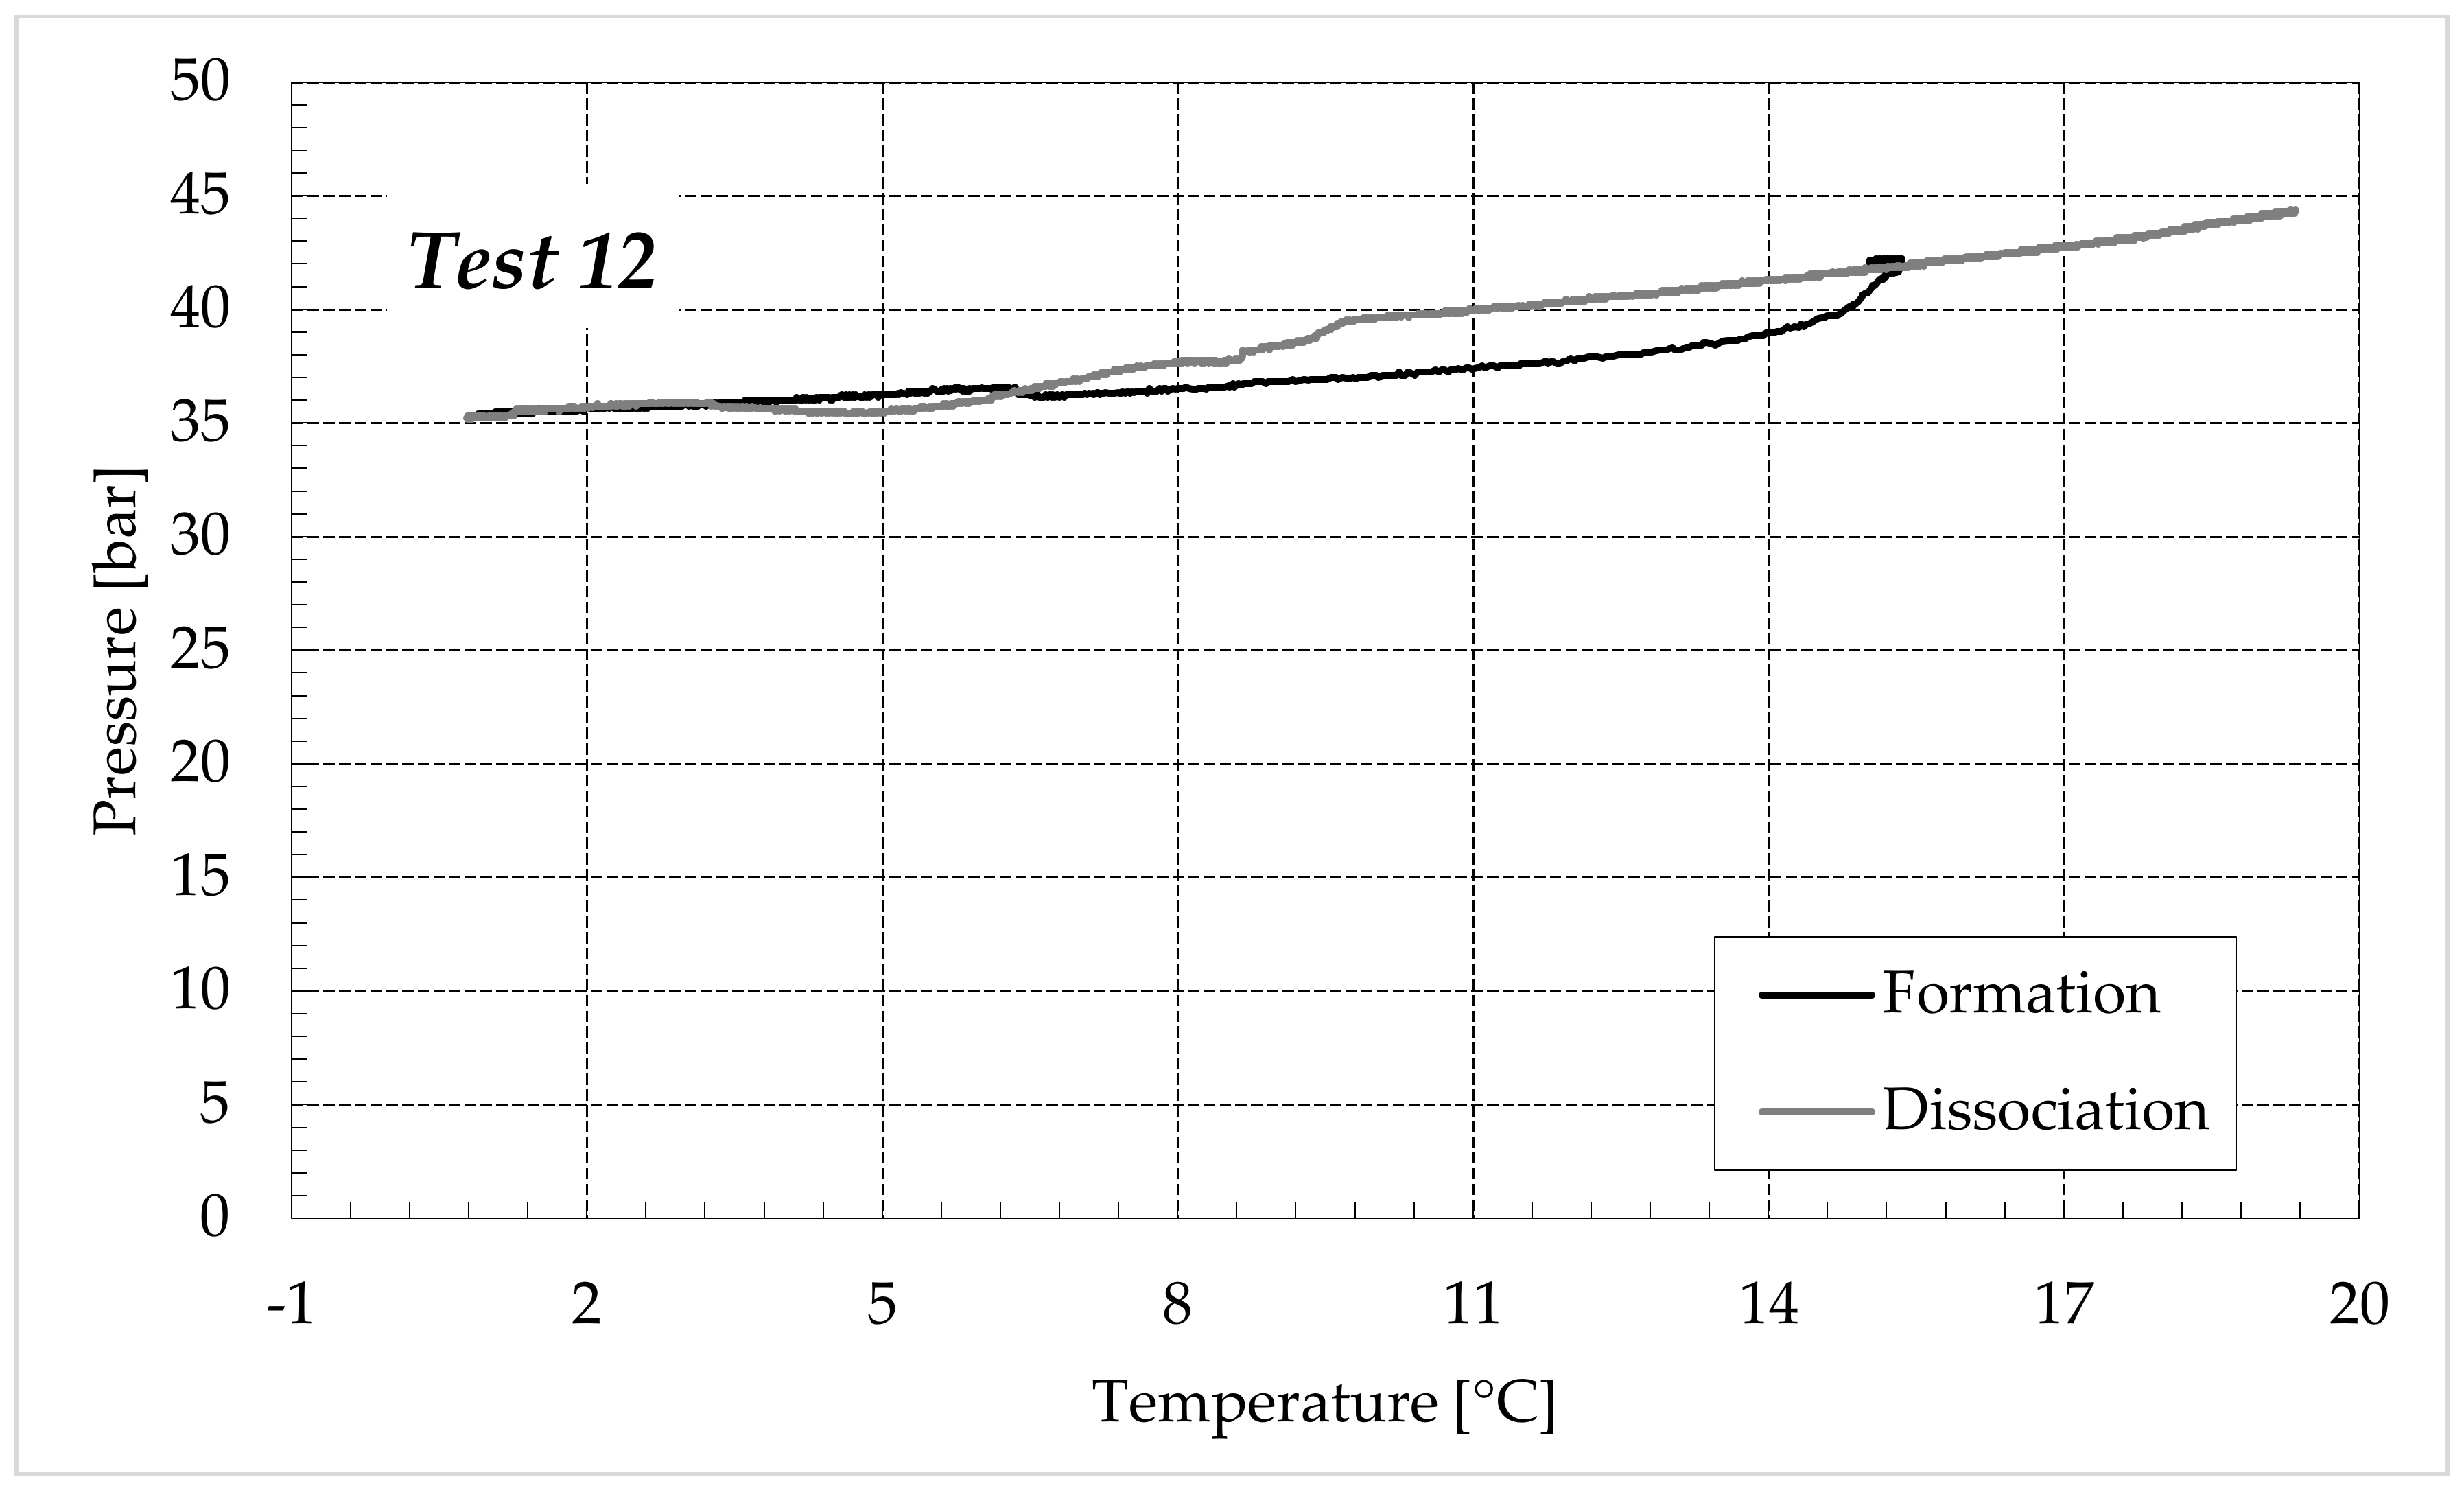
3.1. Formation and Dissociation of CO2 Hydrates in Fresh Water and in Mixtures Containing (NH4)SO4

This paragraph shows and discusses sixteen experiments dealing with carbon dioxide hydrates formation and dissociation. Four of them were carried out in pure demineralised water and the remaining were equally divided for the three concentrations of salts selected. Table 1 resumes the tests described in this section and, for each of them, provides the concentration of (NH4)SO4 in the aqueous phase and the corresponding concentration of NH4+.
Figure 6 provides a diagram showing the range of final pressures reached in each group of tests. Since the initial pressure of the system, or the quantity of gas present within the reactors, was approximately always the same, this diagram allows us to immediately detect and quantify the inhibiting action due to electrolytes diffusion in the aqueous phase.
The addition of ammonium sulfate caused a visible increase in the final pressure, proving that the formation of hydrates was inhibited. The values of pressure used in Figure 6 are provided in Table 2.
The addition of 1.9 wt% (NH4)2SO4 to the system made the final pressure higher than approximately four bar than the values measured in fresh water. A further increase was noticed by varying the concentration of salt from 1.9 wt% to 6.3 wt%. According to it, the maximum values were obtained in the presence of 9.5 wt% (NH4)2SO4, however, the difference between these two latter groups of values is less pronounced, as visible in Figure 6. According to the literature, at the lowest temperatures reached during the experiments, the equilibrium pressure for the carbon dioxide hydrates would range from 12 to 15 bar [57,58]. To quantify the inhibiting action, the results obtained in Tests 5–16 must not be compared with these latter values, but with the results obtained in Tests 1–4, since they describe the formation of pure carbon dioxide hydrates in the absence of additives and also include the whole properties of the system. As will be visible in the following diagrams, the formation of hydrates did not reach the ideal conditions indicated in the literature, even in the absence of electrolytes. The difference between the experimental values and those coming from the literature can be attributed to the size and shape of the reactor, its geometry, the respective quantities of gas, water and sand inserted within reactors and the extension of the gas-liquid interface, among others. Therefore, it would be hazardous to directly compare the values obtained with different apparatuses and conditions, where all of these mentioned properties could vary.
Since the concentrations of ammonium sulfate, selected for the experiments, were close to each other, and due to the possible heterogeneous formation of hydrates within the reactors, the ranges of final pressures obtained in the presence of salts depicted an almost continuous interval in Figure 6, proving a linear dependency between the salt concentrations and the inhibiting effect. Conversely, the data obtained in fresh water did not follow that trend. Therefore, to define the dependency of inhibition from the concentration, in the range of 0–0.3 wt% NH4+, further experiments are necessary.
The process inhibition was quantified by calculating the moles of hydrates obtained in each test. Comparing these values, it was possible to define the lowering in production, expressed as a percentage and indicated in Table 3.
Following the data shown in Table 2, the main difference, in terms of moles of hydrate produced, can be referred to as the presence or the absence of an additive. With fresh water, the number of hydrates formed varied from 0.204 to 0.256 moles, while the addition of 1.9 wt% (NH4)2SO4 to the system dropped this value to 0.108–0.198 moles. With the increasing of additives in the mixture, the moles of hydrate formed lowered, but the overall difference, between the three groups of tests carried out in the presence of salt, was not particularly pronounced. The reduction in hydrates formed can be expressed as a percentage by using the following equation:
% red = hyd 0 wt % hyd xwt % hyd 0 wt % × 100                       %
The equation consists of the difference between the number of hydrates formed in fresh water (hyd0wt%) and the ones formed in the presence of “x” wt% (NH4)2SO4 (hydxwt%), divided by the first quantity mentioned. The following results were reached:
-
Reduction in the presence of 1.9 wt% (NH4)2SO4: from 14.29 to 53.25%;
-
Reduction in the presence of 6.3 wt% (NH4)2SO4: from 20.34 to 56.28%;
-
Reduction in the presence of 9.5 wt% (NH4)2SO4: from 23.38 to 60.17%.
The thermodynamic evolution of the tests further highlighted the role of ammonium sulfate. The following diagrams describe each experiment on a pressure-temperature diagram. Each figure shows one group of tests. Figure 7 describes the process carried out in fresh water, while Figure 8, Figure 9 and Figure 10 refer to the tests made in the electrolyte solutions, in ascending order of (NH4)2SO4 concentration.
In these diagrams, two different types of inhibition are visible. The first occurred during the formation of hydrates and is due to the action of salts. The second appeared during the dissociation of hydrates and mainly depended on the porous medium and its properties. Ions dissolved in water almost exclusively affected the formation phase since they reduce the availability of water molecules to form clathrate structures. Conversely, ions cannot participate in the dissociation phase, which is theoretically only a function of pressure, temperature and the properties of the crystalline lattice. Conversely, the porous medium favours the production of hydrates along the whole internal volume and not exclusively in correspondence with the gas-liquid interface. However, it could also cause changes in the conditions required for hydrate dissociation. Properties of the sediment, such as porosity, thermal conductivity and permeability, often play a relevant role during dissociation and are responsible for systematic variations in the thermodynamic conditions required [63]. That explains why the dissociation curve always appeared above the phase equilibrium. In the case of the exclusive action of electrolytes, these two curves should have appeared completely overlapped.
The initial treatment of hydrate dissociation always showed a temporary independence between pressure and temperature. The increase of this latter parameter, provoked by the external to carry out the dissociation phase, was not accompanied by any increase in pressure. Conversely, a further reduction of it was observed during this phase. This atypical behaviour does not represent a further kind of inhibition, it is a function of the apparatus, with its geometry, the quantities of water, sand and gas present within the reactor and also depends on the applied experimental procedure. According to the diagrams of Figure 7, at the lowest temperatures reached during experiments, the corresponding pressures should have been significantly lower. When the phase equilibrium is reached, a little increase in temperature leads to a consequent dissociation of the water structures and to the following increase in temperature. In these tests, the pressure initially remains constant even when the temperature increase was relevant. It means that, at the conditions fixed for the experiments, the system was not capable to reach the equilibrium. Furthermore, time played a role in this context. The further and slight drop in pressure during the initial temperature increase denoted that the formation phase was not completely ended and, with time, the internal pressure would drop further.
Figure 8 shows the evolution of the tests carried out with the addition of 1.9 wt% (NH4)2SO4 to the aqueous phase, corresponding to 0.3 wt% NH4+.
In these diagrams, the inhibiting effect of ammonium sulfate, previously confirmed with the values expressed in Table 2 and Table 3, clearly shows that the formation curves are strongly “flattened” and are far from the ideal trend. For that reason, the phase equilibrium curve for pure CO2 hydrates was not inserted in these diagrams, since the direct comparison would not have been meaningful.
Similarly to the previous group of experiments, the dissociation phase can be divided into two steps. The first treatment is horizontal, the increase in temperature was not accompanied by any relevant variation in pressure. Conversely, the second step deals with the effective dissociation of hydrates and the P–T diagram approached the theoretical trend until the pressure reached its initial value.
The overall dissociation trend is similar in both groups of tests, however, some differences occurred, especially during the first portion of such a phase. In the presence of pure demineralised water, when the temperature started increasing, the pressure approximately remained constant and exclusively showed a slight further decrease. Conversely, in the presence of 1.9 wt% ammonium sulfate, the opposite trend was noted with the pressure slightly increasing. Such a difference further denotes the inhibiting role of ammonium sulfate in the process. In Tests 1–4, at the end of the formation phase, the system was still far from the phase boundary equilibrium (widely within the hydrate stability zone) and, with time, it would have reached lower pressures. As a consequence of it, during the initial portion of the dissociation phase, the excess of time prevailed on the temperature increase and led to further production of hydrates within the reactors.
In the second group of tests, the configuration achieved at the end of the hydrates formation was closer to the phase boundary equilibrium (in the presence of electrolytes and at the same temperature, the corresponding equilibrium pressure is clearly higher than that related to the formation in fresh water). Therefore, the increase in temperature was the main driving force of this phase and the pressure consequently increased, denoting a slight dissociation of hydrates (with the only exception being Test 5, which showed a P–T evolution similar to those of Tests 1–4 during the whole dissociation phase).
Finally, Figure 9 and Figure 10 respectively describe the tests carried out in aqueous mixtures containing 6.3 and 9.5 wt% (NH4)2SO4, respectively.
As expected, the further addition of ammonium sulfate to the aqueous phase led to a less pronounced formation of hydrates. In all the tests, the formation and dissociation curve results almost completely overlapped, proving that the P–T trend was mainly defined by the equation of state for gases, while the hydrate formation process played a secondary role.
The dissociation curve lost the character traits shown in Tests 1–8. The initial independency of pressure from temperature disappeared, the higher quantity of salts changed the equilibrium conditions for the system and, at the end of the formation phase, the system reached the limits of the stability zone for hydrates, thus, a little increase of temperature caused the partial dissociation of hydrates and the pressure consequently grew. Additionally, the remaining part of the experiments was different. For the reasons previously asserted, the dissociation of hydrates did not follow the theoretical model.
In the absence of salts in the aqueous phase (or in the presence of only a few concentrations of it), the dissociation curve always remained below the formation one. This condition is typical and is widely documented in the literature [3]. The reason can be attributed to the stochastic nature of hydrates formation, which depends on intrinsic properties, mainly related to the nucleation phase and the growth of first labile clusters in the bulk phase, and to macroscopic variables, such as the heterogeneous distribution of guest molecules in the liquid phase, the presence of gradients in temperature and others [63]. Conversely, at relatively high concentrations of ammonium sulfate, especially at 6.3 wt%, the dissociation phase often occurred at more severe thermodynamic conditions (higher pressures and/or lower temperatures) than the associated formation and the order of the two corresponding curves appeared reversed in the diagrams of Figure 9.
The experiments carried out and shown in this study are not thought to describe this phenomenon, which is worthy of investigation and will be deepened in future studies. The next paragraph discusses the possibility of exploiting the hydrate formation process as a preliminary step for ammonium sulfate removal from water.

3.2. Determination of (NH4)SO4 Content in Hydrate Phase, via Spectrophotometric Analyses

In this paragraph, the possibility of exploiting the hydrate formation process as a preliminary and high-efficiency step for ammonium sulfate removal from wastewater was studied and discussed. Six further experiments were carried out, and the carbon dioxide hydrates were formed in the presence of 9.5 wt% of salt, corresponding to the 1.5 wt% ammonium. Once formed, the hydrate phase was removed and dissociated. The obtained liquid phase was destined for spectrophotometric analysis to detect the quantity of ammonium present in it. Among the three different concentrations studied in this work, only the highest one was taken into account for this latter purpose. In order to be an effective solution for water purification, the formation of CO2 hydrates must show two main properties: high selectivity and abundant production of hydrates. The experiments described in this study showed that, even if the increase in salt concentration drastically changed the P–T evolution, the production of hydrates only slightly decreased. As visible in Table 3, the main reduction was observed between Tests 1–4, made of pure demineralised water, and Tests 5–8, carried out in the presence of 1.9 wt % (NH4)2SO4. Conversely, the difference, in terms of moles of hydrates produced, between the groups of tests made in the presence of additives, was not particularly relevant (respectively, 0.108–0.198 moles in Tests 5–8 against 0.092–0.177 moles in Tests 13–16).
Figure 11 shows some pictures of hydrate samples extracted from the two reactors.
The formation of hydrates cemented the sediment. However, the formation was heterogeneous. Figure 11 shows some samples denoting the coexistence of regions completely overrun by the formation of hydrates and adjacent areas, where the formation was weak and, without specific analyses, can be visibly proved only for the compactness of silica sand grains, which was achieved also at temperatures higher than 0 °C (therefore, it was not due to the formation of common ice).
Table 4 shows, for each test, the quantity of water involved in the formation of hydrates and its NH4+ content.
In the table, the quantity of water was calculated by multiplying the moles of hydrates formed, calculated according to Equation 1, for the hydration number. Considering the typology of the guests selected for the tests, the corresponding hydrate structure is the cubic sI, whose hydration number (which indicates the moles of water involved in the hydrate lattice for each molecule of guests capture) can vary between 5.75 and 19, and is, on average, equal to 6 [3]. Therefore, the moles of hydrates formed were not indicated, however, by dividing the values in the first column, times the hydration number, it can be easily observed that the results achieved perfectly agree with the values shown in Table 3. The results proved the feasibility of forming hydrates to remove (NH4)2SO4 from water. The initial concentration of ammonium passed from 1.5 to 0.38–0.449 wt%. However, similar to ice, the crystalline structure of hydrate should not involve ions and, by itself, cannot justify the concentrations reported in Table 4. The reason can be attributed to several factors. Firstly, the heterogeneous growth of hydrate crystals, which is highlighted in Figure 12.
The hydrate framework extracted from the reactors contained numerous macroscopic cavities, where the liquid phase contained a concentration of ammonium equal to or higher than the initial value of 1.5 wt%. The following dissociation of hydrate samples caused the mixing of water involved in the process with the aqueous phase contained in those cavities. Moreover, since the formation process was carried out at temperatures equal to and/or higher than 0 °C, the samples of hydrates were found immersed in the liquid phase. Thus, the hydrate samples were wet and further traces of the electrolyte solution were taken with them.
In the conclusion of this section, it clearly emerges that the hydrate formation process can be advantageously exploited as a technique for ammonium sulfate removal from water. However, such a process can reach maximum efficiency only when carried out continuously. The realization of this latter solution would require larger-scale apparatuses and is out of the scope of the present study. Conversely, batch processes, such as the one described in this manuscript, can be considered a desirable preliminary step, capable to purify, on one side, part of the contaminated water and, on the other side, thickening the electrolytes in the remaining liquid phase, thus allowing it to reach higher removal efficiencies for the next treatments.

4. Conclusions

The presence of electrolytes in the aqueous phase lowers the capability of water molecules to form hydrogen bonds with the surrounding molecules, thus reducing the production of hydrates. This phenomenon shows different intensities as a function of the size and charge of the involved ions. During formation, the electrolytes are not involved in the crystalline lattice. Therefore, the formation of hydrates in the contaminated water allows us to recover fresh water (from the following dissociation of crystals) and concentrate ions in the remained liquid phase, thus improving the efficiency of the next treatments.
This study deals with the formation of carbon dioxide hydrates in the aqueous phases containing ammonium sulfate at different concentrations, respectively equal to 1.9, 6.3 and 9.5 wt%. The results were then compared with those obtained during tests, carried out with the same procedure and the same guests, but in the absence of additives. Ammonium sulfate inhibited the process and the number of hydrates produced passed from 0.204–0.256 mol, obtained in fresh water, to 0.108–0.198 mol in the presence of 1.9 wt% (NH4)2SO4 and to 0.092–0.177 mol at the highest concentration studied. The electrolyte solution strongly inhibited the process and the inhibiting effect was found to increase with the initial concentration, but with low intensity. Conversely, the pressure—temperature evolution of the tests changed drastically with the concentration and, in the presence of 6.5 wt%, the experimental trend completely deviated from the ideal one, both during the formation and dissociation phases.
The feasibility of using hydrate for ammonium removal from wastewater was finally studied and validated. Further samples of CO2 hydrates were produced at initial (NH4)2SO4 concentrations equal to 9.5 wt%, corresponding to 1.5 wt% NH4+. The samples were then analysed via spectrophotometric analyses. The NH4+ concentration passed from the initial 1.5 wt% to 0.38–0.449 wt%. Therefore, it can be concluded that the production of CO2 hydrates in aqueous mixtures containing ammonium sulfate, even if carried out in batch conditions, can be considered a high-efficiency intermediate strategy for ions removal from water, due to the low energy requirements and the removal efficiency proved in this research.

Author Contributions

Conceptualization, A.M.G.; methodology, D.P.; software, X.R.; validation, F.R. and G.G.; formal analysis, A.M.G. and X.R.; investigation, A.M.G.; resources, F.R.; data curation, X.R.; writing—original draft preparation, A.M.G. and D.P.; writing—review and editing, A.M.G.; supervision, F.R. and G.G.; project administration, G.G.; funding acquisition, F.R and G.G. All authors have read and agreed to the published version of the manuscript.

Funding

This research received no external funding.

Institutional Review Board Statement

Not applicable.

Informed Consent Statement

Not applicable.

Data Availability Statement

Not applicable.

Conflicts of Interest

The authors declare no conflict of interest.

References

  1. Galloway, T.J.; Ruska, W.; Chappelear, P.S.; Kobayashi, R. Experimental measurement of hydrate numbers for methane and ethane and comparison with theoretical values. Ind. Eng. Chem. Fundam. 1970, 9, 237–243. [Google Scholar] [CrossRef]
  2. Englezos, P. Clathrate hydrates. Ind. Eng. Chem. Res. 1993, 32, 1251–1274. [Google Scholar] [CrossRef]
  3. Sloan, E.D.; Koh, C.A. Clathrate Hydrates on Natural Gases, 3rd ed.; CRC Press: Boca Raton, FL, USA, 2007. [Google Scholar]
  4. Makogon, Y.F.; Holditch, S.A.; Makogon, T.Y. Natural gas hydrates—A potential energy source for the 21st Century. J. Pet. Sci. Eng. 2007, 56, 14–31. [Google Scholar] [CrossRef]
  5. Makogon, Y.F. Natural gas hydrates—A promising source of energy. J. Nat. Gas Sci. Eng. 2010, 2, 49–59. [Google Scholar] [CrossRef]
  6. Li, Y.; Gambelli, A.M.; Rossi, F.; Mei, S. Effect of promoters on CO2 hydrate formation: Thermodynamic assessment and microscale Raman spectroscopy/hydrate crystal morphology characterization analysis. Fluid Phase Equilibr. 2021, 550, 113218. [Google Scholar] [CrossRef]
  7. Ripmeester, J.A.; Tse, J.S.; Ratcliffe, C.I.; Powell, B.M. A new clathrate hydrate structure. Nature 1987, 325, 135–136. [Google Scholar] [CrossRef]
  8. Li, Q.; Zhao, D.; Yin, J.; Zhou, X.; Li, Y.; Chi, P.; Han, Y.; Ansari, U.; Cheng, Y. Sediment instability caused by gas production from hydrate-bearing sediment in Northern South China Sea by horizontal wellbore: Evolution and mechanism. Nat. Resour. Res. 2023. [Google Scholar] [CrossRef]
  9. Li, Q.; Wu, J. Factors affecting the lower limit of the safe mud weight window for drilling operation in hydrate-bearing sediments in the Northern South China Sea. Geophys. Geo-Energy Geo-Resour. 2022, 8, 82. [Google Scholar] [CrossRef]
  10. Wei, W.N.; Li, B.; Gan, Q.; Li, Y.L. Research progress of natural gas hydrate exploitation with CO2 replacement: A review. Fuel 2022, 312, 122873. [Google Scholar] [CrossRef]
  11. Kvenvolden, K.A. Gas hydrates—Geological perspective and global change. Rev. Geophys. 1993, 31, 173–187. [Google Scholar] [CrossRef]
  12. Gambelli, A.M.; Rossi, F. Re-definition of the region suitable for CO2/CH4 replacement into hydrates as a function of the thermodynamic difference between CO2 hydrate formation and dissociation. Process Saf. Environ. Prot. 2023, 169, 132–141. [Google Scholar] [CrossRef]
  13. Rossi, F.; Gambelli, A.M.; Sharma, D.K.; Castellani, B.; Nicolini, A.; Castaldi, M.J. Experiments on methane hydrates formation in seabed deposits and gas recovery adopting carbon dioxide replacement strategies. Appl. Therm. Eng. 2019, 148, 371–381. [Google Scholar] [CrossRef]
  14. Li, X.Y.; Li, X.S.; Wang, Y.; Liu, J.W.; Hu, H.Q. The optimization mechanism for gas hydrate dissociation by depressurization in the sediment with different water saturations and different particle sizes. Energy 2021, 215, 119129. [Google Scholar] [CrossRef]
  15. Xu, C.G.; Cai, J.; Yu, Y.S.; Chen, Z.Y.; Li, X.S. Research on micro-mechanism and efficiency of CH4 exploitation via CH4-CO2 replacement from natural gas hydrates. Fuel 2018, 216, 255–265. [Google Scholar] [CrossRef]
  16. Tung, Y.T.; Chen, L.J.; Chen, Y.P.; Lin, S.T. In situ methane recovery and carbon dioxide sequestration in methane hydrates: A molecular dynamics simulation study. J. Phys. Chem. B 2011, 115, 15295–15302. [Google Scholar] [CrossRef]
  17. Baldwin, B.A.; Stevens, J.; Howard, J.J.; Graue, A.; Kvamme, B.; Aspenes, E.; Ersland, G.; Husebo, J.; Zornes, D.R. Using magnetic resonance imaging to monitor CH4 hydrate formation and spontaneous conversion of CH4 hydrate to CO2 hydrate in porous media. Magn. Reson. Imaging 2009, 27, 720–726. [Google Scholar] [CrossRef]
  18. Gambelli, A.M.; Stornelli, G.; Di Schino, A.; Rossi, F. Methane and carbon dioxide hydrates properties in presence of Inconel 718 particles: Analyses on its potential application in gas separation processes to perform efficiency improvement. J. Env. Chem. Eng. 2021, 9, 106571. [Google Scholar] [CrossRef]
  19. Ren, J.; Zeng, S.; Chen, D.; Yang, M.; Linga, P.; Yin, Z. Roles of montmorillonite clay on the kinetics and morphology of CO2 hydrate in hydrate-based CO2 sequestration. Appl. Energy 2023, 340, 120997. [Google Scholar] [CrossRef]
  20. Liu, Z.; Zheng, J.; Wang, Z.; Gao, Y.; Sun, B.; Liao, Y.; Linga, P. Effect of clay on methane hydrate formation and dissociation in sediment: Implications for energy recovery from clayey-sandy hydrate reservoirs. Appl. Energy 2023, 341, 121064. [Google Scholar] [CrossRef]
  21. Koide, H.; Shindo, Y.; Tazaki, Y.; Iijima, M.; Ito, K.; Kimura, N.; Omata, K. Deep sub-seabed disposal of CO2—The most protective storage. Energy Convers. Manag. 1997, 38, 253–258. [Google Scholar] [CrossRef]
  22. Ganteda, R.R.; Burla, S.K.; Boggu, J.M.R.; Prasad, P.S.R. Efficient storage of methane in hydrate from using soybean powder. Methane 2022, 1, 201–209. [Google Scholar] [CrossRef]
  23. Kumar, S.; Kwon, H.T.; Choi, K.H.; Lim, W.; Cho, J.H.; Tak, K.; Moon, L. LNG: An eco-friendly cryogenic fuel for sustainable development. Appl. Energy 2011, 88, 4264–4273. [Google Scholar] [CrossRef]
  24. Xie, Y.; Zhu, Y.J.; Zheng, T.; Yuan, Q.; Sun, C.Y.; Yang, L.Y.; Chen, G.J. Replacement in CH4-CO2 hydrate below freezing point based on abnormal self-preservation differences of CH4 hydrate. Chem. Eng. J. 2021, 403, 126283. [Google Scholar] [CrossRef]
  25. Sun, Z.G.; Wang, R.; Ma, R.; Guo, K.; Fan, S. Natural gas storage in hydrates with the presence of promoters. Energy Convers. Manag. 2003, 44, 2733–2742. [Google Scholar] [CrossRef]
  26. House, K.Z.; Schrag, D.P.; Harvey, C.F.; Lackner, K.S. Permanent carbon dioxide storage in deep-sea sediments. Proc. Natl. Acad. Sci. USA 2006, 103, 12291–12295. [Google Scholar] [CrossRef] [Green Version]
  27. Song, Y.; Wang, S.; Cheng, Z.; Huang, M.; Zhang, Y.; Zheng, J.; Jiang, L.; Liu, Y. Dependence of the hydrate-based CO2 storage processes on the hydrate reservoir environment in high-efficiency storage methods. Chem. Eng. J. 2021, 415, 128937. [Google Scholar] [CrossRef]
  28. Wang, F.; Guo, G.; Liu, G.Q.; Luo, S.J.; Guo, R.B. Effects of surfactants micelles and surfactant-coated nanospheres on methane hydrate growth pattern. Chem. Eng. Sci. 2016, 144, 108–115. [Google Scholar] [CrossRef]
  29. Gambelli, A.M.; Rossi, F. Review on the usage of small-chain hydrocarbons (C2-C4) as adi gases for improving the efficiency of hydrate-based technologies. Energies 2023, 16, 3576. [Google Scholar] [CrossRef]
  30. Veluswamy, H.P.; Wong, A.J.H.; Babu, P.; Kumar, R.; Kulprathipanja, S.; Rangsungivit, P.; Linga, P. Rapid methane hydrate formation to develop a cost effective large scale energy storage system. Chem. Eng. J. 2016, 290, 161–173. [Google Scholar] [CrossRef]
  31. Montazeri, S.M.; Kolliopoulos, G. Hydrate based desalination for sustainable water treatment: A review. Desalination 2022, 537, 115855. [Google Scholar] [CrossRef]
  32. Bhatti, Z.A.; Qureshi, K.; Maitlo, G.; Ahmed, S. Study of PAN fiber and iron ore absorbents for arsenic removal. Civ. Eng. J. 2020, 6, 548–562. [Google Scholar] [CrossRef] [Green Version]
  33. Priscilla, S.J.; Judi, V.A.; Daniel, R.; Sivaji, K. Effects of chromium doping on the electrical properties of ZnO nanoparticles. Emerg. Sci. J. 2020, 4, 82–88. [Google Scholar] [CrossRef] [Green Version]
  34. Li, Y.; Chen, J.; Gambelli, A.M.; Zhao, X.; Gao, Y.; Rossi, F.; Mei, S. In situ experimental study on the effect of mixed inhibitors on the phase equilibrium of carbon dioxide hydrate. Chem. Eng. Sci. 2022, 248, 117230. [Google Scholar] [CrossRef]
  35. Bates, C.; Gladwin, R.; McGrath, L. Desalination in pilot scale column crystallizers. Desalination 1977, 21, 83–97. [Google Scholar] [CrossRef]
  36. Karamoddin, M.; Varaminian, F. Water desalination using R141b gas hydrate formation. Desalination Water Treat. 2014, 52, 2450–2456. [Google Scholar] [CrossRef]
  37. Chong, Z.R.; Yang, S.H.B.; Babu, P.; Linga, P.; Li, X.S. Review on natural gas hydrate as an energy resource: Prospects and challenges. Appl. Energy 2016, 162, 1633–1652. [Google Scholar] [CrossRef]
  38. Bradshaw, R.W.; Simmons, B.A.; Majzoub, E.H.; Clift, W.M.; Dedrick, D.E. Clathrate hydrates for production of potable water. Mater. Res. Soc. Symp. Proc. 2006, 930, 14–19. [Google Scholar] [CrossRef]
  39. Bavoh, C.B.; Partoon, B.; Lal, B.; Gonfa, G.; Foo Khor, S.; Sharif, A.M. Inhibition effect of amino acids on carbon dioxide hydrate. Chem. Eng. Sci. 2017, 171, 331–339. [Google Scholar] [CrossRef]
  40. Gambelli, A.M.; Filipponi, M.; Nicolini, A.; Rossi, F. Natural gas hydrate: Effect of sodium chloride on the CO2 replacement process. Int. Multidiscip. Sci. GeoConference SGEM 2019, 19, 333–343. [Google Scholar]
  41. Holzammer, C.; Finckenstein, A.; Will, S.; Braeuer, A.S. How sodium chloride salt inhibits the formation of CO2 gas hydrates. J. Phys. Chem. B 2016, 120, 2452–2459. [Google Scholar] [CrossRef] [Green Version]
  42. Cha, J.H.; Seol, Y. Increasing gas hydrate formation temperature for desalination of high salinity produced water with secondary guests. ACS Sustain. Chem. Eng. 2013, 1, 1218–1224. [Google Scholar] [CrossRef]
  43. Sahu, P.; Krishnaswamy, K.; Ponnani, N.K.; Pande, A. A thermodynamic approach to selection of suitable hydrate formers for seawater desalination. Desalination 2018, 436, 144–151. [Google Scholar] [CrossRef]
  44. Chapoy, A.; Mazloum, S.; Burgass, R.; Haghighi, H.; Tohidi, B. Clathrate hydrate equilibria in mixed monoethylene glycol and electrolyte aqueous solutions. J. Chem. Thermodyn. 2012, 48, 7–12. [Google Scholar] [CrossRef]
  45. Gaikwad, N.; Nakka, R.; Khavala, V.; Bhadani, A.; Mamane, H.; Kumar, R. Gas hydrate-based process for desalination of heavy metal ions from an aqueous solution: Kinetics and rate of recovery. ACS EST Water 2021, 1, 134–144. [Google Scholar] [CrossRef]
  46. Nam Park, K.; Hong, S.Y.; Lee, J.W.; Kang, K.C.; Lee, Y.C.; Ha, M.G.; Lee, J.D. A new apparatus for seawater desalination by gas hydrate process and removal characteristics of dissolved minerals (Na+, Mg2+, Ca2+, K+, B3+). Desalination 2011, 274, 91–96. [Google Scholar] [CrossRef]
  47. Lu, H.; Matsumoto, R.; Tsuji, Y.; Oda, H. Anion plays a more important role than cation in affecting gas hydrate stability in electrolyte solutions?—A recognition from experimental results. Fluid Phase Equilibr. 2001, 178, 225–232. [Google Scholar] [CrossRef]
  48. Englezos, P.; Kalogerakis, N.; Dholabhai, P.D.; Bishnoi, P.R. Kinetics of formation of methane and ethane gas hydrates. Chem. Eng. Sci. 1987, 42, 2647–2658. [Google Scholar] [CrossRef]
  49. Zhang, T.; Wu, X.; Shaheen, S.M.; Zhao, Q.; Liu, X.; Rinklebe, J.; Ren, H. Ammonium nitrogen recovery from digestate by hydrothermal pretreatment followed by activated hydrochar sorption. Chem. Eng. J. 2020, 379, 122254. [Google Scholar] [CrossRef]
  50. Zhang, N.; Zheng, H.Y.; Hu, X.H.; Zhu, Q.; Stanislaus, M.S.; Li, S.Y.; Zhao, C.Y.; Wang, Q.H.; Yang, Y.N. Enhanced bio—Methane production from ammonium—Rich waste using eggshell- and lignite- modified zeolite (ELMZ) as a bio—Adsorbent during anaerobic digestion. Process Biochem. 2019, 81, 148–155. [Google Scholar] [CrossRef]
  51. Zhang, T.; Li, Q.C.; Ding, L.L.; Ren, H.Q.; Xu, K.; Wu, Y.G.; Sheng, D. Modeling assessment for ammonium nitrogen recovery from wastewater by chemical precipitation. J. Environ. Sci. 2011, 23, 881–890. [Google Scholar] [CrossRef]
  52. Mandal, S.; Thangarajan, R.; Bolan, N.S.; Sarkar, B.; Khan, N.; Ok, Y.S.; Naidu, R. Biochar—Induced concomitant decrease in ammonia volatilization and increase in nitrogen use efficiency be wheat. Chemosphere 2016, 142, 120–127. [Google Scholar] [CrossRef]
  53. Takaya, C.A.; Fletcher, L.A.; Singh, S.; Anyikude, K.U.; Boss, A.B. Phosphate and ammonium sorption capacity of biochar and hydrochar from different wastes. Chemosphere 2016, 145, 518–527. [Google Scholar] [CrossRef]
  54. Ajmal, S.; Kumar, A.; Selvaraj, M.; Alam, M.M.; Yang, Y.; Das, D.K.; Gupta, R.K.; Yasin, G. MXenes and their interfaces for the taming of carbon dioxide & nitrate: A critical review. Coord. Chem. Rev. 2023, 483, 215094. [Google Scholar]
  55. Ajmal, S.; Yasin, G.; Kumar, A.; Tabish, M.; Ibraheem, S.; Sammed, K.A.; Mushtaq, M.S.; Saad, A.; Mo, Z.; Zhao, W. A disquisition on CO2 electroreduction to C2H4: An engineering and design perspective looking beyond novel choosy catalyst materials. Coord. Chem. Rev. 2023, 485, 215099. [Google Scholar] [CrossRef]
  56. Rossi, F.; Li, Y.; Gambelli, A.M. Thermodynamic and kinetic description of the main effects related to the memory effect during carbon dioxide hydrates formation in a confined environment. Sustainability 2021, 13, 13797. [Google Scholar] [CrossRef]
  57. Khan, M.S.; Partoon, B.; Bavoh, C.B.; Lal, B.; Mellon, B.M. Influence of tetramethylammonium hydroxide on methane and carbon dioxide phase equilibrium conditions. Fluid Phase Equilibr. 2017, 440, 1–8. [Google Scholar] [CrossRef]
  58. Sadeq, D.; Iglauer, S.; Lebedev, M.; Smith, C.; Barifcani, A. Experimental determination of hydrate phase equilibrium for different gas mixture containing methane, carbon dioxide and nitrogen with motor current measurements. J. Nat. Gas Sci. Eng. 2017, 38, 59–73. [Google Scholar] [CrossRef] [Green Version]
  59. Yu, S.H.; Zhou, S.D.; Li, X.S.; Wang, S.L. Effect of graphite nanoparticles on CO2 hydrate phase equilibrium. Fluid Phase Equilibr. 2016, 414, 23–28. [Google Scholar] [CrossRef]
  60. Jarrahian, A.; Nakhaee, A. Hydrate-liquid-vapor equilibrium condition for N2 + CO2 + H2O system: Measurement and modelling. Fuel 2019, 237, 769–774. [Google Scholar] [CrossRef]
  61. Kyung, D.; Lee, K.; Kim, H.; Lee, W. Effect of marine environmental factors on the phase equilibrium of CO2 hydrate. Int. J. Greenh. Gas Control 2014, 20, 285–292. [Google Scholar] [CrossRef]
  62. Seo, Y.T.; Lee, H. Multiple-phase hydrate equilibria of the ternary carbon dioxide, methane, and water mixtures. J. Phys. Chem. B 2001, 105, 10084–10090. [Google Scholar] [CrossRef]
  63. Fitzgerald, G.C.; Castaldi, M.J.; Zhou, Y. Large scale reactor details and results for the formation and decomposition of methane hydrates via thermal stimulation dissociation. J. Pet. Sci. Eng. 2012, 94, 19–27. [Google Scholar] [CrossRef]
Figure 1. Technical scheme and geometrical details of the two reactors used for the production of hydrates [56].
Sustainability 15 09841 g001
Figure 2. Picture of the completely assembled experimental apparatus.
Sustainability 15 09841 g002
Figure 3. The positioning of sensors is equal for both reactors [56].
Sustainability 15 09841 g003
Figure 4. Picture above: scanning microscope high-resolution image of a single grain (scale: 200 nm). Picture below: the porous sediment extracted from the reactor after the formation of CO2 hydrates. The clathrate structures formed between grains and cemented the whole sediment.
Sustainability 15 09841 g004
Figure 5. Calibration curve obtained with default concentrations of ammonium sulfate.
Sustainability 15 09841 g005
Figure 6. Pressures measured in the reactors after completion of carbon dioxide formation and as a function of salt concentration.
Sustainability 15 09841 g006
Figure 7. CO2 hydrates formation (in black) and dissociation (in dark grey) in pure demineralised water, compared with the phase boundary equilibrium for this species, defined with experimental data collected from the literature [59,60,61,62].
Sustainability 15 09841 g007aSustainability 15 09841 g007bSustainability 15 09841 g007c
Figure 8. CO2 hydrates formation (in black) and dissociation (in dark grey) in an aqueous mixture containing 1.9 wt% (NH4)2SO4 to the aqueous phase, corresponding to 0.3 wt% NH4+.
Sustainability 15 09841 g008aSustainability 15 09841 g008b
Figure 9. CO2 hydrates formation (in black) and dissociation (in dark grey) in the aqueous mixture containing 6.3 wt% (NH4)2SO4 to the aqueous phase, corresponding to 1.0 wt% NH4+.
Sustainability 15 09841 g009aSustainability 15 09841 g009bSustainability 15 09841 g009c
Figure 10. CO2 hydrates formation (in black) and dissociation (in dark grey) in the aqueous mixture containing 9.5 wt% (NH4)2SO4 to the aqueous phase, corresponding to 1.5 wt% NH4+.
Sustainability 15 09841 g010aSustainability 15 09841 g010bSustainability 15 09841 g010c
Figure 11. Pictures of hydrate samples extracted from the reactors.
Sustainability 15 09841 g011
Figure 12. Particulate of CO2 hydrate extracted from the reactors; the growth of crystals caused the formation of numerous macro cavities, where the high NH4+ concentration-liquid phase was physically captured.
Sustainability 15 09841 g012
Table 1. Experiments were carried out to study the formation of CO2 hydrates in H2O + (NH4)SO4 mixtures.
(NH4)SO4 in Water [wt%]Corr. NH4+ in Water [wt%]Test n°
001
2
3
4
1.90.35
6
7
8
6.31.09
10
11
12
9.51.513
14
15
16
Table 2. Pressures measured at the end of hydrates formation, shown as a function of ammonium concentration in the aqueous phase.
Final Pressure Values [bar]
Tests 1–4Tests 5–8Tests 9–12Tests 13–16
0 wt% NH4+0.3 wt% NH4+1.0 wt% NH4+1.5 wt% NH4+
28.1832.9133.6235.77
29.8333.1735.6335.64
27.932.9933.6435.64
28.0932.8535.2235.78
Table 3. Moles of CO2 hydrates formed, shown as a function of ammonium concentration in the aqueous phase.
Moles of Hydrates Formed [mol]
Tests 1–4Tests 5–8Tests 9–12Tests 13–16
0 wt% NH4+0.3 wt% NH4+1.0 wt% NH4+1.5 wt% NH4+
0.2370.1980.1010.175
0.2040.1080.1830.092
0.2560.1400.1840.177
0.2280.1080.1100.132
Table 4. Water involved in hydrate formation and its corresponding concentration of ammonium (initial concentration in the aqueous phase prior to hydrate formation equal to 1.5 wt%).
TestWater into Hydrates [mol]NH4+ in Water [wt%]
A0.6240.428
B0.7860.407
C0.5880.400
D0.7020.449
E0.8340.380
F0.7320.428
Disclaimer/Publisher’s Note: The statements, opinions and data contained in all publications are solely those of the individual author(s) and contributor(s) and not of MDPI and/or the editor(s). MDPI and/or the editor(s) disclaim responsibility for any injury to people or property resulting from any ideas, methods, instructions or products referred to in the content.

