Article

Early Warning Evaluation and Warning Trend Analysis of the Resource and Environment Carrying Capacity in Altay Prefecture, Xinjiang

1
School of Economics and Management, University of Chinese Academy of Sciences, Beijing 100049, China
2
Altay District Administration Office, Ili Kazak Autonomous Prefecture, Xinjiang Uygur Autonomous Region, Altay 836500, China
3
College of Business, Central South University of Forestry and Technology, Changsha 410004, China
4
College of Environmental Science and Engineering, Central South University of Forestry and Technology, Shaoshan South Road, Tianxin District, Changsha 410004, China
5
College of Tourism, Central South University of Forestry and Technology, Shaoshan South Road, Tianxin District, Changsha 410004, China
6
Hunan Planning Institute of Land and Resources, Furong Middle Road, Changsha 410007, China
7
Department of Biology, Eastern New Mexico University, Portales, NM 88130, USA
*
Authors to whom correspondence should be addressed.
These authors contributed equally to this work.
Sustainability 2023, 15(12), 9825; https://doi.org/10.3390/su15129825
Submission received: 8 May 2023 / Revised: 8 June 2023 / Accepted: 16 June 2023 / Published: 20 June 2023

Abstract

:
Ecologically fragile areas in China account for more than half of its land area. Performing early warning assessments and trend analyses of resource and environment carrying capacity in ecologically fragile areas can lay a scientific foundation for ecological conservation in the areas. Based on the connotation of resource and environment carrying capacity, an early warning index system of resource and environment carrying capacity in Altay prefecture was constructed from the three aspects natural resource carrying capacity, eco-environment carrying capacity, and economic and social support capacity. The grey relational projection method model was used to analyze the current alarm situation of the resource and environment carrying capacity in Altay prefecture from 2011 to 2020, and then the back propagation (BP) neural network and a mathematical statistics software were used to predict the evolution of the alarm situation of the resource and environment carrying capacity in Altay prefecture from 2021 to 2025. The results demonstrated that (1) the natural resource carrying capacity subsystem was the main system of the development of the resource and environment carrying capacity in Altay prefecture, and its impact on the resource and environment carrying capacity in Altay prefecture was greater than the eco-environment carrying capacity and economic and social support capacity; (2) the resource and environmental carrying capacity of Altay prefecture showed a slight upward trend from 2011 to 2020, although the range was constrained and the level of warning remained “moderate warning”. A spatial pattern of “weak in the middle, strong in the two poles” was exhibited by the warning scenario about the carrying capacity of each county and city. Except for the warning of Habahe County and Qinghe County, where the warning was slightly worse than that in 2020, the warning of resource and environment carrying capacity in Altay prefecture and other counties and cities would show a trend of fluctuation and decline from 2021 to 2025. However, the degree of alarm did not change substantially and remained at the level of “moderate warning”; (3) the main factors restricting the mitigation of the warning of resource and environment carrying capacity in Altay prefecture included a low soil fertility index, a small total reservoir capacity, low per capita mineral resource reserves, a low water resource development and utilization rate, a low comprehensive utilization rate of industrial solid waste, and a low land output rate.

1. Introduction

Due to the main impact of temperature, precipitation, and manmade disturbances, ecologically sensitive areas of medium, medium-high, and high vulnerability levels occupy more than half of the entire terrestrial surface area of the Earth [1]. China is one of the countries with the largest distribution of ecologically fragile areas, the largest number of types, and the most obvious signs of vulnerability. According to the annual report (2012) of the China Council for International Cooperation on Environment and Development (CCICED), more than 360 million people live in ecologically fragile areas, accounting for about a quarter of the total population of China [2]. In addition, ecologically fragile areas cover more than 60% of the less develop areas in China, which generally exhibit weak resource and environmental carrying capacity with local overloading. Moreover, the carrying capacity of these areas is sensitive to environmental changes and has a weak buffering capacity against natural disasters [3,4]. Global climate change and anthropogenic factors have further intensified the pressure on the resources and environment in these ecologically fragile areas, which may cause changes in the structure and function of ecosystems, thereby affecting the service functions of ecosystems and even posing a threat to ecological security [5,6]. Determining the thresholds of resource and environment carrying capacity in ecologically fragile areas can lay a scientific foundation for ecological conservation in these areas, which is a major technological requirement for the construction of an ecological civilization, as well as a strategic requirement for maintaining and ensuring national ecological security [7].
The Altay Prefecture is a frontier, cold, and disaster-prone area dominated by animal husbandry. At the same time, its socio-economic development falls behind and natural environment is very fragile, which is a typical ecological fragile area [8,9]. In recent years, due to the development of the economy and society, the impact of anthropogenic factors such as mining, tourism, overgrazing and natural factors such as climate change, a clear trend of environmental deterioration is easily discernible [10]. In this context, early warning assessment of the resource and environment carrying capacity of the Altay Prefecture and study of alarm trends can provide an important basis for the harmonious development of the economy, society, natural resources and ecological environment in the region and safeguard the stability of the frontier and build a beautiful Xinjiang.
Although the research on the carrying capacity of resource and environment at home and abroad has achieved fruitful results, there are still problems such as a generalized concept, a single technical method, a weak comprehensive evaluation of the research, a unified comprehensive index system and evaluation model, and a weak practical application [11,12]. Moreover, in our previous research review, through reading a lot of studies, we found that the current research on the carrying capacity of resource and environment is mainly based on static evaluation, lacking the prediction of future development trends [13]. Thus, early warning research on the development trend of resource and environment carrying capacity through dynamic analysis is currently a research hotspot. Some studies have shown that the early warning research on resource and environment carrying capacity needs to fully combine its prediction results based on the analysis of the evolution characteristics of key factors of resource and environment carrying capacity [14,15]. By selecting a single or combined prediction methods to construct a resource and environment carrying capacity prediction model, it is possible to meet the demand for dynamic prediction in early warning. For example, the dynamic ecological footprint method based on time series can track the natural, social, and economic changes at various time points by calculating the time series values of each index, which could make up for the defects of the static nature of the indexes [16]. The combination of grey correlation analysis and entropy topsis method can analyze the dynamic changes in resource and environment carrying capacity of Yibin city over a period of time. The combination of the two methods can objectively calculate the weight and improve the credibility of the evaluation [17]. The combination method of principal component analysis and system dynamics can be used to evaluate the regional land resource and environment carrying capacity and to enhance the objectivity and scientificity of the evaluation results. Therefore, the process of resource and environment carrying capacity evaluation no longer depends on the current and sole approach; instead, by merging with the dynamic model, the evaluation is made more accurate and timely. Furthermore, development of a set of standardized, modeled, and computerized evaluation methods as well as further research into pertinent standards and specifications, thresholds (intervals), calibration, and relevant parameters can support practical application of resource and environment carrying capacity [18].
Based on the existing theories and methods, modern computer technology, geographic remote sensing technology, and geographic information system (GIS) study of the carrying capacity of resources and environment will develop in the direction of spatial optimization and digitalization, and the model will be more accurate and the theory will be enriched. In 2015, Wang Kuifeng combined the state space method, analytic hierarchy process, and regression prediction model with GIS to assess the resource environment carrying capacity of Shandong Peninsula in terms of water resources, land resources, mineral resources, tourism resources, geological environment, ecological environment, and marine environment [19]. Yang et al. used the weighted Technique for Order Preference using the Similarity to an Ideal Solution (TOPSIS) model and the GIS spatial analysis method to analyze the spatiotemporal variation in resource environmetal carrying capacity of Gansu [20]. Ou et al. used the mean squared difference decision method to determine the comprehensive carrying capacity weights and calculated the carrying capacity of resources and environment in Yongde County, Yunnan Province, a typical mountainous county, with the help of GIS spatial analysis technology [21]. With the development of information technology, the combination of the dynamic analysis method and GIS spatial analysis technology will provide more applications in the near future.
This study aimed to map the current situation of resource and environment carrying capacity in Altay Prefecture, develop a set of early warning index systems that could accurately reflect the situation of resource and environment carrying capacity in Altay Prefecture, and control the current situation of resource and environment carrying capacity of a typical ecologically fragile area—Altay Prefecture. In addition, an error back propagation neural network model (BP neural network) was used, and mathematical and statistical softwares were also employed to analyze the current situation of the alarm situation and predict the evolution trend of the alarm situation. The results of this study could provide a scientific basis for ecological and environmental risk monitoring, ecosystem assessment, ecological disaster forecasting and early warning in ecologically fragile areas, resource utilization, ecological protection, and regional resource and environmental management in the fragile areas.

2. Overview of the Study Area

Altay Prefecture is located in the northeast of Ili Kazak Autonomous Prefecture, at the northern tip of Xinjiang, the northwestern border of China, and the hinterland of Eurasia. This region is the only region in northwest China bordering Russia. It is an important node city of the northern passage of the Silk Road Economic Belt. In addition, it also borders Mongolia and Kazakhstan, an important link to the China–Mongolia–Russia Economic Corridor. The regional landscape is sandwiched between the Altay Mountains and the Tianshan Mountains, forming a good depression geography. In comparison with the northwest region, the Altay Prefecture is a relatively water-abundant area in Xinjiang, known as the “water tower” in the north, thus forming one of the six major forest areas in China. In 2020, the per capita arable land area of the region was 0.41 hm2, the per capita water resource was 18,633.69 m3, the per capita mineral resources were 5036.80 tons per person, the harmless treatment rate of domestic waste was 98.74%, and the forest coverage rate was 22.65%, which critically supported the healthy and sustainable development of the region’s society and economy and made an essential contribution to the stability of the northwestern border areas of China.

3. Early Warning Index System and the Determination of Index Safety Standard Values

3.1. Establishment of Early Warning Index System

A crucial step in the assessment of resource and environment carrying capacity (RECC) is the development of a resource and environment carrying capacity evaluation index system, which helps in the scientific integration and classification of the quantitative data, encourages the development of carrying capacity research, and ensures the validity of the final evaluation results.
The resource and environment carrying capacity refers to the supporting capacity of the natural foundation as a carrier for human production and living activities. The natural foundation includes all natural conditions that affect human production and life activities such as resources, environment, ecology, disasters, etc. [22]. At the same time, the socio-economic development has a certain support and feedback influence on the resources and environment, which is conducive to improving the resource and environment carrying capacity. Based on this understanding, the resource and environment carrying capacity in this study can generally be divided into four aspects, including natural resource carrying capacity, eco-environment carrying capacity, economic and social supporting capacity, and natural disaster carrying capacity. Due to the uncertainty of natural disasters some disasters cannot be predicted. Therefore, this study did not consider the natural disaster carrying capacity temporarily, and only measures the early warning of resource and environment carrying capacity from three aspects: natural resource carrying capacity, eco-environment carrying capacity, and economic and social supporting capacity. Following the principles of scientificity, coordination, practicality, and dynamism in establishing the index system, referring to the research results of relevant scholars, and considering the actual resource and environment carrying capacity of the Altay Prefecture and the availability of data, 26 specific evaluation indexes were selected to construct the resource and environment carrying capacity evaluation index system of Altay Prefecture (Table 1). The natural resource carrying capacity mainly included the bearing status of natural resources such as water resources, land resources, grassland resources, mineral resources, etc. The eco-environment carrying capacity mainly referred to the bearing status of air pollution, water pollution, solid waste pollution, ecological protection, etc. The economic and social supporting capacity mainly included social and economic factors that affect the carrying capacity of resources and the environment, such as population, urbanization, economic development, pollution control, etc.

3.2. Data Sources

The original data for the above indexes were primarily collected from the 2012–2021 “Altay Regional Statistical Yearbook”, “China Rural Statistical Yearbook”, and the 2011–2020 “Altay Statistical Bulletin of National Economic and Social Development”, “Altay Regional Water Resources Bulletin”, “Altay Regional Environment Bulletin”, and “Altay Regional Land Use Overall Plan”. Some data were sourced from relevant government departments in the Altay Prefecture.

4. Research Method

4.1. Assessment Method of Resource and Environment Carrying Capacity in Altay Prefecture

The resource and environment carrying capacity involved many factors, such as social, economic, and natural factors, and the information on these factors had a certain incompleteness and uncertainty; it was a typical grey system. The grey correlation projection method was applied to explore the multi-objective decision-making problem from the perspective of vector projection. The grey correlation projection model has the advantages of a mature method, simple operation, efficient and accurate results, and a high reference value [13], which can comprehensively and accurately reflect the closeness between the decision-making scheme and the ideal scheme. It has good adaptability to grey system problems and strong advantages in solving multi-objective grey evaluation and decision-making. In addition, it has been well adopted and achieved good results in comprehensive evaluation studies such as environmental quality and vulnerability assessment and land use planning [23]. However, its involvement in the field of resource and environment carrying capacity alarm assessment is very limited. In this study, we introduced this method into the alarming assessment of resource and environment carrying capacity and performed a comprehensive assessment of the resource and environment carrying capacity alerts based on the actual situation of the resources and environment in Altay Prefecture.

4.1.1. Normalization of the Index Value

Due to the difference between the original data manifestation and the measurement unit of each index, there was no direct comparability between indexes, which affected the scientific reliability of the final evaluation results. To facilitate the subsequent calculation and analysis, all the original data must be standardized [24,25].
In this study, six indexes, including SO2 emission intensity, wastewater discharge per unit industrial added value, application quantity of pesticides and fertilizers per unit cultivated area, population density, water consumption per unit GDP, and energy consumption per unit GDP were reversed indexes. As an appropriate index, the per capita construction land area was regarded as a reverse index for the convenience of evaluation and analysis. The remaining 19 indexes were treated as positive indexes.
No matter whether the index value in the decision-making matrix was positive or negative, after range transformation, the standardized index was controlled within the range of 0 to 1, and the positive and reverse indexes were all converted into positive indexes. The optimal value was 1 and the worst value was 0 [26], which was conducive to solving the impact of the difference in the nature of indexes. This study used the range transformation method to standardize the original index data. The specific calculation formula was as follows:
(1)
For positive indexes:
y i j = x i j min ( x i j ) max ( x i j ) min ( x i j )
(2)
For adverse indexes:
y i j = max ( x i j ) x i j max ( x i j ) min ( x i j )
where xij is the jth observation of the ith index; max(xij) is the maximum value of the index; min(xij) is the minimum value of the index; and yij is the standardized index value.

4.1.2. Calculation of the Grey Correlation Coefficient

For the sequence y0 obtained through initialization, the larger the value of y0, the better, so an ideal sample was defined as x 0 ( k ) = 1 and used as a reference number sequence to define the ideal sample, and to let it be the reference series. x i ( k ) was the evaluation sample, that is, the comparison sequence, so as to obtain the grey correlation coefficient r 01 ( k ) between the evaluation sample and the ideal sample.
r 01 ( k ) = min i   min k   | x 0 ( k ) x i ( k ) | + λ max i   max k x 0 ( k ) x i ( k ) x 0 ( k ) x i ( k ) + λ max i   max k x 0 ( k ) x i ( k )
λ 0 , 1 was the resolution factor, which was normally taken as 0.5.

4.1.3. Calculation of Index Weights

The weights of the indexes directly affect the accuracy of the evaluation results. This study selected the entropy method with strong objectivity to calculate the index weights. Information entropy measures the order of the elements within a system. The entropy method was used to evaluate the target by measuring the information entropy of different elements in the multi-element index system [27,28]. The specific calculation method of index weights is described in the supplementary material.

4.1.4. Calculating the Grey Relational Projection Values

If each decision scheme is regarded as a row vector (vector), the included angle θ i between each decision scheme Ai and the best scheme A0 is called the grey incidence projection angle [29]. Let e i = cos θ i , then:
e i = A i A 0 A i A 0 = j = 1 m W j r i j W j j = 1 m W j r i j 2 j = 1 m W j 2 , i = 1 , 2 , , n
Obviously, in the angle cosine 0 e i 1 , a larger ei indicated that the direction of change between the decision scheme Ai and the ideal scheme A0 was more consistent.
Let the modulus of the decision scheme Ai be di, then:
d i = j = 1 m W j r i j 2
Considering the size of the modulus and the cosine of the included angle, the proximity between each decision solution and the optimal solution could be fully and accurately reflected.
The projection value of decision-making scheme Ai on the optimal scheme A0 was the grey relational projection value Dj, and met the following requirements:
D j = d i e i = j = 1 m W j r i j 2 j = 1 m W j r i j W j j = 1 m W j r i j 2 j = 1 m W j 2 = j = 1 m r i j W j 2 j = 1 m W j 2
The value range of Dj was 0–1. The larger the projection value was, the closer it was to the ideal scheme, that is, the higher the regional resource and environment carrying capacity was, the lower Dj, and vice versa.

4.2. Prediction Method of Alarm Situation

For the risk prediction of resource and environment carrying capacity, domestic and foreign scholars have adopted numerous methods and models, such as back propagation (BP) neural network, independent variable regression model, RBF neural network, GM (1, 1) grey model, etc. Among them, the BP neural network, as one of the most important branches of artificial neural networks, has the advantages of simple structure, large-scale parallel processing of data, strong self-adaptability, and good fault tolerance in comparison to other prediction methods for resource and environment carrying capacity [30]. Moreover, its prediction error is small and its prediction accuracy is high, which could solve the problems faced by most neural networks and provide an innovative idea and way to improve the regional resource and environment carrying capacity. Thus, this study selected the BP neural network as the method to predict the evolution trend of resource and environment carrying capacity alerts in Altay Prefecture. The basic principle of the BP neural network is presented in the Supplementary Materials.

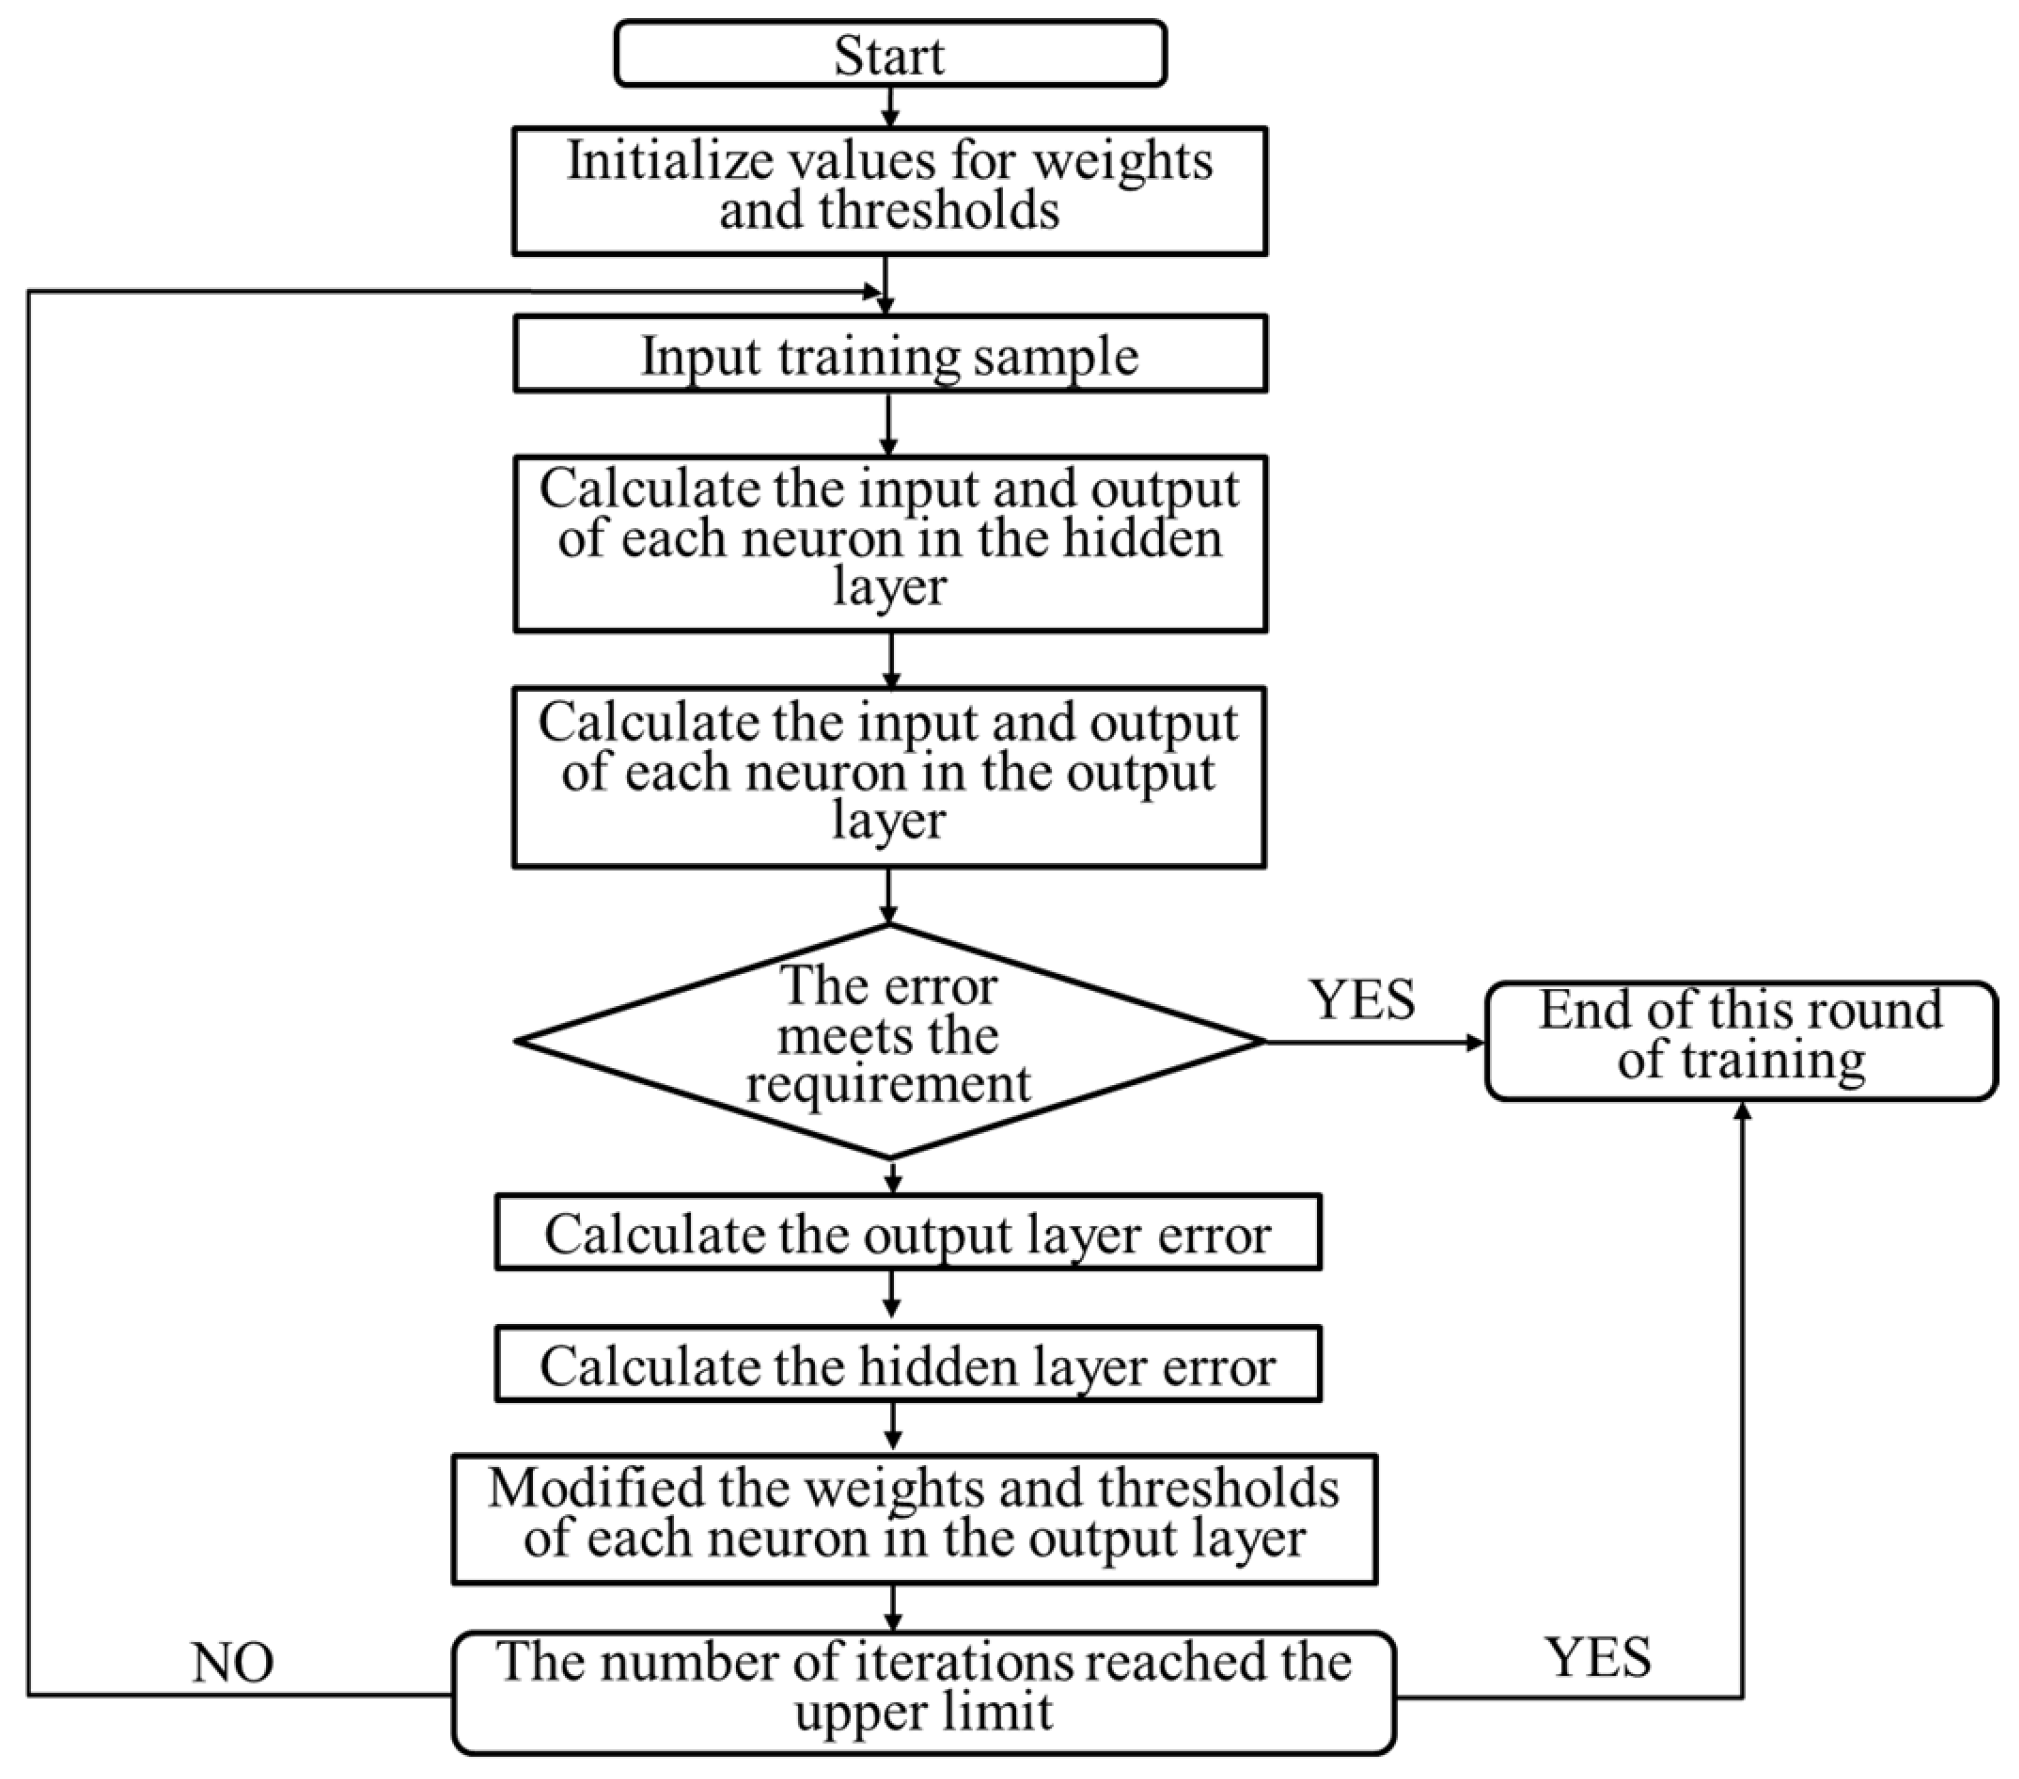
4.2.1. BP Neural Network Structure

The basic structure of the BP network is shown in Figure S1, with the number of input layer nodes as n and the input variable as x i   ( i = 1 , 2 , , n ) ; the number of hidden layer nodes as q; the connection weights between the input layer nodes and the hidden layer nodes as w ji   ( i = 1 , 2 , , n ; j = 1 , 2 , , q ) ; the threshold of the hidden layer nodes as θ j j = 1 , 2 , , q ; the output of the hidden nodes as yj; the number of output layer nodes as m; the connection weights between the hidden layer nodes and the output layer nodes as v k j j = 1 , 2 , , q ; k = 1 , 2 , , m ; the threshold of the output layer nodes as φ k k = 1 , 2 , , m ; and the output of the output layer nodes as Ok. A node represented each neuron, and the network was composed of input layer, hidden layer and output layer nodes [31]. The hidden layer can be one layer or multiple layers as shown in Figure S1, and weights link the nodes from the front to the back layers [32]. The hidden nodes generally use sigmoid-type functions, and the input and output nodes can use sigmoid-type functions or linear functions [33,34].

4.2.2. Learning Algorithms for BP Neural Networks

A BP neural network algorithm flowchart is shown in Figure 1. The specific step description is shown in the Supplementary Material.

4.2.3. Division of Risk Warning Intervals

With reference to the relevant literature on the risk prediction of resource and environment carrying capacity and the division standard [35], the warning level of resource and environment carrying capacity was divided into five levels to reflect the warning situation of resource and environment carrying capacity in Altay Prefecture, as shown in Table 2.

5. Results and Discussion

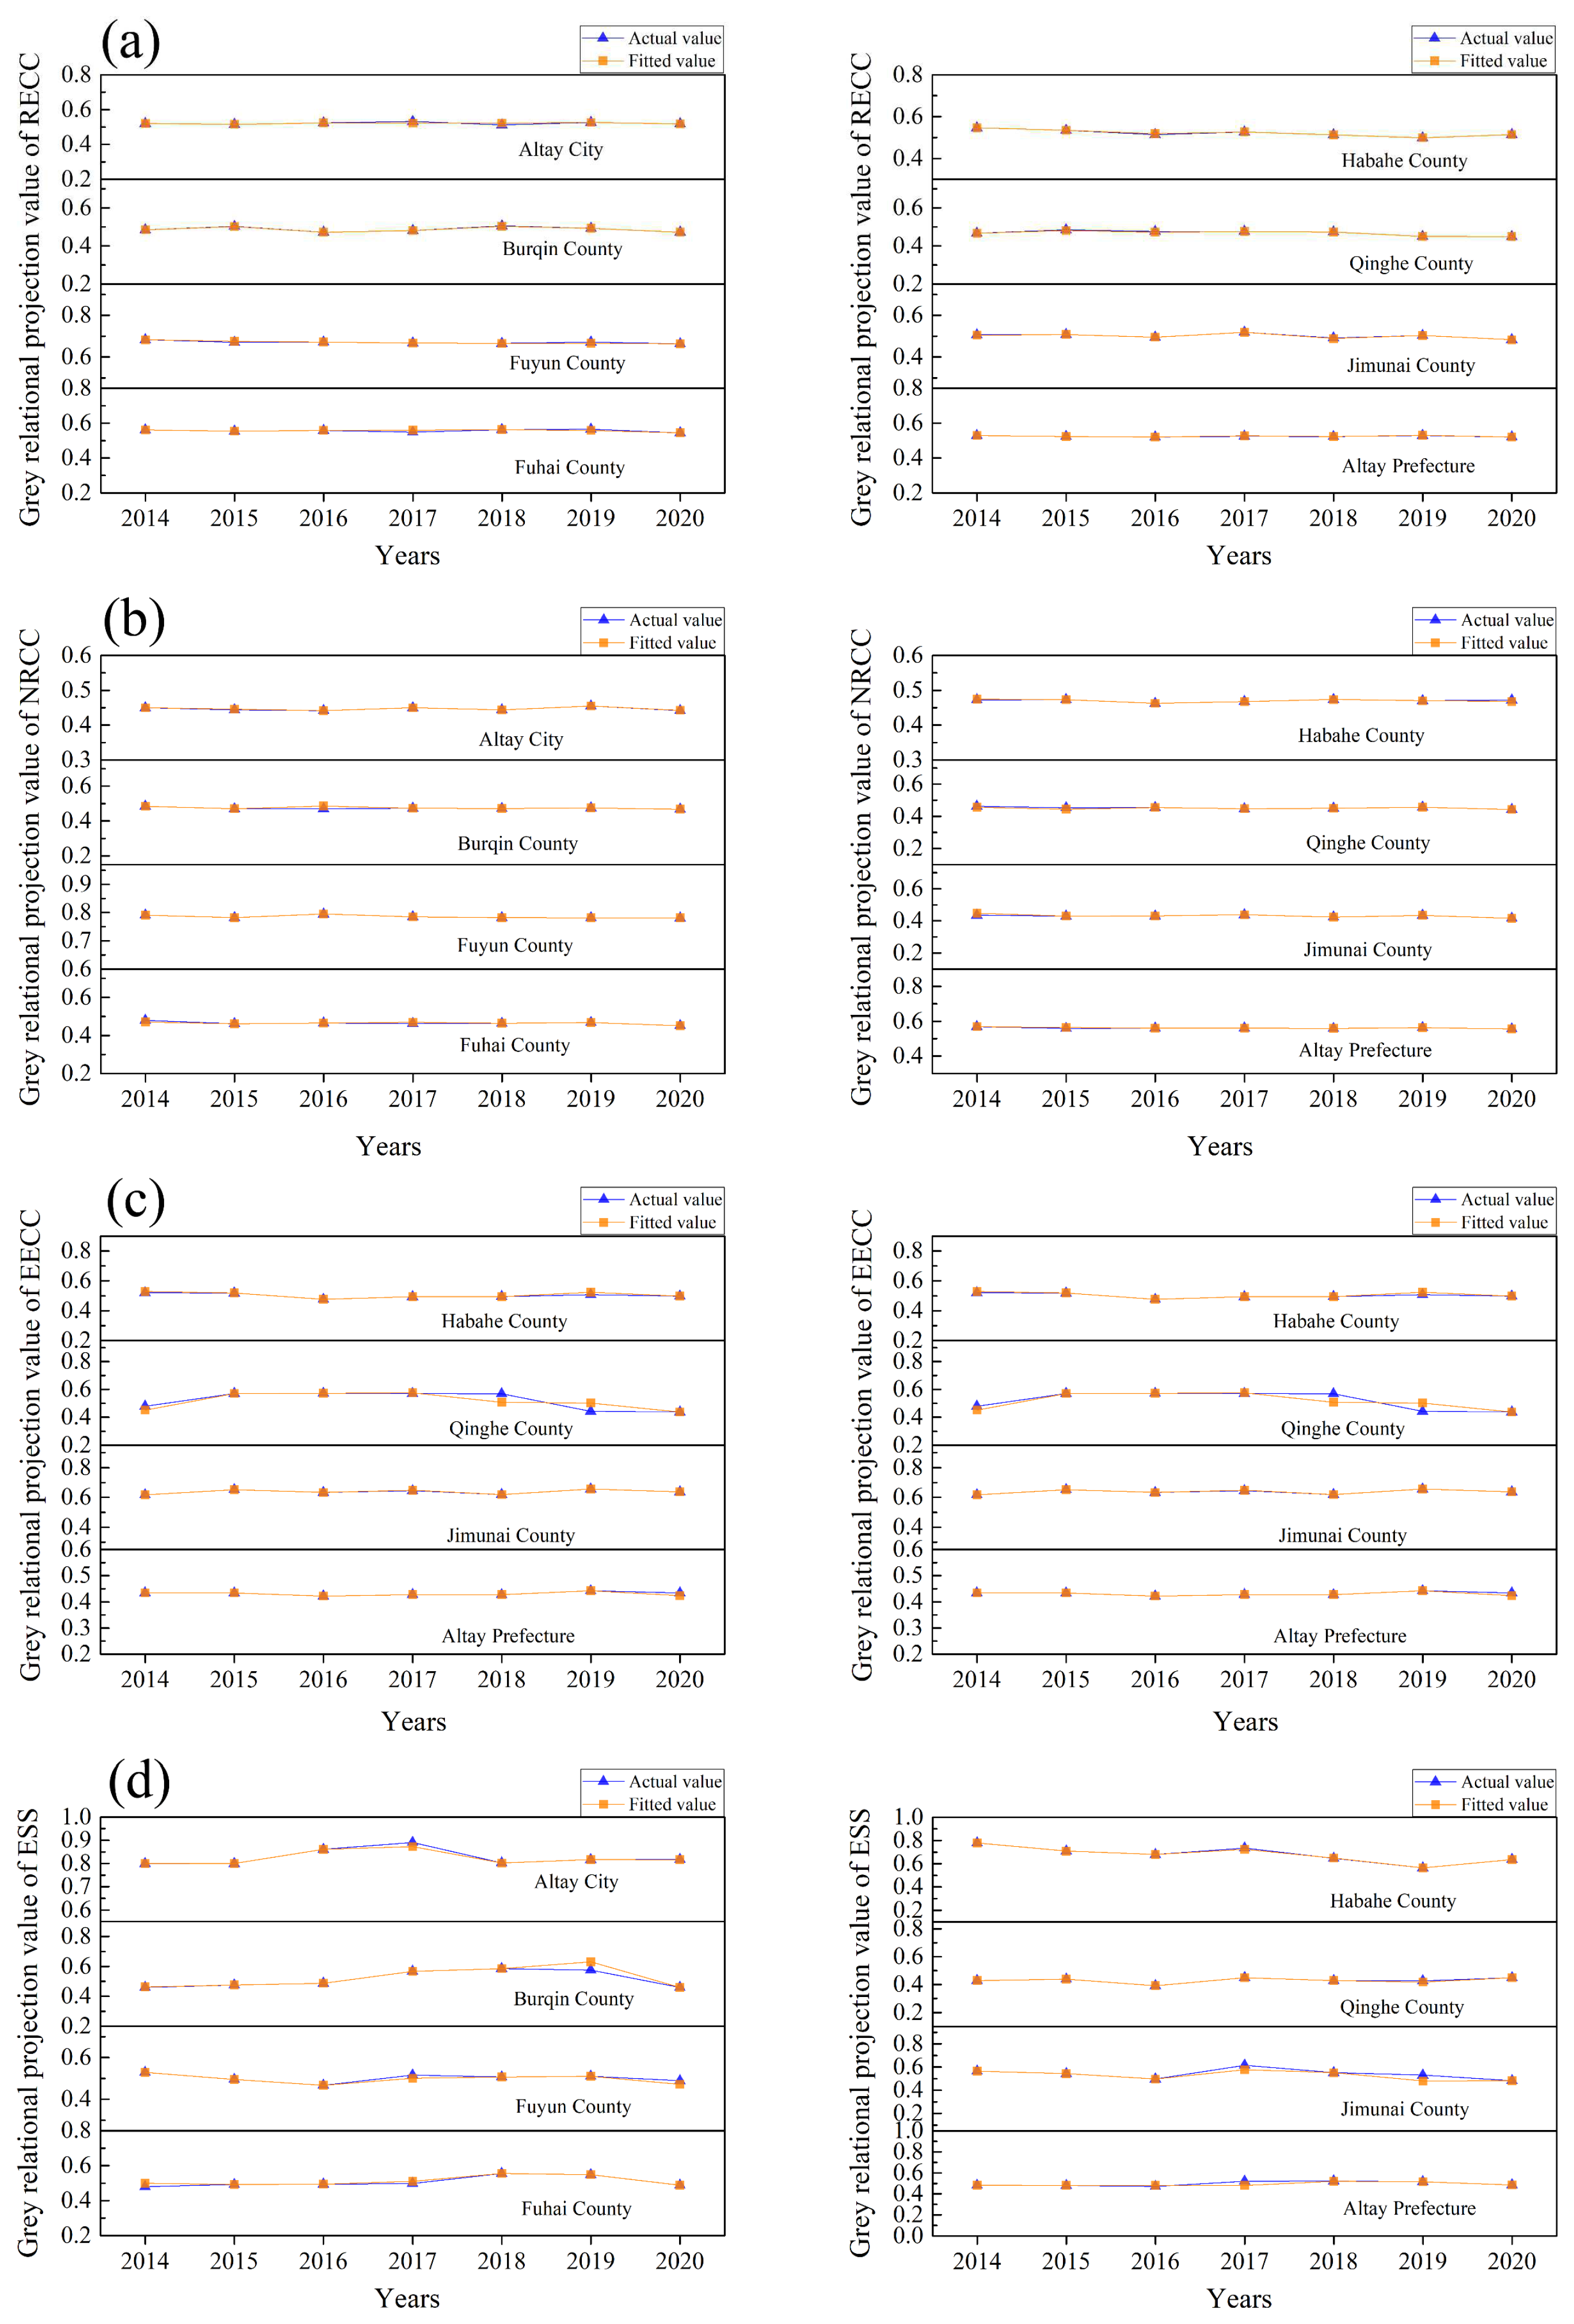
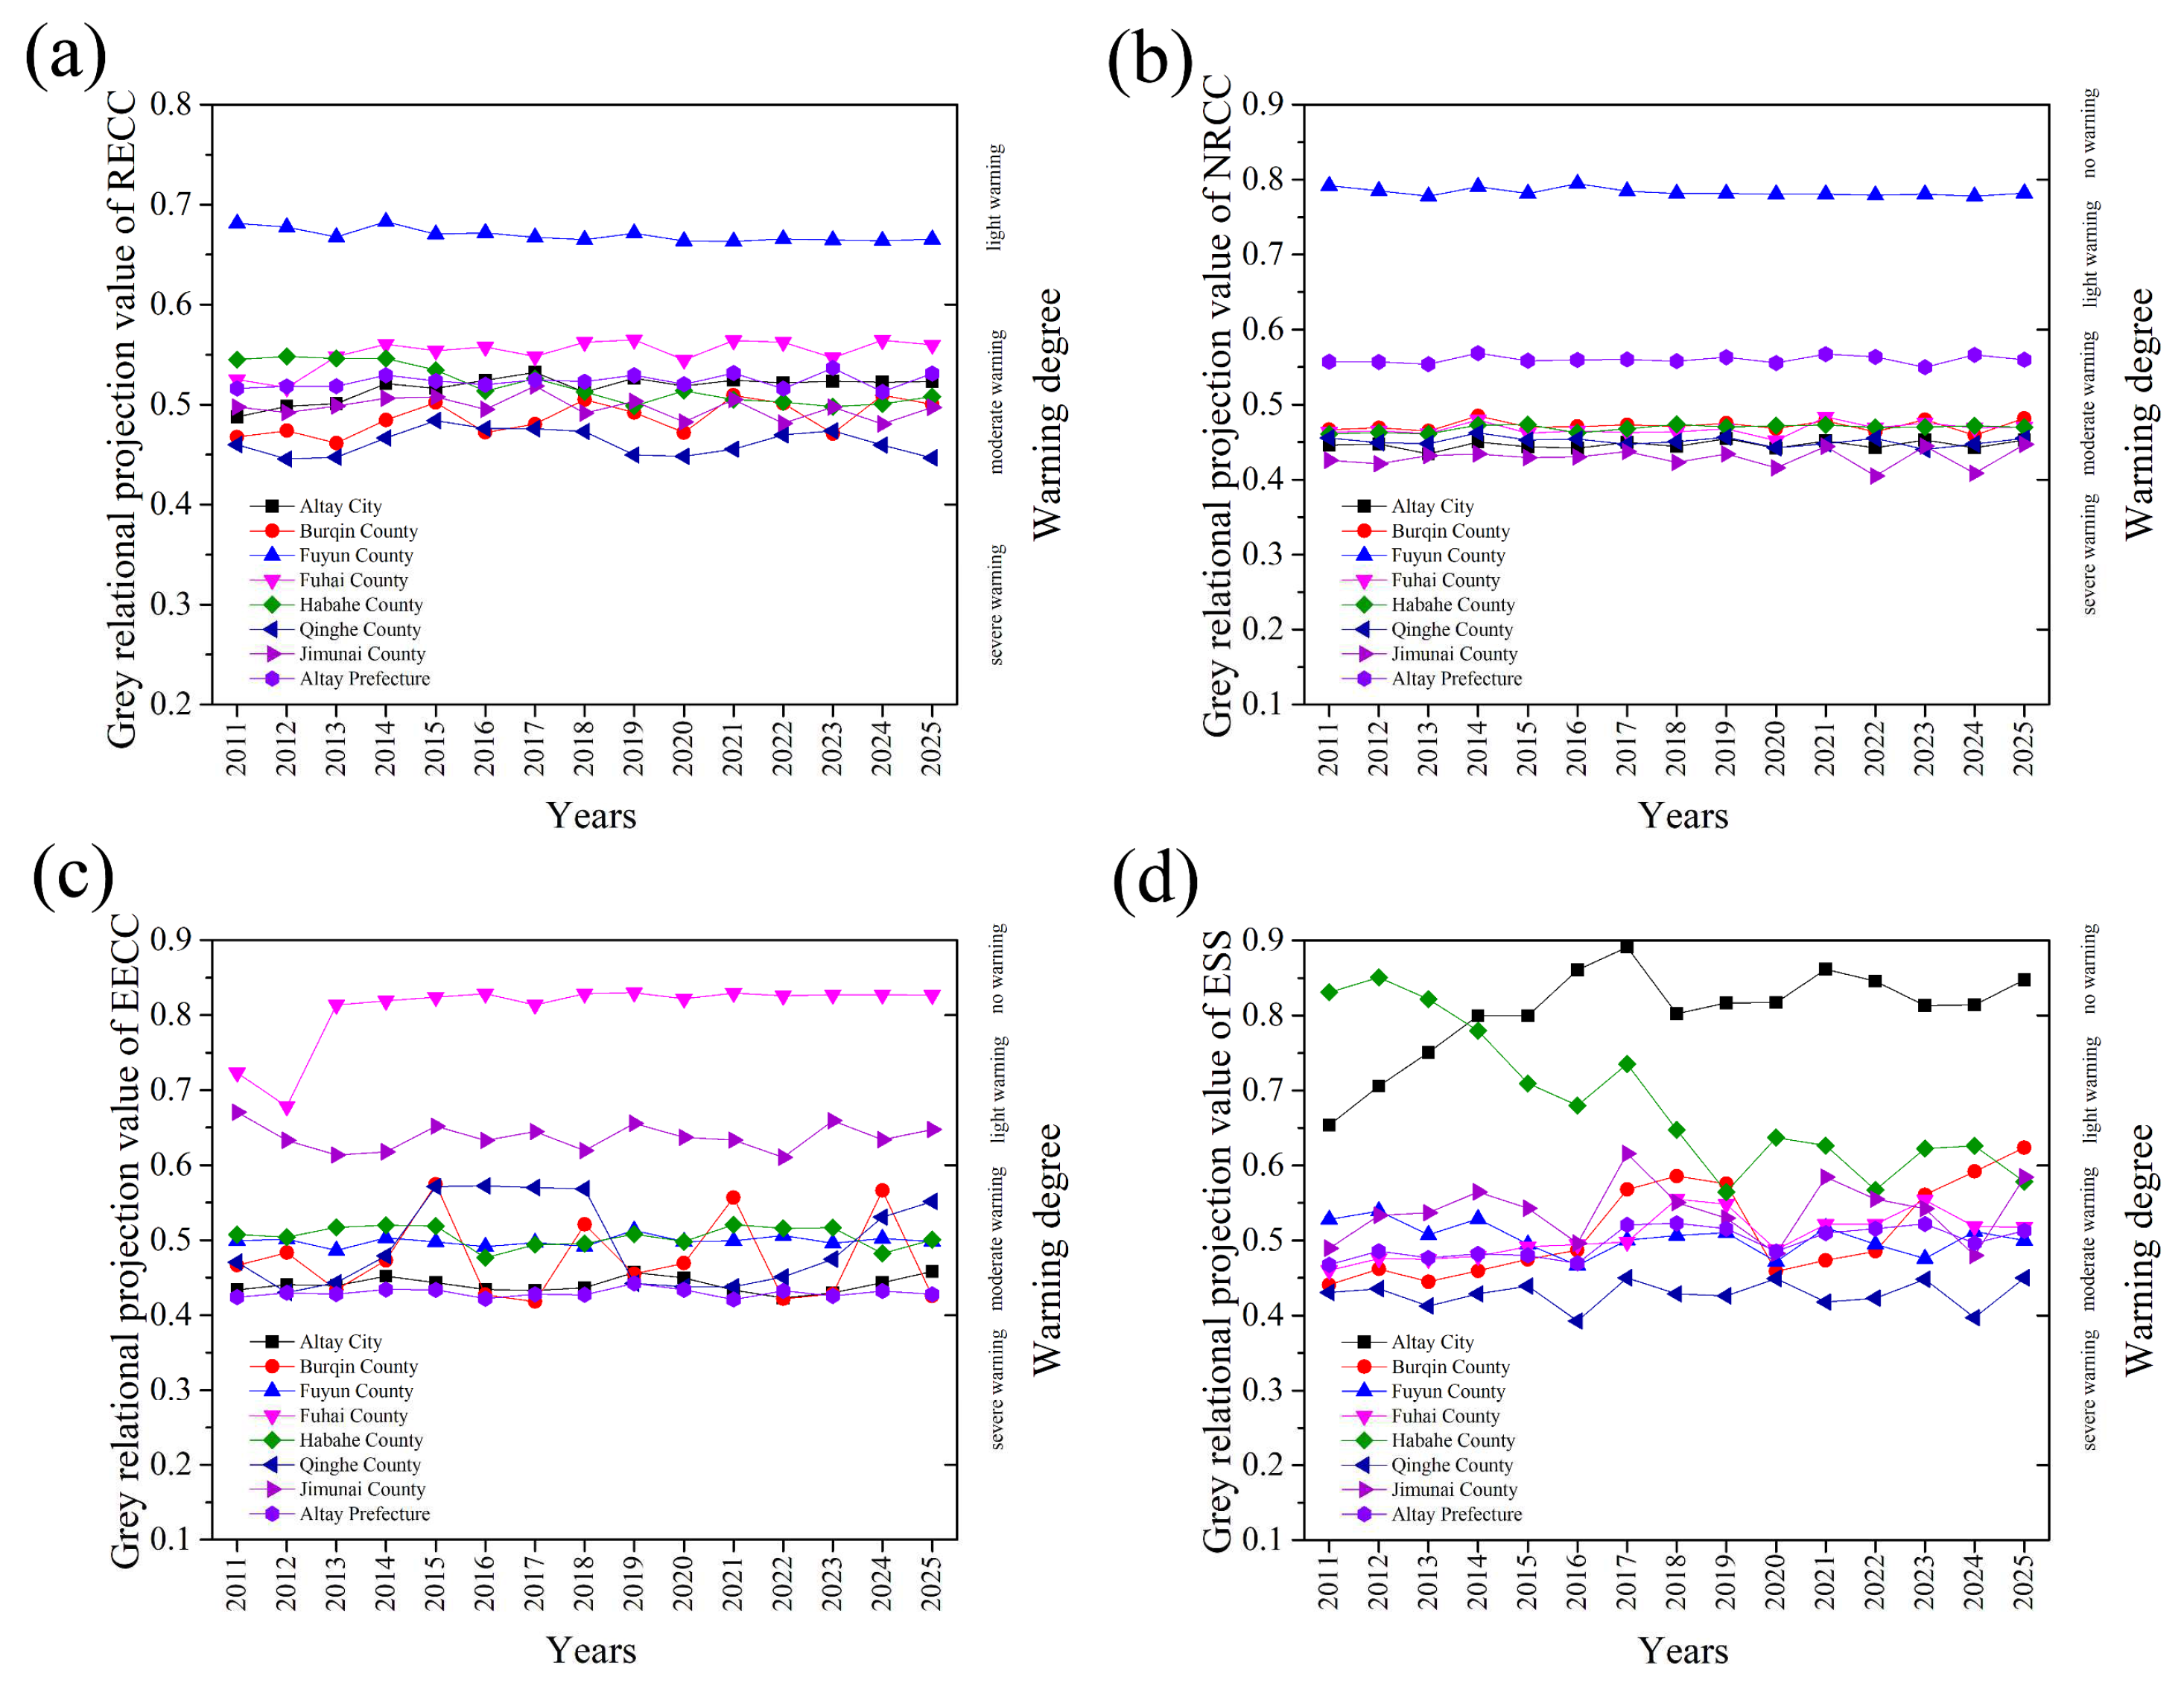
5.1. Prediction Process and Results of Alarm Situation Evolution Trend

The grey relational projection value of the resource and environment carrying capacity and each subsystem of Altay Prefecture and counties and cities from 2011 to 2020 were obtained according to the grey relational projection model, which was used as the basis data for prediction. The time series method was combined with the BP neural network to forecast the evolution trend of the resource and environment carrying capacity and the risk alarm of each subsystem in Altay Prefecture and counties and cities from 2021 to 2025. As a result, the grey relational projection values of the resource and environment carrying capacity and each subsystem of Altay Prefecture and counties and cities from 2011 to 2020 were used as an input sample set, and the grey relational projection values of the resource and environment carrying capacity and each subsystem of Altay Prefecture and counties and cities from 2014 to 2025 were used as expected output values to construct the prediction samples of the resource and environment carrying capacity and alarm situation of each subsystem of Altay Prefecture and counties and cities. The Matlab R2016a software was used to compile the BP neural network program for sample simulation, and to predict the accuracy through the root mean square error test method. According to Table S1, the BP neural network model had a good fitting effect. The maximum root means square error reached 0.0341, and the minimum was only 0.0008, which was beneficial to predict the resource and environment carrying capacity of Altay Prefecture and counties and cities and the evolution trend of the alarm situation of each subsystem more accurately. The specific fitting effect is shown in Figure 2.

5.2. Risk Warning Result Analysis

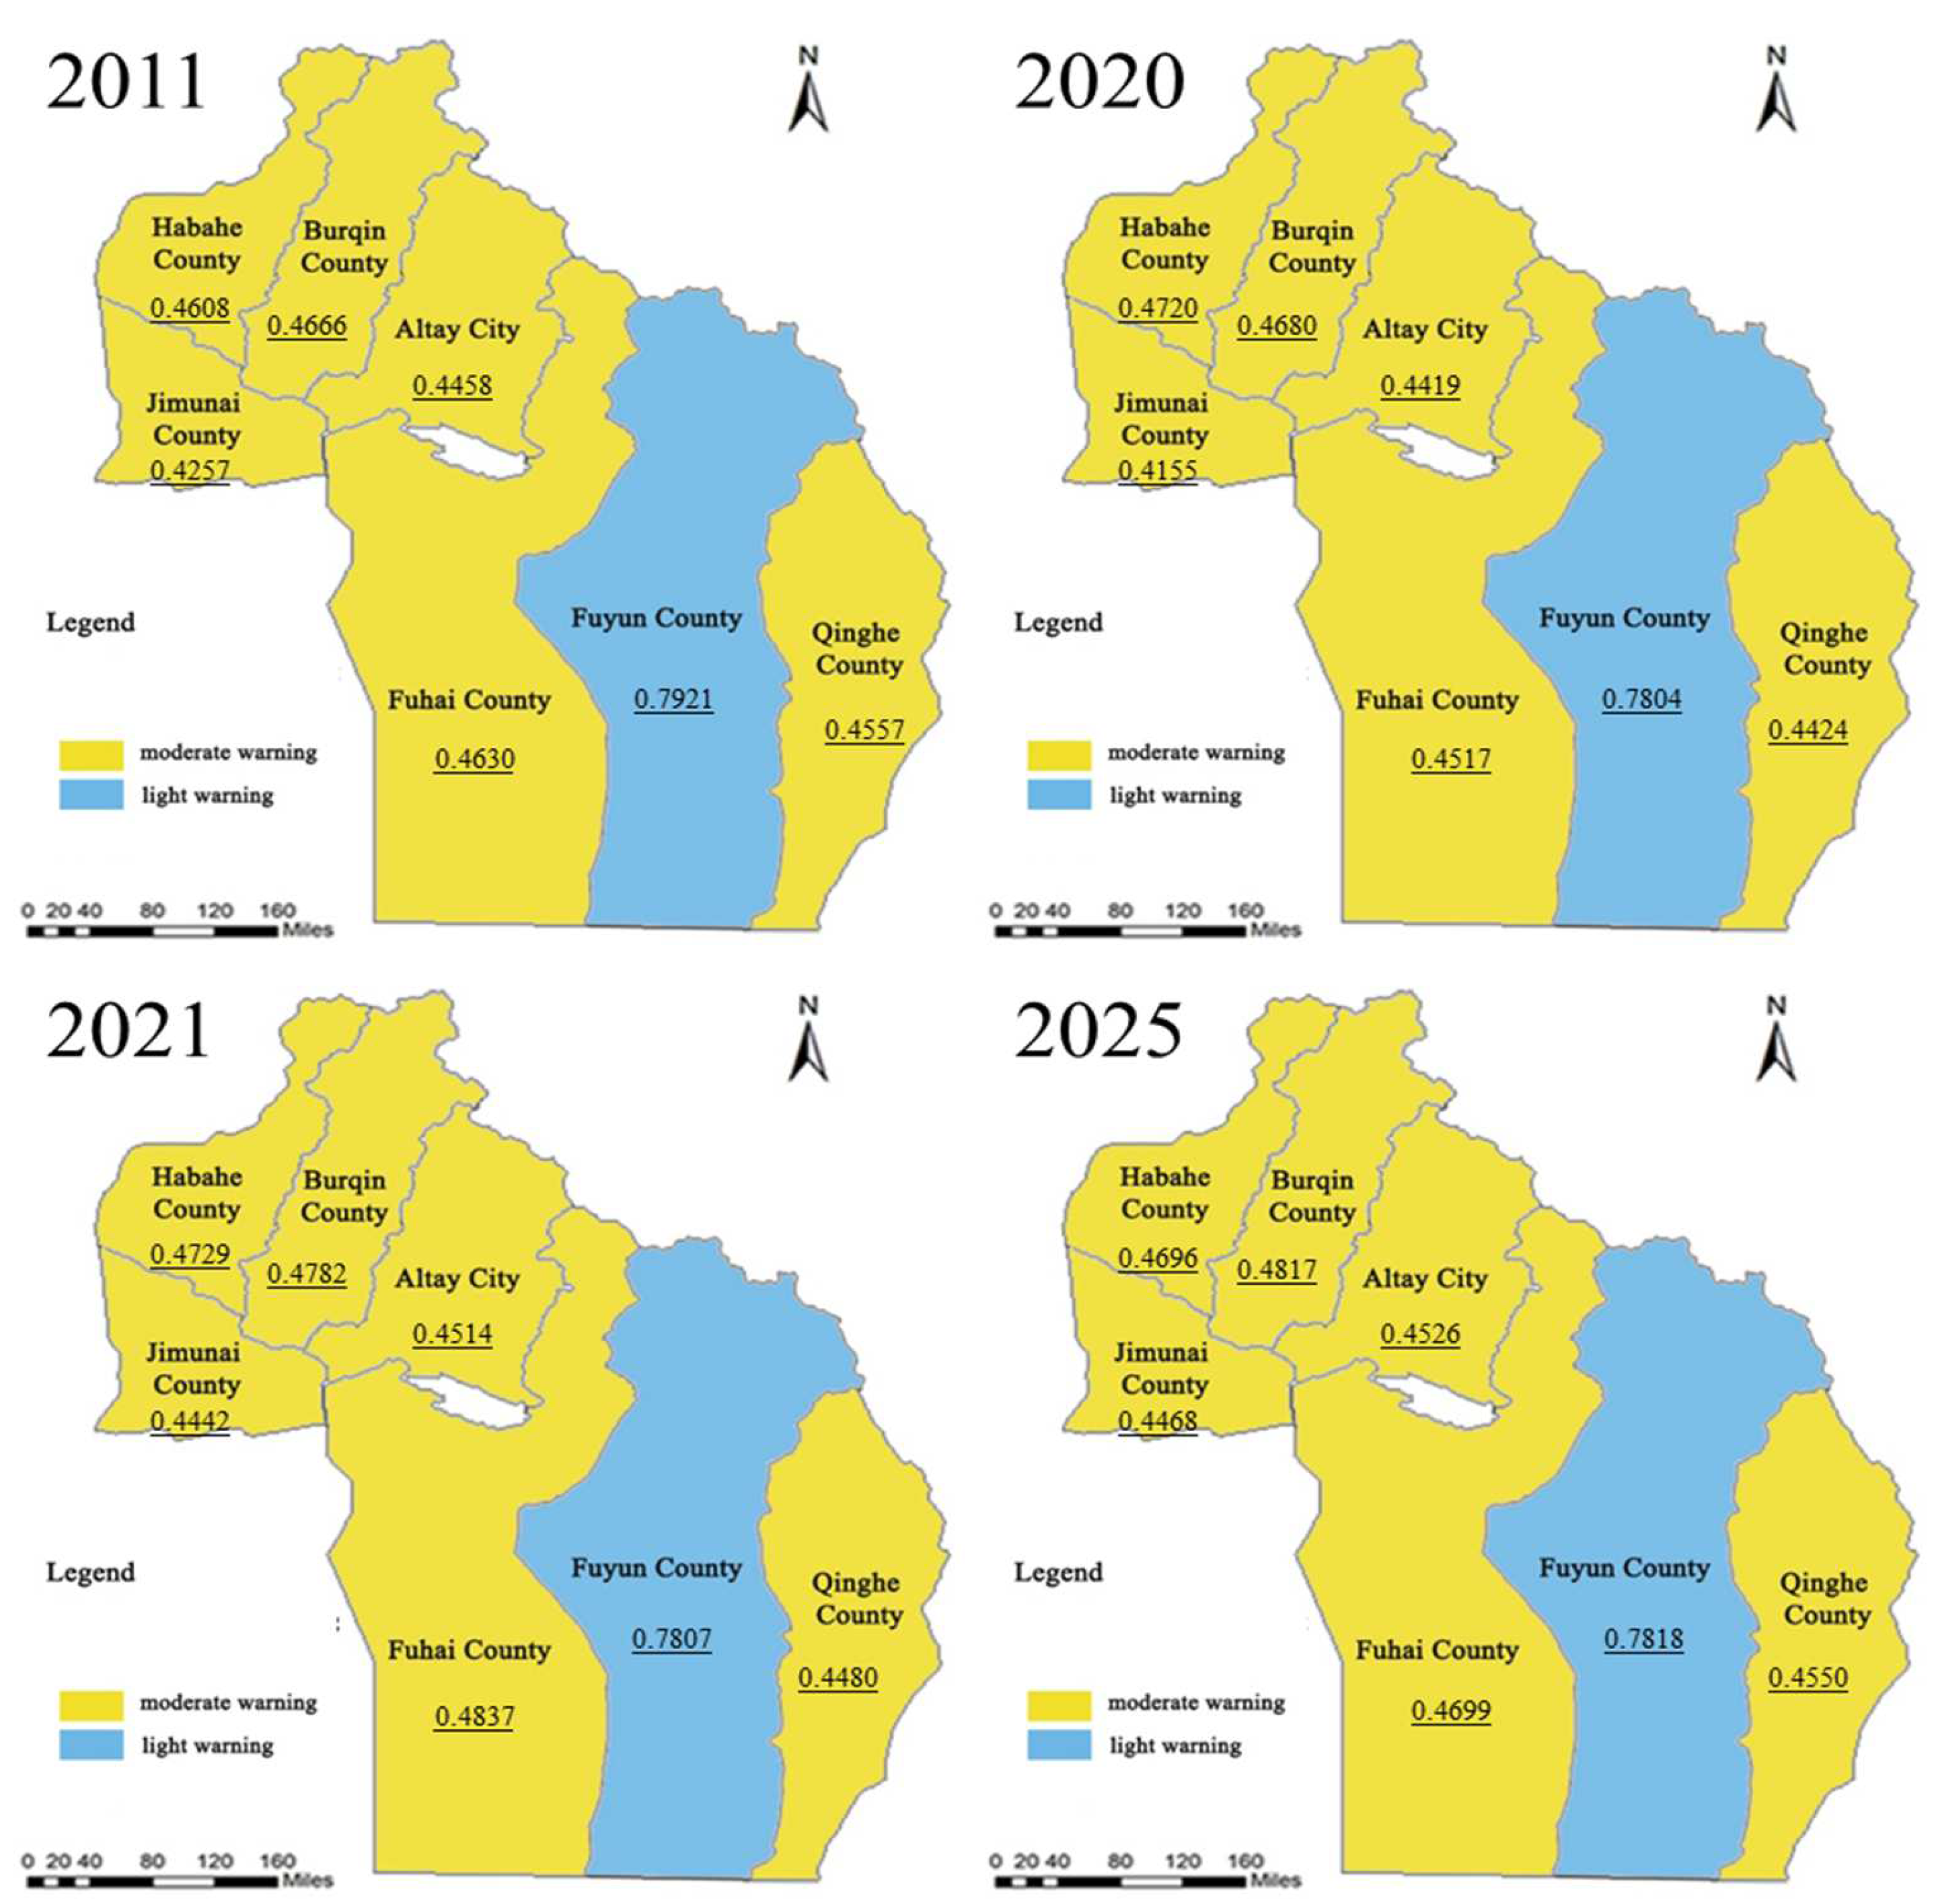
5.2.1. Current Situation and Trend Warning Analysis of Resource and Environment Carrying Capacity (RECC)

On the whole, the grey relational projection value rose from 0.5162 to 0.5204, and the alarming developmental situation of the resource and environment carrying capacity of Altay Prefecture from 2011 to 2020 was relatively flat. It was in a slightly fluctuating state, but the changes were small, and the carrying level was always “moderate warning” and the signal light was “yellow” (Figure 3a and Table S2). This was largely attributed to the following factors: (1) Resources were improperly utilized and managed. Although the Altay Prefecture is rich in resources the utilization rate was low. Unreasonable development, improper utilization of resources, and poor management undoubtedly caused a greater loss of resources and a negative impact on the environment. (2) The ecology and environment had a low self-regulation ability; thus making it difficult to do self-repair in a timely manner after natural disasters and man-made damage. The restoration of the damaged environment was difficult and the effect of repair was relatively slow. (3) Social and economic progress had gradually increased the burden on the environment. (4) The regional industrial structure still needed to be adjusted and optimized since the primary and secondary industries still occupied a large proportion.
From 2011 to 2020, the warning changes in the resource and environment carrying capacity of all counties and cities in Altay Prefecture were inconsistent, with obvious regional differences. The warning conditions of the carrying capacity were alleviated in Altay City, Burqin County, and Fuhai County, while other counties and cities’ resource and environment carrying capacity showed a slight deteriorating trend (Figure 3a and Table S2). The resource and environment carrying capacity of Fuyun County was ahead of the other six counties and cities and became the only city with a high level of resource and environment carrying capacity among all counties and cities in Altay Prefecture. The resource and environment carrying capacity level of Qinghe County was relatively low among all counties all year round, although it had been in the middle level for ten years. Further, the calculation results of the grey relational projection method were visualized using GIS (Figure 4), and it could be seen that the resource and environment carrying capacity in Altay Prefecture presented a spatial pattern of “high in the middle, low in the two poles”. In 2011, except for Fuyun County (0.6813), the resource and environment carrying capacity of the other six counties and cities reached a high level. In 2015, except for Fuyun County (0.6705) and Habahe County (0.5344), the carrying capacity of resources and environment in other counties and cities had improved to varying degrees. Among them, the carrying capacity of Fuhai County showed a more significant change and began to rise steadily in 2012 and reached 0.5483 in 2013, overtaking Habahe County (0.5477). Since then, it has been the city with the highest level of resource and environment carrying capacity, except for Fuyun County. In 2020, except for Altay City, the overall resource and environment carrying capacity of the remaining counties and cities showed a fluctuating downward trend. The main reason was that the urbanization rate had fallen significantly, and the utilization rate of water resources and the comprehensive utilization rate of industrial solid waste in some counties and cities had different degrees of decline.
The development trend of the resource and environment carrying capacity alarm of Altay Prefecture and all counties and cities from 2021 to 2025 are shown in Figure 3a and Table S2. By 2025, the grey relational projection value in Altay Prefecture would rise slightly to 0.5310, and the alarm situation would improve slightly, but the alarm level would not change substantially but remain at “moderate warning” and the signal light would remain at “yellow light”. The alarm situation of Habahe and Qinghe counties are slightly aggravated in comparison to 2020, and their grey relational projection values decreased to 0.5079 and 0.4467, respectively. Among the counties and cities with a slight increase in the grey relational projection value, the impact on the alarm situation was weak, and the alarm level would not produce a substantial change. For example, the resource and environment carrying capacity of Fuyun County continued to be in the “light warning” state, and the signal light was “blue light”. The carrying capacity of other counties and cities also continued to be in the “moderate warning” state, and the signal light was “yellow light”. Among them, Fuhai County had the best alarm situation with a “moderate warning” capacity. The natural resource carrying capacity of Qinghe County was more severe than that of other counties and cities, and always in a state of lowest carrying capacity and highest warning level. The main reason was that the economic and social carrying capacity of Qinghe County was consistently more severe than other counties and cities.
Over the last ten years, the resource and environment carrying capacity in Altay Prefecture did not fundamentally improve, and the alarm situation was not obviously alleviated, which might be due to a number of factors, such as a low soil fertility index, a small total reservoir capacity, low per-capita mineral resource reserves, a low rate of development of water resources, a low rate of development of industrial solid waste, and a low rate of land output.

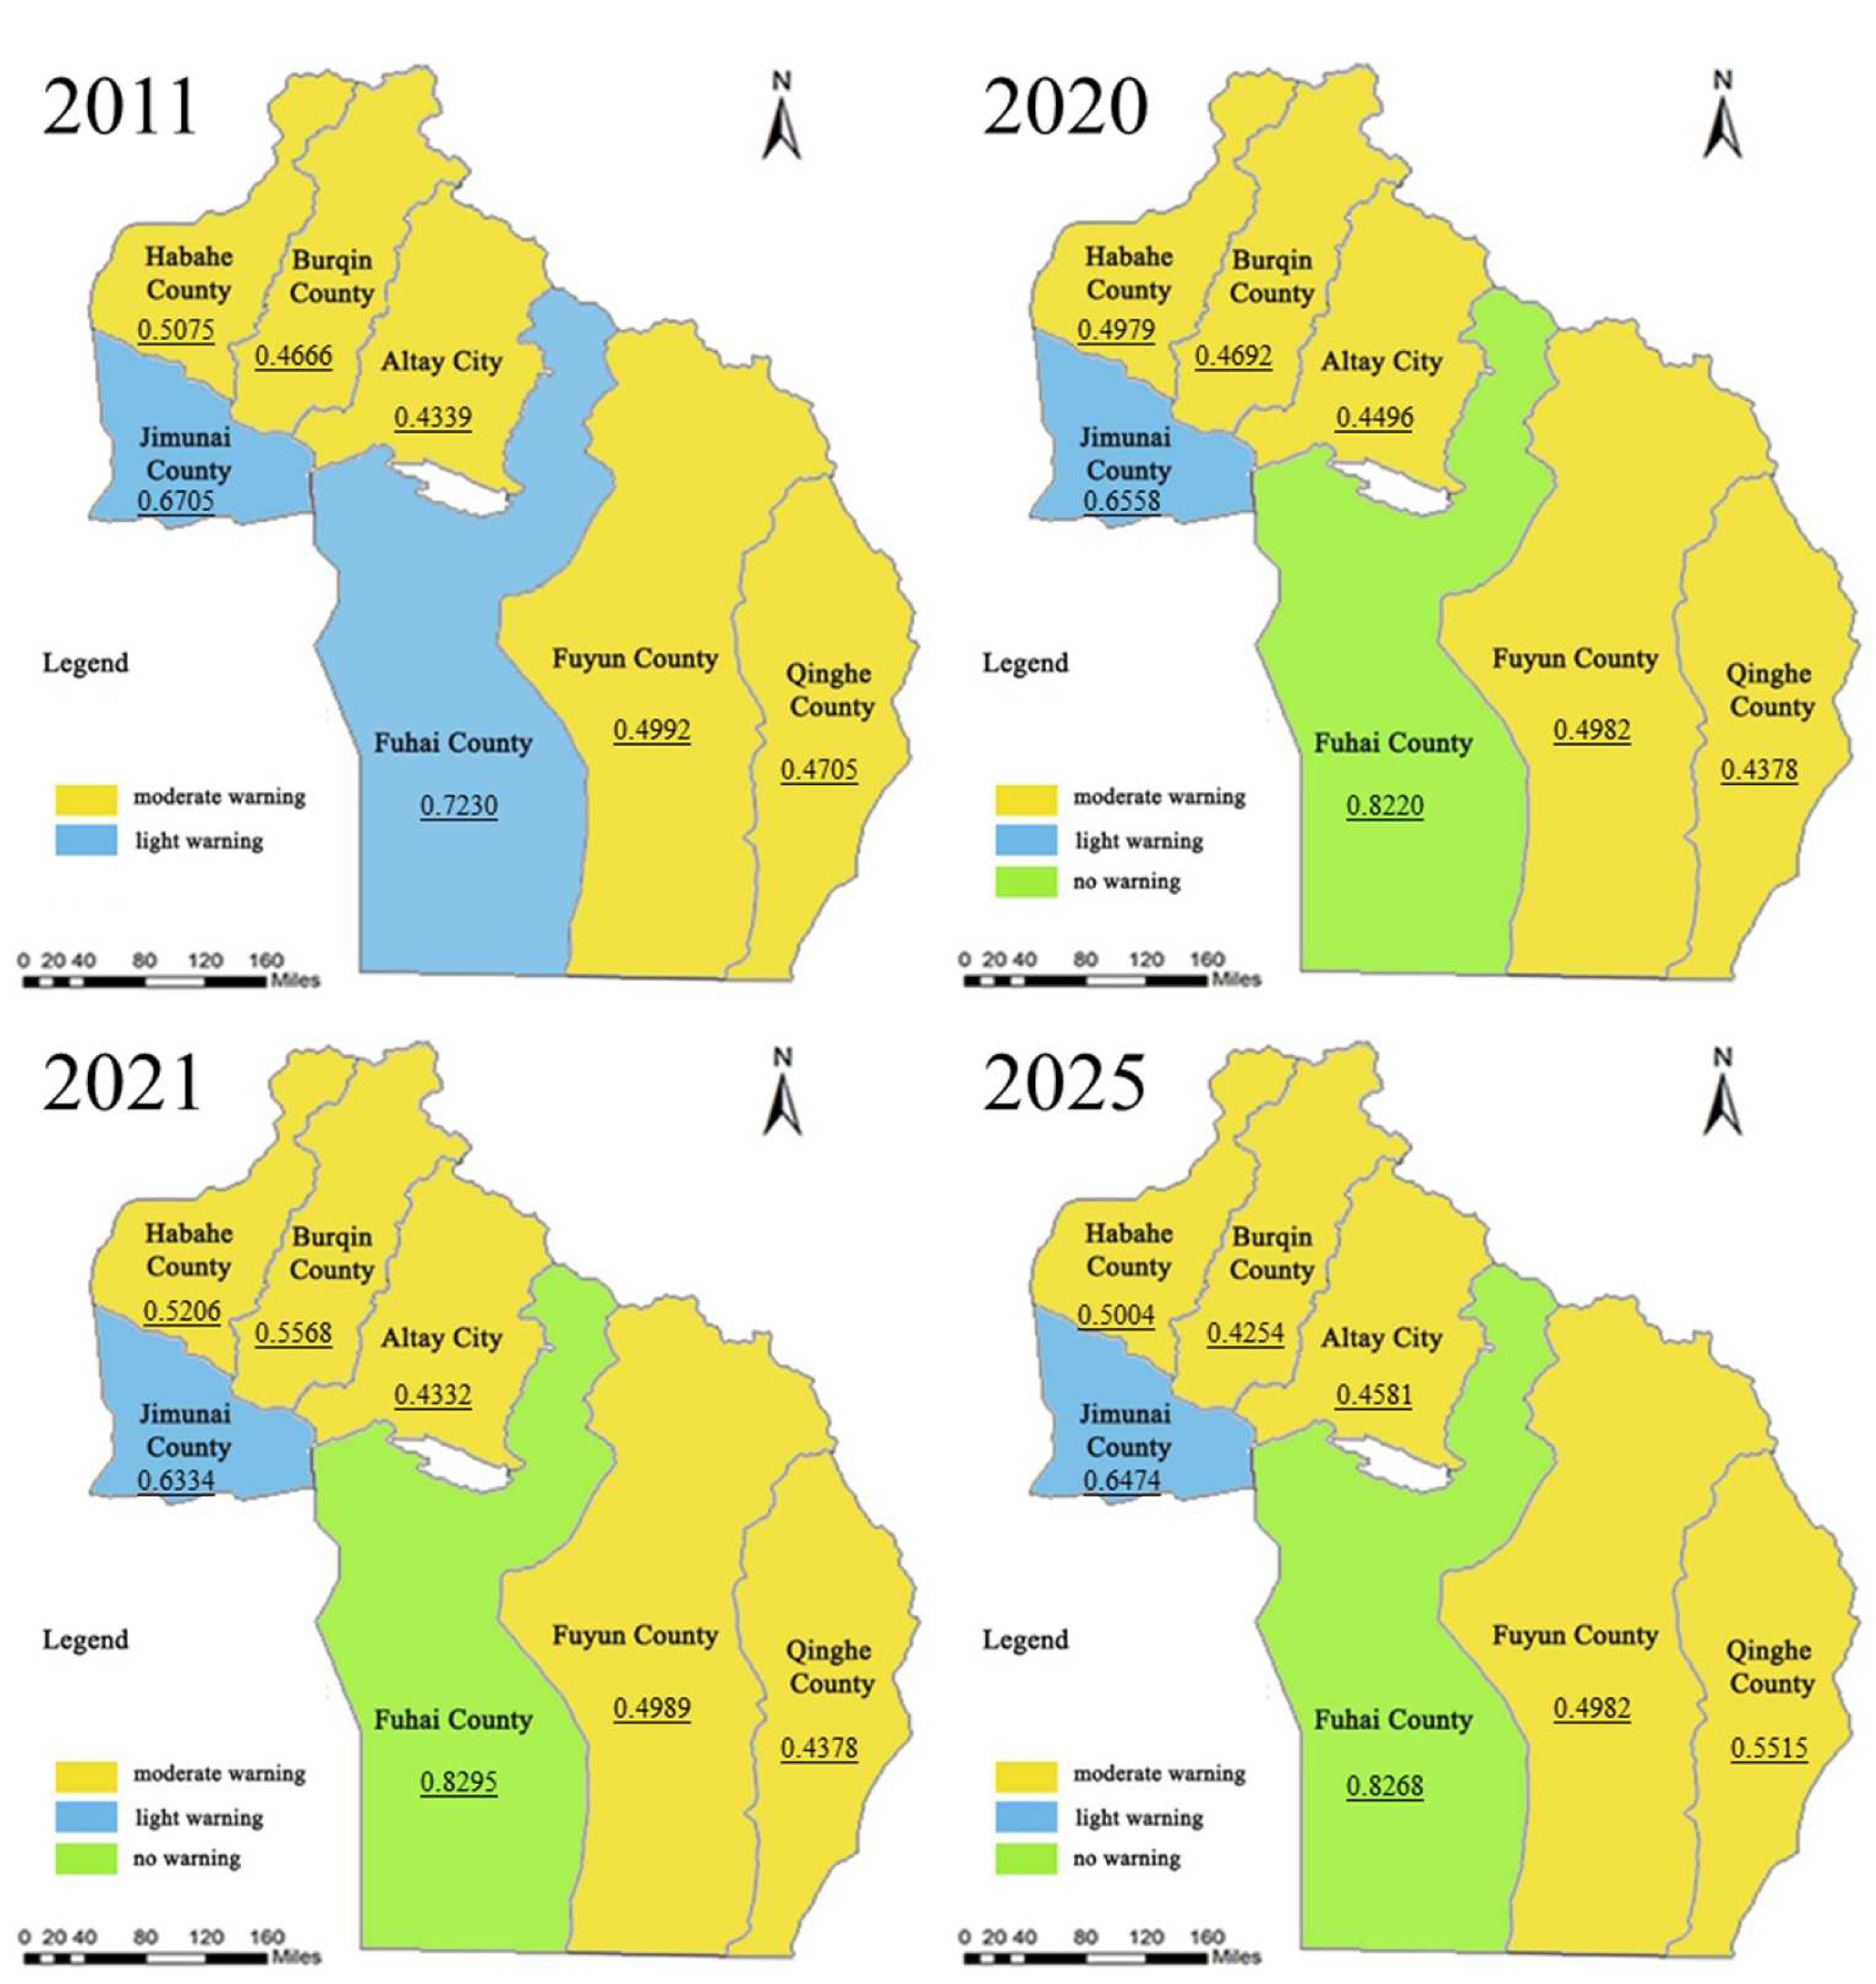
5.2.2. Current Situation and Trend Warning Analysis of Natural Resource Carrying Capacity Subsystem (NRCC)

Overall, the alarm situation of the natural resource carrying capacity in Altay Prefecture was relatively stable, showing a slight improving trend. In 2011–2020, the grey relational projection value of the natural resource carrying capacity in Altay Prefecture slightly decreased from 0.5570 to 0.5554, and the alarm situation showed a fluctuating increase (Figure 3b and Figure S2). While the change was small, the alarm level was maintained at “moderate warning”, and the signal was maintained as “yellow light”. According to the development of this trend, the alarm situation of the natural resource carrying capacity in Altay Prefecture would be moderate to a certain extent in 2021–2025 (Figure 3b and Table S3), and its grey relational projection value would rise slightly to 0.5598. However, the alarming degree would still be in the “moderate warning”; additionally, the signal light would still be “yellow light”. The developing situation of the natural resource carrying capacity was not optimistic.
From 2011 to 2020, the grey relational projection value of the natural resource carrying capacity of counties and cities in Altay Prefecture decreased slightly, and the alarm situation fluctuated (Figure 3b). Among the counties and cities, the grey relational projection value of Fuyun County decreased from 0.7921 to 0.7815, but the alarm level was maintained at “light warning”, and the signal light was “blue light”. Other counties and cities showed “moderate warning” and “yellow light” signals.
According to this trend, in 2021–2025, the natural resource carrying capacity of the counties and cities in the Altay Prefecture, except for Habahe County, would slightly improve (Figure 3b). The alarm situation of the carrying capacity of Habahe County had a slight aggravation trend, and its grey relational projection value would decrease from 0.4720 in 2020 to 0.4696 in 2025. The alarm situation of natural resource carrying capacity in the rest of the counties and cities would improve in comparison with that in 2020, but the increase in the grey relational projection value was not significant, and the alarming degree remained unchanged. Among them, Fuyun County continued to maintain the alarm level of “light warning” and the signal light of “blue light”. Other counties and cities had a small gap in the natural resource carrying capacity, and the alarm level was still in the “moderate warning”, and the signal light was still “yellow light”. In addition, the alarm of natural resource carrying capacity of Jimunai County showed a “W” pattern change trend in 2021–2025; it was the county and city with the most violent and severe alarm situation in the region and needed much attention.
The spatial pattern of the natural resource carrying capacity alarm in Altay Prefecture was consistent with the resource and environment carrying capacity, showing a “low in the middle and high on both sides” (Figure 5). Due to its absolute advantage in mineral resources, Fuyun County had the lightest degree of natural resource carrying capacity alarm, which was “light warning”, whereas the other counties and cities had relatively low natural resource carrying capacity and relatively heavy alarms, which were all in the “moderate warning”.

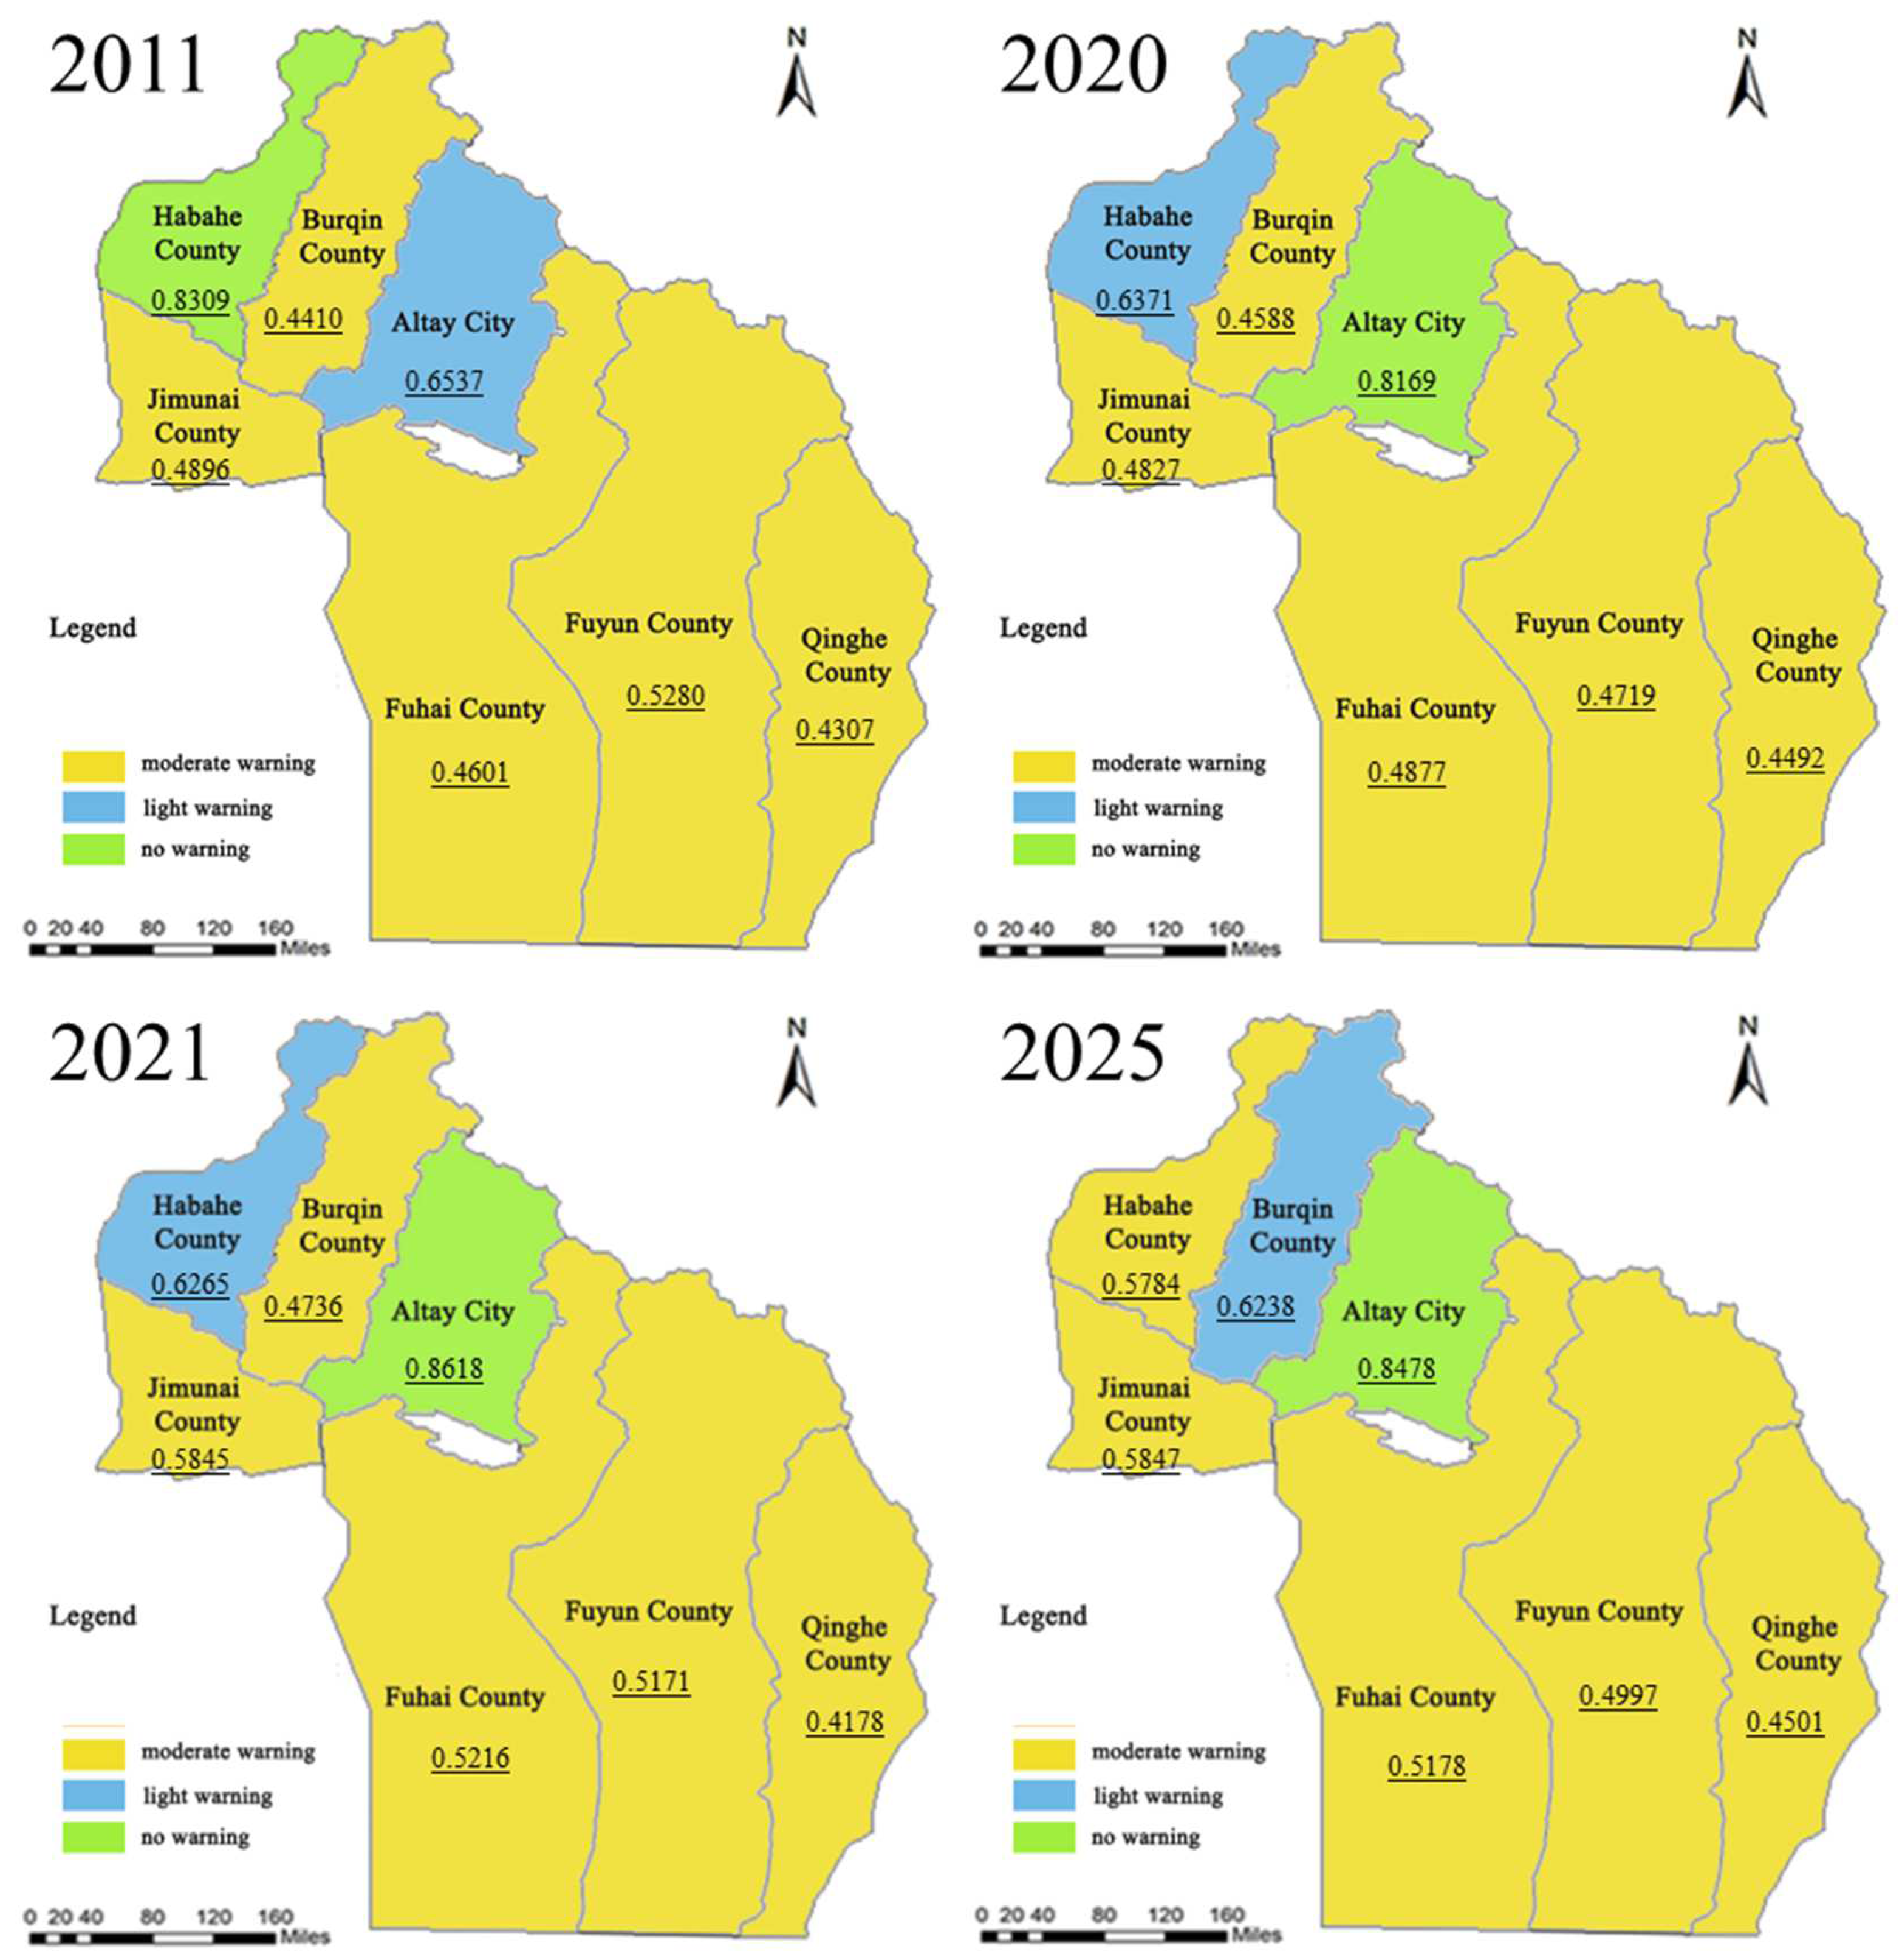
5.2.3. Current Situation and Trend Warning Analysis of Eco-Environment Carrying Capacity Subsystem (EECC)

From 2011 to 2020, the alarm of eco-environment carrying capacity of Altay Prefecture had been slightly alleviated, and its grey relational projection value had slightly increased from 0.4240 to 0.4337. The alarm level had remained unchanged and was always in “moderate warning”, while the signal light was “yellow light”. From 2011 to 2020, the changing trend of alarm of eco-environment carrying capacity in the counties and cities of Altay Prefecture was different.
The alarm situation in Habahe County, Qinghe County, and Jimunai County had slightly deteriorated (Figure 3c and Table S4). Fuhai County had the highest level of eco-environment carrying capacity development; the grey correlation projection value had an upward trend from 0.7230 to 0.8220. The alarming degree of Fuhai County had been adjusted downward from “light warning” to “no warning”, and the signal light had changed from “blue light” to “green light”. Jimunai County was the second largest city in developing eco-environment carrying capacity. However, the alarm situation intensified in 2011–2020, with its grey correlation projection value dropping from 0.6705 to 0.6369. The alarming degree remained at “light warning” and the signal light was at “blue light” status. The eco-environment carrying capacity of the remaining counties and cities was in the state of “moderate warning” and “yellow light”.
From 2021 to 2025, the eco-environment carrying capacity of the Altay area would not be improved fundamentally, and the grey relational projection value showed a fluctuating trend (Figure 3c and Table S4), and would be 0.4279 in 2025. However, the change was limited, the degree of alarm continued to be “moderate warning”, and the signal light continued to be “yellow light”. From 2021 to 2025, the warning of eco-environment carrying capacity of all counties and cities in Altay Prefecture except Burqin County would be controlled, as the grey relational projection value had rebounded (Figure 3c and Table S4). Among them, the grey relational projection value of Fuhai County increased to 0.8268, the alarm level continued to be “no warning”, and the signal was “green light”. The grey relational projection value of Jimunai County increased to 0.6474, the alarming degree remained in the state of “light warning”, and the signal light was “blue light”.
The increase in grey relational projection values in the remaining counties and cities were not enough to change the alarm degree, so the alarm degree of eco-environment carrying capacity was still maintained at “moderate warning”, and the signal light was maintained at “yellow light”. Qinghe County had the most significant improvement in the eco-environment carrying capacity among the counties and cities. Although 2020 was a relatively severe year for carrying capacity (0.4378), the grey correlation projection value was expected to rise from 0.4378 to 0.5515 from 2021 to 2025, gradually becoming the county with the highest level of carrying capacity development and the lowest level of warning in the counties and cities with “moderate warning” of carrying capacity. Burqin County had the most dramatic change in the warning situation of the eco-environment carrying capacity, which almost presented a N-shaped change. The warning situation of the eco-environment carrying capacity was relatively unstable, mainly because its water resources development and utilization rate was not high, and the comprehensive utilization rate of industrial solid waste changed irregularly. In contrast, although the grey relational projection value of the eco-environment carrying capacity of Altay City would increase from 0.4496 to 0.4581 in 2025, it also was a county with a relatively severe alarm situation, which was closely related to the relatively large wastewater discharge per unit of industrial added value and the low comprehensive utilization rate of industrial solid waste.
In general, the warning situation of the eco-environment carrying capacity of all counties and cities in Altay Prefecture showed the trend that the western region was superior to the eastern region (Figure 6). The eco-environment carrying capacity of Fuhai County and Jimunai County was superior to that of other counties and cities, and the warning situation was lighter than that of other counties and cities.

5.2.4. Current Situation and Trend Warning Analysis of Economic and Social Support Subsystem (ESS)

From 2011 to 2020, there was a slight improvement in the alarm situation of economic and social support in Altay Prefecture (Figure 3d and Table S5). The grey relational projection value increased from 0.4677 to 0.4852, and the alarming degree remained in the “moderate warning” with the signal light as “yellow light”. From 2011 to 2020, the economic and social support force of each county and city in the Altay Prefecture changed differently (Figure 3d and Table S5). Among them, the alarm levels of economic and social support of Fuyun County, Habahe County, and Jimunai County increased, although the alarm levels of Fuyun County, Habahe County, and Jimunai County were still in the “moderate warning” state. The grey incidence projection value decreased, and in Jimunai County decreased from 0.5648 to 0.4827.
The economic and social support system of Altay City, Burqin County, Fuhai County, and Qinghe County improved. Burqin County, Fuhai County, and Qinghe County still maintained the status of “moderate warning” and “yellow light” (Figure 3d and Table S5). The economic and social support of Altay City was in a good development trend. The grey relational projection value of the situation significantly increased from 0.6537 to 0.8162. The degree of alarm accordingly decreased from “light warning” to “no warning”, and the signal light changed from “blue light” to “green light”. The extent of the change in alarm degree in Habahe County was the most significant, with its grey relational projection value dropping from 0.8309 to 0.6371 and the alarm level deteriorating from “no warning” to “light warning”. The signal light was adjusted from “green light” to “blue light”. The alarming degree of the economic and social support system in Altay City, Burqin County, Fuhai County, and Qinghe County improved, among which Burqin County, Fuhai County, and Qinghe County still maintained the status of “moderate warning” and “yellow light” signal. The economic and social support of Altay City was in a good developmental trend. The grey relational projection value of the alarm situation increased significantly from 0.6537 to 0.8162. The corresponding alarm degree changed from “light warning” down to “no warning”, and the signal light changed from “blue light” to “green light”.
According to this developmental trend from 2021 to 2025, the economic and social support of the Altay Prefecture was expected to show a small improving trend (Figure 3d and Table S5). By 2025, its grey relational projection value would fluctuate to 0.5128, but the growth rate was not large. The warning degree would continue to be “moderate warning”, and the signal light would be “yellow light”. From 2021 to 2025, the economic and social support of all counties and cities in Altay Prefecture would fluctuate significantly, but, except for Habahe County, the situation of other counties and cities would be improved to a certain extent (Figure 3d and Table S5). Among them, the grey relational projection value of Habahe County fluctuated from 0.6371 in 2020 to 0.5784 in 2025. The warning degree was correspondingly raised from “light warning” to “medium warning”. The signal light was changed from “blue light” to “yellow light”, mainly because its erosion management effectiveness was sometimes good and sometimes bad.
The economic and social support of Burqin County had improved significantly, and its grey relational projection value was expected to climb from 0.4588 to 0.6238 and surpass that of Habahe County in 2025, with the corresponding downward adjustment from “moderate warning” to “light warning”, and a signal light change from “yellow light” to “blue light”. The other counties and cities had limited downward adjustment of their support force, with the alarm level remaining at “medium warning” and the signal light remaining at “yellow light”. In contrast, Qinghe County had long been the city with the highest economic and social support level in the region, mainly due to its slow urbanization process, relatively delayed economic development, low GDP per capita, and lower-than-average quality of life for residents. The signal light was “yellow light”.
Spatially, the economic and social support of all counties and cities in Altay Prefecture was generally higher in the south than in the north (Figure 7), showing a pattern of “low in the north and high in the south”. In the northern region, Altai City and Burqin County had obvious advantages in tourism, and their industrial transformation and industrial structure adjustment had been effective, leading to an improved socio-economic development level and support capacity.

6. Conclusions

In this study, the grey relational projection method was used to analyze the alarm situation of the resource and environment carrying capacity of Altay Prefecture from 2011 to 2020, and the BP neural network was used to predict the evolution trend of the alarm situation of the resource and environment carrying capacity of Altay Prefecture from 2021 to 2025. By calculating the weight value of the evaluation index system, it demonstrated that the natural resource carrying capacity subsystem was the main system that affected the development of the resource and environment carrying capacity in Altay Prefecture, and its impact was greater than that of the eco-environment carrying capacity and the economic and social support capacity. From 2011 to 2020, the alarm of the resource and environment carrying capacity of Altay Prefecture showed a fluctuating downward trend, but the magnitude was limited, and the alarm level was still in the “moderate warning”. From 2011 to 2020, the resource and environment carrying capacity of all counties and cities in Altay Prefecture showed a spatial pattern of “weak in the middle, strong in the two poles” in the region. The counties and cities whose carrying capacity had been slightly alleviated include Altay City, Burqin County, and Fuhai County, while the carrying capacity of the resources and environment in other counties and cities was slightly enhanced. Among all counties and cities in the region, only the resource and environment carrying capacity in Fuyun County was in the “light warning” state, and the signal light was in the “blue light” state. The carrying capacity of other counties and cities was in the “moderate warning” state, and the signal light was in the “yellow light” state.
From 2021 to 2025, the alarm situation of the resource and environment carrying capacity of Altay Prefecture showed a fluctuating decreasing trend compared to that in 2020. By 2025, its grey relational projection value increased slightly to 0.5310. However, the alarm level did not change substantially, but remained at “moderate warning”, and the signal light remained at “yellow light”. From 2021 to 2025, the warning of the resource and environment carrying capacity of all counties and cities in Altay Prefecture showed a trend of fluctuation and decline compared to that in 2020. Only the warning of Habahe County and Qinghe County was slightly heavier than that of 2020, and the grey incidence projection value decreased to 0.5079 and 0.4467, respectively. Among the counties and cities with a small increase in the grey relational projection value, the impact on the alarm situation was weak, and the alarm level did not change substantially. The resource and environment carrying capacity of Fuyun County continued to be in the “light alarm” state, and the signal light was “blue light” from 2021 to 2025. The carrying capacity of other counties and cities also remained at “moderate warning”, and the signal light was “yellow light” from 2021 to 2025. Fuhai County had the best alarm situation in the all counties and cities with “moderate warning”. Qinghe County had been in the state of the lowest carrying capacity and the highest degree of alarm in the all counties and cities, mainly because its economic and social carrying capacity was more severe than that of the other counties and cities all the year round.
In the face of the severe situation of tighter resource and environmental constraints and ecosystem degradation, deepening the system and mechanism of ecological civilization and promoting the improvement of the resource and environment carrying capacity should become a focus for the development of Altay Prefecture, Xinjiang, China, in the near future.

Supplementary Materials

The following supporting information can be downloaded at: https://www.mdpi.com/article/10.3390/su15129825/s1, Figure S1. Structure of BP neural network model; Figure S2. The histogram of natural resource carrying capacity risk in Altay Prefecture and counties and cities from 2011 to 2025; Table S1. Comparison of fitting errors of BP neural network in Altay Prefecture, counties and cities; Table S2. Risk warning signal status of resource and environment carrying capacity of Altay Prefecture and counties and cities from 2011 to 2025; Table S3. Status of risk warning signal lights of natural resources carrying capacity in Altay from 2011 to 2025; Table S4. Status of risk warning signal lights of ecological environment carrying capacity in Altay region from 2011 to 2025; Table S5. Status of early warning signals of economic and social support in Altay region from 2011 to 2025.

Author Contributions

S.L. and X.W.: Conceptualization, Methodology, Investigation, Data curation, Writing—original draft. M.L.: Conceptualization, Investigation, Project administration, Supervision, Validation, Writing—review and editing. X.F.: Conceptualization, Supervision, Formal analysis, Writing—review and editing. M.X.: Conceptualization, Supervision, Software, Formal analysis. J.Z.: Conceptualization, Supervision, Formal analysis, Writing—review and editing. P.W.: Project administration, Visualization, Methodology, Funding acquisition. Y.M.: Visualization, Formal analysis. Z.D.: Formal analysis, Visualization. J.L.: Software, Visualization. L.C. and Z.L.: Writing—review and editing. All authors have read and agreed to the published version of the manuscript.

Funding

This research was financially supported by the Hunan Province High tech Industry Science and Technology Innovation Leading Plan Project (Grant No. 2020SK2039), and the Project commissioned by the Altay Regional Administration in Xinjiang.

Conflicts of Interest

The authors declare no conflict of interest.

References

  1. Nguyen, K.-A.; Liou, Y.-A. Global mapping of eco-environmental vulnerability from human and nature disturbances. Sci. Total Environ. 2019, 664, 995–1004. [Google Scholar] [CrossRef] [PubMed]
  2. Hu, J.; Huang, Y.; Du, J. The impact of urban development intensity on ecological carrying capacity: A case study of ecologically fragile areas. Int. J. Environ. Res. Public Health 2021, 18, 7094. [Google Scholar] [CrossRef] [PubMed]
  3. Yu, G.X.; Wang, Q.F. Research progress on the impact of global change on resource and environment carrying capacity in ecologically fragile areas. China Basic Sci. 2020, 22, 16–20. [Google Scholar]
  4. Yan, Y.; Zhao, C.; Quan, Y.; Lu, H.; Rong, Y.; Wu, G. Interrelations of ecosystem services and rural population wellbeing in an ecologically-fragile area in north china. Sustainability 2017, 9, 709. [Google Scholar] [CrossRef] [Green Version]
  5. Pei, J.; Wang, L.; Huang, H.; Wang, L.; Li, W.; Wang, X.; Yang, H.; Cao, J.; Fang, H.; Niu, Z. Characterization and attribution of vegetation dynamics in the ecologically fragile south china karst: Evidence from three decadal landsat observations. Front. Plant Sci. 2022, 13, 1043389. [Google Scholar] [CrossRef]
  6. Li, Y.; Zheng, Z.; Qin, Y.; Rong, P. Relative contributions of natural and man-made factors to vegetation cover change of environmentally sensitive and vulnerable areas of China. J. Clean. Prod. 2021, 321, 128917. [Google Scholar] [CrossRef]
  7. Zhi, Q. Study on Ecological Capacity and Environment Evaluation of Qingyang, Gansu. Ph.D. Thesis, Gansu Agricultural University, Lanzhou, China, 2010. [Google Scholar]
  8. Zhang, G.; Yan, J.; Zhu, X.; Ling, H.; Xu, H. Spatio-temporal variation in grassland degradation and its main drivers, based on biomass: Case study in the altay prefecture, China. Glob. Ecol. Conserv. 2019, 20, e00723. [Google Scholar] [CrossRef]
  9. Han, Q. Evaluation of Fragile Environment and Study of Topical Region. Master’s Thesis, Xinjiang University, Urumqi, China, 2005. [Google Scholar]
  10. Zhao, Q.; He, X. Main ecological environment problems and countermeasures and suggestions in Altay Prefecture. Xinjiang Youse Jinshu 2007, 30, 2. [Google Scholar]
  11. Zhang, X.; Yang, Z.; Cai, W. Comparative study of environmental assessment methods in the evaluation of resources and environmental carrying capacity—A case study in xinjiang, china. Sustainability 2019, 11, 4666. [Google Scholar] [CrossRef] [Green Version]
  12. Liu, N.; Jiang, H.Q.; Cheng, X. Environmental carrying capacity evaluation methods and application based on environmental quality standards. Prog. Geogr. 2017, 36, 296–305. [Google Scholar]
  13. Lan, S.X.; Li, M.F.; Wang, P.; Fu, X.H.; Zhu, J.; Xu, M.; Wang, X.N.; Peng, X.L. Review on research progress and methods of resource and environment carrying capacity. J. Cent. South For. Univ. (Soc. Sci. Ed.) 2022, 16, 21–30. [Google Scholar]
  14. Cheng, G. Advance in early warning of water resources carrying capacity. Adv. Water Sci. 2018, 29, 583–596. [Google Scholar]
  15. Hu, G.; Zeng, W.; Yao, R.; Xie, Y.; Liang, S. An integrated assessment system for the carrying capacity of the water environment based on system dynamics. J. Environ. Manag. 2021, 295, 113045. [Google Scholar] [CrossRef] [PubMed]
  16. Ning, Y. Dynamic analysis of the ecological evolution footprint based on the calculation of the time elapsing sequence for xiamen city. J. Saf. Environ. 2017, 18, 800–806. [Google Scholar]
  17. Jiang, S.D.; Pan, H.Y. Evaluation of resource and environment carrying capacity of hilly areas in the upper reaches of the yangtze river based on entropy weight topsis method and grey correlation—Taking yibin city as an example. Contemp. Econ. 2017, 5, 70–73. [Google Scholar]
  18. Chen, X.P. Evaluation of Regional Land Resources and Environmental Carrying Capacity Based on PCA and SD Model—Taking Yiwu City, Zhejiang Province as an Example. Master’s Thesis, Zhejiang University, Hangzhou, China, 2015. [Google Scholar]
  19. Wang, K.F. Comprehensive Evaluation and Division of Resources and Environment Carrying Capacity in Shandong Peninsula. Ph.D. Thesis, China University of Mining and Technology, Xuzhou, China, 2015. [Google Scholar]
  20. Yang, L.J.; Yang, Y.C. The spatiotemporal variation in resource environmental carrying capacity in the Gansu Province of China. Acta Ecol. Sin. 2017, 37, 7000–7017. [Google Scholar]
  21. Ou, T.; Zhang, S.Q.; Gan, S.; Yang, Y.; Liao, S.K.; Ma, S.L.; Xu, X. Evaluation of resource and environment carrying capacity of mountainous county based on gis and mean square error decision method_outao. Hubei Agric. Sci. 2017, 56, 454–458. [Google Scholar]
  22. Fan, J.; Wang, Y.F.; Tang, Q.; Zhou, K. Academic Thought and Technical Progress of Monitoring and Early-warning of the National Resources and Environment Carrying Capacity (V 2014). Sci. Geogr. Sin. 2015, 35, 1–10. [Google Scholar]
  23. Feng, L.; Cui, X. Multi-Criteria Decision Grey Relation Projection Method and Its Application. Syst. Eng. Theory Pract. 2002, 22, 103–107. [Google Scholar]
  24. Fan, Z.Y. Study on Evaluation of Land Resources Carrying Capacity in Harbin. Master’s Thesis, Harbin University of Technology, Harbin, China, 2016. [Google Scholar]
  25. Li, M.J.; Chen, G.H.; Chen, Y.T. Research on index standardization method in comprehensive evaluation. Chin. J. Manag. Sci. 2004, 10, 45–48. [Google Scholar]
  26. He, Y.L.; Liu, X.L.; Yang, Y.; Ma, S.L.; Fu, B.H.; Tan, S.C. Study on the evaluation of county resource and environment carrying capacity. Ecol. Econ. 2017, 33, 124–128. [Google Scholar]
  27. Chen, X.Y.J. Early Warning Study on the Assessment of Resource and Environment Carrying Capacity in Gansu Province. Master’s Thesis, Central University for Nationalities, Beijing, China, 2019. [Google Scholar]
  28. Wu, X.X. Evaluation on the suitable irrigation mode of spring maize in arid area based on grey relational projection method. J. Zhejiang Univ. Water Resour. Hydropower 2015, 27, 38–41. [Google Scholar]
  29. Zhao, X.H. Study on Grey Relational Projection Model for Ecological Suitability Analysis in Urban Ecological Planning. Master’s Thesis, Zhejiang University, Hangzhou, China, 2005. [Google Scholar]
  30. Huang, L. Research on Improvement and Application of BP Neural Network Algorithm. Master’s Thesis, Chongqing Normal University, Chongqing, China, 2008. [Google Scholar]
  31. He, Q.B. BP Neural Network and Its Application Research. Master’s Thesis, Chongqing Jiaotong University, Chongqing, China, 2004. [Google Scholar]
  32. Li, Y.K. Research, Analysis, Improvement and Application of BP Neural Network. Master’s Thesis, Anhui University of Science and Technology, Huainan, China, 2012. [Google Scholar]
  33. Sheng, X.; Zhang, H.; Su, C. Fenhe river water quality assessment based on BP neural network. J. Shanxi Univ. (Nat. Sci. Ed.) 2013, 36, 301–307. [Google Scholar]
  34. Cao, R.X.; Zhang, K.X.; Zeng, W.H.; Ma, J.W.; Xie, Y.X.; Li, Q. Early warning research on water environment carrying capacity based on BP neural network—Taking the North Canal as an example. J. Environ. Sci. 2021, 41, 2005–2017. [Google Scholar]
  35. Ye, Y.H.; Han, Z.; Sun, F.F.; Zhang, Y.; Huang, T.; Chen, L.; Cheng, X. Study on early warning and evaluation of small-scale resource and environment carrying capacity—Taking dapeng peninsula as an example. J. Ecol. Environ. 2017, 26, 1275–1283. [Google Scholar]
Figure 1. Flow chart of BP neural network algorithm.
Sustainability 15 09825 g001
Figure 2. BP neural network simulation situation of training samples of (a) resource and environment carrying capacity risk in Altay Prefecture and counties and cities from 2014 to 2020; (b) natural resource carrying capacity risk in Altay Prefecture and counties and cities from 2014 to 2020; (c) eco-environment carrying capacity risk in Altay Prefecture and counties and cities from 2014 to 2020; (d) economic and social support risk in Altay Prefecture and counties and cities from 2014 to 2020.
Sustainability 15 09825 g002
Figure 3. Early warning results of (a) resource and environment carrying capacity risk in Altay Prefecture and counties and cities from 2011 to 2025; (b) natural resource carrying capacity risk in Altay Prefecture and counties and cities from 2011 to 2025; (c) eco-environment carrying capacity risk in Altay Prefecture and counties and cities from 2011 to 2025; (d) economic and social support risk in Altay Prefecture and counties and cities from 2011 to 2025.
Sustainability 15 09825 g003
Figure 4. Spatial evolution of alert degree of resource and environment carrying capacity of counties and cities in Altay Prefecture.
Sustainability 15 09825 g004
Figure 5. Spatial evolution of alert degree of natural resource carrying capacity of counties and cities in Altay Prefecture.
Sustainability 15 09825 g005
Figure 6. Spatial evolution of alert degrees of eco-environment carrying capacity of counties and cities in Altay Prefecture.
Sustainability 15 09825 g006
Figure 7. Spatial evolution of the alert degree of economic and social support of counties and cities in Altay Prefecture.
Sustainability 15 09825 g007
Table 1. Early warning index system and weight calculation of the resource and environment carrying capacity of Altay Prefecture.
Target LayerSystem LayerIndex LayerUnitIndex PropertiesSystem Layer WeightTarget Layer Weight
Early warning index system of resource and environment carrying capacityNatural resource carrying capacityPer capita arable landhm2/person+0.09570.0444
Soil fertility index%+0.12090.0560
Per capita construction land areahm2/person0.03430.0159
Per capita water resourcesm3/person+0.08220.0381
Total reservoir capacity104 m3+0.15640.0725
Annual precipitationmm+0.07010.0325
Per capita mineral resources reservesTon/person+0.27060.1254
Forest coverage rate%+0.08720.0404
Per capita grassland area hm2/person+0.08250.0382
Eco-environment carrying capacitySO2 emission intensityTon/ten
thousand yuan
0.05730.0163
Utilization rate of water resources development%+0.24820.0707
Proportion of wetland area%+0.10660.0304
Wastewater discharge per unit industrial added valueTon/ten
thousand yuan
0.05980.0170
Comprehensive utilization rate of industrial solid waste%+0.18500.0527
Harmless treatment rate of domestic waste%+0.07320.0208
Application amount of pesticides and fertilizers per unit cultivated areaTon/hm20.07530.0214
Area proportion of nature reserves%+0.14020.0399
Proportion of water above Class III%+0.05450.0155
Economic and social supportPopulation densityperson/km20.06980.0176
Urbanization rate%+0.18890.0476
GDP per capitaRMB/person+0.13030.0328
Water consumption per unit GDPm3/ten
thousand yuan
0.09120.0230
Energy consumption per unit GDPTon/ten
thousand yuan
0.09030.0227
Land output rateRMB/hm2+0.25870.0651
Effective irrigation rate of cultivated land%+0.01160.0029
Control rate of water and soil loss%+0.15910.0400
Note: “+” index means that the larger the index value, the higher the carrying capacity, and the smaller the alarm degree; the “−” index means that the higher the index value, the lower the carrying capacity, and the greater the alarm degree.
Table 2. Criteria for dividing the risk warning results of resource and environment carrying capacity of Altay Prefecture.
Carrying Capacity LevelRisk LevelWarning IntervalStatusEarly Warning Signal Markers
LowTremendous warning[0, 0.2)DangerRed (R)
LowerSevere warning[0.2, 0.4)InsecurityOrange (O)
SecondaryModerate warning[0.4, 0.6)Less safeYellow (Y)
HigherLight warning[0.6, 0.8)Relatively safeBlue (B)
HighNo warning[0.8, 1]SecurityGreen (G)
Disclaimer/Publisher’s Note: The statements, opinions and data contained in all publications are solely those of the individual author(s) and contributor(s) and not of MDPI and/or the editor(s). MDPI and/or the editor(s) disclaim responsibility for any injury to people or property resulting from any ideas, methods, instructions or products referred to in the content.

