Article

Research on the Yellow River Basin Energy Structure Transformation Path under the “Double Carbon” Goal

School of Economics and Management, Taiyuan University of Technology, Taiyuan 030024, China
*
Author to whom correspondence should be addressed.
Sustainability 2023, 15(12), 9695; https://doi.org/10.3390/su15129695
Submission received: 31 May 2023 / Revised: 14 June 2023 / Accepted: 14 June 2023 / Published: 16 June 2023

Abstract

:
The clean utilization of traditional energy and renewable, clean energy utilization are the key points of the energy structure transition in the Yellow River Basin. This paper constructs an evolutionary game model, with the participation of local governments and energy companies, to analyze the dynamic evolution of each game subject. The results from the study highlight three important facts about the energy mix transformation in the Yellow River Basin: (1) the high ratio of traditional clean energy utilization and the low ratio of renewable, clean energy utilization align with the actual energy use in the Yellow River Basin, which can better promote the inclusive development of both types of energy; (2) increasing the capacity to utilize both energy sources can improve the energy system resilience gains of game players, for example, at the immature stage of renewable, clean energy utilization technologies, local government’s willingness to subsidize renewable clean energy utilization is positively related to their energy system resilience gains; and (3) under the premise of ensuring the energy supply, the introduction of penalty parameters can ensure a reasonable share of both types of energy utilization, and an increase in the penalty parameters makes the game participants increase their willingness to implement energy structure transformation policies.

1. Introduction

Energy as the basis and driving force of socio-economic development, energy transition has far-reaching implications for China’s sustainable development. The domestic energy supply and demand pattern and the complex international environment, as well as global warming due to climate change, will increase the instability and uncertainty of the energy transition. Due to the different resource endowments of different regions, the impact of the energy transition on different regions also varies greatly. The Yellow River Basin, also known as the “energy basin”, is China’s energy base and plays a vital role in China’s energy structure transformation. However, the executive summary of the Policy Study on Structural Adjustment and Low Carbon Development in the Yellow River Basin “14th Five-Year Plan” points out that the energy structure of the Yellow River Basin is still heavy and lacks effective adjustment measures. The “Fourteenth Five-Year Plan for a Modern Energy System” released by the Chinese government states that based on ensuring the security of the energy supply, improving the capacity of the clean energy supply is an inevitable choice to promote the energy transformation steadily.
The Yellow River Basin is not only rich in traditional energy resources, but also in new energy resources [1,2]. Studies have shown that an energy structure dominated by traditional energy sources is the leading cause of environmental pollution. In contrast, renewable, clean energy sources are considered the critical force behind the energy structure transition due to their low environmental load [3,4]. However, the characteristics of China’s resource endowment determine that the dominance of traditional energy sources in energy utilization will not change for a long time [5,6], while the utilization of renewable, clean energy sources has not yet formed a mature system, which makes the whole energy system more vulnerable to natural environmental risks due to its uncontrollable, unstable, and discontinuous features. This puts traditional and renewable, clean energy sources in a long-term game. How to promote the clean use of traditional energy, while facilitating the use of renewable, clean energy, is an important issue facing the Yellow River Basin under the “double carbon” goal. Additionally, the willingness to choose the energy use depends mainly on improving the capacity of different types of energy use. In recent years, energy system resilience has become a hot topic of discussion in the global energy community. The improvement of energy system resilience is related to the improvement in the capacity of clean utilization of traditional energy, on the one hand, and the improvement in the capacity of renewable, clean energy utilization, on the other hand (https://www.cet.energy/). In addition, the choice of energy use strategy is also influenced by government policies, among which government subsidy policies have different impacts on low-carbon development depending on different subsidy strategies, subsidies to different subjects, and the stage of subsidy implementation [7,8,9]. However, the above studies ignore the limited role of government subsidies in the energy transition. In this paper, we analyze the impact of introducing penalty parameters on the energy structure transition in the Yellow River Basin under the premise of ensuring the energy supply.
Based on the resource endowment and local development level of the Yellow River Basin, how can the ratio on the clean use of traditional energy and the use of renewable, clean energy be reasonably chosen? What is the impact of increased energy system resilience on the strategic choices of participants in the energy mix transition? What is the impact of the relative size of the subsidy and the penalty parameters on the energy mix transformation trend? All these questions are the subject and areas of interest in this paper.
The innovations in this paper are mainly reflected in the following three aspects:
(1)
Considering the energy resource endowment characteristics of the Yellow River Basin, this paper proposes an energy structure transformation path for the inclusive development of traditional and renewable, clean energy in the Yellow River Basin;
(2)
Unlike most studies, this paper reflects the impact of energy system resilience on local governments and energy companies in the payoff matrix. It explores the impact of increased energy resilience on the strategy choice of participating subjects;
(3)
This study provides a new perspective to explore the impact of the introduction of penalty parameters on energy structure transformation in the Yellow River Basin, while emphasizing the “back-up guaranteed” by coal in the Yellow River Basin.
By exploring the above three issues, this paper analyzes the factors affecting the strategic interaction of the participating subjects in depth and detail. It obtains two types of energy utilization ratios suitable for the transformation of the energy structure in the Yellow River Basin and the conditions limiting the enhancement of the two types of energy utilization. This study has far-reaching implications for the transformation of the energy structure in the Yellow River Basin.
The rest of the paper is organized as follows: Section 2 is the literature review, Section 3 is the methodology, Section 4 presents the results and discussion, and Section 5 is the conclusions and policy implications.

2. Literature Review

2.1. Energy Transition Studies

Academic research on the energy transition is mainly divided into two parts: one part is quantitative research, which analyzes the influencing factors in the process of the energy transition [10,11,12] and explores the relationship between the energy transition and economic growth [13,14]; the other part is qualitative research, which empirically analyzes the energy transition [15,16,17,18] and explores the path of the energy transition [19,20,21,22,23,24]. Among the methods and models used, in the exploration of energy transition pathways, are the following: the multi-regional, multi-period, infrastructure-based model [20], the multi-model integrated assessment framework [21], the system generalized method of moments model [22], the multi-model comparison method [23], and the multi-sided evolutionary game model [24], etc. Different models have different focuses to address the energy transition pathways in different countries or regions. Among them, the evolutionary game model analyzes the connotations of the energy transition path by considering the interest game between the participating subjects and according to the strategic interaction between the two parties, which is consistent with the purpose of this paper to study the energy transition path in the Yellow River Basin.
As the transformation of the energy structure in the Yellow River Basin is the focus of the “double carbon” target, the existing studies related to this region mainly focus on analysis of the factors influencing carbon emissions under the “double carbon” target [25,26], analysis of the factors influencing green development [27,28,29], and analysis of the coupling between economic growth and carbon neutrality [30,31]. The studies directly related to energy, analyze the impact of the carbon footprint for energy consumption [32] and the coupling and coordination of the system as a whole on regional sustainable development [33,34,35,36], etc. Energy is a limiting factor for economic growth and development, and ensuring energy security is a priority for sustainable development [37]. To achieve the goal of sustainable development in the Yellow River Basin, Wang et al. analyzed the differences in regional development by establishing a system of indicators for the water–energy–food system, using coupled coordination and decoupling models and spatial balance, in which the energy use of the energy subsystem provided a reference for the energy transition [34]. By analyzing the water–energy–food relationship, Zhang et al. obtained sufficient water resources to meet the scale of energy production [38]. However, Xia et al. found that the water-consuming coal chain poses a threat to the scarce water resources in the Yellow River basin, by establishing a comprehensive geographic database of production facilities in the coal chain [33]. Based on the above analysis, the clean use of energy in the Yellow River Basin is an inevitable trend. However, existing studies on the Yellow River Basin have mainly focused on traditional energy use [1,33] and renewable, clean energy use [2], with less research on the inclusive development of both types of energy use.

2.2. Evolutionary Game

Evolutionary game theory is an integrated approach that combines game theory and dynamic evolution [39,40]. Evolutionary games differ from traditional game theory by emphasizing that subjects with different learning and decision-making capabilities are not perfectly rational but constantly learn, imitate, and optimize their respective decisions. In the repeated game of competition and cooperation, the strategic behavior of game subjects gradually becomes stabilized [41].
The evolutionary game mainly analyzes the behavior of limited, rational stakeholder cooperation and strategy selection, which aligns with the characteristics of the multi-object, long-term, and systemic nature of the energy transition [41]. By constructing a low-carbon strategy evolution model of the government–company game, Wu and Xu analyzed the influence of government policy incentives on firms’ low-carbon strategy choices. They concluded that companies’ expectations of government incentive strategies determined whether and how fast low-carbon strategies diffused [42]. Chen and Hu developed an evolutionary game model of government–manufacturer interactions based on static carbon taxes and subsidies. By analyzing the strategic interactions of the game participants under different types of taxes and subsidies, they concluded that government carbon taxes are better than subsidies in promoting low-carbon development [7]. Jiao et al. considered the evolutionary game of local government and company behavior with carbon emission constraints. They discussed the effects of important parameters, such as emissions trading prices and free carbon allowances, on the evolutionary stabilization strategies under static and dynamic reward and penalty mechanisms, and the results showed that the participating agents have unique choices on evolutionary stabilization strategy [43]. Based on the applicability of the government–company game in the energy transformation process, this paper intends to construct a game between local governments and energy companies on both sides, based on the resource endowment of the Yellow River Basin, to study the energy transformation path of the Yellow River Basin.

3. Methodology

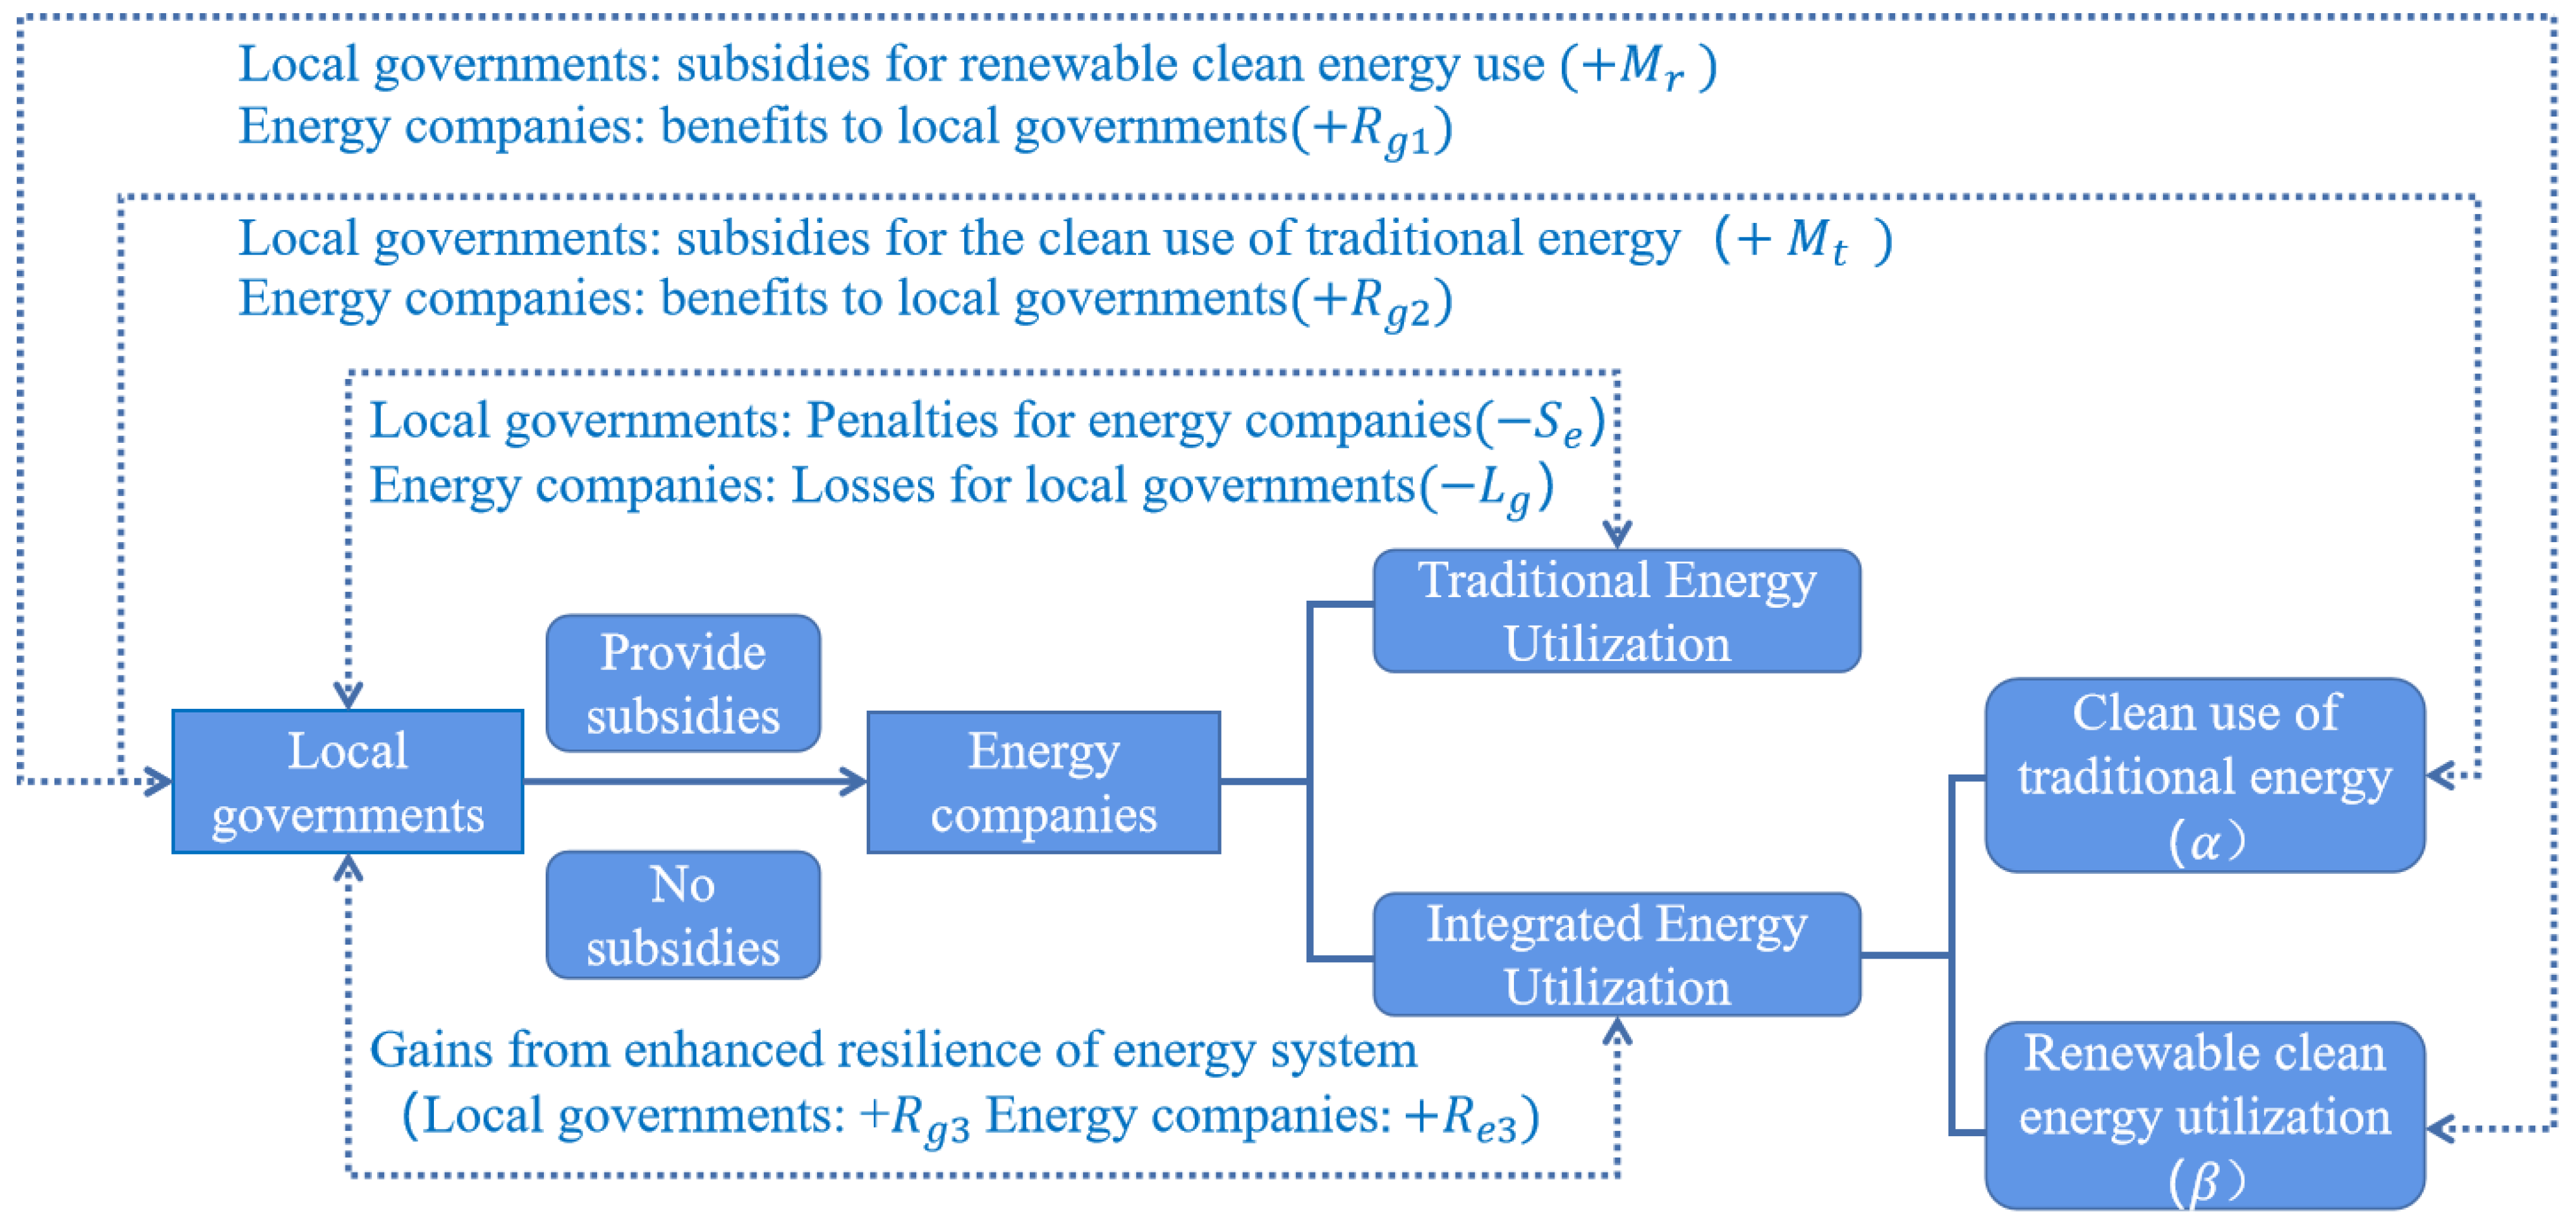
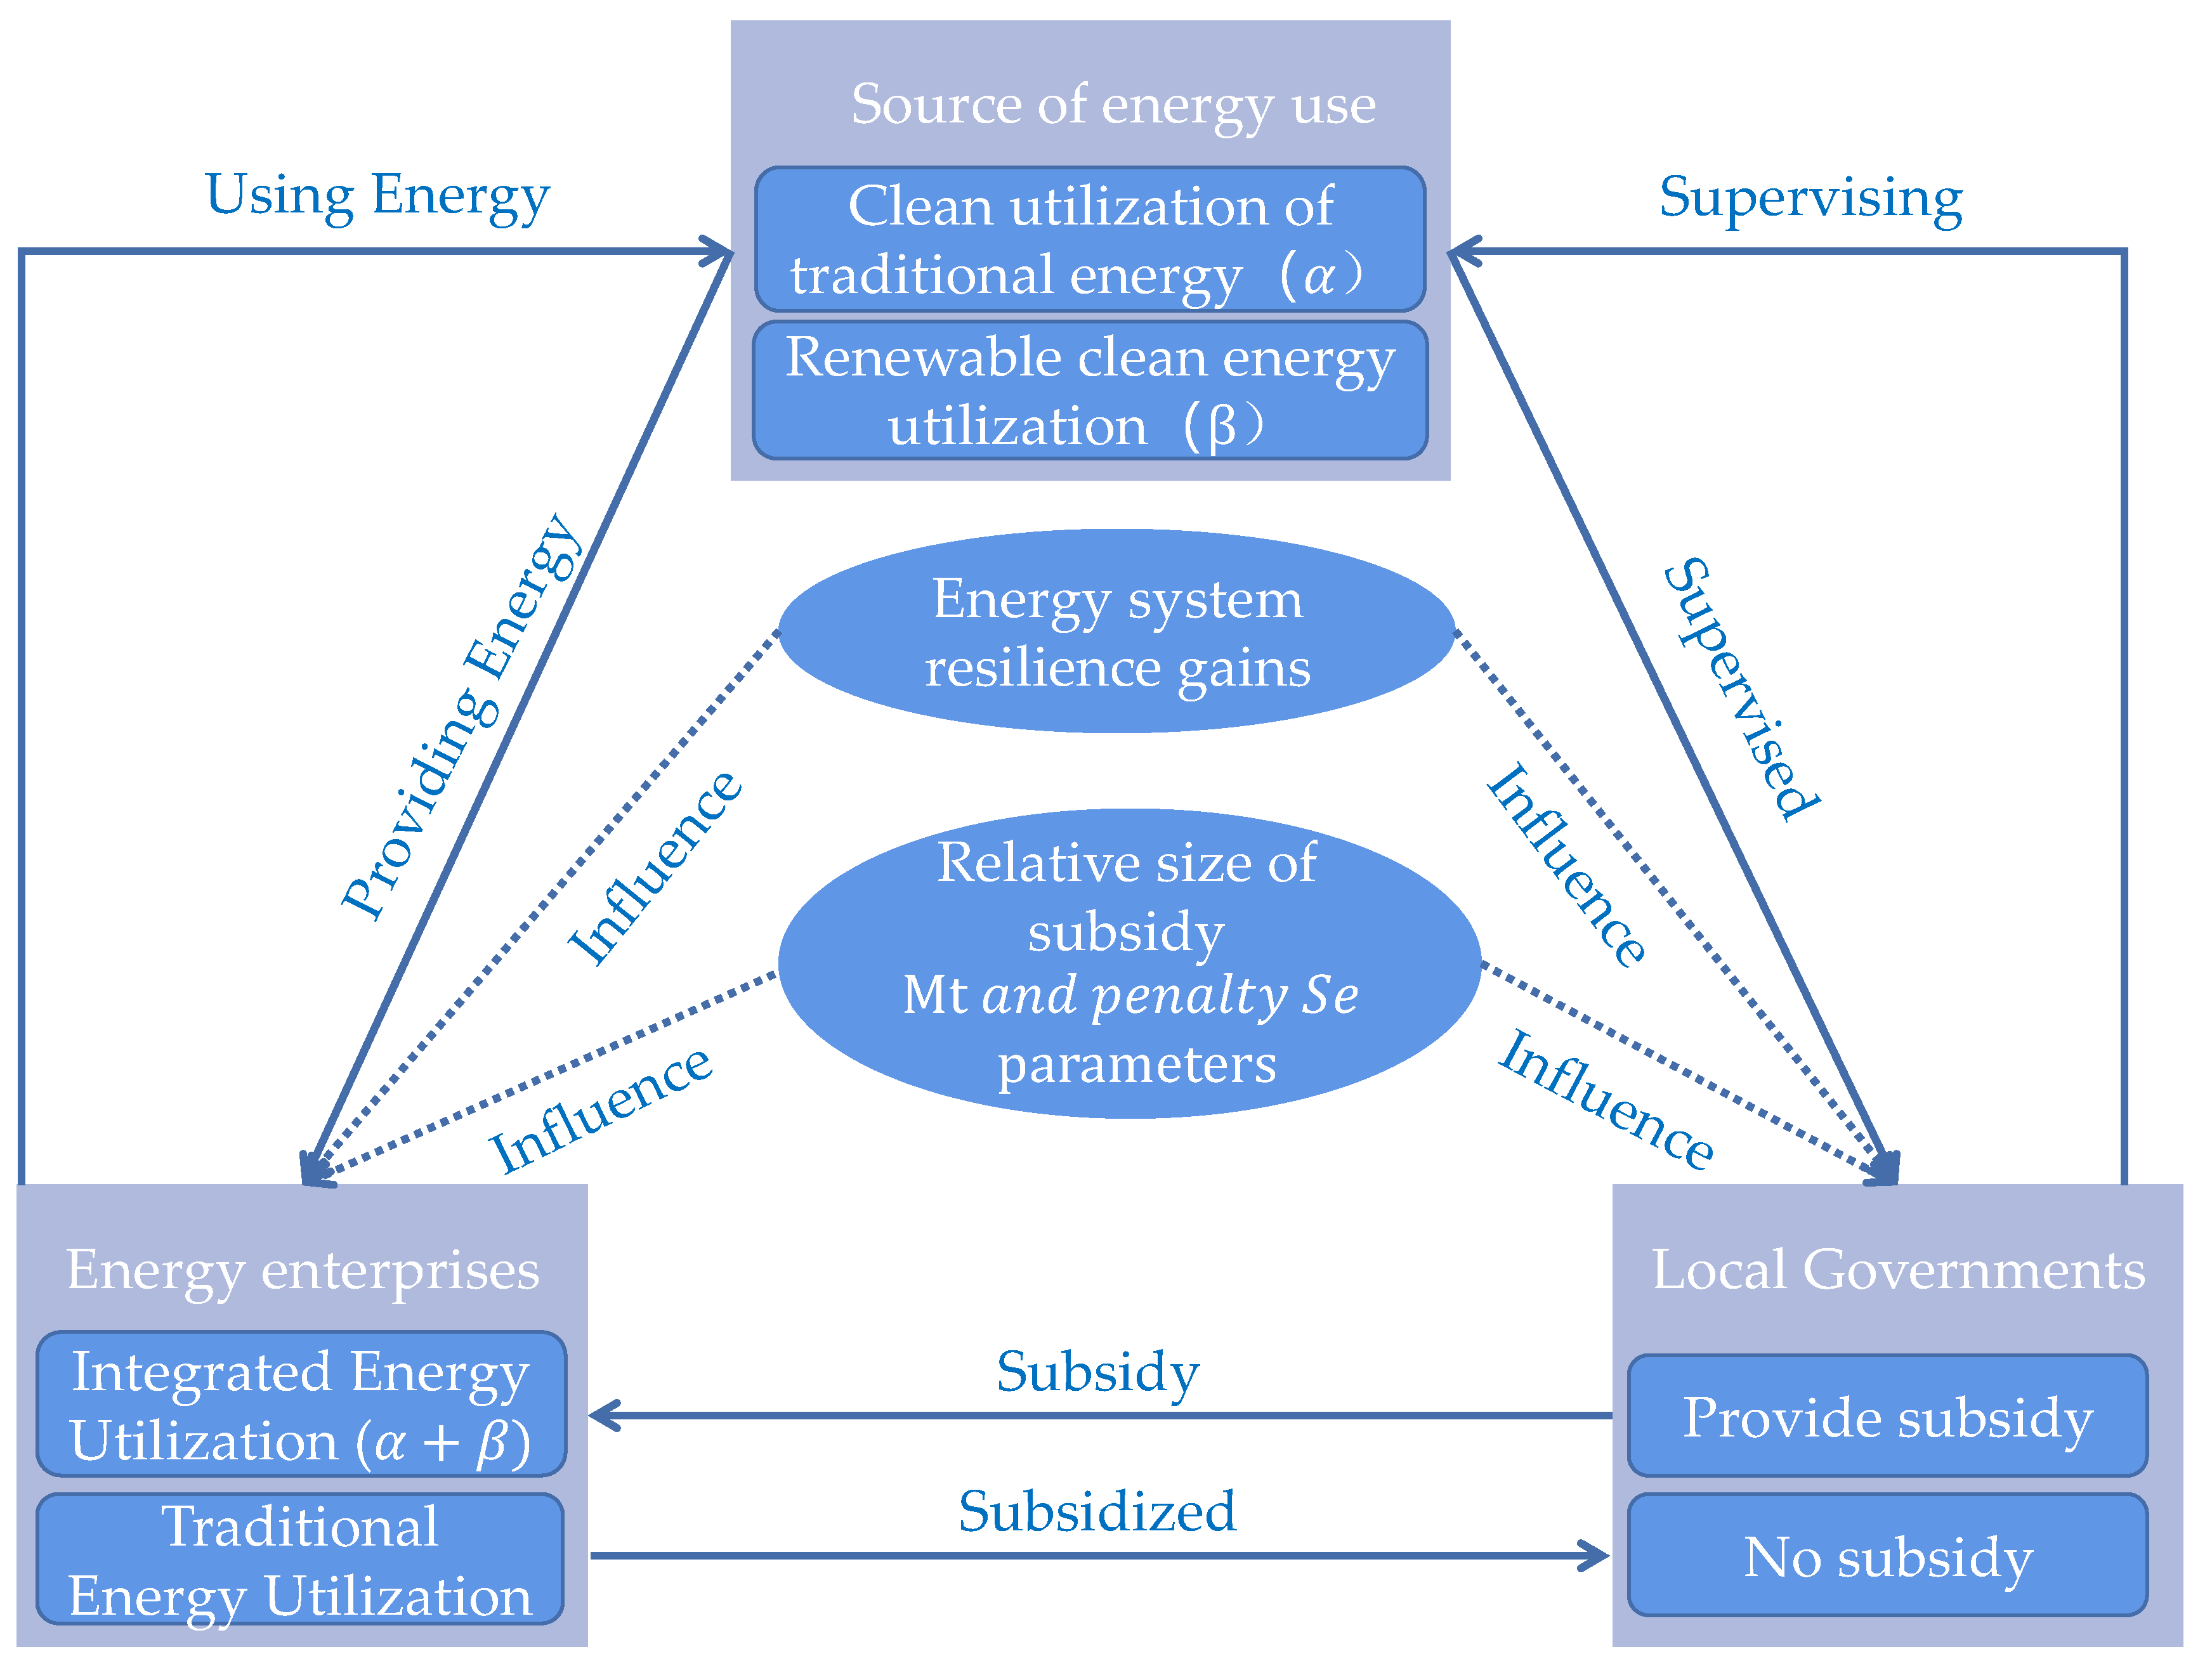
3.1. Evolutionary Game Model Construction

Based on the characteristics of high carbonization, high energy consumption, and high pollution from traditional energy, and the uncontrollable, unstable, and discontinuous characteristics of renewable, clean energy, this paper constructs a dynamic game between local governments and energy companies in the Yellow River Basin, in which local governments provide subsidies to energy companies to promote the clean use of traditional energy and renewable, clean energy.

3.1.1. Model Hypothesis

Hypothesis 1.
Local governments and energy companies in the Yellow River Basin are limited rational players, and there is no perfect reciprocity of information between them. Their strategy choices are influenced by each other, which is costly. Through continuous revision and improvement in the evolutionary process, they eventually tend to fit their behavioral strategies. The set of strategies by energy companies is {use integrated energy, use traditional energy}. The probability of energy companies adopting the strategy of using integrated energy is “x”, and the probability of adopting the strategy of using traditional energy is “1 − x”. The set of strategies by local governments in the Yellow River Basin is {provide subsidies, no subsidies}. The probability of local governments adopting the subsidy strategy is “y”, and the probability of not adopting the subsidy strategy is “1 − y”.
Hypothesis 2.
Under the “double carbon” goal, energy companies actively respond to the energy structure transformation policy of local governments and adopt two types of energy utilization, according to the resource endowment of the region: the clean use of traditional energy and renewable, clean energy utilization, each accounting for a certain proportion of the energy utilization, referred to as integrated energy utilization. The proportion of the clean use of traditional energy in integrated energy utilization is “α”, and the proportion of renewable, clean energy utilization in integrated energy utilization is “β”, (α + β = 1).
Hypothesis 3.
Effective subsidies can not only regulate and guide the behavior of market players, but also promote the sustainable and healthy development of society. The central government is the top-level designer of policy documents and plays a macro-regulatory role in the energy structure transformation in the Yellow River Basin. According to the guidance in central government documents, local governments set development goals suitable for the energy structure transformation in their regions and provide policy support and financial support for integrated energy utilization by energy companies in their regions. “Mt” denotes the clean use of traditional energy, and “Mr” denotes renewable, clean energy utilization. When the local government gives subsidies to energy companies, but the energy companies do not use the subsidies to utilize integrated energy while ensuring the energy supply, the energy companies are penalized by “Se.
Hypothesis 4.
A highly resilient energy system can plan responses before, during, and after disruptions caused by various risks to maintain its core functions while minimizing negative impacts, rebuild quickly, and strengthen the system’s ability to cope with future risks by recognizing and adapting to future changes and uncertainties [44]. Under the subsidy policy of local governments, energy companies in the Yellow River Basin can enhance the resilience of the energy system by strengthening the utilization of integrated energy. The resilience enhancement benefit of local governments is “Rg3”, and the resilience enhancement benefit of energy companies is “Re3.
Hypothesis 5.
The cost of using traditional energy, such as coal, in the Yellow River Basin is “Ce1”, the resulting base revenue for the energy companies is “Re”, and the environmental loss to the local governments is “Lg”. Under the “double carbon” goal, energy companies actively respond to the energy mix transition policy and utilize integrated energy, in which the cost of clean utilization of traditional energy is “ΔCe1”, the corresponding benefit to energy companies is “Re1”, and the corresponding environmental benefit to local government is “Rg1”. The cost of utilization of renewable clean energy is “Ce2”, the corresponding benefit to energy companies is “Re2”, and the corresponding environmental benefit to local government is “Rg2.

3.1.2. Game Matrix

The strategic interaction between local governments and energy companies in the Yellow River Basin is shown in Figure 1; the symbols and descriptions of the evolutionary game model, based on the above settings, are shown in Table 1.
Based on the above basic hypotheses, the payoff matrix for the two parties involved in the game is shown in Table 2 [43,45,46].

3.2. Evolutionary Equilibrium Analysis

3.2.1. Stability Conditions for the Evolution of Energy Companies

The expected benefits for energy companies in the Yellow River Basin when they choose to utilize integrated energy are defined as   U 1 e , the expected benefits when they utilize traditional energy sources are defined as   U 2 e , and the combined benefits from energy utilization choice strategies are defined as U e ¯ ;
U 1 e = α ( R e + R e 1 C e 1 Δ C e 1 ) + β ( R e 2 C e 2 ) + y ( α M t + β M r + R e 3 )
U 2 e = y ( M t S e ) + ( R e C e 1 )
U e ¯ = x U 1 e + ( 1 x ) U 2 e
Thus, the replicator dynamic equation for energy companies is:
F ( x ) = x t = y ( U 1 e U e ¯ ) = x ( 1 x ) [ C e 1 R e + α ( R e + R e 1 C e 1 Δ C e 1 ) + β ( R e 2 C e 2 ) + y ( R e 3 ( 1 α ) M t + S e + β M r ) ]  
To find stable conditions for the dynamic evolution of energy companies:
Let F ( x ) = 0 , get y = ( α 1 ) C e 1 + ( 1 α ) R e α ( R e 1 Δ C e 1 ) β ( R e 2 C e 2 ) R e 3 ( 1 α ) M t + β M r + S e
If y = y , x is in a stable state of evolution.
If y y , the steady state of x needs to be discussed on a case-by-case basis.
Derivation of F ( x ) is obtained by:
                                                                ( F ( x ) ) x = ( 1 2 x ) [ C e 1 R e + α ( R e + R e 1 C e 1 Δ C e 1 ) + β ( R e 2 C e 2 ) + y ( R e 3 ( 1 α ) M t + S e + β M r ) ]
According to the stability theorem of the differential equation, the proportion of energy companies that choose to use integrated energy sources in a steady state must satisfy: F ( x ) = 0 and ( F ( x ) ) x < 0 , when x = 0 or 1, F ( x ) = 0 . Where G ( y ) = C e 1 R e + α ( R e + R e 1 C e 1 Δ C e 1 ) + β ( R e 2 C e 2 ) + y ( R e 3 ( 1 α ) M t + S e + β M r ) . The sign of ( F ( x ) ) x depends on the size of G ( y ) . When we take the derivative of y in G ( y ) , we get d ( G ( y ) ) d y = R e 3 ( 1 α ) M t + S e + β M r . So, G ( y ) is an increasing function of y. Where G ( y ) = 0 , we get:
when y > y , G ( y ) > 0 , ( F ( x ) ) x | x = 1 < 0 , x = 1 is the evolutionary equilibrium point;
when y < y , G ( y ) < 0 , ( F ( x ) ) x | x = 0 < 0 , x = 0 is the evolutionary equilibrium point.
Based on the above analysis, it can be concluded that the choice of energy strategy by energy companies evolves from x = 0 to x = 1 when y increases, indicating that when the proportion of local governments choosing subsidies increases, the proportion of energy companies choosing to use integrated energy also increases. In other words, when the aggressiveness of government subsidies increases, the enthusiasm of energy companies choosing to use integrated energy also increases.

3.2.2. Stability Conditions for the Evolution of Local Governments

Similarly, let the expected benefits for local government when they choose to provide subsidies be defined as   U 1 g , the expected benefits when no subsidies are provided be defined as   U 2 g , and the combined benefits of the subsidy choice strategy be defined as U g ¯ .
U 1 g = x [ α ( R g 1 M t ) + β ( R g 2 M r ) + R g 3 ] + ( 1 x ) ( S e M t L g )
U 2 g = x ( α R g 1 + β R g 2 ) ( 1 x ) L g
U g ¯ = y U 1 g + ( 1 y ) U 2 g
Thus, the replicator dynamic equation for local governments is:
F ( y ) = y t = y ( U 1 g U g ¯ ) = y ( y 1 ) [ M t S e + x ( α M t + β M r + S e M t R g 3 ) ]  
To find stable conditions for the dynamic evolution of local governments:
Let F ( y ) = 0 , get x = ( M t S e ) ( α 1 ) M t + β M r + S e R g 3
If x = x , y is in a stable state of evolution.
If x x , the steady state of y needs to be discussed on a case-by-case basis.
Derivation of F ( y ) is obtained by:
                                                                                ( F ( y ) ) y = ( 2 y 1 ) [ M t S e + x ( α M t + β M r + S e M t R g 3 ) ]
Similarly, let G ( x ) = M t S e + x ( α M t + β M r + S e M t R g 3 ) . The sign of ( F ( y ) ) y depends on the size of G ( x ) . When we take the derivative of x in G ( x ) , we get d ( G ( x ) ) d x = α M t + β M r + S e M t R g 3 . So, G ( y ) is an increasing function of x. Where G ( x ) = 0 , we get:
when x > x ,   G ( x ) < 0 ,   ( F ( y ) ) y | y = 1 < 0 , y = 1 is the evolutionary equilibrium point;
when x < x ,   G ( x ) > 0 ,   ( F ( y ) ) y | y = 0 < 0 , y = 0 is the evolutionary equilibrium point.
Based on the above analysis, it can be concluded that when x increases, the strategy of local governments in the Yellow River Basin to choose subsidies gradually evolves from y = 0 to y = 1, indicating that the willingness of energy companies to use integrated energy increases and local governments subsidy policies are gradually implemented.

3.2.3. Stability Analysis of Replication Dynamics System

Where F ( x ) = 0 ,   F ( y ) = 0 , we get five equilibrium points: E 1 = ( 0 , 0 ) , E 2 = ( 0 , 1 ) , E 3 = ( 1 , 0 ) , E 4 = ( 1 , 1 ) , E 5 = ( x , y ) .
( x , y ) = [ ( M t S e ) ( α 1 ) M t + β M r + S e R g 3 ( α 1 ) C e 1 + ( 1 α ) R e α ( R e 1 Δ C e 1 ) β ( R e 2 C e 2 ) R e 3 ( 1 α ) M t + β M r + S e ]
According to Friedman [41], we analyzed the stability of the equilibrium points using the Jacobi matrix. The Jacobi matrix of the above replicated dynamic system is as follows: each of the five equilibrium points is brought into the Jacobi matrix, and the eigenvalues of the Jacobi matrix are obtained:
J = [ F ( x ) x F ( x ) y F ( y ) x F ( y ) y ] = { ( 1 2 x ) [ C e 1 R e + α ( R e + R e 1 C e 1 Δ C e 1 ) + β ( R e 2 C e 2 ) + y ( R e 3 ( 1 α ) M t + S e + β M r ) ] R e 3 ( 1 α ) M t + β M r + S e ( α 1 ) M t + β M r + S e R g 3 ( 2 y 1 ) [ M t S e + x ( α M t + β M r + S e M t R g 3 ) ] }  
Based on the assumption of a finite rational man, the subsidy input of the local governments in the Yellow River Basin in the process of integrated energy use by energy companies should be smaller than the benefit to the local government from enhancing energy system resilience, thus satisfying the condition that R g 3 > α M t + β M r . With subsidies from local governments, the benefits of integrated energy use by energy companies should be greater than the costs they pay, thus satisfying the condition that α ( R e + R e 1 C e 1 ) + β R e 2 + R e 3 > α Δ C e 1 + β C e 2 . Otherwise, energy companies would not choose an integrated energy use strategy. The equilibrium points are brought into the Jacobi matrix. The eigenvalues of the Jacobi matrix for each equilibrium point are obtained, as shown in Table 3. The stability results for the replicated dynamic system are discussed according to the above conditions, as shown in Table 4.
Stages   I    and    ( I ) : When energy companies in the Yellow River Basin do not have a solid capacity to use integrated energy sources, with or without subsidies from local government, integrated energy strategies offer less benefit to energy companies than traditional energy use. Stage I   ( S e < M t ) shows that M t dominates the strategy choice of the game subjects. At this time, energy companies are not strong regarding the clean use of traditional energy sources, so the local government strategy is not to provide subsidies, while the energy companies’ strategy is to use traditional energy sources. Stage I   ( S e > M t ) shows that S e dominates the strategy choice of the game subjects under the premise of ensuring the energy supply. At the time, the energy companies’ ability to utilize traditional energy cleanly is enhanced, while the ability to utilize renewable, clean energy sources is not strong, and the local government strategy is to provide subsidies, while the energy companies’ strategy is to utilize traditional energy sources. The equilibrium solution for the system from stage   I to stage   I is from (0,0) to (0,1).
Stages  II    and    ( II ) : When the capacity of energy companies in the Yellow River Basin to utilize integrated energy sources increases, with subsidies from local governments, energy companies earn more revenue from using integrated energy sources than traditional energy sources. Stage   II   ( S e < M t ) indicates that M t dominates the strategy choice of the game subjects. When the clean utilization capacity of traditional energy sources increases, the strategy of local governments at this point is to (not) provide subsidies, while the strategy of energy companies is to use (traditional) integrated energy sources. Stage II ( S e > M t ) indicates that S e dominates the strategy choice of the game subjects under the premise of ensuring the energy supply, and when the renewable, clean energy utilization capacity increases, at this time, the local government chooses to provide subsidies and energy companies carry out the utilization of integrated energy. The equilibrium solution for the system from stage II   to stage II is from (0,0), (1,1) to (1,1).
Stages  III  and    ( III ) : When the capacity of energy companies in the Yellow River Basin to use integrated energy is further improved, the explicit benefits of using integrated energy are greater than the benefits of using traditional energy in the absence of local government subsidies. When subsidies are available, the expected benefits from energy companies’ use of integrated energy strategies are less than the actual benefits of using integrated energy. Stage III   ( S e < M t ) shows that M t dominates in the strategy choice of the game subject. At this point, the game subjects fluctuate in their strategy choice, and there is no equilibrium solution. Stage III   ( S e > M t ) shows that S e dominates the strategy choice of the game subjects under the premise of ensuring the energy supply. At this time, the government chooses to provide subsidies, and the difference between the penalty against energy companies’ and the subsidy is less than the difference between the energy companies expected return from using traditional energy and integrated energy, and the energy companies’ strategy is to use traditional energy. From stage   III to stage   III   the system equilibrium solution goes from no solution to (0,1).
Stages    IV  and    ( IV ) : Local governments in the Yellow River Basin increase subsidies to energy companies to implement energy mix transformation policies, a move that leads to more expected benefits from integrated energy use than actual benefits from integrated energy use. In other words, increased capacity for the clean use of traditional energy and renewable, clean energy use leads to increased actual benefits from integrated energy use. Stage   IV   ( S e < M t ) shows that M t dominates the strategy choice of the game subjects. At this point, the government strategy is to provide subsidies, while the strategy of local energy companies is to use integrated energy sources. Stage   IV   ( S e > M t ) shows that S e governs the strategy choice of the game subjects under the premise of ensuring the energy supply. At this point, the local government chooses to provide subsidies to companies using integrated energy sources, and the equilibrium solution for the system from stage IV to stage IV is stabilized at (1,1).

4. Results and Discussion

In order to visually analyze the dynamic evolutionary process for the strategy choice between local governments and energy companies in the Yellow River Basin, we set the initial strategy values and then simulate the strategy evolution process of both parties under different scenarios by changing the parameters values. This paper used MATLAB (R2022b) to simulate the evolutionary trajectories due to the different parameter changes.
This paper further demonstrates the evolutionary trajectory of the above equilibrium points and the evolution of different initial value points for the game subjects to the equilibrium point. It analyzes the evolutionary trajectory of different ratios for traditional energy clean use and renewable, clean energy use, as well as the changes in the revenue and subsidy-related parameters regarding the local government’s decision to provide a subsidy or not and the energy companies’ comprehensive use of energy or not, by using numerical simulations. In order to meet the actual energy utilization of energy companies in the Yellow River Basin, the following parameters are set in conjunction with the references [43,45,46] and the previous constraints: C e 1 = 1300 ,   Δ C e 1 = 1000 ,   C e 2 = 1600 ,   R e =   1800 ,   R e 1 = 1000 ,   R e 2 = 2000 ,   R e 3 = 820 ,   R g 1 = 85 ,   R g 2 = 36 ,   R g 3 = 820 ,   M t = 1100 ,   M r = 86 ,   L g = 600 , the unit of these parameters is CNY 100 million. A and b represent proportions, and these two parameters are pure numbers without units.

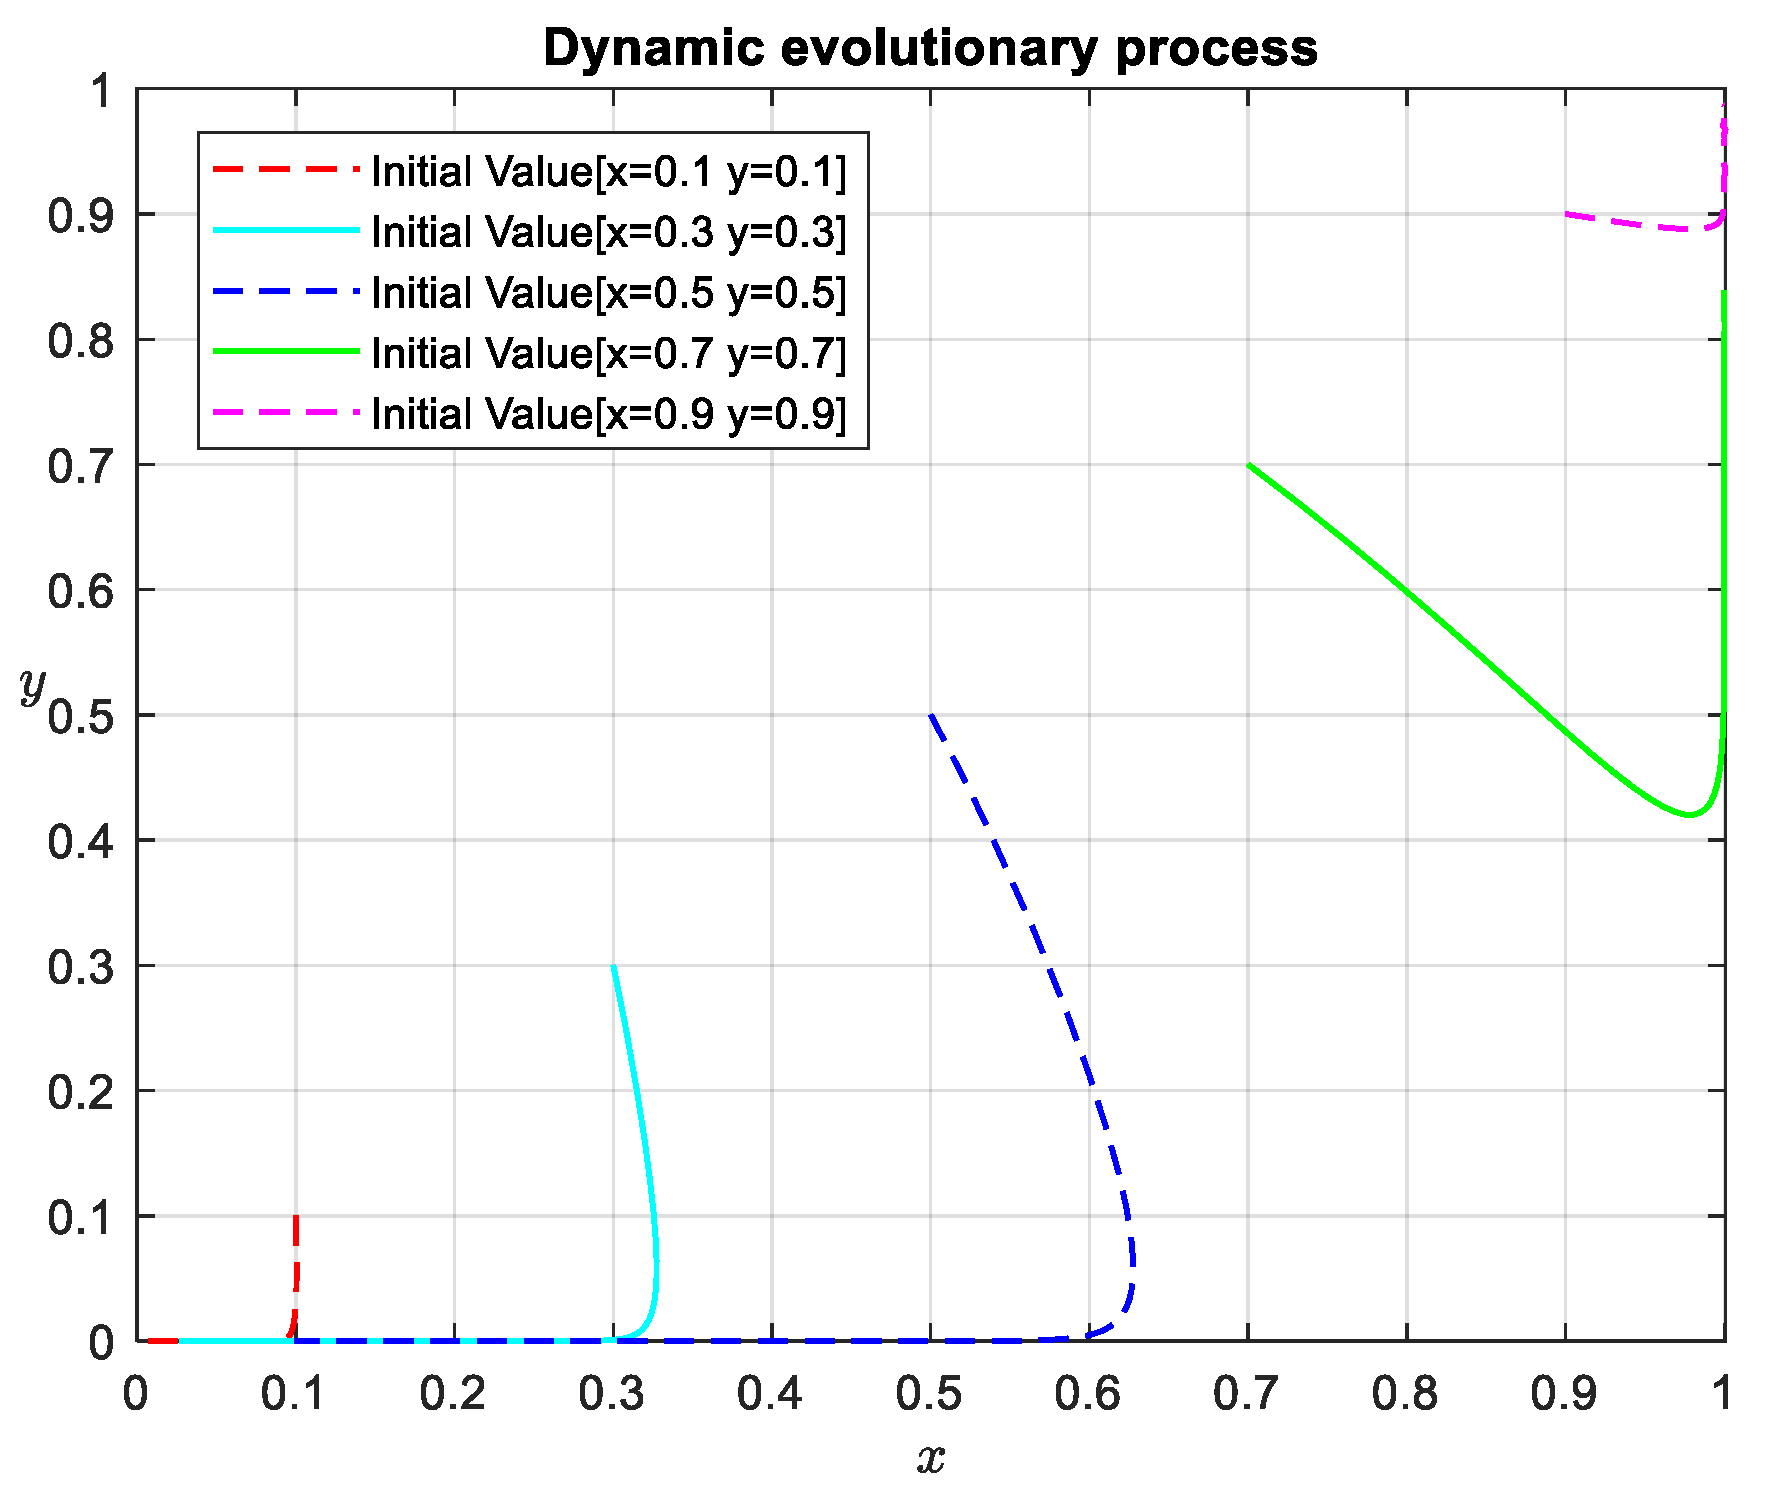
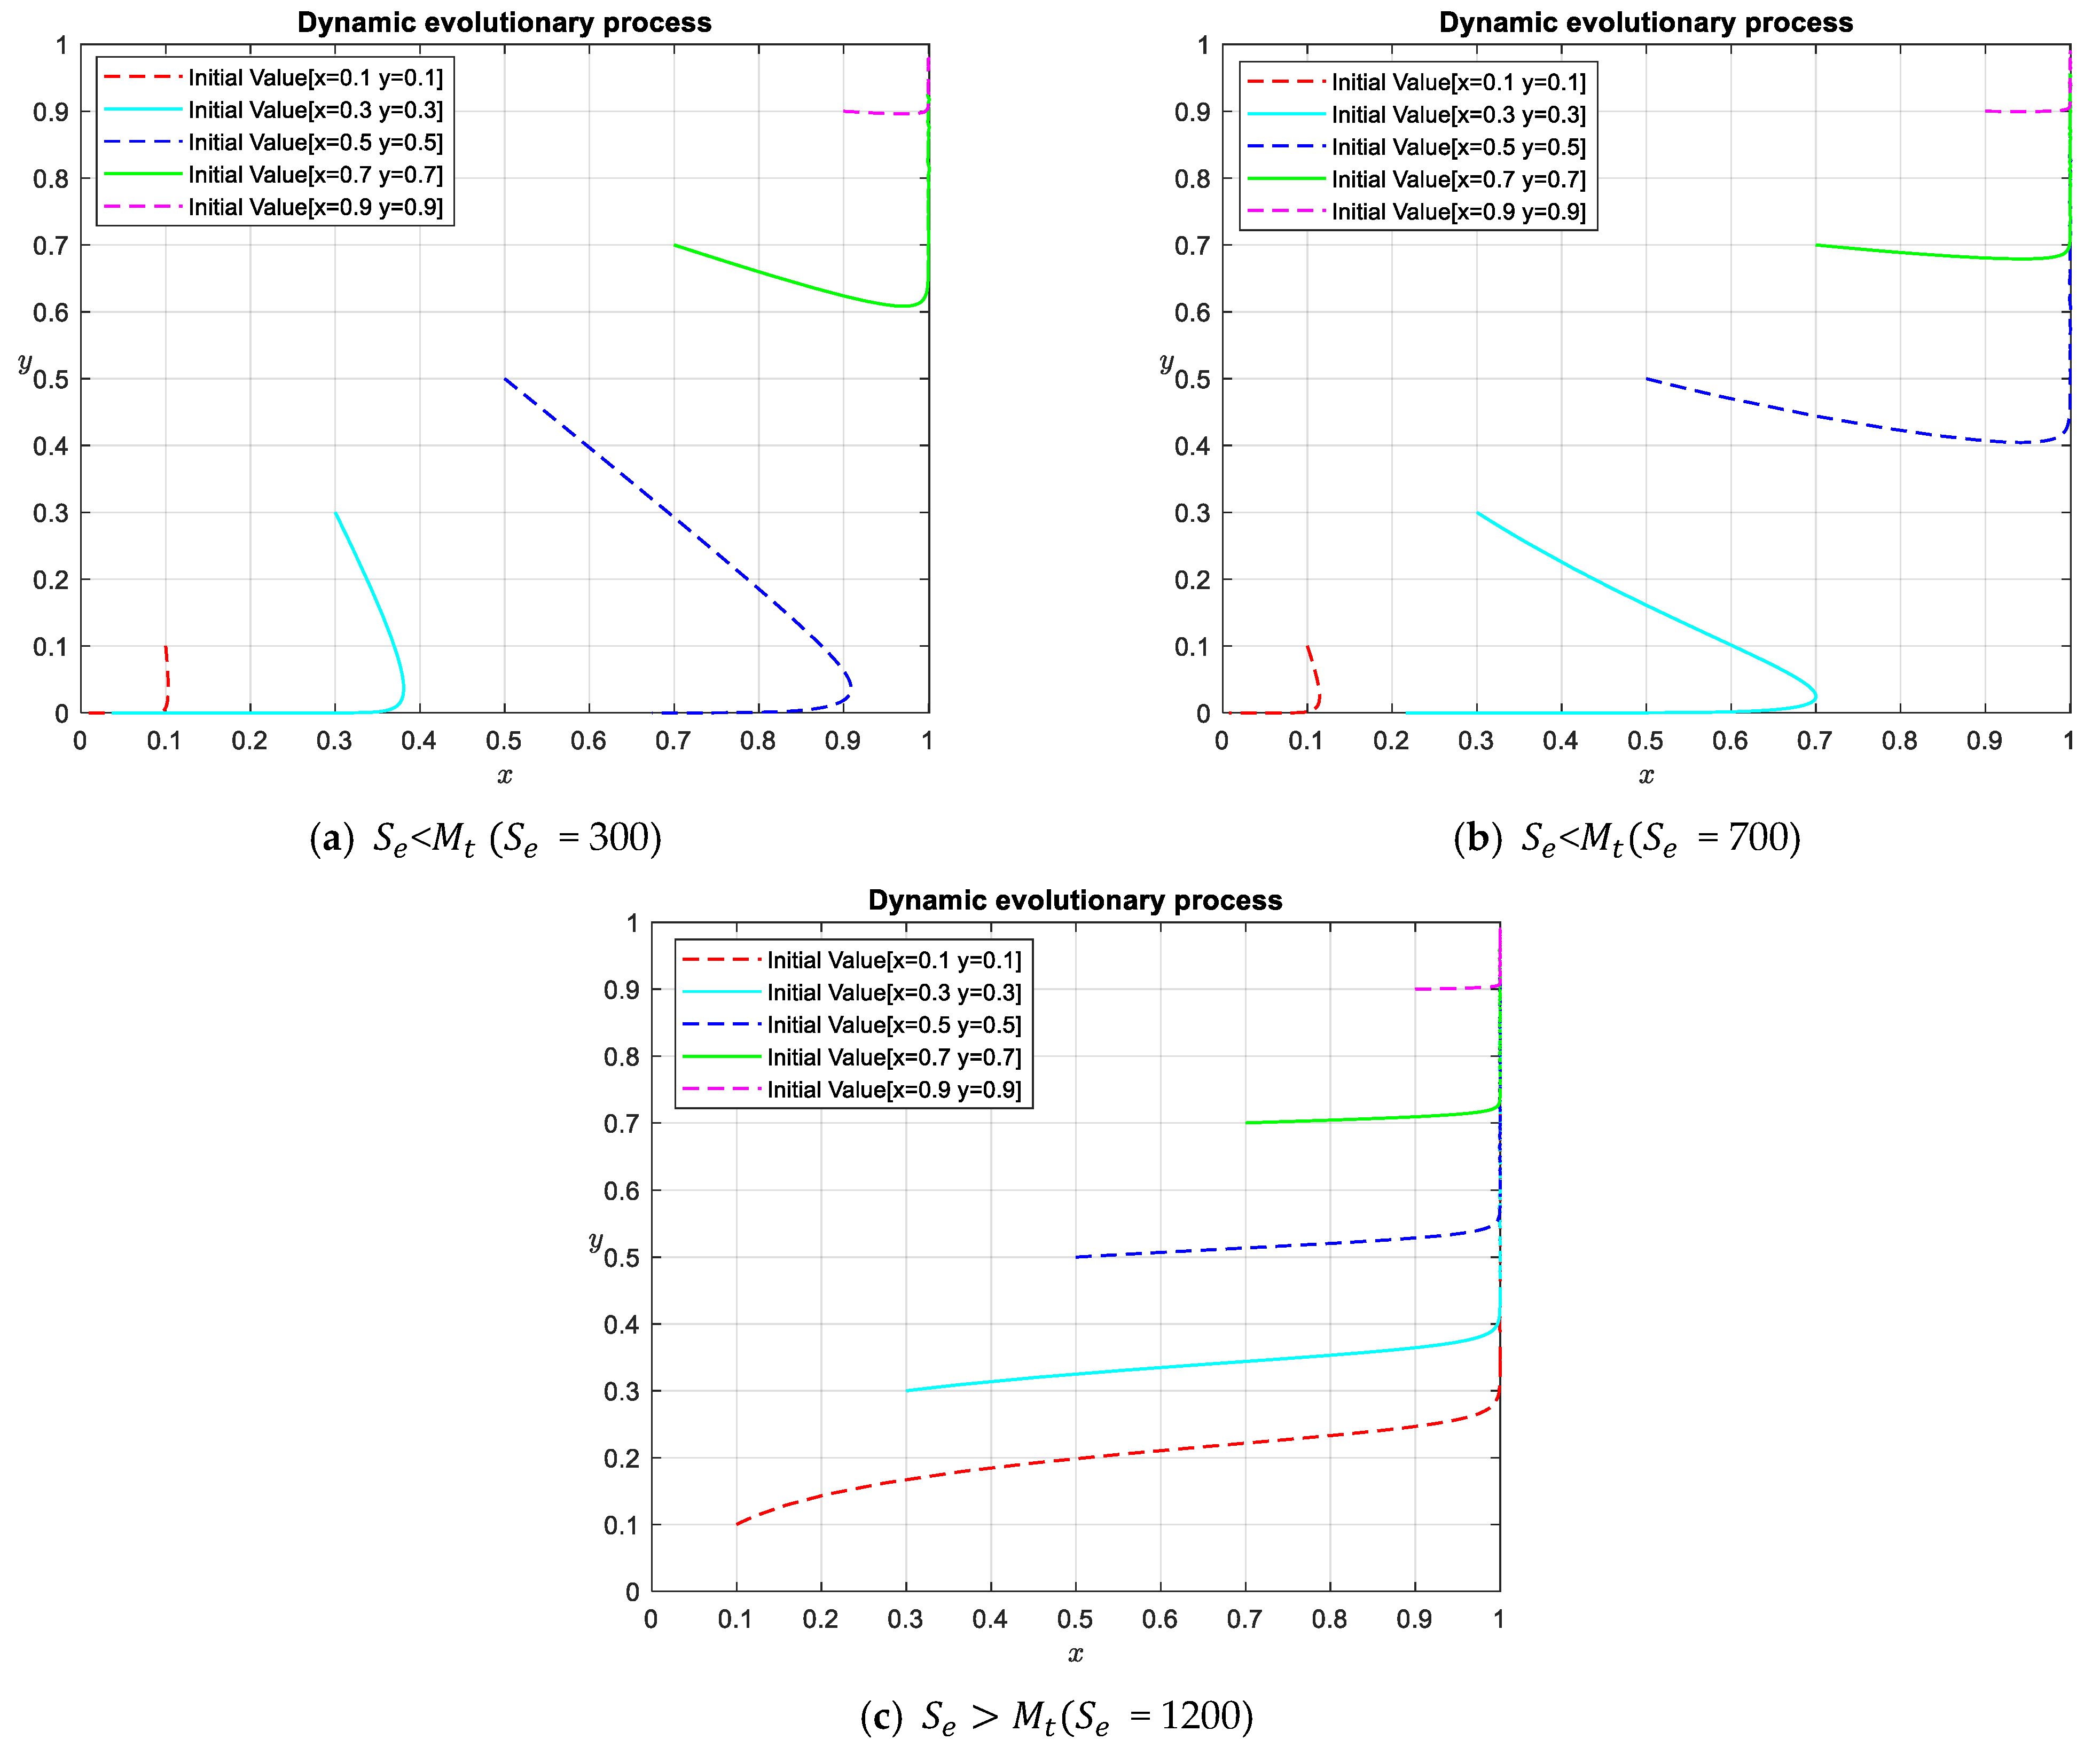
4.1. Impact of the Initial Probability on Replicated Dynamical Systems

The initial probabilities for the numerical simulation are taken as { x = 0.1 , y = 0.1 } ,   { x = 0.3 , y = 0.3 } ,   { x = 0.5 , y = 0.5 } ,   { x = 0.7 , y = 0.7 } ,   { x = 0.9 , y = 0.9 } . As can be seen from Figure 2, changing the initial probability of each game participant’s strategy choice has a significant impact on the overall trend of system evolution, from the process of changing the behavior strategies of the participating subjects, all with low probability to high probability, the willingness of the local government in the Yellow River Basin to subsidize increases gradually, and the willingness of energy companies to use integrated energy increases. Finally, the game subject’s strategy stabilizes at {provide subsidies, use integrated energy}. Under the “double carbon” target, local governments in the Yellow River basin actively promote the energy mix transition, and energy companies actively respond to local government policies. Therefore, the initial probability combination of x = 0.7 and y = 0.7 is chosen in the subsequent simulation analysis.

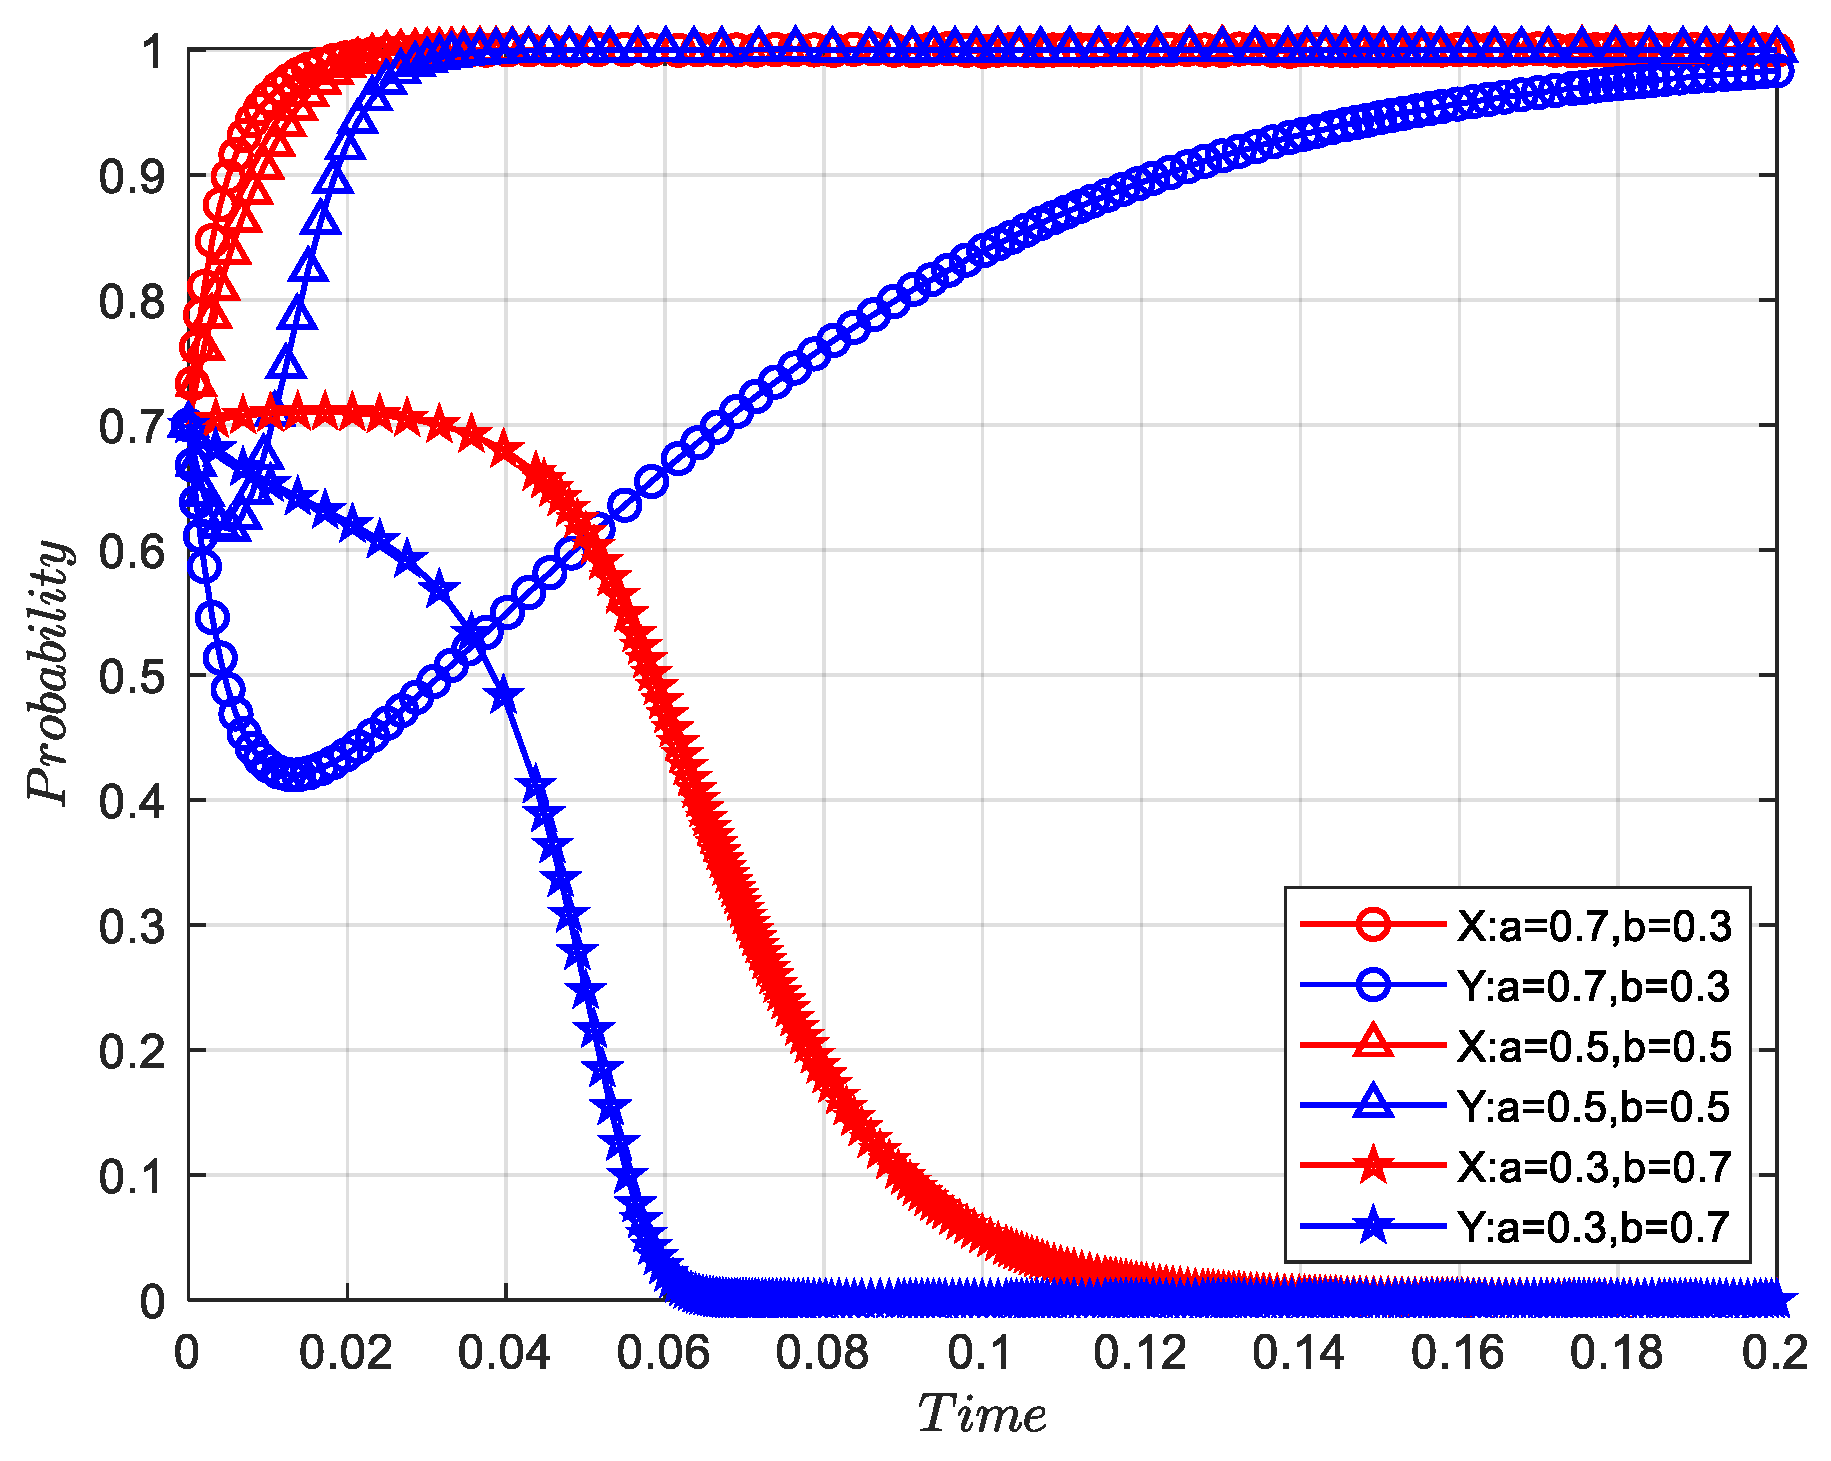
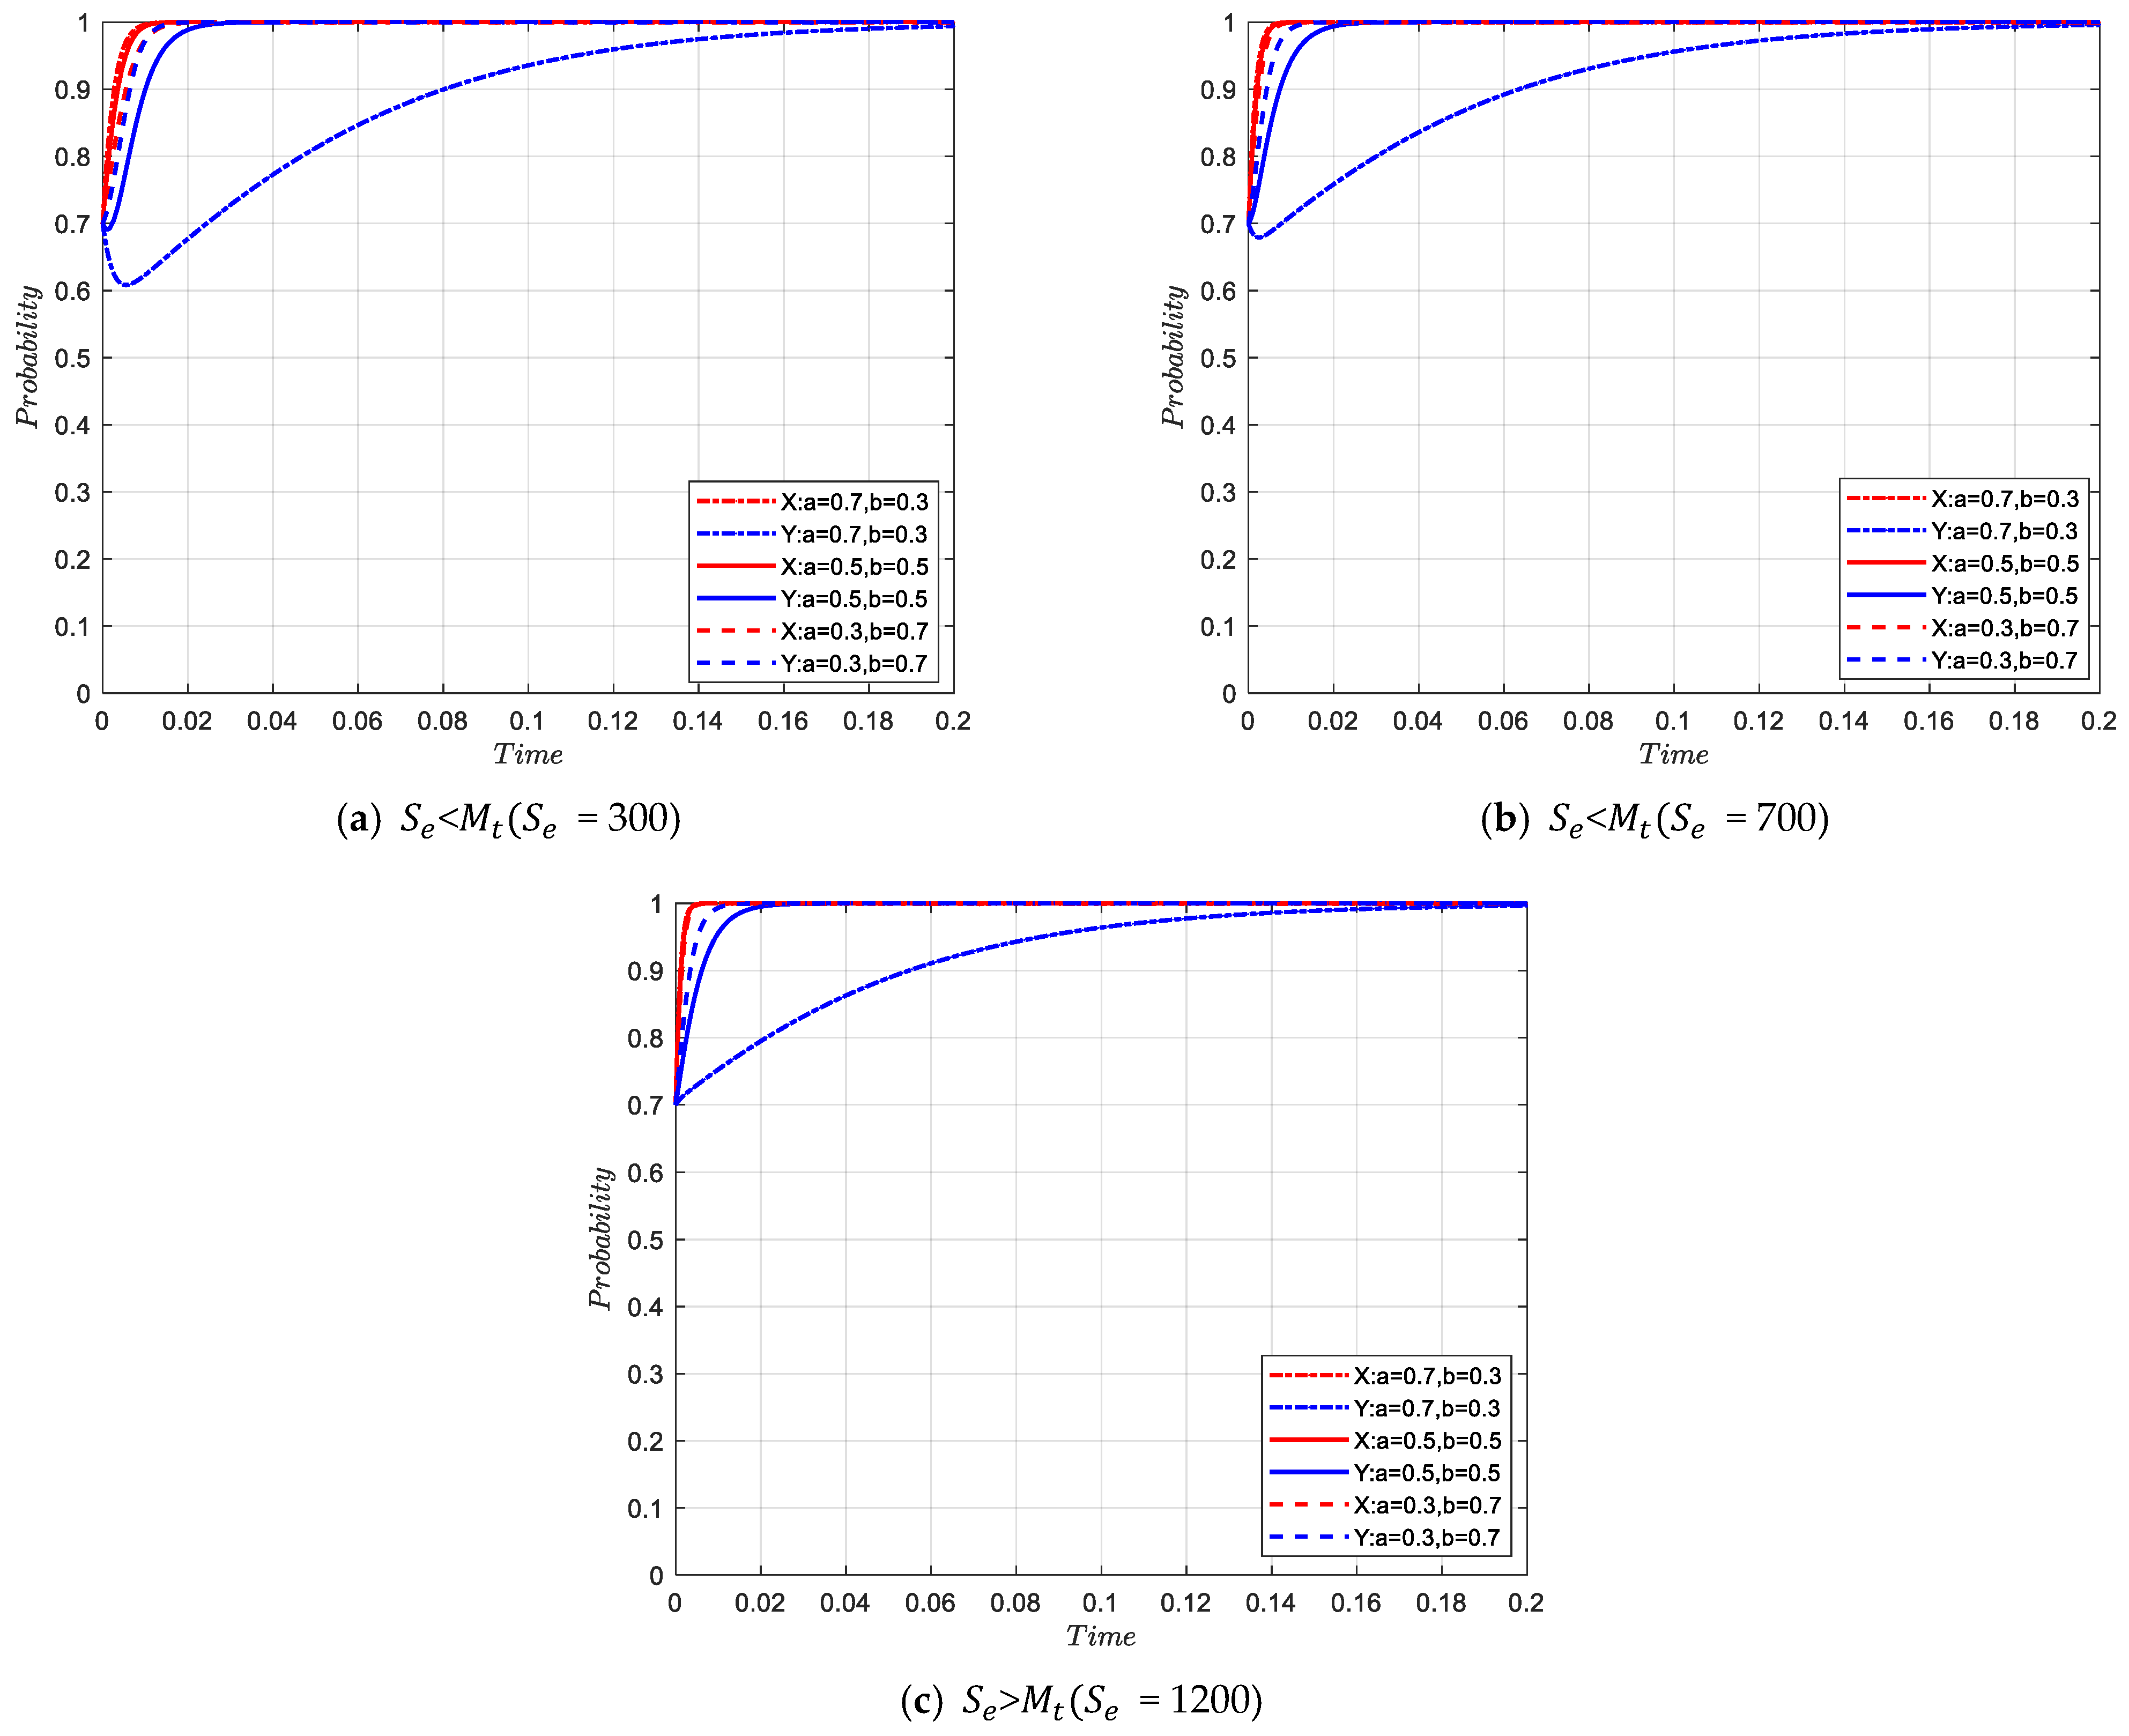
4.2. Impacts of Different Ratios of Clean and Renewable Energy Use of Traditional Energy on Replicating Dynamic Systems

The energy utilization proportions of the numerical simulation are taken as { a = 0.7 , b = 0.3 } ,   { a = 0.5 , b = 0.5 } ,   { a = 0.3 , b = 0.7 } . As can be seen from Figure 3, the change in the ratio of clean use of traditional energy to renewable, clean energy use has a significant effect on the stabilization trend of the system evolution: when the clean utilization of traditional energy accounts for a higher proportion of the integrated energy utilization, the strategy stability point of the game participant subject is (1,1). When renewable clean energy utilization accounts for a higher proportion of the integrated energy utilization, the strategy stability point of the game participant subject is (0,0). The ratio of clean use of traditional energy and clean, renewable energy use depends on the expected benefits from these two types of energy use and the government subsidies for both types of energy use. When the proportion of clean use of traditional energy is high, energy companies actively adopt advanced technologies to optimize the use of traditional energy in the context of the “double carbon” target, driven by local government subsidies and resource endowment in the Yellow River Basin, and the final strategy of local governments and energy companies tends to {provide subsidies to use integrated energy}. Similarly, as the share of renewable clean energy use in integrated energy use increases, the expected revenue from renewable, clean energy utilization also increases. However, due to the unstable and discontinuous nature of renewable, clean energy, the increase in subsidies is not accompanied by an equal increase in expected revenue, and the final strategy of local governments and energy companies in the Yellow River Basin tends to be {no subsidies, use traditional energy}. This implies a more reasonable proportional structure for the clean use of traditional energy and renewable, clean energy use in the integrated energy use structure in order to drive the strategic choices of the game players {providing subsidies to use integrated energy}. Meanwhile, to match the actual energy use in the Yellow River basin, a combination of a = 0.7 and b = 0.3 energy use proportions is chosen in the subsequent simulation analysis.

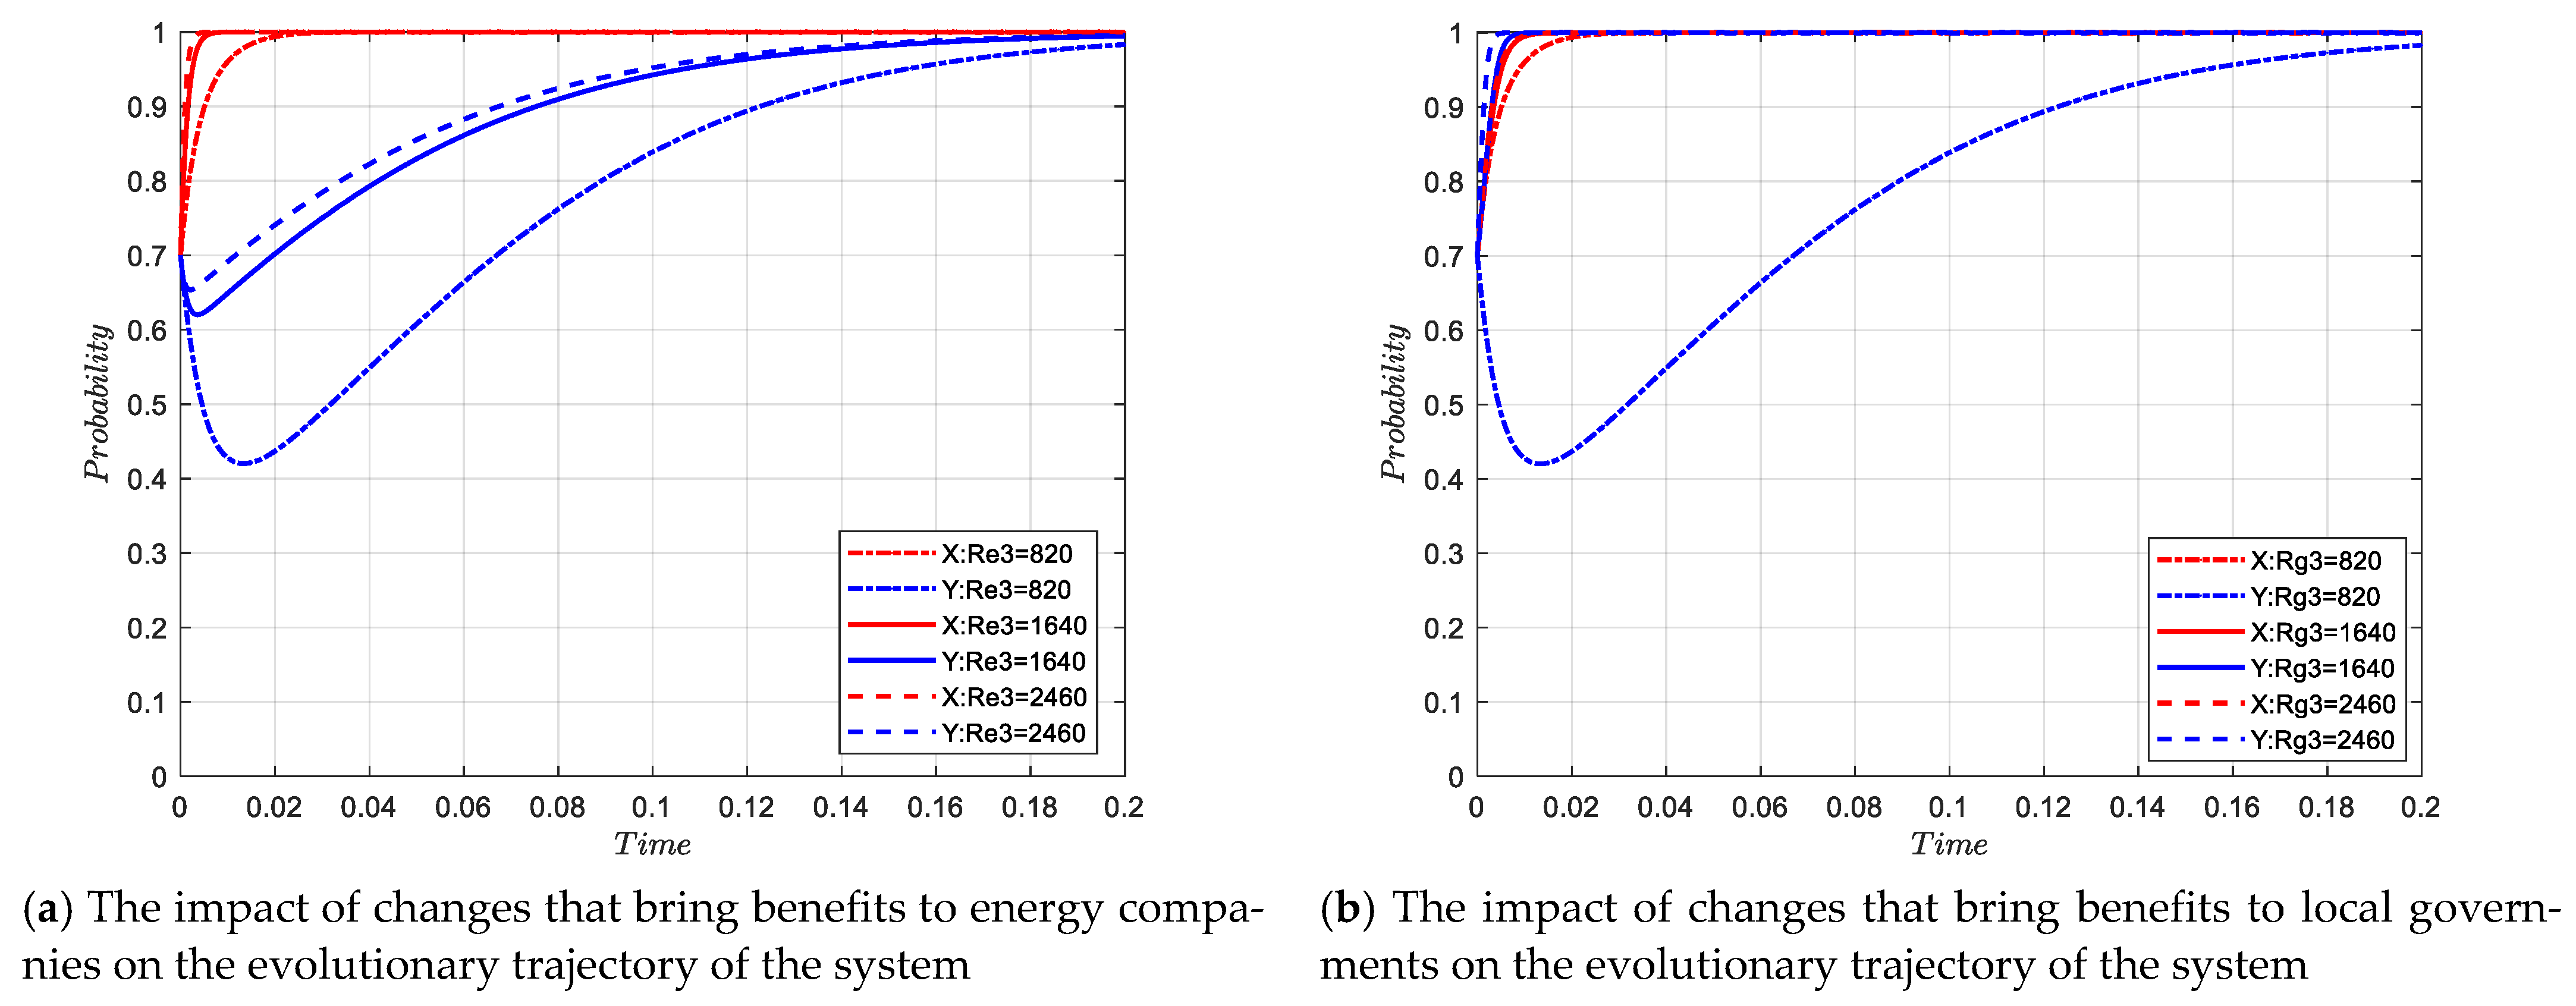
4.3. Impact of Changes in Energy System Resilience Gains Re3 and Rg3 on Replicated Dynamic Systems

Setting R e 3 and R g 3 to 820, 1640, and 2460, respectively, representing the increasing benefits to both participating parties as the energy system’s resilience increases, it can be obtained from Figure 4 that as the benefits from energy system resilience increase, the time that energy companies choose to reach stability using integrated energy strategies becomes progressively shorter. The earnings from the energy system’s resilience arises from enhancing the capacity to utilize both traditional and renewable, clean energy sources. Local government subsidy policies drive energy companies to pursue integrated energy use actively. However, government subsidies for renewable, clean energy use outweigh the benefits they receive in terms of energy system resilience improvement when renewable, clean energy use capacity is weak. Overall, integrated energy use involving traditional clean energy use capacity is strong, and the renewable, clean energy use capacity is weak. Due to the large subsidy gap in renewable, clean energy use, some energy companies have insufficient incentives for renewable, clean energy utilization, driving a gradual decline in the overall willingness of local governments to subsidize it, which in turn leads to a restriction on the ability to utilize renewable, clean energy. With the improvement of renewable, clean energy utilization capacity, the subsidies provided by local governments for renewable, clean energy utilization are smaller than the benefits brought to them by the improvement of energy system resilience, and the willingness of local governments to subsidize renewable, clean energy is gradually increased. The final game subject strategy is stabilized at (1,1). As energy system resilience brings increasing benefits to energy companies, the magnitude of local government subsidies that first fall and then rise gradually decreases. As seen in Figure 4a, energy companies’ gains in increasing energy system resilience are not directly fed back to local governments, so even if energy companies’ renewable, clean energy utilization capacity increases, it will not change the overall trend of the subsidy strategy.
As seen from Figure 4b, the willingness of local governments to subsidize energy companies in the Yellow River Basin decreases and then increases from the initial time point, then gradually increases at the end. This is because initially when energy companies are not strong in renewable energy utilization, energy system resilience enhancement brings fewer benefits to local governments and does not fluctuate much in terms of local government strategy choices. While with the enhancement of renewable, clean energy utilization capacity, the resulting increase in the resilient benefits of the energy system, the gap between the local government’s subsidies for renewable, clean energy and its resilient benefits for the energy system keeps narrowing. For this reason, the local government adjusts its subsidy strategy in time. Eventually, the game participants’ strategies tend to a (1,1) steady state.
In sum, increased energy system resilience brings benefits to all players in the game. For local governments, the benefits of increased energy resilience are weighed against the subsidies provided, subsidies for traditional energy utilization can meet the increased capacity for clean utilization of traditional energy in integrated energy utilization, and the willingness of local governments to subsidize will only gradually increase when subsidies for renewable, clean energy utilization are smaller than the benefits from increased energy resilience. Local governments are more sensitive to the benefits of increasing their energy system resilience than the benefits of increasing the energy system resilience of energy companies. Compared with local governments, both types of energy utilization capacity improvements lead to increased energy system resilience gains. Hence, the gains from increased energy system resilience have little impact on the strategic choice of energy companies, whose ultimate strategy favors integrated energy utilization.

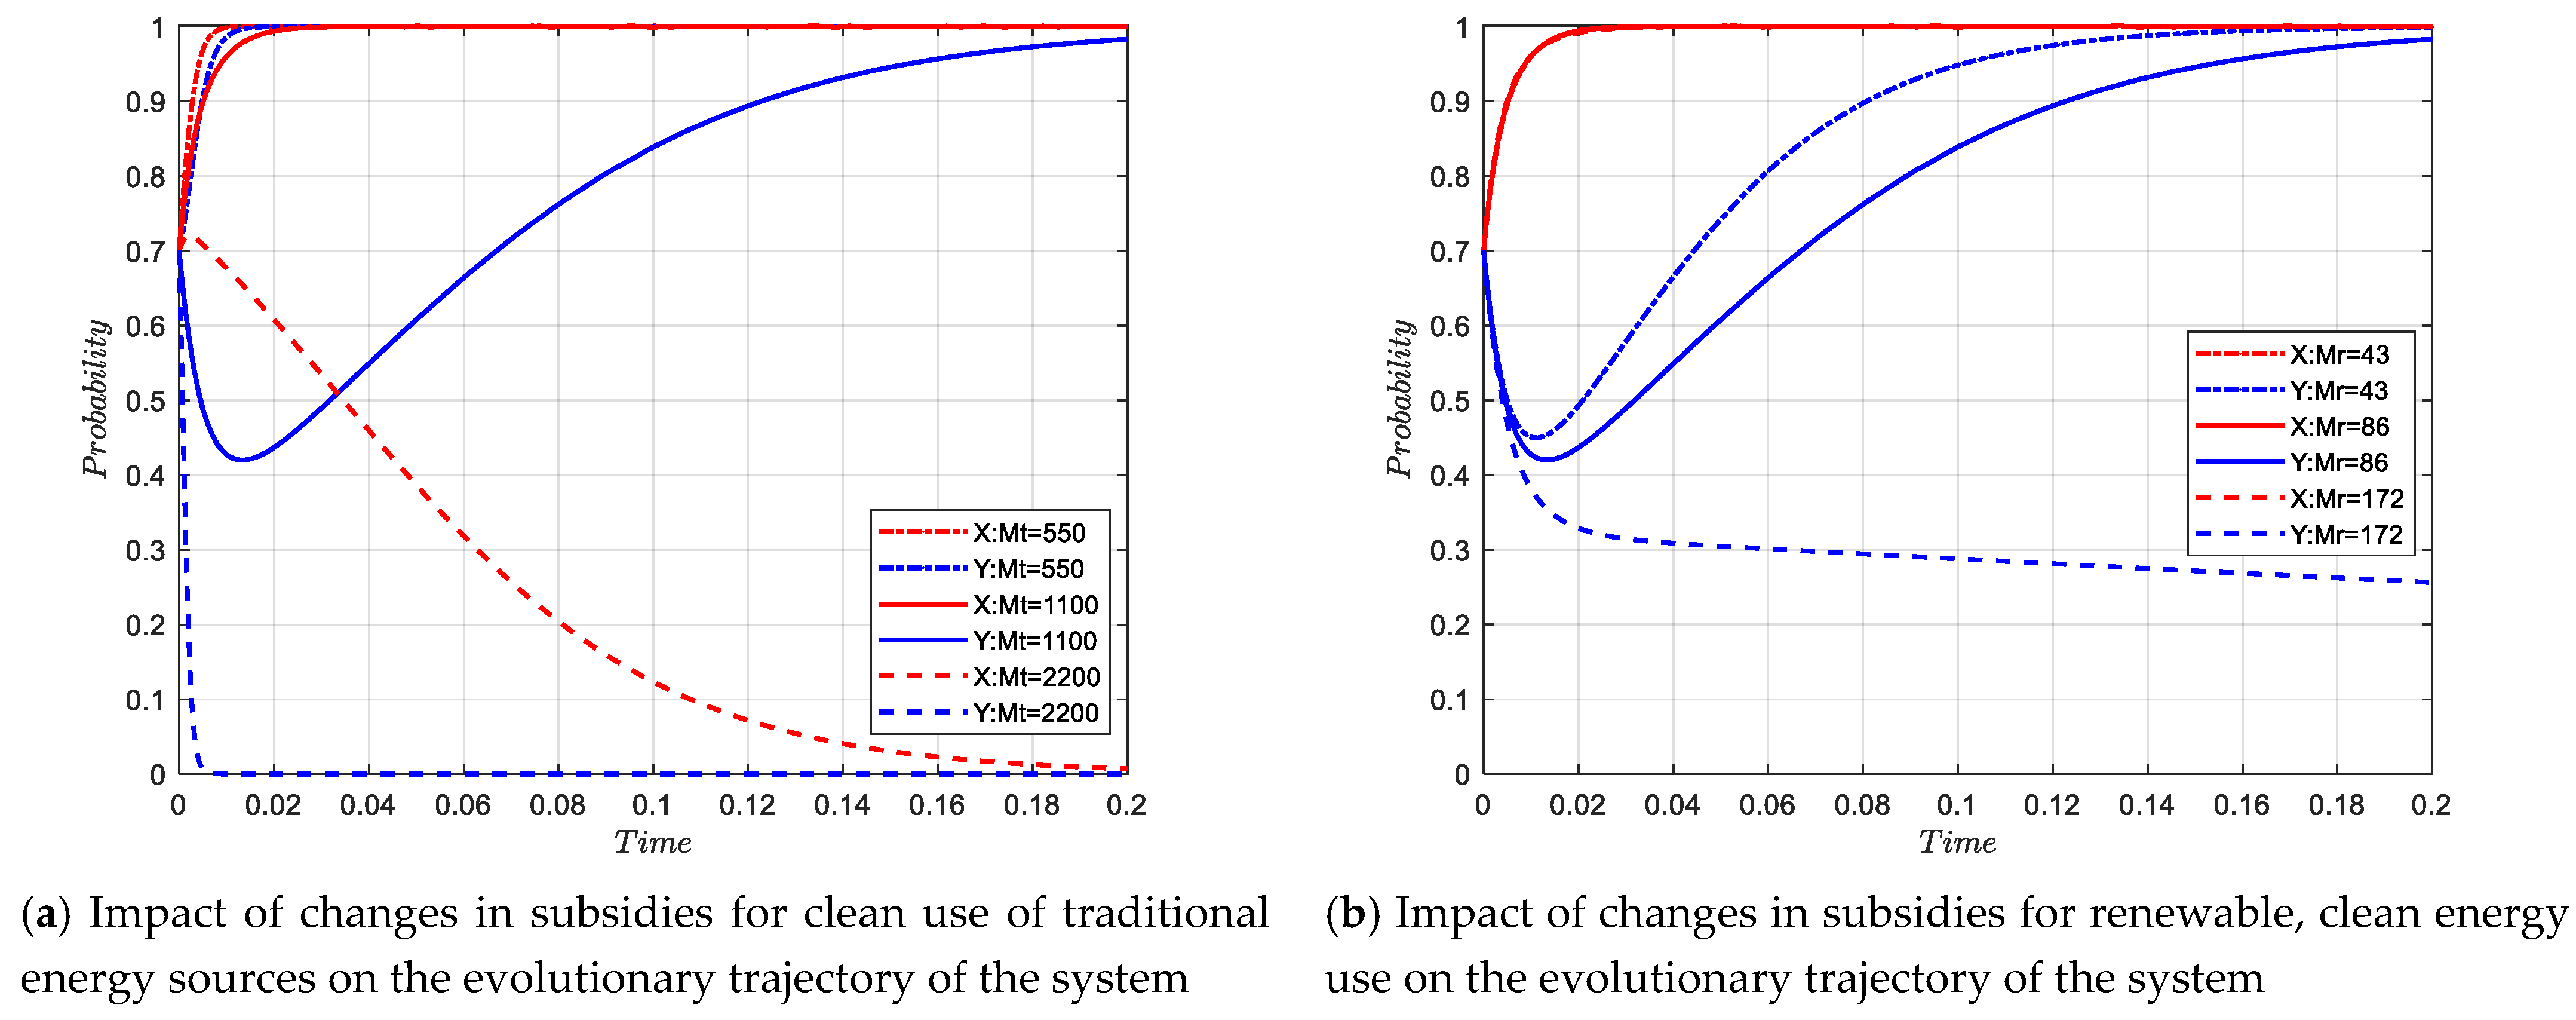
4.4. Impact of Changes in Local Government Subsidy Parameters Mt and Mr on Replicated Dynamic Systems

The M t was set to 550, 1100, and 2200 to represent the variations in low, medium, and high subsidies. The simulation results are shown in Figure 5a. The local government’s subsidy for the clean use of traditional energy depends on the share of traditional energy in the integrated energy use and the benefit from the clean use of traditional energy for the local government. When subsidies are low, local governments actively invest in subsidies to promote the energy mix transformation in the Yellow River Basin in the context of the “double carbon” target. As subsidies increase, local governments will measure whether the subsidies they put in match the benefits they receive. Since the resource endowment of the Yellow River Basin determines the clean use of traditional energy as the focus of energy utilization, and the revenue from the clean use of traditional energy can meet the purpose of providing subsidies, the ultimate strategy of the local government is still to subsidize. The above two phases show that the change in the energy use strategy of energy companies is not affected, because the ultimate strategy of local governments is to provide subsidies for the clean use of traditional energy sources. However, as subsidies are further increased, and local governments are over-subsidized compared to the benefits brought by energy companies, the incentive for energy companies to utilize traditional energy clean technologies is gradually weakening. Furthermore, under the subsidy policy of the local government, energy companies will receive subsidies for the clean use of traditional energy even if they choose to use only traditional energy. The combined effect of these two aspects is that eventually, the strategy of energy companies favors the use of traditional energy, and local governments are also phasing out subsidies. In other words, the system evolution stabilization point will transition from (1,1) to (0,0) if the subsidy parameter is too large. Therefore, subsidies for the clean use of traditional energy need to be limited to a range to ensure that the subsidies provided by local governments for the clean use of traditional energy match the proceeds received, while satisfying a reasonable ratio between the clean use of traditional energy and renewable, clean energy use.
The M r was set to 43, 86, and 172 to represent the changes in low, medium, and high subsidies, as shown in Figure 5b. Local government subsidies for renewable, clean energy use depend on the share of renewable, clean energy in the integrated energy use and the revenue that renewable, clean energy use generates for local governments. Due to the instability and uncontrollability of renewable, clean energy use, local governments provide fewer subsidies for renewable, clean energy use when weighing the benefits and inputs. With the further implementation of renewable, clean energy utilization policies, the capacity of energy companies to utilize renewable and clean energy is enhanced, and the gap between the subsidies provided by local governments and the income from renewable energy utilization is narrowing, and subsidies from local governments are increasing. As renewable, clean energy technologies continue to mature and the ensuing revenues gradually cover government subsidies, local governments are providing tighter subsidies for renewable, clean energy use, a move that effectively promotes competition in the renewable energy market. In combination with (a) and (b), a range of subsidies needs to be set for clean traditional energy use and on-demand subsidies for renewable, clean energy use to induce the game players to reach an evolutionary equilibrium state of {no subsidies, integrated energy use.

4.5. Impact of The Introduction of Penalty Parameters on Replicated Dynamic Systems

From Section 4.4, it can be seen that the subsidy parameter M t for the clean use of traditional energy by the local government in the Yellow River Basin is too large, which will make the system’s evolutionary stability point (0,0). When     S e < M t , energy companies are still subsidized at this point for energy security considerations, although there are penalties for not using traditional energy cleanly. When   S e > M t , the energy companies’ traditional clean energy utilization technology has been relatively mature, the improvement of renewable, clean energy utilization capacity plays a key role in the integrated energy utilization. The energy companies will be punished if they do not carry out renewable, clean energy utilization. At this time, the energy companies are in the state of being punished. In summary, changes in the penalty parameters affect the strategy choice of participating subjects. Therefore, we mainly discuss the influence of changes in the punishment parameters on the evolutionary trajectory of the system. The range of penalty parameters is divided into three categories, as shown in Figure 6.
Situation  I  ( S e < M t ,  S e  = 300): Figure 6a illustrates that when the penalty parameter is small, compared to Figure 2, it does not change the overall trend of the initial probability of the game participants’ strategy choice on the system’s evolution. Figure 7a illustrates that the introduction of the penalty parameter does not change the strategy choice of the game participants {providing subsidies, integrated energy use}. When the ratio of the clean use of traditional energy to renewable, clean energy use is large, compared to Figure 3, and when the ratio of renewable, clean energy use to traditional clean energy use is larger, the local government penalizes energy companies for not utilizing integrated energy. This penalty increases the opportunity for integrated energy use by energy companies, which makes the strategy choice of game participants change from {no subsidy, use traditional energy} to {provide subsidies, use integrated energy}. In summary, the smaller penalty parameter has less influence on the willingness of the game participants to transform the energy structure, and the introduction of the smaller penalty parameter also regulates the behavior of energy companies in integrated energy utilization, which makes the clean utilization of traditional energy steadily improve.
Situation  II  ( S e < M t ,  S e  = 700): Figure 6b illustrates that, compared to Figure 6a, as the penalty parameter increases, it decreases the probability that the strategy choice of the game participants tends to stabilize the point of system evolution, which means that a specific range of penalty parameters increases the implementation of energy structure transformation policies by local governments and energy companies. Figure 7b does not change the final tendency of the game participants’ strategy choice, compared to Figure 7a. The difference is that the increase in the penalty parameter reduces the magnitude of the local government’s willingness to subsidize first down and then up when the ratio of clean use of traditional energy to renewable, clean energy is large, indicating that the increase in the penalty parameters decreases the difference between the absolute value of local government subsidies and penalties, and the benefits that energy firms bring to local governments. In summary, it can be concluded that a larger penalty parameter has a more significant impact on the willingness of the game participants to carry out energy structure transformation, and the introduction of a larger penalty parameters also makes energy companies further strengthen their ability to use traditional energy more cleanly.
Situation  III  ( S e > M t ,  S e  = 1200): Figure 6c illustrates that when S e > M t , the initial probability of changing the strategy choice of the game subject has no effect on the overall evolutionary trend of the system. This phenomenon suggests that the willingness of local governments and energy companies in the Yellow River Basin to implement energy structural transformation policies is strong when the penalty parameter is large. Figure 7a–c illustrates that the larger penalty parameter makes local governments progressively more willing to subsidize when the ratio of clean use of traditional energy to renewable, clean energy use is larger. In summary, larger penalty parameters significantly impact the game participants’ willingness to transform the energy mix. An increase in the penalty parameters leads to the maturation of technologies for the clean use of traditional energy sources. Moreover, it enhances the capacity of renewable, clean energy use, and a larger penalty increases the cost of using traditional energy sources for energy companies, forcing them to participate in integrated energy use actively.
To sum up, for the clean utilization of traditional energy, the introduction of penalty parameters can further improve the clean utilization capacity of traditional energy. When the utilization capacity of renewable, clean energy is not strong, in addition to considering penalties to restrain the behavior of energy companies, it is also necessary to determine the degree of subsidy according to the level of renewable, clean energy utilization technology. The increase in the penalty parameters causes the strategy choices of the game participants {provision of subsidies and integrated energy use} to converge to a steady state in a relatively short period of time. When M t dominates, the penalty parameter drives the clean utilization capacity of conventional energy sources. In contrast, when S e dominates, the penalty parameter drives the clean utilization capacity of renewable energy sources. Thus, on the basis of ensuring energy security, punitive parameters are introduced to constrain energy companies’ energy use choices and force them to move towards integrated energy use.

4.6. Summary

Combining the above five points, the following three points are summarized: (1) the initial willingness of the participating parties in the Yellow River Basin has a significant influence on the transformation of the energy structure; (2) a reasonable proportion of clean utilization of traditional energy and renewable, clean energy utilization can promote the sustainable development of the Yellow River Basin; and (3) changes in the benefits from the increased resilience of the Yellow River Basin energy system and the relative magnitude of the subsidy and penalty parameters influence the strategic choices of the participants. These findings have important implications for the transformation of the energy mix in the Yellow River Basin. These results are also significant for energy structure transformation in other regions. However, when applied to other regions, the local resource endowments, development levels, and policy implementation conditions need to be considered.

5. Conclusions and Policy Implications

5.1. Conclusions and Recommendations

Based on the unique resource endowment of the Yellow River Basin, with the clean utilization of traditional energy and renewable, clean energy utilization as the goal of energy structure transformation, this paper constructs an evolutionary game model for both local governments and energy companies, and the key factors affecting the strategy choice of the game participants are analyzed (as shown in Figure 8). The following conclusions and recommendations are obtained:
(1)
The high ratio of clean utilization of traditional energy and the low ratio of renewable, clean energy can promote the transformation of the energy structure in the Yellow River Basin. Therefore, based on the resource endowment of the Yellow River Basin and the utilization of renewable and clean energy, while ensuring a reasonable utilization ratio for the two energy sources, the pace of clean utilization of traditional energy sources in the Yellow River Basin should be accelerated. Moreover, while increasing the ability to utilize renewable clean energy technologies, clean technologies, such as CCUS [47,48], should be vigorously developed, and renewable clean energy sources, such as solar, wind, and hydro energy, should be cultivated actively;
(2)
The strategic choices of energy companies are influenced by the capacity for both types of energy utilization, while the strategic choices of local governments are primarily influenced by the capacity for renewable, clean energy utilization. Therefore, for energy companies, it is a top priority to improve the technology level for the clean use of traditional energy and carry out special technical research on the use of renewable energy to improve the ability to use both types of energy. For local governments, improving the sensitivity of energy system resilience according to energy companies’ revenue generation and increasing subsidies for renewable, clean energy utilization play a crucial role in the energy structure transformation by energy companies;
(3)
The introduction of penalty parameters not only ensures a reasonable range of subsidies for the clean utilization of traditional energy, but also provides a guarantee for the maturation of renewable, clean energy utilization technologies. Therefore, a better combination of subsidy and penalty parameters can motivate local governments and energy companies to move toward integrated energy use. When energy companies are driven by innovation to improve the clean utilization of traditional energy sources and master the core technology of renewable, clean energy utilization, this move is of great value to the transformation of the energy structure in the Yellow River Basin;
(4)
In the short term, the clean use of traditional energy is the most economically feasible option, and the impact of one strategy on the other between energy companies and local governments is not significant at this stage. In the medium and long term, renewable, clean energy in the Yellow River Basin can enter a whole new stage of development, and the impact of the interaction between the two strategies is very significant at this stage. Therefore, combined with China’s energy transition trend, in the short term, to balance economic and environmental sustainability, it is necessary to improve the level of technology for the clean and efficient utilization of traditional energy, i.e., the energy transition should take moderate means. In the medium and long term, scientific development planning for renewable, clean energy and the active promotion of a high percentage of renewable, clean energy utilization should be implemented to meet the growing energy demand.

5.2. Limitations and Future Research

This study enriches the scope of research on energy structure transformation in the Yellow River Basin by examining the energy structure transformation path for the inclusive development of traditional energy use and renewable, clean energy use in the Yellow River Basin, which is of great significance for the high-quality development of the Yellow River Basin. However, this paper assumes that energy system resilience enhancement brings benefits to local governments and energy companies, but the sensitivity of local government subsidy strategies to bring the same benefits to different participants is not the same, and how to build a data sharing and exchange platform related to energy system resilience benefits is an important issue that needs to be addressed. Furthermore, this paper considers the integrated energy use pattern under different ratios of traditional energy clean use and renewable, clean energy use in the Yellow River Basin and how to functionalize this relationship to fit the changing trend of energy use in the region as a direction of future research.

Author Contributions

Conceptualization, X.L.; methodology, X.L.; software, Y.S.; writing—original draft preparation, X.L.; writing—review and editing, Y.S.; supervision, Y.L. All authors have read and agreed to the published version of the manuscript.

Funding

This research was funded by the Research Project Supported by Shanxi Scholarship Council of China (Grant No. 2022-085) and the Graduate Education Innovation Project of Shanxi Province (Grant No. 2022Y260).

Institutional Review Board Statement

Not applicable.

Informed Consent Statement

Not applicable.

Data Availability Statement

Not applicable.

Acknowledgments

We thank the anonymous reviewers for their insightful comments, but we bear all responsibility for the paper.

Conflicts of Interest

The authors declare no conflict of interest.

References

  1. Xu, M.; Zhang, X.; Shen, S.; Wei, S.; Fan, J.L. Assessment of potential, cost, and environmental benefits of CCS-EWR technology for coal-fired power plants in Yellow River Basin of China. J. Environ. Manag. 2021, 292, 112717. [Google Scholar] [CrossRef] [PubMed]
  2. Guo, Y.; Ming, B.; Huang, Q.; Wang, Y.; Zheng, X.; Zhang, W. Risk-averse day-ahead generation scheduling of hydro–wind–photovoltaic complementary systems considering the steady requirement of power delivery. Appl. Energy 2022, 309, 118467. [Google Scholar] [CrossRef]
  3. Zhang, F.; Gallagher, K.S.; Myslikova, Z.; Narassimhan, E.; Bhandary, R.R.; Huang, P. From fossil to low carbon: The evolution of global public energy innovation. WIREs Clim. Change 2021, 12, e734. [Google Scholar] [CrossRef]
  4. Lin, B.; Li, Z. Towards world’s low carbon development: The role of clean energy. Appl. Energy 2022, 307, 118160. [Google Scholar] [CrossRef]
  5. Li, Y.; Zhang, B.; Wang, B.; Wang, Z. Evolutionary trend of the coal industry chain in China: Evidence from the analysis of I-O and APL model. Resour. Conserv. Recycl. 2019, 145, 399–410. [Google Scholar] [CrossRef]
  6. Tian, J.; Yu, L.; Xue, R.; Zhuang, S.; Shan, Y. Global low-carbon energy transition in the post-COVID-19 era. Appl. Energy 2022, 307, 118205. [Google Scholar] [CrossRef]
  7. Chen, W.; Hu, Z.-H. Using evolutionary game theory to study governments and manufacturers’ behavioral strategies under various carbon taxes and subsidies. J. Clean. Prod. 2018, 201, 123–141. [Google Scholar] [CrossRef]
  8. Fan, R.; Dong, L. The dynamic analysis and simulation of government subsidy strategies in low-carbon diffusion considering the behavior of heterogeneous agents. Energy Policy 2018, 117, 252–262. [Google Scholar] [CrossRef]
  9. Zheng, S.; Yu, L. The government’s subsidy strategy of carbon-sink fishery based on evolutionary game. Energy 2022, 254, 124282. [Google Scholar] [CrossRef]
  10. Guo, P.; Kong, J.; Guo, Y.; Liu, X. Identifying the influencing factors of the sustainable energy transitions in China. J. Clean. Prod. 2019, 215, 757–766. [Google Scholar] [CrossRef]
  11. Maswabi, M.G.; Chun, J.; Chung, S.-Y. Barriers to energy transition: A case of Botswana. Energy Policy 2021, 158, 112514. [Google Scholar] [CrossRef]
  12. Zhang, S.; Shinwari, R.; Zhao, S.; Dagestani, A.A. Energy transition, geopolitical risk, and natural resources extraction: A novel perspective of energy transition and resources extraction. Resour. Policy 2023, 83, 103608. [Google Scholar] [CrossRef]
  13. Khan, I.; Hou, F.; Zakari, A.; Tawiah, V.K. The dynamic links among energy transitions, energy consumption, and sustainable economic growth: A novel framework for IEA countries. Energy 2021, 222, 119935. [Google Scholar] [CrossRef]
  14. Liu, H.; Khan, I.; Zakari, A.; Alharthi, M. Roles of trilemma in the world energy sector and transition towards sustainable energy: A study of economic growth and the environment. Energy Policy 2022, 170, 113238. [Google Scholar] [CrossRef]
  15. Kern, F.; Smith, A. Restructuring energy systems for sustainability? Energy transition policy in the Netherlands. Energy Policy 2008, 36, 4093–4103. [Google Scholar] [CrossRef]
  16. Haas, T. Comparing energy transitions in Germany and Spain using a political economy perspective. Environ. Innov. Soc. Transit. 2019, 31, 200–210. [Google Scholar] [CrossRef]
  17. Gulagi, A.; Ram, M.; Solomon, A.A.; Khan, M.; Breyer, C. Current energy policies and possible transition scenarios adopting renewable energy: A case study for Bangladesh. Renew. Energy 2020, 155, 899–920. [Google Scholar] [CrossRef]
  18. Adewuyi, O.B.; Kiptoo, M.K.; Afolayan, A.F.; Amara, T.; Alawode, O.I.; Senjyu, T. Challenges and prospects of Nigeria’s sustainable energy transition with lessons from other countries’ experiences. Energy Rep. 2020, 6, 993–1009. [Google Scholar] [CrossRef]
  19. Chen, B.; Xiong, R.; Li, H.; Sun, Q.; Yang, J. Pathways for sustainable energy transition. J. Clean. Prod. 2019, 228, 1564–1571. [Google Scholar] [CrossRef]
  20. Li, T.; Liu, P.; Li, Z. Quantitative relationship between low-carbon pathways and system transition costs based on a multi-period and multi-regional energy infrastructure planning approach: A case study of China. Renew. Sustain. Energy Rev. 2020, 134, 110159. [Google Scholar] [CrossRef]
  21. Gardumi, F.; Keppo, I.; Howells, M.; Pye, S.; Avgerinopoulos, G.; Lekavičius, V.; Galinis, A.; Martišauskas, L.; Fahl, U.; Korkmaz, P.; et al. Carrying out a multi-model integrated assessment of European energy transition pathways: Challenges and benefits. Energy 2022, 258, 124329. [Google Scholar] [CrossRef]
  22. Su, X.; Tan, J. Regional energy transition path and the role of government support and resource endowment in China. Renew. Sustain. Energy Rev. 2023, 174, 113150. [Google Scholar] [CrossRef]
  23. Kong, L.-S.; Tan, X.-C.; Gu, B.-H.; Yan, H.-S. Significance of achieving carbon neutrality by 2060 on China’s energy transition pathway: A multi-model comparison analysis. Adv. Clim. Change Res. 2023, 14, 32–42. [Google Scholar] [CrossRef]
  24. Tian, T.; Sun, S. Low-carbon transition pathways in the context of carbon-neutral: A quadrilateral evolutionary game analysis. J. Environ. Manag. 2022, 322, 116105. [Google Scholar] [CrossRef]
  25. Li, J.; Li, M. Research of Carbon Emission Reduction Potentials in the Yellow River Basin, Based on Cluster Analysis and the Logarithmic Mean Divisia Index (LMDI) Method. Sustainability 2022, 14, 5284. [Google Scholar] [CrossRef]
  26. Sun, X.; Zhang, H.; Ahmad, M.; Xue, C. Analysis of influencing factors of carbon emissions in resource-based cities in the Yellow River basin under carbon neutrality target. Environ. Sci. Pollut. Res. Int. 2022, 29, 23847–23860. [Google Scholar] [CrossRef]
  27. Xu, Y.; Liu, S.; Wang, J. Impact of environmental regulation intensity on green innovation efficiency in the Yellow River Basin, China. J. Clean. Prod. 2022, 373, 133789. [Google Scholar] [CrossRef]
  28. Zhao, K.; Zhang, R.; Liu, H.; Wang, G.; Sun, X. Resource Endowment, Industrial Structure, and Green Development of the Yellow River Basin. Sustainability 2021, 13, 4530. [Google Scholar] [CrossRef]
  29. Mao, J.; Wu, Q.; Zhu, M.; Lu, C. Effects of Environmental Regulation on Green Total Factor Productivity: An Evidence from the Yellow River Basin, China. Sustainability 2022, 14, 2015. [Google Scholar] [CrossRef]
  30. Zhou, Y.; Li, D.; Li, W.; Mei, D.; Zhong, J. Drag Effect of Economic Growth and Its Spatial Differences under the Constraints of Resources and Environment: Empirical Findings from China’s Yellow River Basin. Int. J. Environ. Res. Public Health 2022, 19, 3027. [Google Scholar] [CrossRef]
  31. Wang, H.; Tao, J.; Xu, J.; Li, Z. Positive or negative coordination? Spatiotemporal coupling analysis between economic growth and carbon neutrality in the Yellow River Basin. Energy Rep. 2023, 9, 140–153. [Google Scholar] [CrossRef]
  32. Song, M.; Zhang, L.; Gao, Y.; Li, E. Spatiotemporal evolution and influence mechanism of the carbon footprint of energy consumption at county level in the Yellow River Basin. Sci. Total Environ. 2023, 883, 163710. [Google Scholar] [CrossRef] [PubMed]
  33. Xia, Y.; Shi, J.; Zhao, Z.; Liu, Z.; Liu, X.; Zhang, C. Mapping the coal-water nexus in the Yellow River Basin. J. Clean. Prod. 2023, 411, 137249. [Google Scholar] [CrossRef]
  34. Wang, Y.; Song, J.; Sun, H. Coupling interactions and spatial equilibrium analysis of water-energy-food in the Yellow River Basin, China. Sustain. Cities Soc. 2023, 88, 104293. [Google Scholar] [CrossRef]
  35. Wang, S.; Yang, J.; Wang, A.; Liu, T.; Du, S.; Liang, S. Coordinated analysis and evaluation of water–energy–food coupling: A case study of the Yellow River basin in Shandong Province, China. Ecol. Indic. 2023, 148, 110138. [Google Scholar] [CrossRef]
  36. Luo, L.; Wang, Y.; Liu, Y.; Zhang, X.; Fang, X. Where is the pathway to sustainable urban development? Coupling coordination evaluation and configuration analysis between low-carbon development and eco-environment: A case study of the Yellow River Basin, China. Ecol. Indic. 2022, 144, 109473. [Google Scholar] [CrossRef]
  37. de Amorim, W.S.; Valduga, I.B.; Ribeiro, J.M.P.; Williamson, V.G.; Krauser, G.E.; Magtoto, M.K.; de Andrade Guerra, J.B.S.O. The nexus between water, energy, and food in the context of the global risks: An analysis of the interactions between food, water, and energy security. Environ. Impact Assess. Rev. 2018, 72, 1–11. [Google Scholar] [CrossRef]
  38. Zhang, T.Y.; Dong, L.Y.; Feng, X.M.; Tan, Q. Optimization model for enhancing water-use efficiency from the perspective of water-energy-food nexus. IOP Conf. Ser. Earth Environ. Sci. 2019, 344, 012130. [Google Scholar] [CrossRef]
  39. Maynard Smith, J. The theory of games and the evolution of animal conflicts. J. Theor. Biol. 1974, 47, 209–221. [Google Scholar] [CrossRef] [Green Version]
  40. Selten, R. Evolutionary stability in extensive two-person games—Correction and further development. Math. Soc. Sci. 1988, 16, 223–266. [Google Scholar] [CrossRef]
  41. Friedman, D. On economic applications of evolutionary game theory. J. Evol. Econ. 1998, 8, 15–43. [Google Scholar] [CrossRef] [Green Version]
  42. Wu, B.; Liu, P.; Xu, X. An evolutionary analysis of low-carbon strategies based on the government–enterprise game in the complex network context. J. Clean. Prod. 2017, 141, 168–179. [Google Scholar] [CrossRef]
  43. Jiao, J.; Chen, J.; Li, l.; LI, f. A Study of Local Governments’ and Enterprises’ Actions in the Carbon Emission Mechanism of Subsidy or Punishment Based on the Evolutionary Game. Chin. J. Manag. Sci. 2017, 25, 140–150. (In Chinese) [Google Scholar]
  44. Ahmadi, S.; Saboohi, Y.; Vakili, A. Frameworks, quantitative indicators, characters, and modeling approaches to analysis of energy system resilience: A review. Renew. Sustain. Energy Rev. 2021, 144, 110988. [Google Scholar] [CrossRef]
  45. Chai, R.; Li, G. Renewable clean energy and clean utilization of traditional energy:An evolutionary game model of energy structure transformation of power enterprises. Syst. Eng. Theory Pract. 2022, 42, 184–197. (In Chinese) [Google Scholar]
  46. Wang, X.-P.; Zhang, Z.-M.; Guo, Z.-H.; Su, C.; Sun, L.-H. Energy structure transformation in the context of carbon neutralization: Evolutionary game analysis based on inclusive development of coal and clean energy. J. Clean. Prod. 2023, 398, 136626. [Google Scholar] [CrossRef]
  47. Jiang, K.; Ashworth, P. The development of Carbon Capture Utilization and Storage (CCUS) research in China: A bibliometric perspective. Renew. Sustain. Energy Rev. 2021, 138, 110521. [Google Scholar] [CrossRef]
  48. Yan, Y.; Borhani, T.N.; Subraveti, S.G.; Pai, K.N.; Prasad, V.; Rajendran, A.; Nkulikiyinka, P.; Asibor, J.O.; Zhang, Z.; Shao, D.; et al. Harnessing the power of machine learning for carbon capture, utilisation, and storage (CCUS)—A state-of-the-art review. Energy Environ. Sci. 2021, 14, 6122–6157. [Google Scholar] [CrossRef]
Figure 1. Strategic interaction between local governments and energy companies.
Sustainability 15 09695 g001
Figure 2. Evolutionary trajectory of the system with different initial probabilities.
Sustainability 15 09695 g002
Figure 3. Impact of the different ratios for the two types of energy use in the integrated energy use structure on the evolutionary trajectory of the system.
Sustainability 15 09695 g003
Figure 4. The impact of the change in benefits from enhanced energy system resilience for different game players on the evolutionary trajectory of the system.
Sustainability 15 09695 g004
Figure 5. System evolutionary trajectory under changes in local government subsidies for integrated energy use by energy companies.
Sustainability 15 09695 g005
Figure 6. Evolutionary trajectory of the system with different initial probabilities when the penalty parameter varies with respect to the subsidy parameter.
Sustainability 15 09695 g006
Figure 7. Evolutionary trajectory of the system under different proportions of integrated energy use when the penalty parameter varies with respect to the subsidy parameter.
Sustainability 15 09695 g007
Figure 8. Analysis of the key influencing factors in the strategic interaction between local governments and energy companies in the Yellow River Basin.
Sustainability 15 09695 g008
Table 1. Parameter symbols and descriptions.
SymbolDescriptionSymbolDescription
C e 1 The cost of using traditional energy, such as coal Δ C e 1 The cost of clean utilization of traditional energy
C e 2 The cost of utilization of renewable, clean energy R e Base revenue earned by energy companies using traditional energy, such as coal
R e 1 Benefits of clean use of traditional
energy by energy companies
R e 2 Benefits for energy companies using renewable, clean energy
R e 3 Benefits to energy companies from the resulting increase in energy system
resilience, with local government
subsidies for integrated energy use
R g 3 Benefits to local governments from the resulting increase in energy system resilience, with local government subsidies for integrated energy use
R g 1 Environmental benefits to government from energy companies’ clean use of
traditional energy
R g 2 Environmental benefits to government from
energy companies’ use of renewable, clean
energy
L g Environmental losses caused by energy companies to local governments when using traditional energy S e Penalties for integrated energy use by energy companies that do not use the subsidies while
ensuring the energy supply
M r Government subsidies for renewable, clean energy use by energy companies M t Government subsidies for clean use of
traditional energy by energy companies
α , β The proportion of traditional clean energy use (renewable, clean energy use) within the integrated energy use x , y Probability of strategy choice by energy
companies and local governments in the Yellow River Basin
Table 2. Payoff matrix for the energy companies and local governments in the Yellow River Basin.
Local Governments
Provide Subsidies (y) No Subsidies (1 − y)
Companies
Payoff
Governments PayoffCompanies
Payoff
Governments Payoff
Energy companiesUse of
integrated
energy ( x )
α ( R e + R e 1 + M t C e 1 Δ C e 1 ) + β ( R e 2 + M r C e 2 ) + R e 3 α ( R g 1 M t ) + β ( R g 2 M r ) + R g 3 α ( R e + R e 1 C e 1 Δ C e 1 ) + β ( R e 2 C e 2 ) α R g 1 + β R g 2
Use of
traditional
energy ( 1 x )
R e + M t C e 1 S e S e M t L g R e C e 1 L g
Table 3. Eigenvalues of the Jacobi matrix for each equilibrium point.
Equilibrium Pointsλ1λ2
E 1 = ( 0 , 0 ) S e M t C e 1 R e + α ( R e + R e 1 C e 1 Δ C e 1 ) + β ( R e 2 C e 2 )
E 2 = ( 0 , 1 ) M t S e C e 1 R e + R e 3 M t + S e + α ( R e + R e 1 + M t C e 1 Δ C e 1 ) + β ( R e 2 + M r C e 2 )
E 3 = ( 1 , 0 ) R g 3 α M t β M r R e C e 1 α ( R e + R e 1 C e 1 Δ C e 1 ) β ( R e 2 C e 2 )
E 4 = ( 1 , 1 ) α M t + β M r R g 3 R e C e 1 R e 3 + M t S e α ( R e + R e 1 + M t C e 1 Δ C e 1 ) β ( R e 2 + M r C e 2 )
E 5 = ( x , y ) Saddle point
Table 4. Stability of the replicated dynamic systems.
S e < M t ( S e > M t )
Stage I (I′)
α A + β B < R e C e 1 R e 3 + α ( A + M t ) + β ( B + M r ) < R e C e 1
Stage II (II′)
α A + β B < R e C e 1 R e 3 + α ( A + M t ) + β ( B + M r ) > R e C e 1
Equilibrium
points
λ 1 λ 2 State λ 1 λ 2 State
(0,0)−(+)ESS
(Instability point)
−(+)ESS
(Instability point)
(0,1)+(−)Instability point (ESS)+(−)+Saddle point
(Instability point)
(1,0)++Saddle point++Saddle point
(1,1)+Instability pointESS
(x*,y*) DetJ   < 0 TrJ   = 0 Saddle point DetJ   < 0 TrJ   = 0 Saddle point
Stage III (III′)
α A + β B > R e C e 1 R e 3 + α ( A + M t ) + β ( B + M r ) > R e C e 1
Stage IV (IV′)
α A + β B > R e C e 1 R e 3 + α ( A + M t ) + β ( B + M r ) > R e C e 1
Equilibrium
points
λ 1 λ 2 State λ 1 λ 2 State
(0,0)−(+)+Instability point
(Saddle point)
−(+)+Instability point
(Saddle point)
(0,1)+(−)Instability point (ESS)+(−)+Saddle point
(Instability point)
(1,0)+Instability point+Instability point
(1,1)+Instability pointESS
(x*,y*) DetJ   < 0 TrJ   = 0 Saddle point DetJ   < 0 TrJ   = 0 Saddle point
Note: A = Re + Re1Ce1 − ΔCe1; B = Re2Ce2.
Disclaimer/Publisher’s Note: The statements, opinions and data contained in all publications are solely those of the individual author(s) and contributor(s) and not of MDPI and/or the editor(s). MDPI and/or the editor(s) disclaim responsibility for any injury to people or property resulting from any ideas, methods, instructions or products referred to in the content.

