Article

Decomposing and Decoupling the Energy-Related Carbon Emissions in the Beijing–Tianjin–Hebei Region Using the Extended LMDI and Tapio Index Model

School of Management, China University of Mining and Technology (Beijing), Beijing 100083, China
Sustainability 2023, 15(12), 9681; https://doi.org/10.3390/su15129681
Submission received: 19 April 2023 / Revised: 14 June 2023 / Accepted: 14 June 2023 / Published: 16 June 2023

Abstract

:
To deal with global warming and fulfil China’s commitment to carbon neutrality by 2060, reducing carbon emissions has become a necessary requirement. As one of China’s three major economic circles, the Beijing–Tianjin–Hebei region (B–T–H) has a great responsibility. This paper measures energy-related carbon emissions of B–T–H from 2005 to 2019 and uses the extended Logarithmic Mean Division Index (LMDI) to decompose the carbon emission effect factors. Then, a Tapio index model was constructed to analyse the contribution of each effect factor. The results showed that: (1) the total carbon emissions of B–T–H increased by 1.5 times, with Hebei having the highest proportion, followed by Tianjin and Beijing. Coal was the biggest emitter in all three regions. Natural gas emissions in Tianjin and Beijing were growing rapidly. (2) Consistent with most studies, economic development promoted carbon emissions, while energy intensity and energy structure inhibited them. It was found that innovative factors also have significant impacts: research and development efficiency was the primary emission inhibition factor in Hebei and the secondary inhibition factor in Tianjin and Beijing. The effects of investment intensity and research and development intensity differed between regions. (3) Beijing took the lead in achieving strong decoupling, followed by Tianjin. Hebei maintained weak decoupling. Innovative factors also played an important role in decoupling, which cannot be ignored in achieving emission reduction targets.

1. Introduction

With the development of global industrialization and urbanization, the burning of a large amount of fossil energy causes a sharp increase in carbon dioxide in the atmosphere and the global temperature. Affected by climate warming, droughts, floods and extreme weather events occur more frequently. Methods to deal with climate change have become an urgent problem for human beings. China is the world’s largest carbon emitter. Under the internal requirements of sustainable development and the external pressure of international public opinion, controlling carbon emission growth and achieving a green and low-carbon economic transformation is a necessity [1]. In 2020, China formally proposed to strive for peak carbon dioxide emissions by 2030 and to achieve carbon neutrality by 2060. Subsequently, the State Council issued the Working Guidance for Carbon Dioxide Peaking and Carbon Neutrality in Full and Faithful Implementation of the New Development Philosophy, which clearly emphasized the need to strengthen green low-carbon development orientation and task requirements in the implementation of major regional strategies such as the Beijing–Tianjin–Hebei region (B–T–H) coordinated development (the location is shown in Figure 1). B–T–H is one of the three major economic circles leading China’s economic growth, but it is also one of the regions with the most concentrated energy consumption and carbon dioxide emissions. It is imperative to reduce carbon emissions in this region and set an example for achieving carbon neutrality on schedule. This paper measures B–T–H’s carbon emissions, decomposes the factors that promote and inhibit carbon emissions, and quantitatively analyses the contribution of these different factors to the decoupling of carbon emissions and economic growth in order to put forward and implement carbon emission reduction measures more pertinently and to provide a policy reference for controlling greenhouse gas emissions.

2. Literature Review

The theoretical background of this study includes environmental Kuznets hypothesis, decoupling theory and decomposition analysis. The empirical background of this study includes: B–T–H has occupied a pivotal position in regional economic development and environmental impact; the decoupling model is widely used in the field of the relationship between carbon emissions and economic development; the decomposition analysis of carbon emissions in industries and provinces based on the LMDI model has become a mainstream research topic in the academic community.

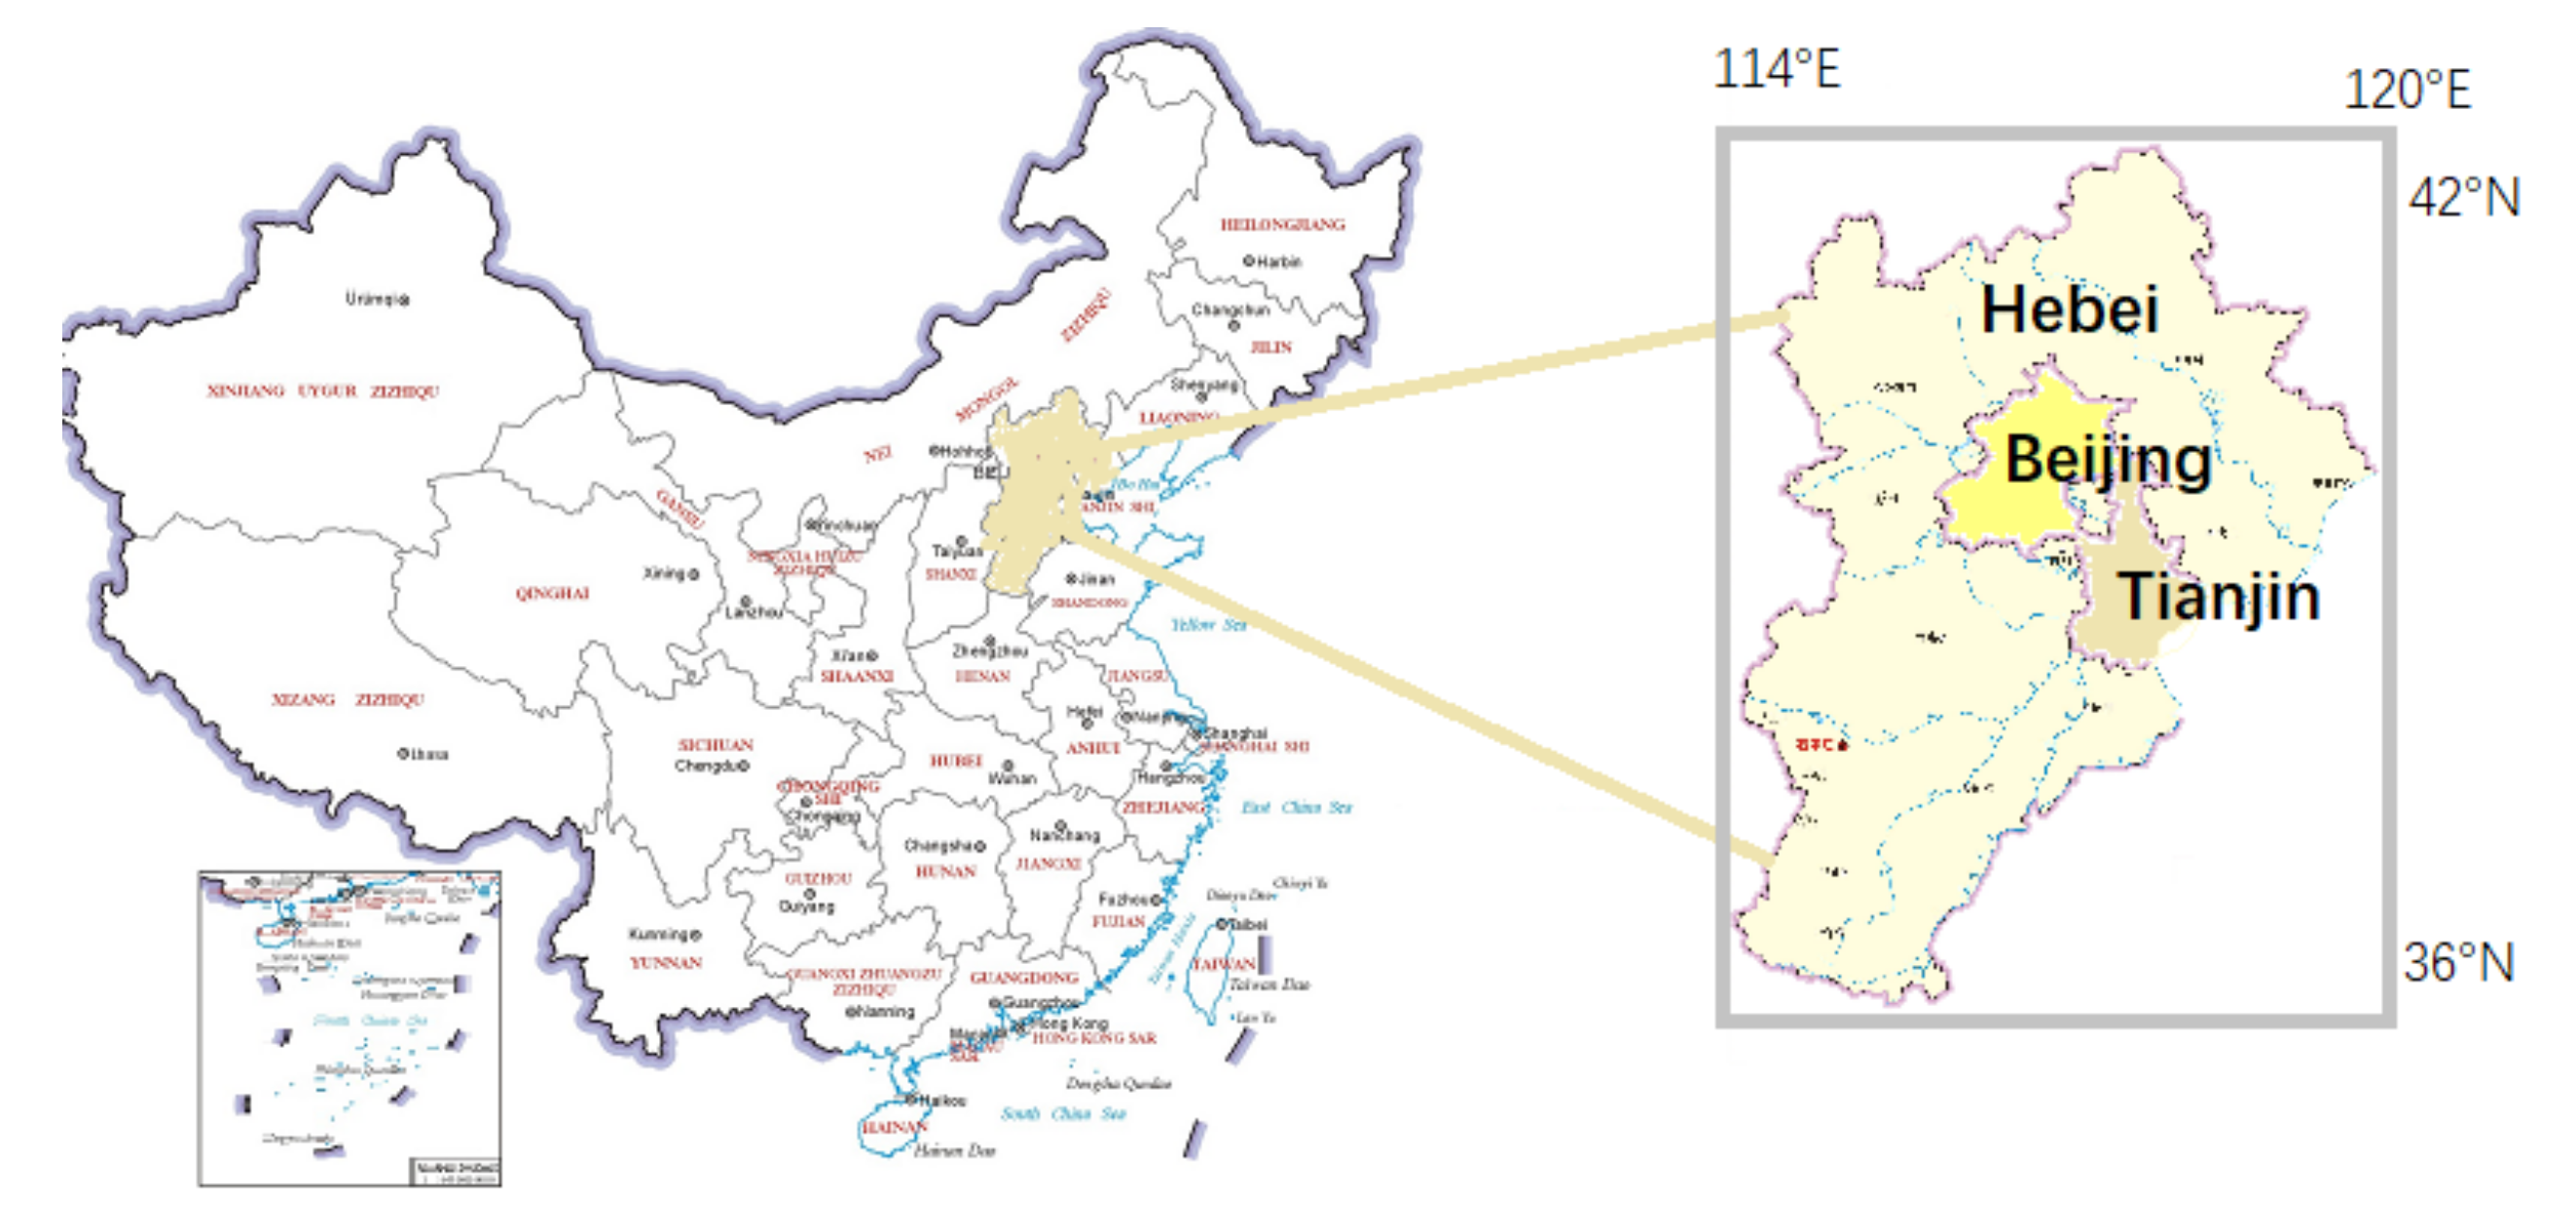
2.1. B–T–H Carbon Emissions

With the implementation of the major regional coordinated development strategy of B–T–H and the promotion of the carbon neutralization process, many scholars have conducted in-depth research on B–T–H carbon emissions, looking at the issue from various angles. Gu et al. [1], based on findings using the STIRPAT model, believed that the rationalization of the industrial structure had a significant impact on the carbon emissions of B–T–H urban agglomeration. Chai et al. [2] measured the carbon emission efficiency of B–T–H by industry using total factor industrial carbon emission efficiency and carbon entropy models, proposing a path of industrial structure transformation and upgrading. Yue et al. [3] indicated that industrial transfer-in had promoted emissions to a small extent, and the positive impact of industrial transfer-in on emissions waned over time with the help of a mediating model. To decompose the driving factors of B–T–H carbon emissions, Liang et al. [4] utilised the combination of the logarithmic mean division index (LMDI) and the Shapley value, while Lou et al. [5] utilised the PGTWR model. The former concluded that economic development was the main driving force for carbon emissions of B–T–H, while energy consumption intensity was the significant inhibition factor. The latter further found that the impact of economic development and energy intensity were on a declining curve from the year 2013 to 2018. Some studies have focused on predicting peak carbon emission dates. Li et al. [6] adopted the support vector machine-extreme learning machine model, proposing that clean energy substitution, mainly natural gas and electricity, will significantly reduce B–T–H carbon emissions by 2030. Based on the results of a neural network model, Zhou et al. [7] predicted that B–T–H carbon emissions would peak in 2025 and 2028 under basic and high carbon scenarios, respectively. Additionally, Zhao et al. [8] constructed a system dynamics model to predict that B–T–H’s carbon emissions will peak from 2030 to 2035 under basic scenarios and various other scenarios. These studies indicate that B–T–H will meet, or nearly meet, China’s proposed carbon emissions peak date.

2.2. Logarithmic Mean Division Index Model (LMDI)

The LMDI model effectively solves the problem of residual and zero data processing in exponential decomposition and is presently a mainstream method of factor decomposition. In particular, the LMDI model based on the Kaya identity and its extended models are widely used by scholars for carbon emission effects decomposition. Further, scholars [9,10,11,12,13] have analysed the low-carbon economy and carbon emissions from a national perspective. While affirming the dominant role of economic development on carbon emissions, Kong et al. [9] also pointed out that a slowdown of economic growth will delay the arrival of carbon emission peaks. Zhao et al. [10] discussed the consistency between the GDP growth and carbon emission growth rates, highlighting the impact of energy intensity. Jiang et al. [11] quantitatively analysed the driving factors of carbon emissions in six industries in China, concluding that the industrial sector is the most important carbon emitter and the economic output effect is the most important carbon emission contributor. Dong et al. [12] concluded that the high carbon emission economic structure is the most urgent obstacle to overcome in the current green transformation of China’s economy and that increasing the proportion of renewable energy will help reduce carbon emissions. Peng and Liu [13] factorised the carbon emissions of coal consumption in China, concluding that economic output and energy intensity effects are the main driving and restraining factors of coal carbon emissions, respectively. Some scholars [4,14,15] have also decomposed the carbon emission effect from a regional perspective. Examining B–T–H, Liang et al. [4] found that Hebei had much higher carbon emissions than Tianjin and Beijing. Economic development was the main driver of carbon emission growth. Energy consumption structure, population size and industrial structure promoted carbon emissions’ growth as well. Wang et al. [14] showed that energy intensity and energy structure had a greater impact than other factors on carbon emissions in the Yangtze River Delta region of China from 2000–2010, with industrial output taking over as the main driver from 2010–2020. Dong et al. [15] pointed out that the intense economic activity in Northwest China is the main reason for the growth of carbon emissions, and the current extensive economic development mode urgently needs to be amended. In addition, scholars [16,17,18,19] analysed the components of carbon emissions from a provincial perspective. Xia et al. [17] found that the inhibitory effect of reducing energy intensity on carbon emissions in Zhejiang transitioned from being unable to offset the emissions-promoting effect of economic development to offsetting it, which indicated that Zhejiang had some success in achieving a low-carbon development. In line with the findings of Peng and Liu [13], Qin et al. [20] showed that the main factors promoting and hindering Xinjiang’s carbon emissions were also economic development and energy intensity effects, respectively. Similar findings were obtained by Yang et al. [18] and Wang et al. [19], who studied the drivers of carbon emissions in Hunan and Guangdong provinces, respectively.
It can be seen from the above literature that a large number of scholars have conducted a wide range of research and achieved fruitful results on carbon emissions using the LMDI model based on Kaya’s constant equation, and they provide important references and theoretical guidance for this study. However, they also show that research has usually focused on traditional factors such as economic development, energy structure, energy intensity, and population size while little attention was paid to innovative factors, such as investment intensity, research and development efficiency, and research and development intensity. Studies have shown that investment intensity is the second largest factor affecting the growth of manufacturing carbon emissions in China, only after the effect of economic development. Whether considering only the manufacturing carbon emissions [21] or all the energy-related carbon emissions of China [22], research and development efficiency and research and development intensity have played a significant inhibitory role. Jin et al. [23] believed that technological progress in the energy sector, using research and development expenditure as an indicator, could help reduce future carbon emissions, and Feng and Peng [24], by comparing the impact of government and corporate research and development expenditure, showed that research and development expenditure from different sources reduced carbon intensity. In quantifying the impact of urban form and social economy on China’s carbon emissions, Huang et al. [25] concluded that ‘investment efficiency is the most important factor restricting the growth of carbon emissions’. At present, factors such as investment and research and development have not been considered in the decomposition study of carbon emissions of B–T–H. It is worth noting that in recent years, the total investment in fixed assets has doubled, and research and development spending has also increased significantly. As a result, they have become important factors that cannot be ignored. Therefore, on the basis of conventional factors, this paper especially increases the consideration of investment intensity, research and development intensity and research and development efficiency, and decomposes the B–T–H carbon emission effect by the extended LMDI model.

2.3. Tapio Model

Decoupling carbon emissions from economic growth is seen as an important step in achieving a low-carbon economy. Most studies on decoupling carbon emissions and economic growth using the Tapio models have focused on countries or regions, the whole of industry, or a particular industry. Shen et al. [26] compared the decoupling status of the four major economic regions in China and found that the situations in the eastern and western regions are more ideal than those in the central and north-eastern regions, suggesting that different regions should formulate corresponding carbon emission reduction strategies according to their existing factors. Liu et al. [27] further found that the provinces in the central region were generally in a weak decoupling position, but with large inter-provincial differences. Yu et al. [28] argued that the decoupling state depends on the inflection point of annual GDP per capita. Thus, most provinces in China would experience weak and then strong decoupling before becoming relatively stable. The research of Xiao et al. [29] targeted the carbon emissions of cultivated land in Hubei Province, finding that most counties were in a state of strong decoupling from agricultural economic growth.
Some scholars substitute the decomposition results of the LMDI model into the decoupling model to quantitatively analyse the role of each factor in the final decoupling state in the form of the decoupling index. Zhao et al. [10] ranked China’s economic regions according to their decoupling index and found that the central region exhibited the greatest decoupling, followed by the eastern, north-eastern, and then western regions. It was also demonstrated that a higher energy intensity index had a positive effect on decoupling, while a higher economic intensity index inhibited decoupling. Qin et al. [16] reached a similar conclusion when studying the decoupling of carbon emissions in Xinjiang province. In contrast, Wang et al. [14] argued that the energy intensity index had a negative effect on carbon emission decoupling in the Yangtze River Delta region of China. It began to be relatively weak, and gradually increased until it became the leading factor to inhibit decoupling. Zhang et al. [30] decomposed the factors influencing carbon decoupling in the Yellow River basin, highlighting the main inhibiting effect of urbanisation on carbon decoupling while the inhibiting effect of energy intensity ranked second. From the above literature, it can be found that the combination of the LMDI model and Tapio model will help to further quantify the contribution of different factors to the decoupling of carbon emissions, but such research is relatively rare. Therefore, to rationalise the carbon reduction measures and achieve a more efficient decoupling in B–T–H, it is necessary to further decompose the factors influencing its carbon emissions decoupling using the LMDI model.
Some studies explain decoupling with the help of the environmental Kuznets curve hypothesis. It shows that when the per capita income level is low, the degree of environmental deterioration increases with economic growth; when the economic development reaches a certain level, which is called the ‘turning point’, with the further increase in per capita income, the degree of environmental pollution gradually slows down. Combined with the decoupling theory of carbon emissions, when the economy develops to a certain level, the decoupling between economic growth and greenhouse gas emissions gradually occurs [31,32].
In summary, with the in-depth implementation of the major regional strategy of B–T–H coordinated development, B–T–H’s carbon emissions reduction has become a research hotspot with the goal of reaching carbon neutrality. Many scholars have conducted in-depth studies from various perspectives and have achieved fruitful results, but there is still room for improvement. On the one hand, the contribution of each factor to decoupling carbon emissions from economic growth cannot be quantified using the Tapio model alone. On the other hand, the LMDI model based on Kaya’s identity ignores the innovation factors, which have played an increasingly important role in carbon emissions in recent years. Therefore, based on B–T–H data from the period of 2005–2019, which coincides with the transition from high to medium growth in China’s economy, this paper firstly measures energy-related carbon emissions; secondly, uses the LMDI model to decompose carbon emission factors, notably adding investment intensity, research and development efficiency, and research and development intensity impact factors to the traditional factors; and thirdly, combines the decomposition results with the decoupling model to further investigate the contribution of the different factors to decoupling using a decoupling index. Finally, based on this research, suggestions for achieving carbon emissions reductions in B–T–H are proposed.

3. Materials, Methods and Data

3.1. Carbon Emissions Accounting

To study the characteristics of regional carbon emissions, it is first necessary to account for the carbon emissions of each region. Compared with the 2006 IPCC Guidelines for National Greenhouse Gas Inventories, the 2019 version is more complete. By means of remote sensing and ground base station measurement data, a method for calculating greenhouse gas emissions based on atmospheric concentration was proposed, as the verification and correction of the traditional carbon emission calculation method. At the same time, the calculation method of wetland carbon emissions was clarified. Since the B–T–H area does not involve a large area of wetlands, and the carbon emission factor method is still the mainstream and recognized method of carbon emissions measurement, this study uses traditional methods to measure carbon emissions, with the following formula:
C = j C j = Σ j E j · N C V j · C E F j · C O F j · 44 12
where C is the total carbon emission, C j is the carbon emission of energy source j, and E j is the consumption of energy source j. For a given energy source, N C V j is its average low-level calorific value, C E F j is its carbon content per unit calorific value, and C O F j represents its carbon oxidation factor. The value 44/12 was used as the molecular weight of carbon dioxide. In light of the actual energy consumption in the various regions, this paper selected eight main energy sources: coal, coke, crude oil, gasoline, kerosene, diesel oil, fuel oil, and natural gas.

3.2. The Extended LMDI Model

The decomposition of regional carbon emission influencing factors can be used to determine the degree of influence each factor has on carbon emissions, providing a reference for determining the effective measures to reduce carbon emissions. The structural decomposition method (SDA) and the index decomposition method (IDA) are the two most commonly used decomposition methods at present. Compared with SDA, which needs a lot of complex input–output data, IDA requires a more concise dataset and is widely used in energy, economy, and other fields. This paper uses the extended LMDI model to analyse the influencing factors of B–T–H energy-related carbon emissions changes from 2005 to 2019. The formula is as follows:
C = Σ j C j E j E j E E G G R R I I G G = Σ C E · E E · E G · G R · R I · I G · G
where C is the regional energy-related carbon emissions, E j is the consumption of j different energy sources, E is the total energy consumption of the region, G is the regional real GDP, R is the research and development expenditure, and I is the fixed asset investment. The above multiplier items are recorded as CE, EE, EG, GR, RI, IG, and G, respectively. CE denotes the carbon emission factor, which is the carbon emissions due to a unit of energy; EE is the energy mix, which reflects the share of different energy varieties in the total energy consumption of the region; EG is energy intensity, representing the energy consumed per unit of output; GR is research and development efficiency, reflecting the turnover rate of research and development expenditure; RI is research and development intensity, reflecting the intensity of innovation and technological content; IG is investment intensity, representing the intensity of social reproduction and economic expansion; and G, the real GDP, is used to represent the level of economic development. The carbon emission factor is fixed for different energy sources, i.e., ΔCE = 0. The amount of change in carbon emissions, ΔC, can be expressed as the difference between the carbon emissions at time t and the carbon emissions at the start of the model period (t = 0):
Δ C = C t C 0 = Δ E E + Δ E G + Δ G R + Δ R I + Δ I G + Δ G
Δ e e = Σ j C j , t C j , 0 l n C j , t l n C j , 0 × l n E E j , t E E j , 0
e g = Σ j C j , t C j , 0 l n C j , t l n C j , 0 × l n E G j , t E G j , 0
Δ g r = Σ j C j , t C j , 0 l n C j , t l n C j , 0 × l n G R j , t G R j , 0
Δ r i = Σ j C j , t C j , 0 l n C j , t l n C j , 0 × l n R I j , t R I j , 0
Δ i g = Σ j C j , t C j , 0 l n C j , t l n C j , 0 × l n I G j , t I G j , 0
Δ g = Σ j C j , t C j , 0 l n C j , t l n C j , 0 × l n G j , t G j , 0
where Δ EE, Δ EG, Δ GR, Δ RI, Δ IG and Δ G denote energy structure, energy intensity, research and development efficiency, research and development intensity, investment intensity and economic development effect, respectively.

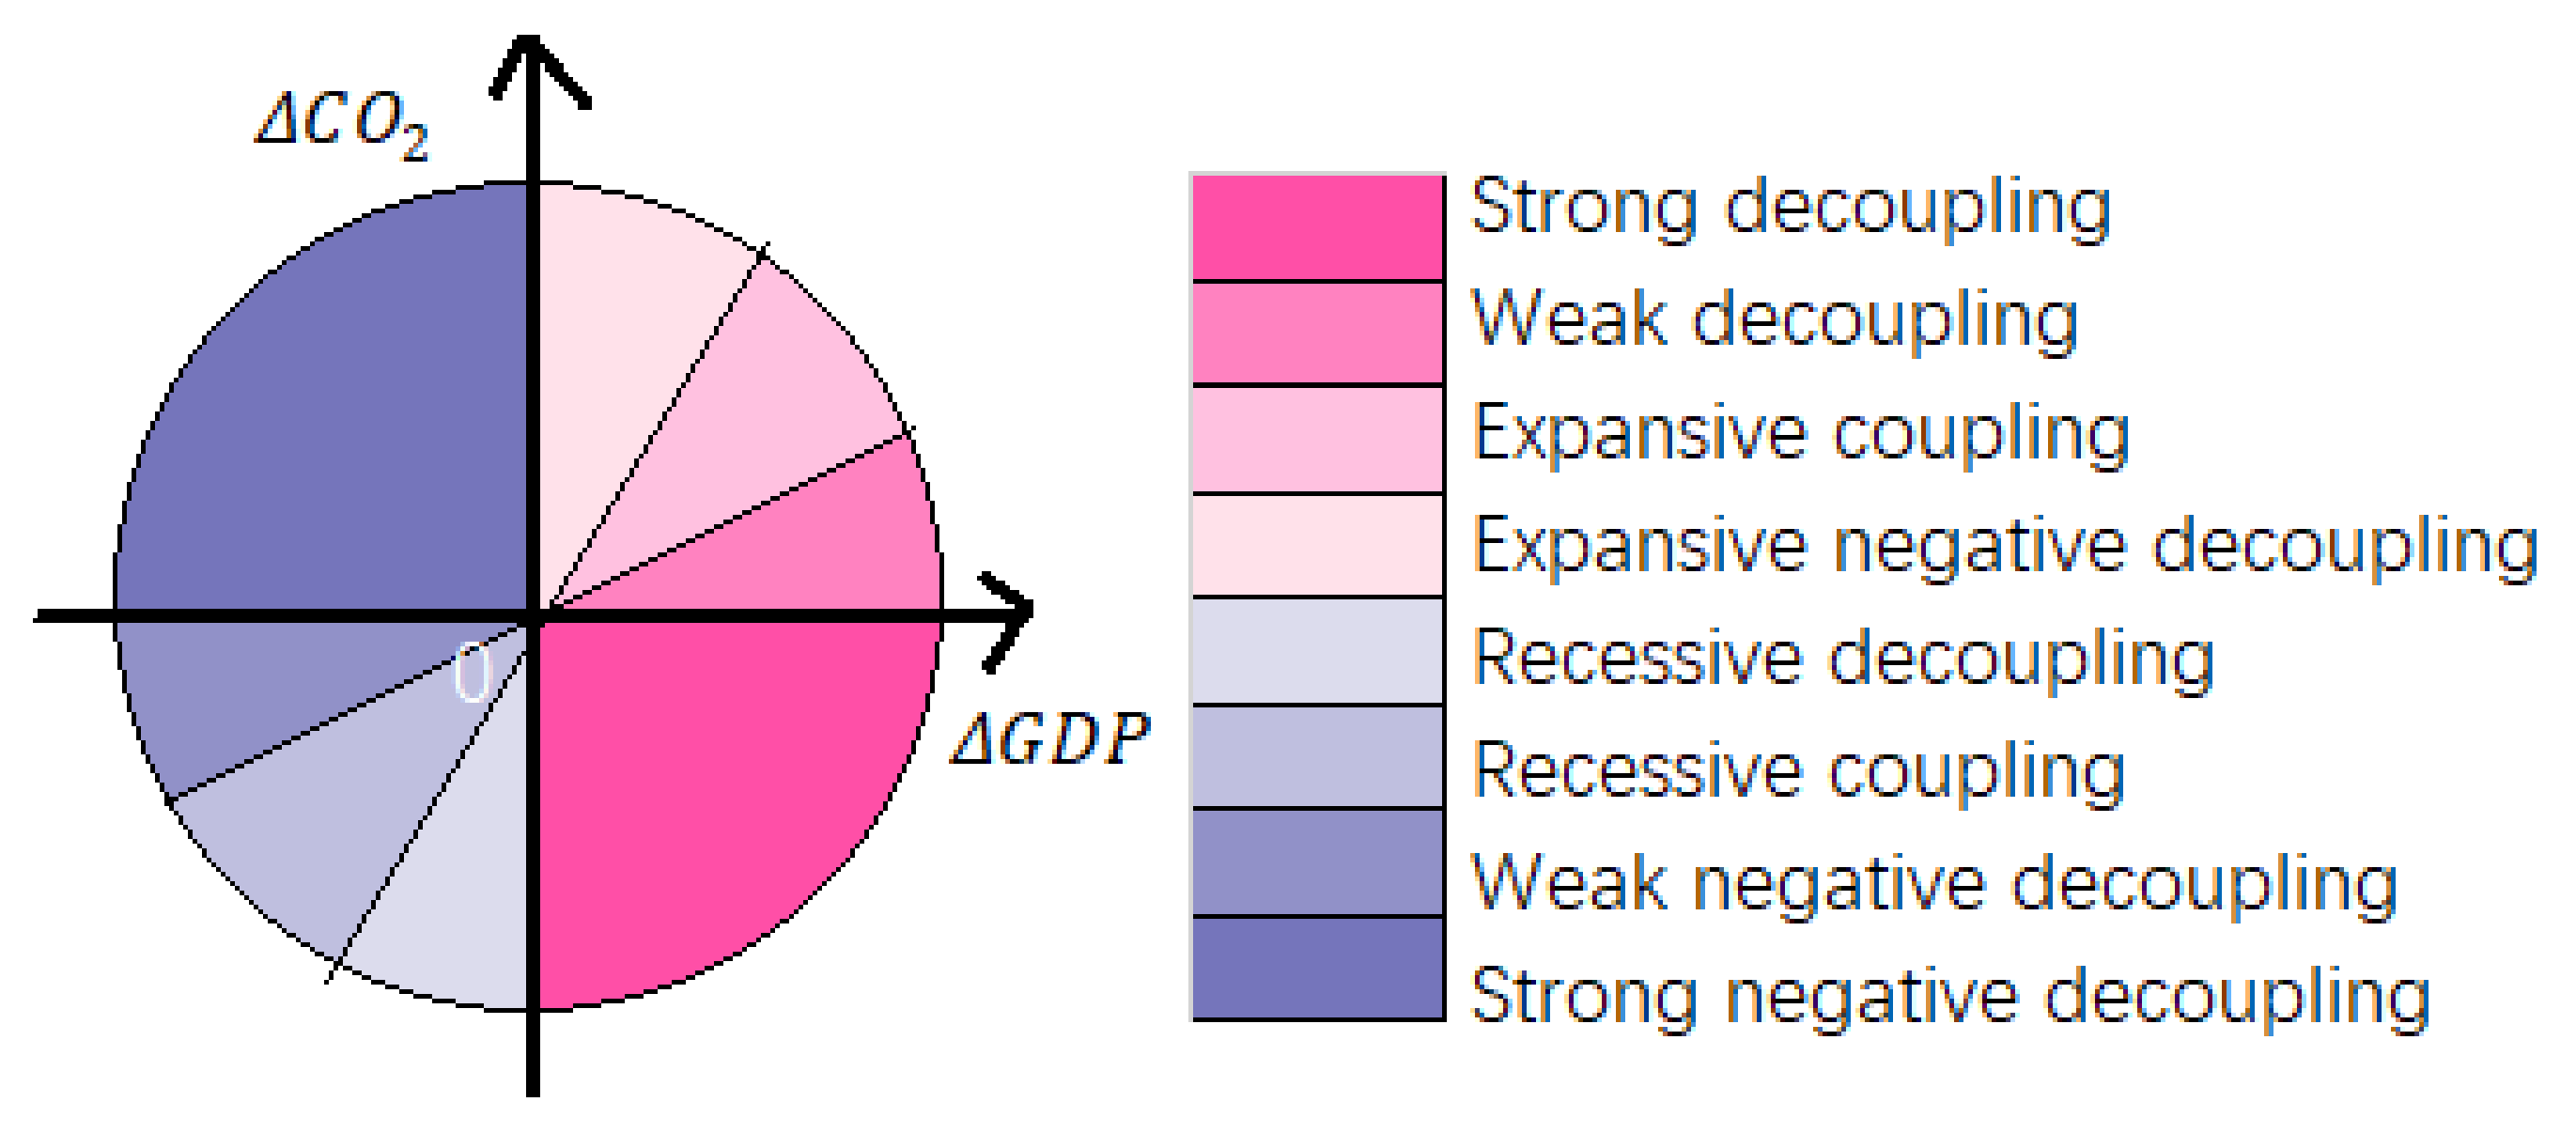
3.3. Tapio Index Model

To better study the relationship between economic development and environmental pollution, the Organisation for Economic Cooperation and Development (OECD) put forward the decoupling index. Based on this index, Tapio [33] constructed a decoupling model for analysing traffic carbon emissions that divided the decoupling state between carbon emissions and economic development level into eight types (Figure 2).
The Tapio model allowed for a more specific analysis of the sensitivity of carbon emissions to economic development, by calculating the percentage change in carbon emissions resulting from a 1% change in GDP. The formula is as follows:
e = Δ C O 2 C O 2 Δ G D P G D P
where e is the decoupling elasticity coefficient, Δ C O 2 is the change in CO2 in the current period relative to the base period, and Δ G D P is the change in the level of economic development in the current period relative to the base period.
By substituting the LMDI decomposition results, the decoupling model can be transformed:
D t = C t C 0 C 0 G t G 0 G 0 = G 0 C 0 · Δ E E + Δ E G + Δ G R + Δ R I + Δ I G + Δ G Δ G t
= D t e e + D t e g + D t g r + D t r i + D t i g + D t g
where D t is the decoupling index; and D t e e , D t e g , D t g r , D t r i , D t i g and D t g are, respectively, used to represent the different effects of decoupling: the decoupling effects of energy structure, energy intensity, research and development efficiency, research and development intensity, investment intensity and economic development.

3.4. Data Sources and Description of Main Indicators

Socioeconomic data came from the Statistical Yearbook of China. In order to eliminate the influence of price changes, GDP was calculated at constant prices in 2005. The data for energy consumption came from the China Energy Statistical Yearbook, and the accounting of carbon emissions adopted the method recommended by the IPCC. The numeric values used for the average low calorific value, the carbon content per unit calorific value, and the carbon oxidation factor were taken from the 2006 IPCC Guidelines for National Greenhouse Gas Inventories and the National Development. The research and development-related data came from the China Statistical Yearbook of Science and Technology, summarized by the National Bureau of Statistics, covering industrial enterprises above designated size, government-owned research and development institutions with independent accounting at prefecture level and above, universities and their affiliated hospitals. The data for fixed assets investment came from statistical yearbooks published by the provincial official statistics bureau. It refers to the whole society fixed assets investment, according to the type of registration can be divided into state-owned, joint-stock, private and so on.

4. Results and Discussion

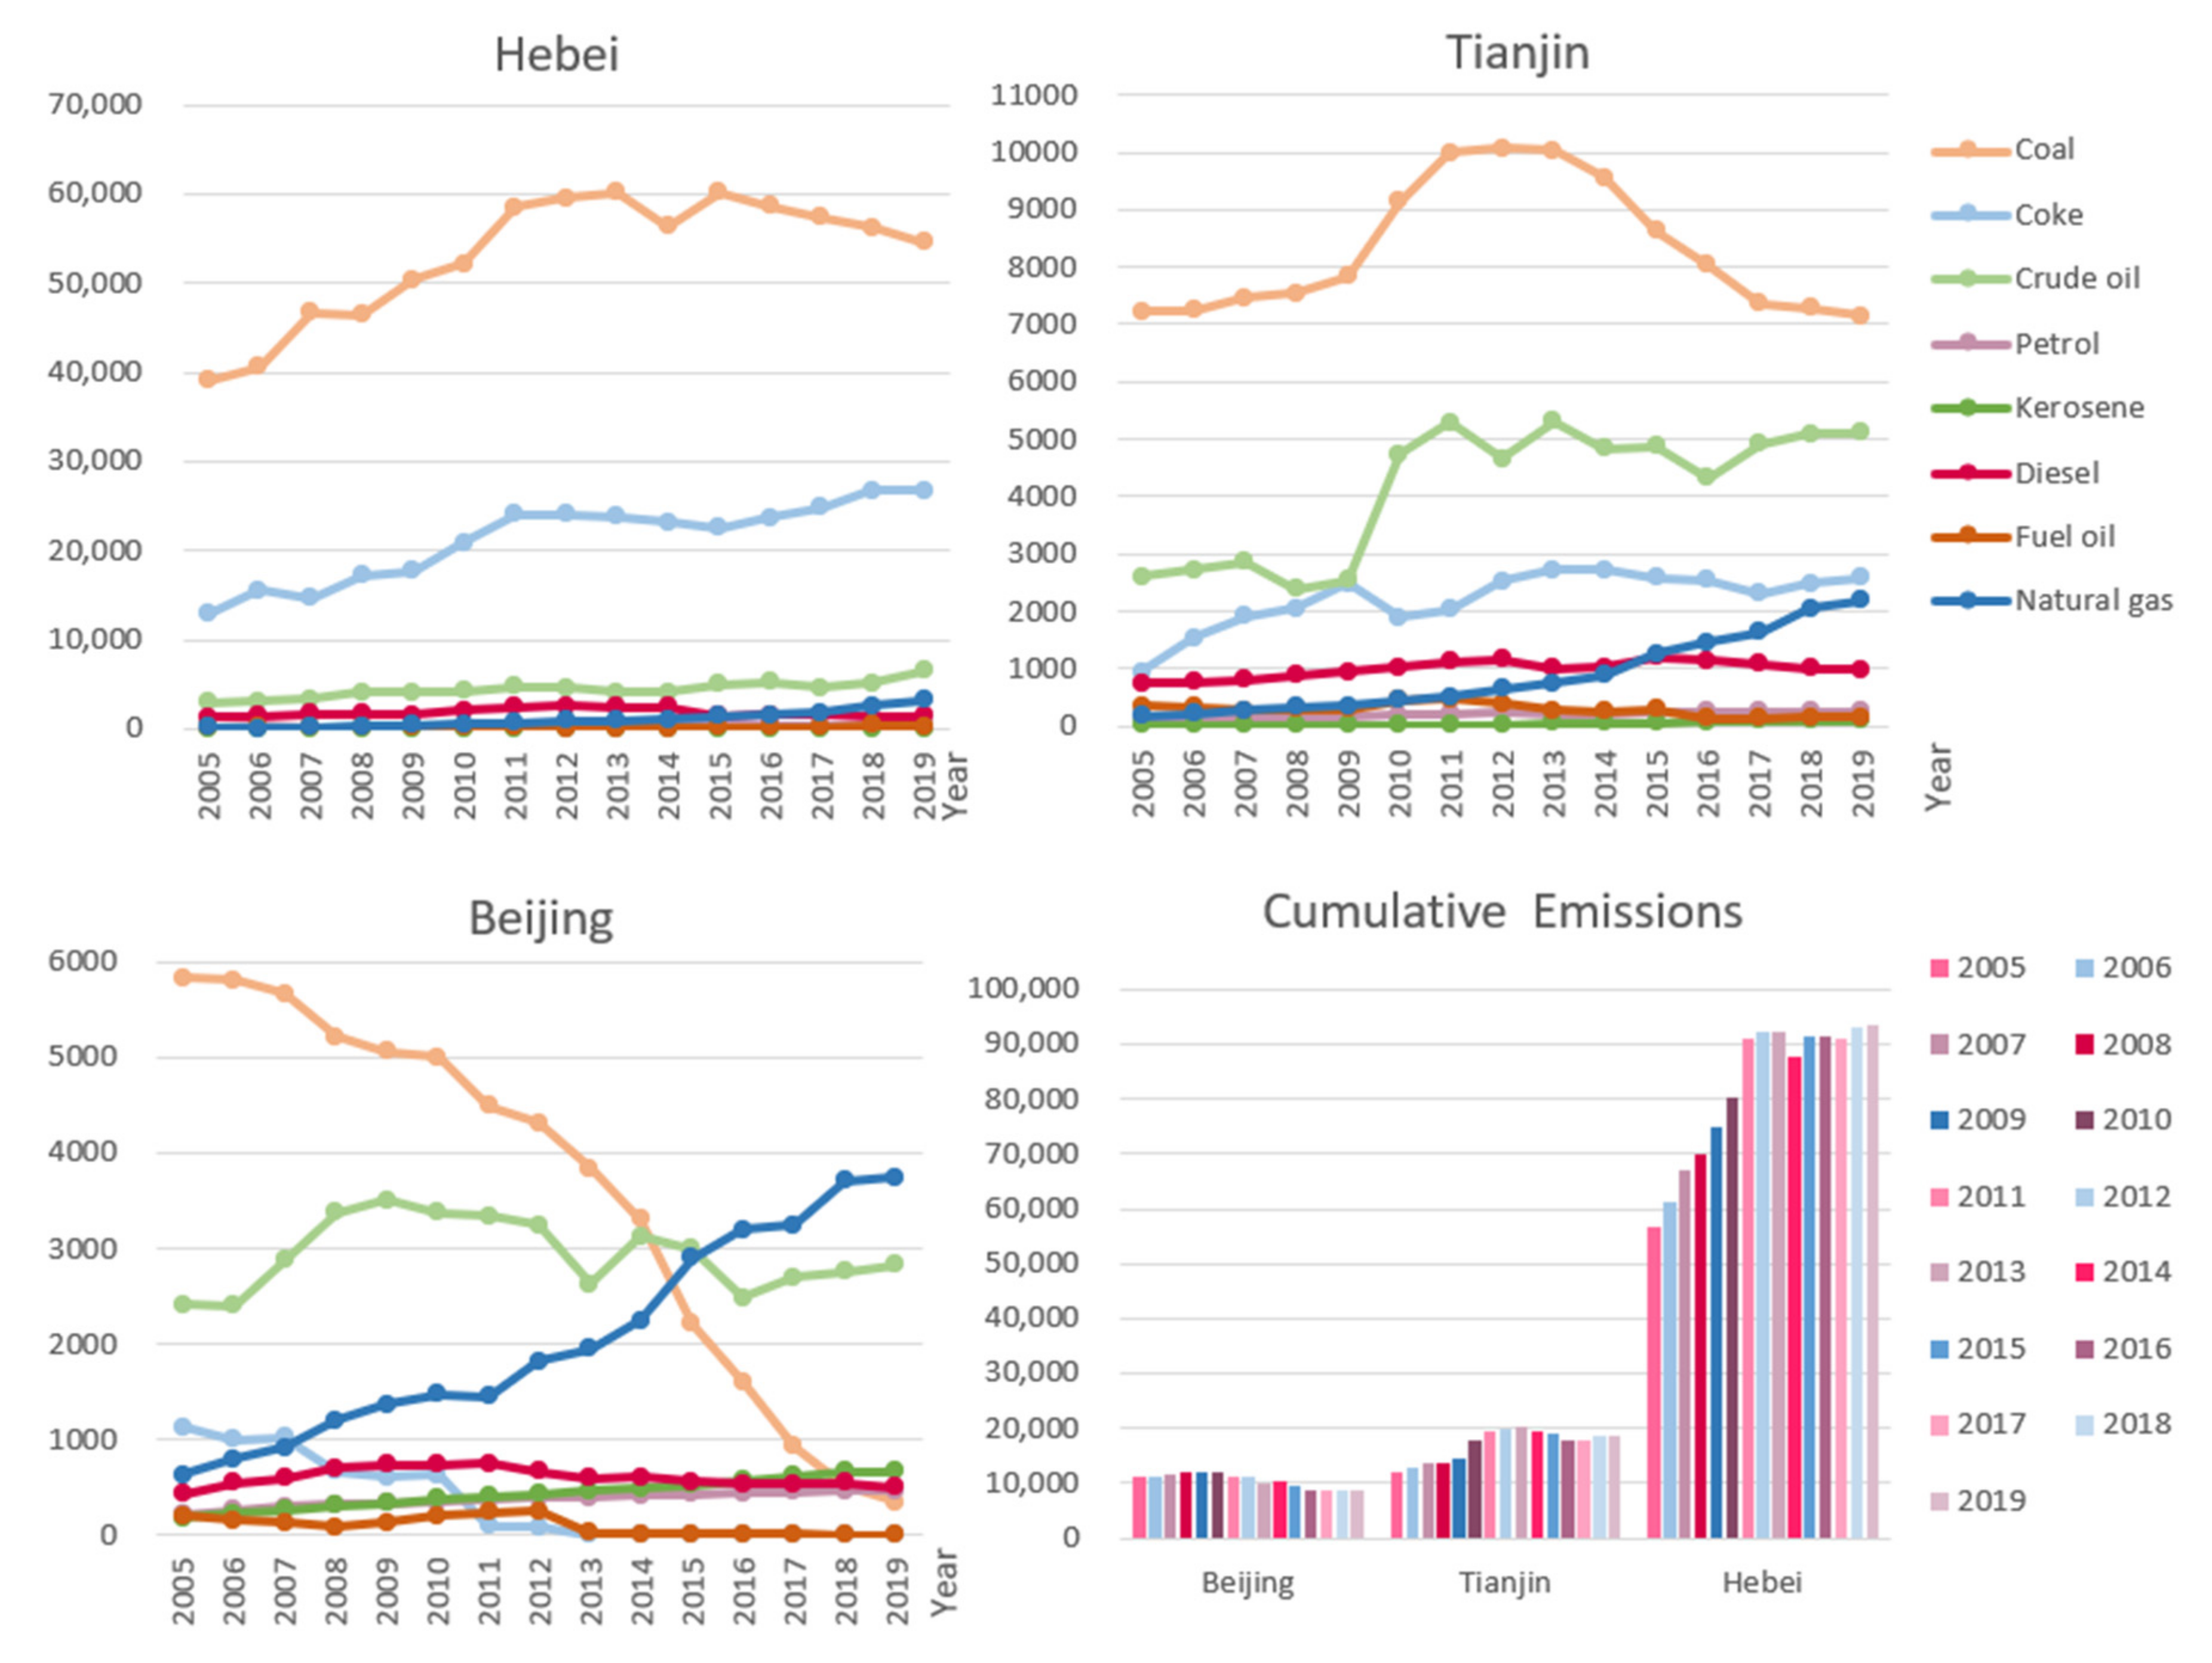
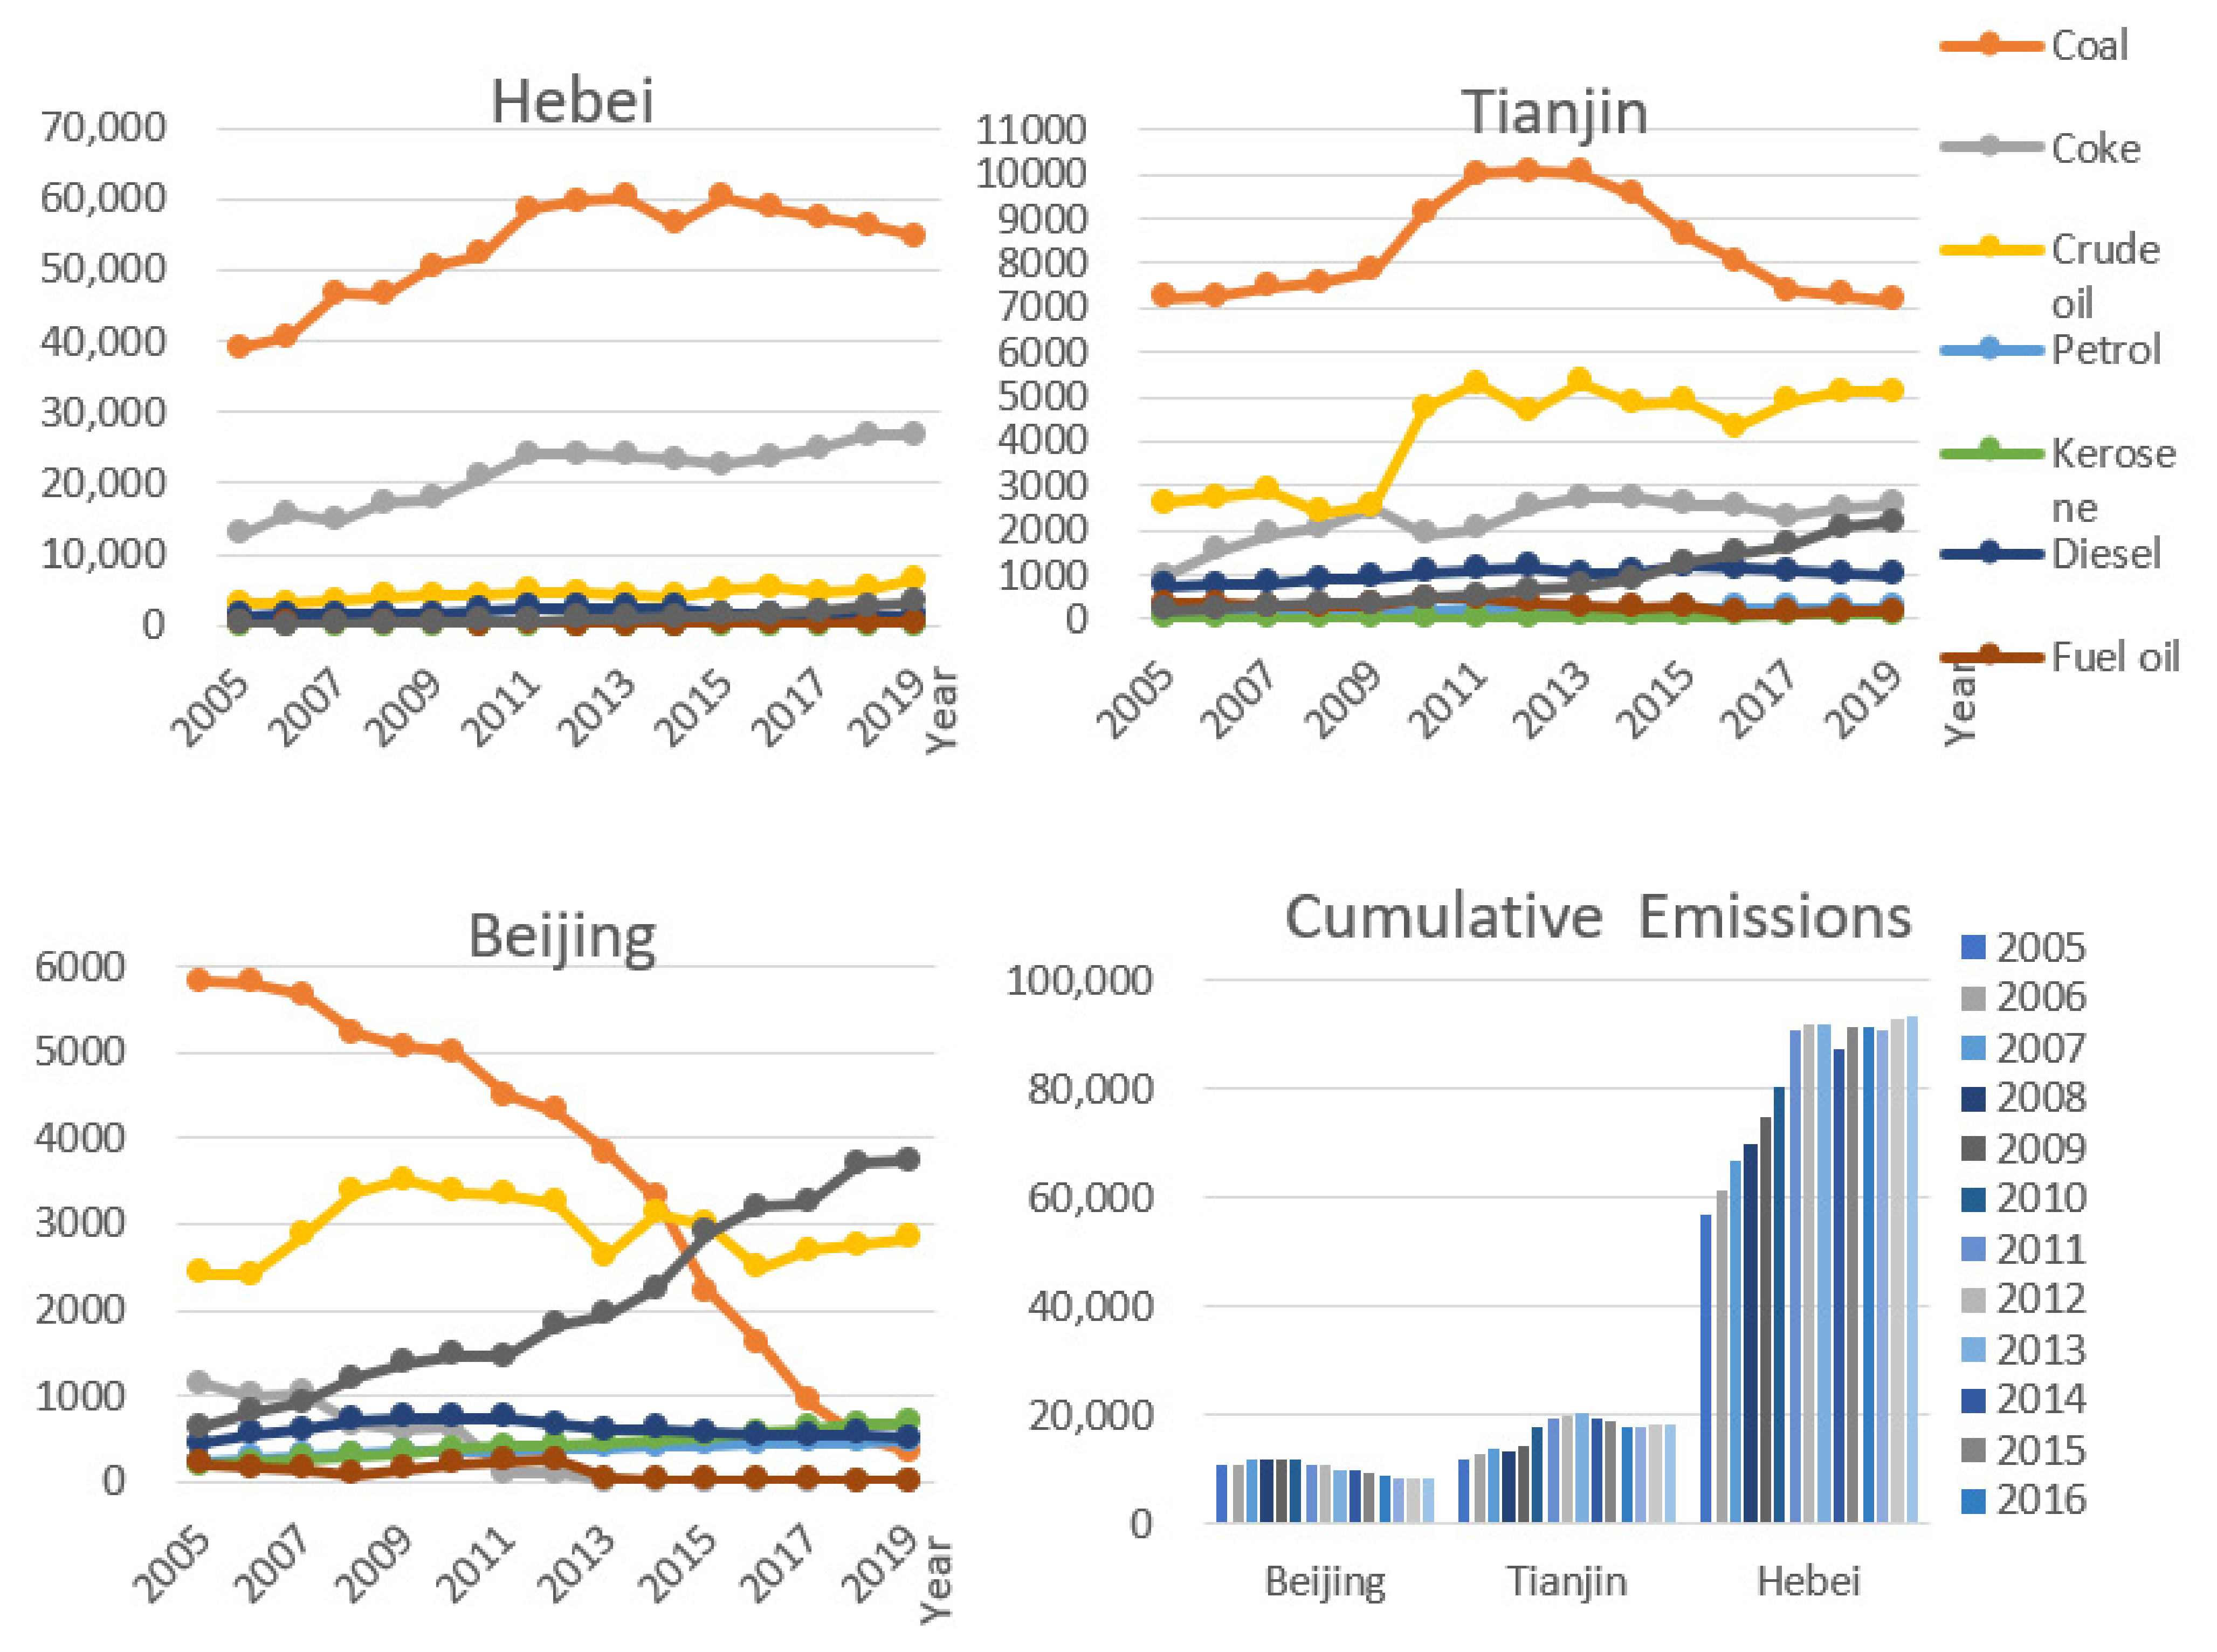
4.1. Carbon Emissions
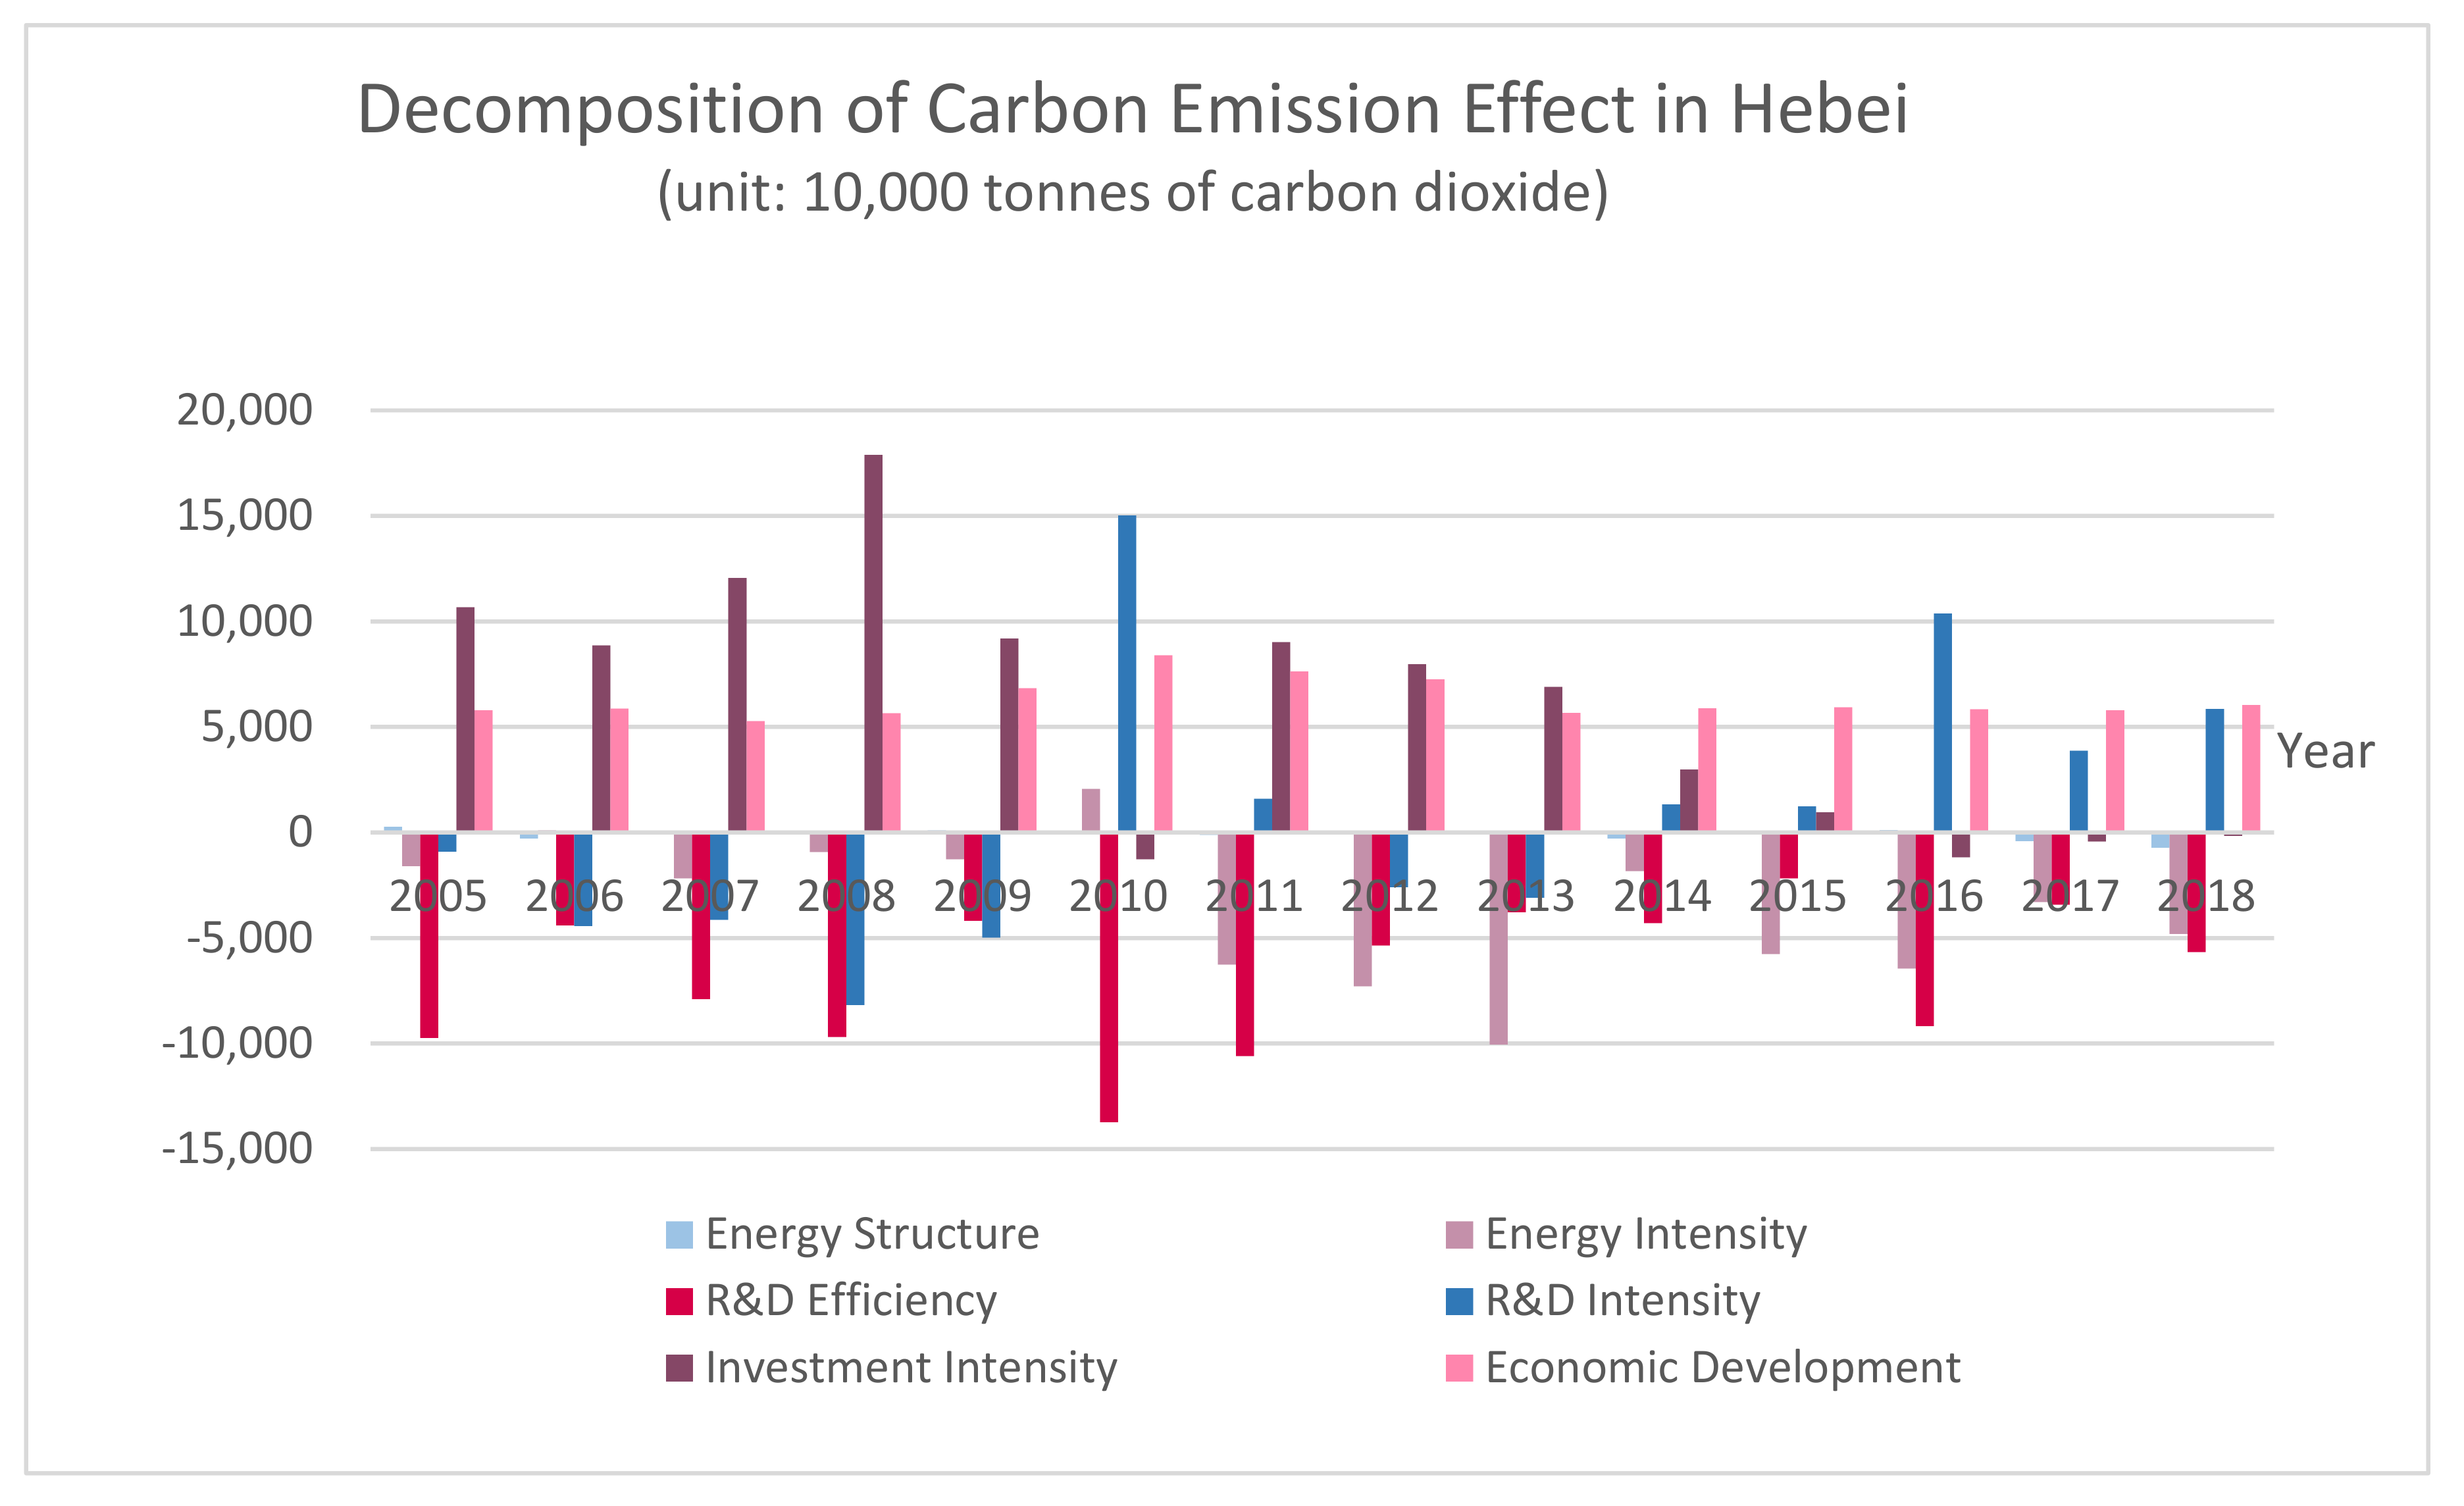
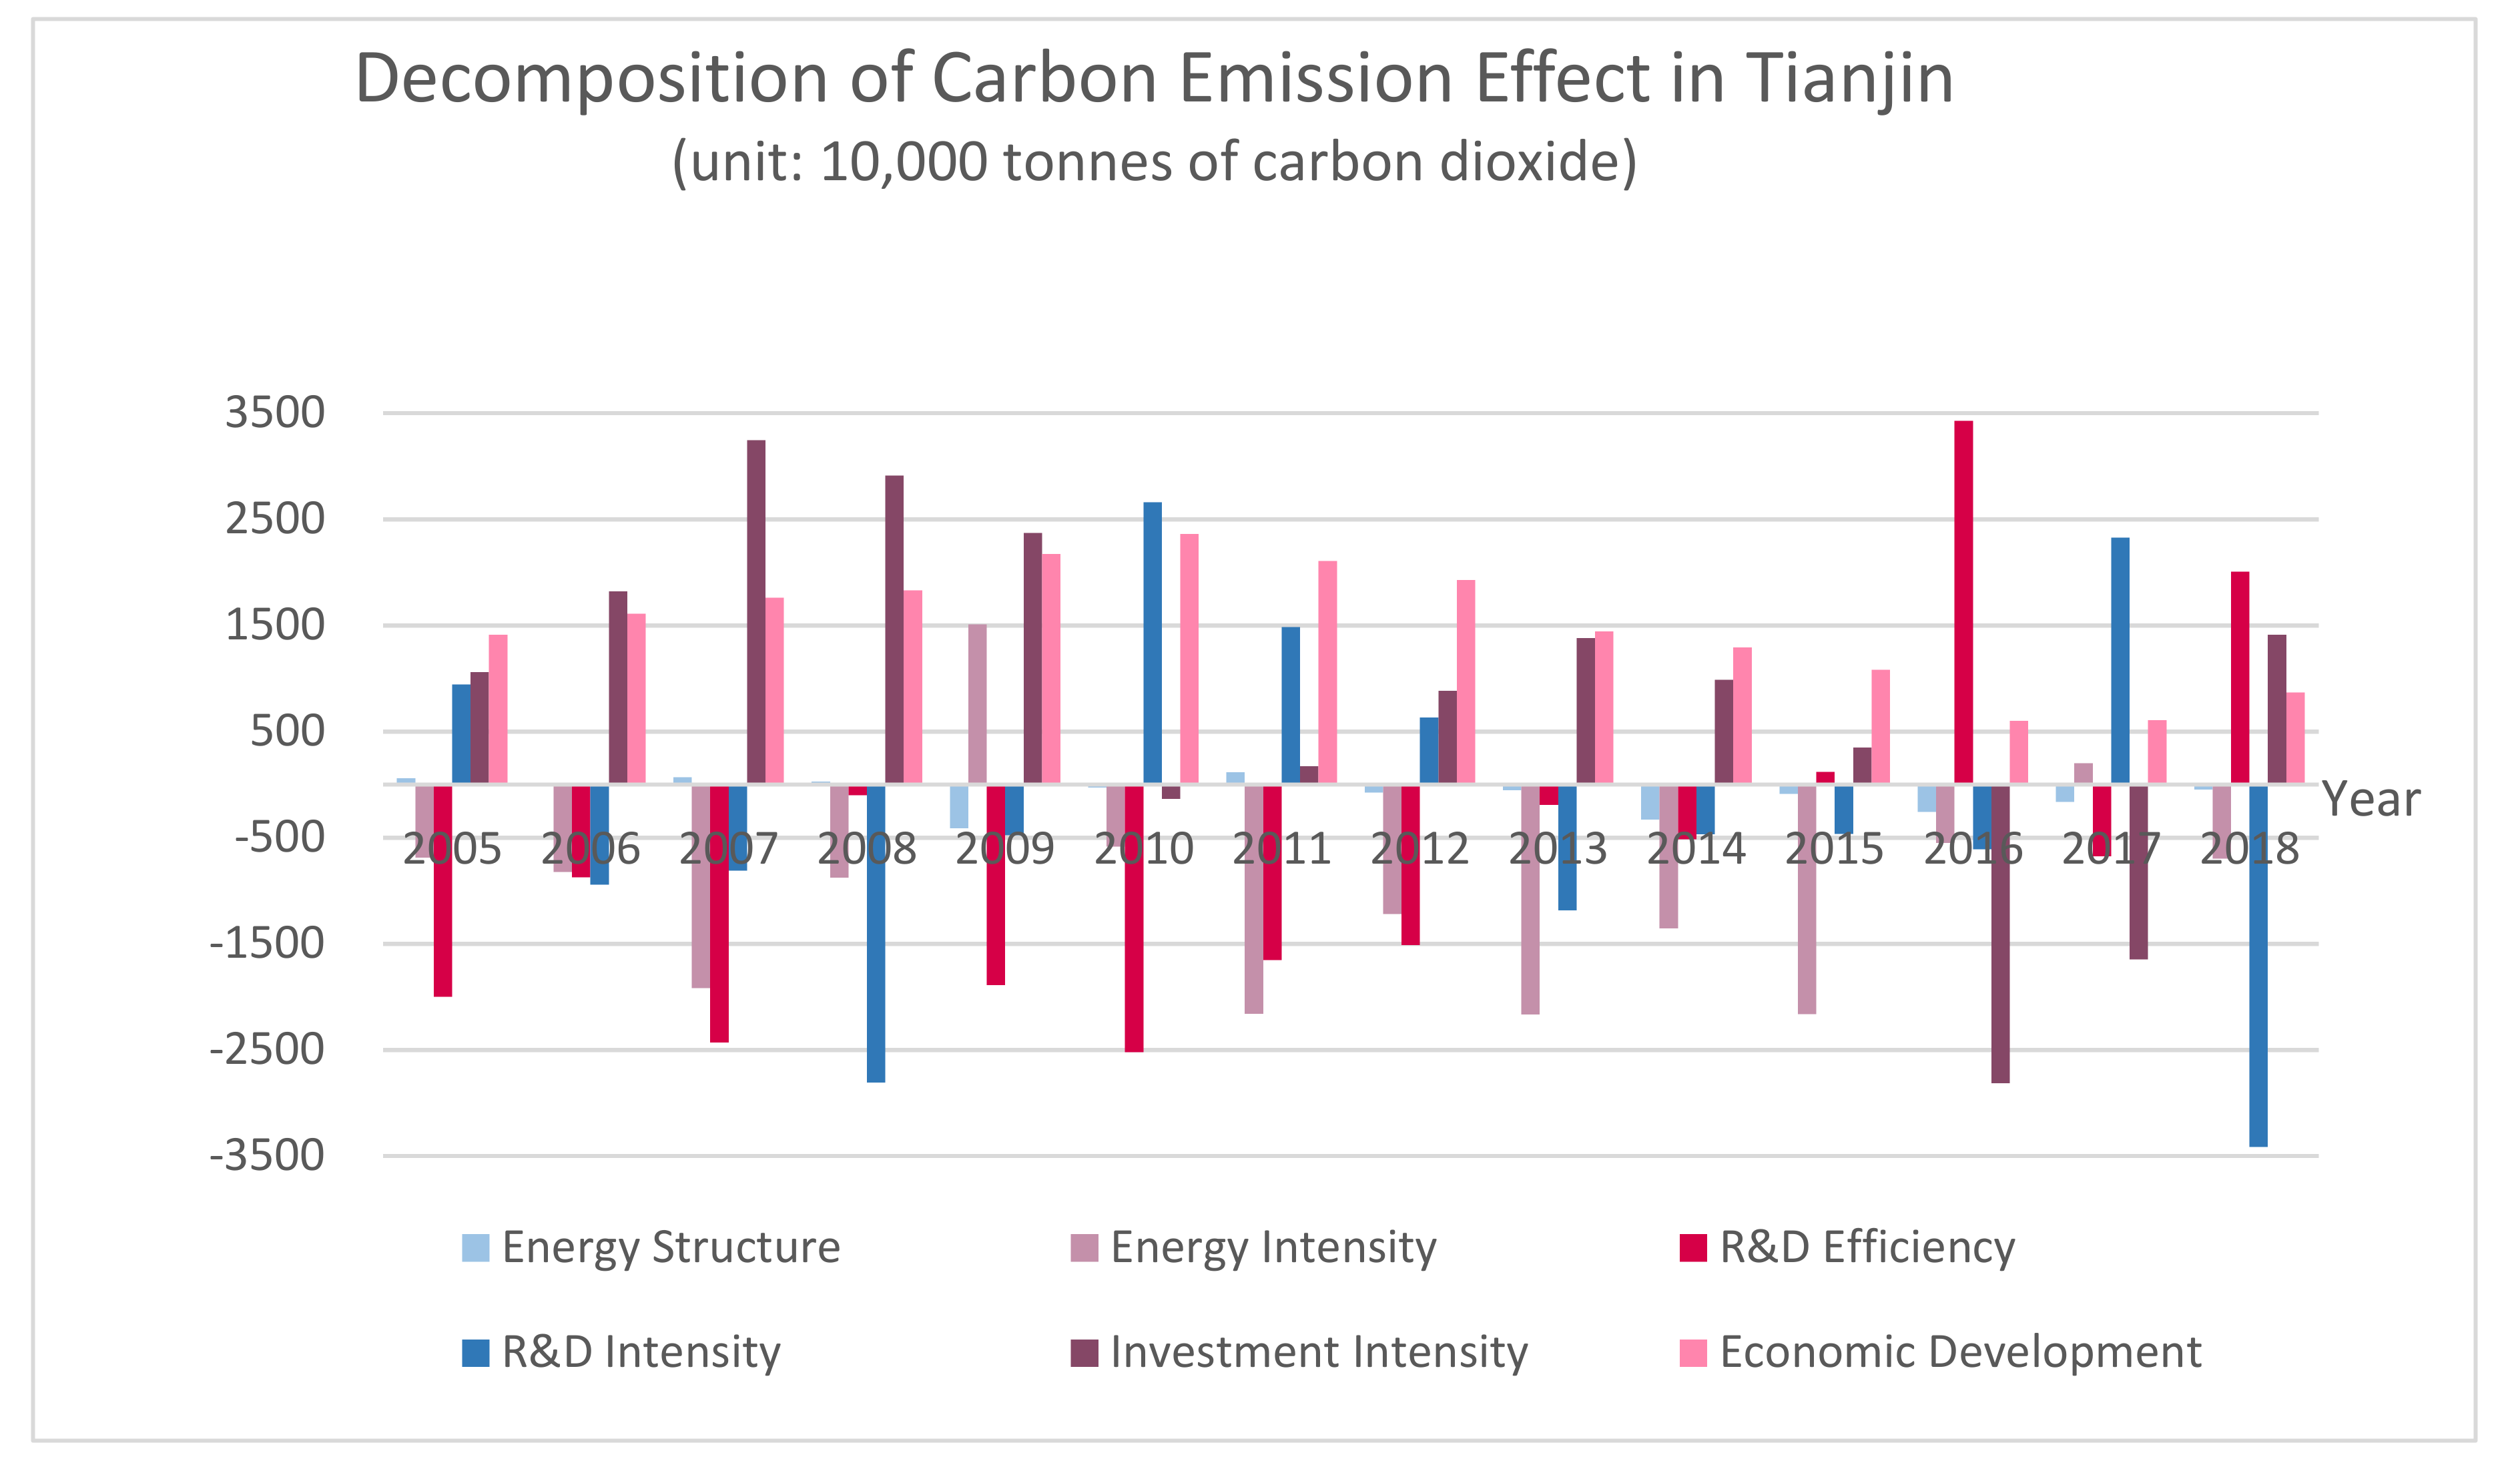
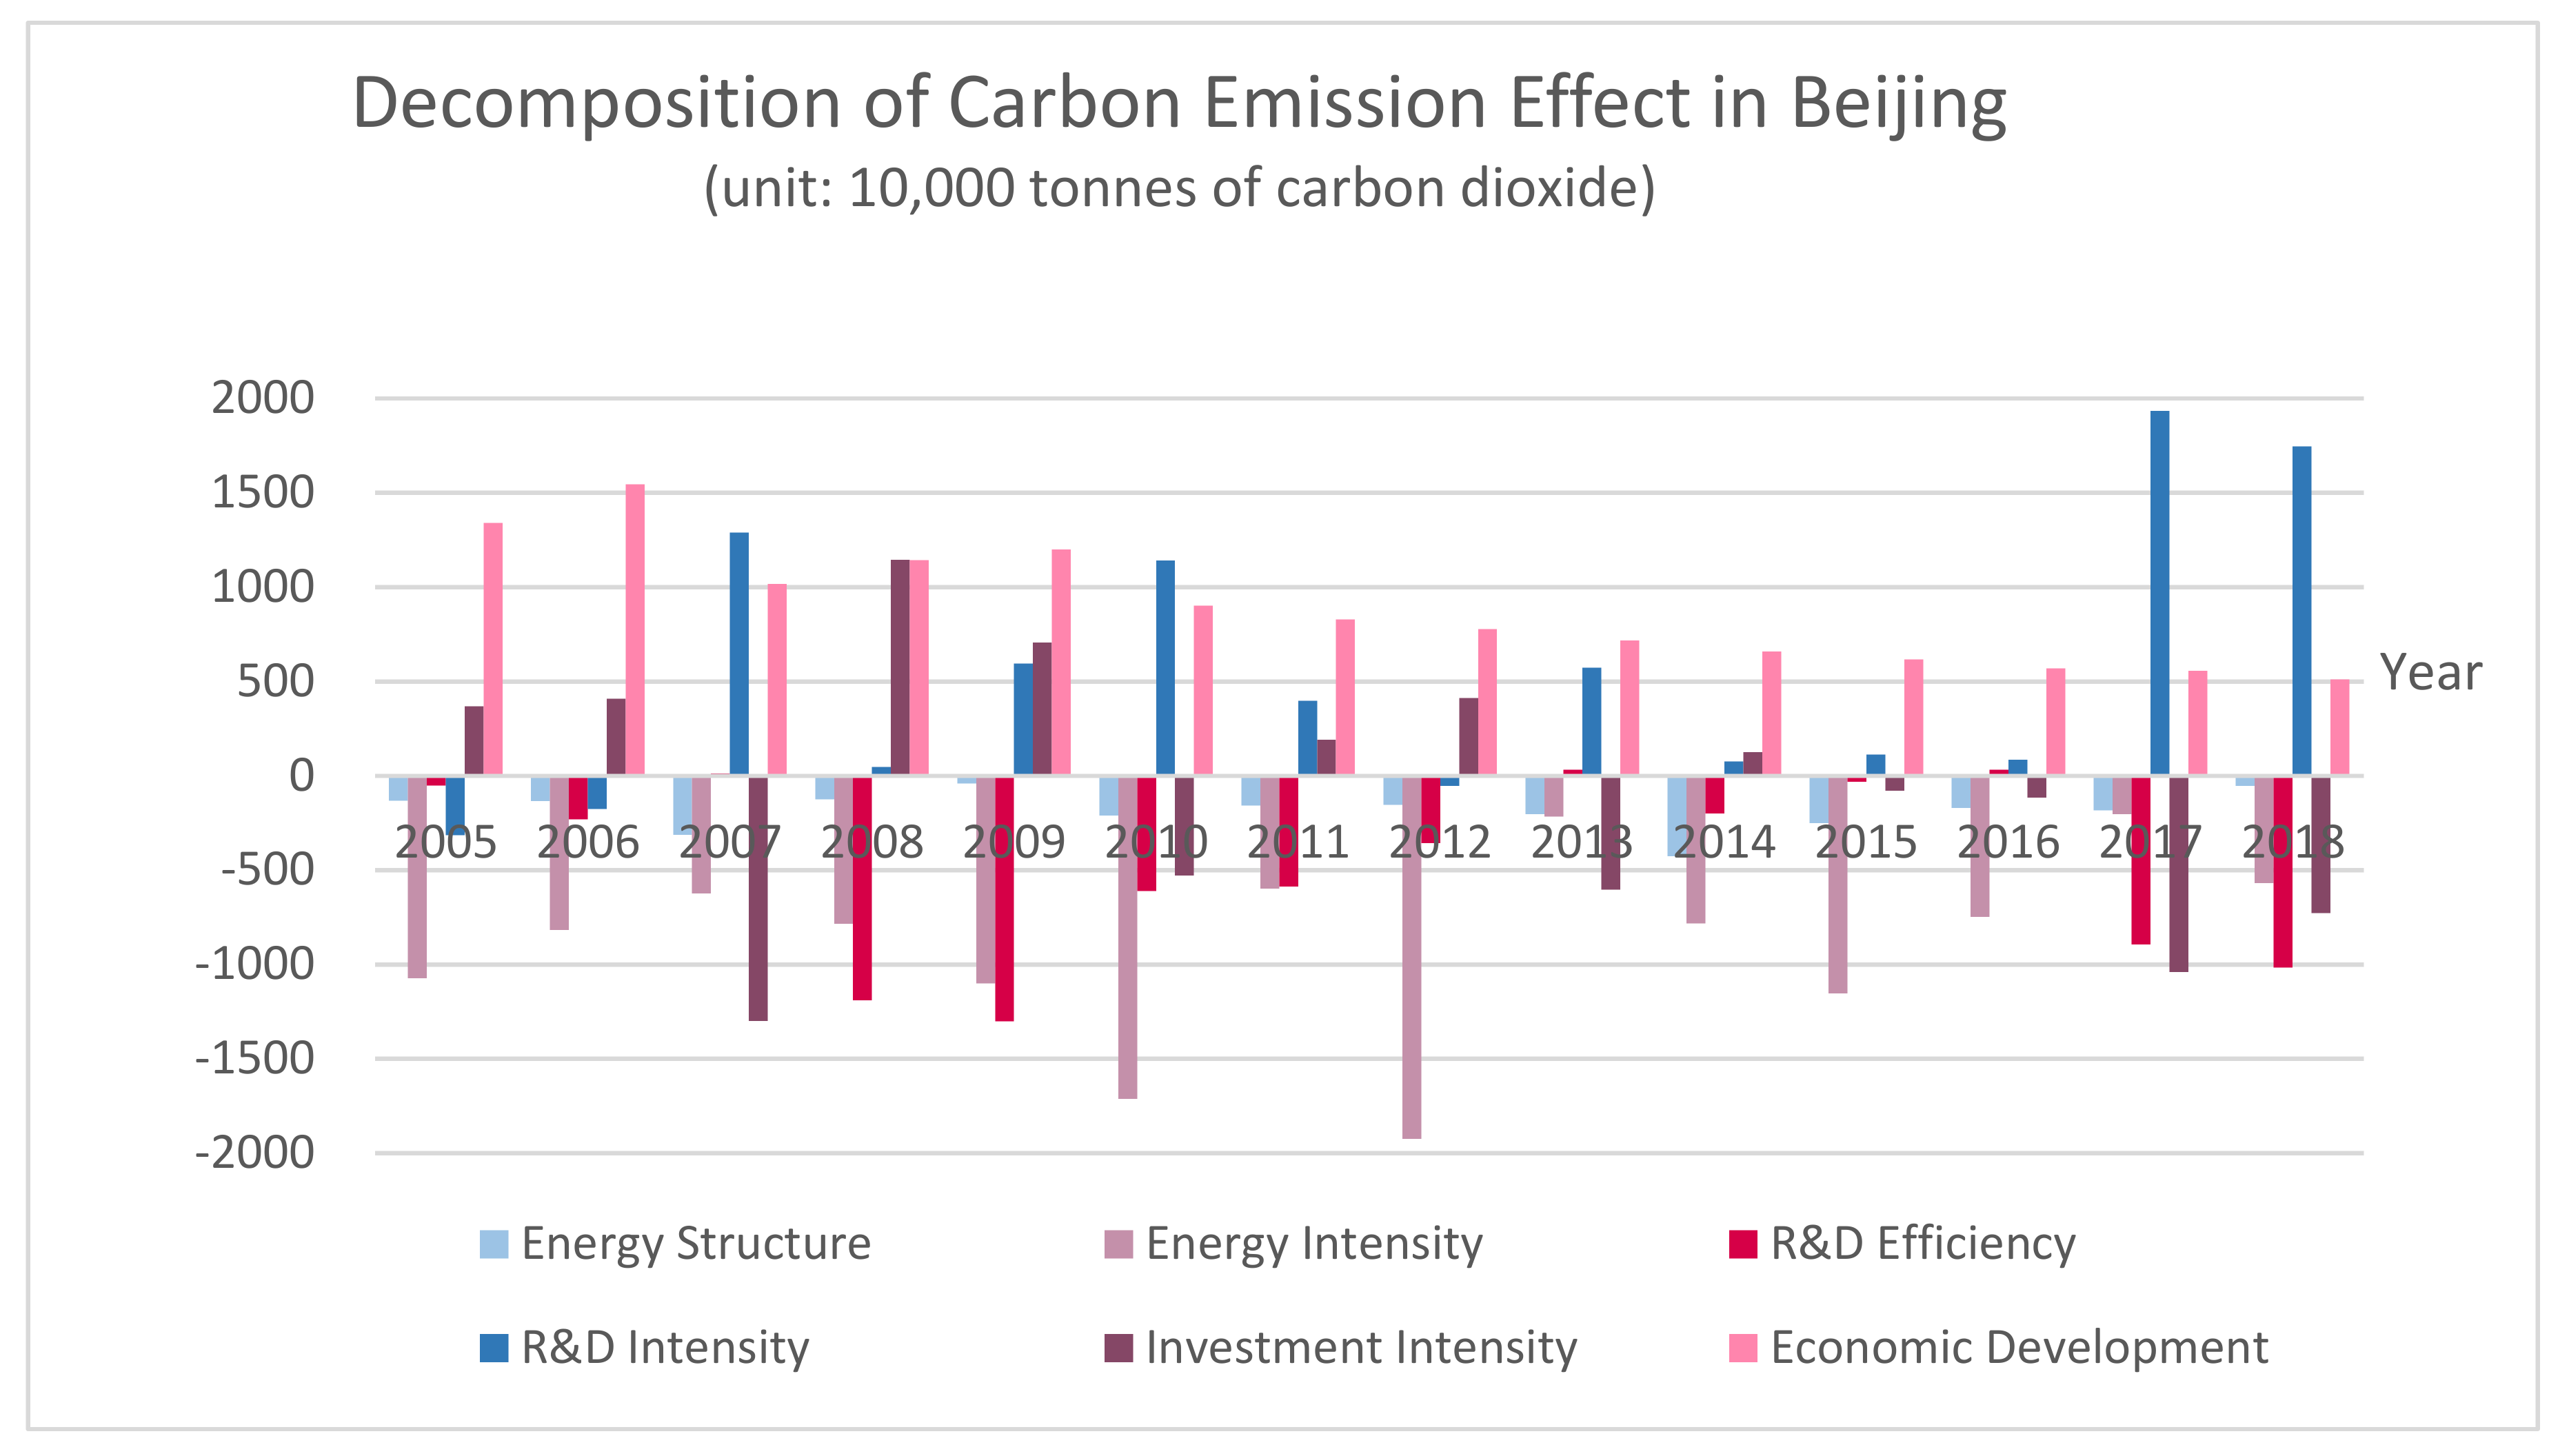
On the whole, from 2005 to 2019, the total carbon emissions of B–T–H increased by 1.5 times, with Hebei accounting for the largest proportion (74.9%), making it key to the control of energy-related carbon emissions from B–T–H and for formulating energy-saving and emission-reduction strategies (Figure 3). In terms of stages, 2005–2011 was the rapid growth stage of carbon emissions in Hebei Province, with an average annual growth rate of 10%. The extensive economic development mode, with high growth and high carbon emissions, puts the region’s ecosystem under greater pressure. In 2011, China put forward the twelfth five-year plan with the theme of ‘green development’ for the first time, which clearly put forward the comprehensive use of various means to reduce emissions, such as adjusting industrial structure and energy structure, saving energy and improving energy efficiency, increasing forest carbon sinks, and greatly reducing carbon intensity. The policy of controlling greenhouse gas emissions has achieved remarkable results: from 2011 to 2019, carbon emissions in Hebei Province entered a basically stable stage, with an average annual growth rate of only 0.4%. Consistent with the results of Liang et al. [4], Tianjin (15.6%) ranked second and Beijing (9.5%) third in terms of total carbon emissions. Both regions experienced two stages, from slow growth to steady decline. The former peaked in 2013 and the latter peaked in 2010. This reflects the fact that Beijing and Tianjin have taken the lead in realizing peak carbon dioxide emissions and are steadily moving towards carbon neutrality. In particular, Beijing’s carbon emissions were already lower than the total amount at the beginning of the study period in 2014, and have further decreased since then. To some extent, it indicates that China’s economy has entered a stage of high-quality development. Implementing the new development concept and adapting to the new normal of economic development have become the mainstream of development.
In terms of energy sources, during the research period, carbon emissions caused by coal consumption in Hebei contributed 64.6% of the province’s total capacity, making it the most significant source of carbon emissions. Hebei is an important province for China’s coal supply, and the steel industry, with coal as the main energy, is one of its leading industries. With 2011 and 2015 as the boundary, the research interval can be divided into three stages. The carbon emissions from coal consumption in Hebei first increased rapidly, then basically stabilized, and finally decreased slowly, with annual average growth rates of 8.3%, 0.7% and −2.3%, respectively. In 2015, the carbon emissions from coal were the highest. The second largest emission source, coke, accounted for 25.9%. Unlike the trend seen with coal, it continuously increased from 2015 to 2019, but the growth rate was significantly slower than the previous period. The growth rates of the three stages were 14.5%, −1.5% and 4.6%, respectively. Other energy sources accounted for a small proportion of carbon emissions, and their fluctuations were not large.
The main energy source of carbon emissions in Tianjin during the study period was also coal (48.6%). The trend of carbon emissions caused by coal formed an inverted ‘U’-shape, increasing first and then decreasing. The year 2012 saw Tianjin become the second city in China, after Beijing, to take the lead in proposing total coal consumption control, which significantly reduced coal carbon emissions by −7.6% in the 2014–2017 period, and to below the initial 2005 level in 2019. This is enough to show that Tianjin has achieved remarkable results in carbon emissions reduction. The carbon emission of crude oil (13%), second only to that of coal, increased abruptly by 85% in 2010 and continued to fluctuate around this level in subsequent years. This is due to a historic leap of 30 million tonnes of oil and gas production from the Bohai oilfield in Tianjin in 2010. Although the share of carbon emissions from natural gas is only 5.2%, it is worth mentioning that its emissions have been increasing year by year, with a cumulative increase of 74 times during the study period.
Differing from the trends in coal carbon emissions of Hebei and Tianjin, the carbon emissions caused by coal in Beijing dropped sharply, from 58.32 million tonnes in 2005 to 3.47 million tonnes in 2019, a decrease of 94%. This is due to Beijing’s comprehensive shutdown of high-energy-consuming and high-emission coal mines and coal-fired power plants, expanding the scale of clean heating and gradually achieving the goal of basically no coal from the central area to the city’s plains. Under this series of measures, Beijing’s coal consumption has sharply decreased. By 2019, it was only 1.82 million tonnes, only 0.6% of that in Hebei and 4.9% of that in Tianjin. Carbon emissions from crude oil have gradually increased, reaching a peak in 2009 and have since fluctuated downwards through 2019, reaching essentially the same level seen in 2007. In addition, Beijing has deployed a series of measures to realise the leap-forward development of natural gas utilisation in the Twelfth Five-Year Energy Development Plan and further achieved the goal of connecting all 16 areas under its jurisdiction with natural gas pipelines during the Thirteenth Five-Year Plan period. This has led to a significant increase in natural gas consumption. The resulting carbon emissions have experienced considerable growth, with an average annual growth rate of 35.1%, making it the largest source of carbon emissions in Beijing after 2016.

4.2. LMDI Analysis

The total carbon emission effect of Hebei (Figure 4) was the largest and was much higher than that in Beijing and Tianjin. It can be divided into three stages taking 2010 and 2013 as the boundaries: fluctuating growth, rapid decline, fluctuating reduction. Economic development was dominant (contributing 240%), which was consistent with the conclusion of Kong et al. [9], Liang et al. [4] and other scholars. Since 2005, Hebei ‘s carbon emission has increased year by year, reaching a peak in 2010, and then declining rapidly. The second most important promoting factor was the investment intensity (227.9%). This is because investment in fixed assets, as the basic driving force for economic expansion, has received strong support and policy preference from the Hebei government, with total fixed asset investment increasing 9.1 times, at an average annual growth rate of 57.9%, during the study period. Energy-intensive industries such as steel, construction, and chemical production have developed rapidly with the changes in investment intensity, resulting in significant increases in carbon emissions. The research and development efficiency is the most important inhibitory factor of carbon emissions in Hebei, with a contribution rate of −257.6%, even exceeding the energy intensity (−135.7%). Increased research and development efficiency means a higher turnover of research and development funds, with the same economic output requiring less research and development support, corresponding to reduced carbon emissions. In addition, due to the rapid increase in fixed asset investment, the research and development intensity changed from negative to positive during the study period, ultimately contributing 29.7% of the carbon emission increment. The energy structure is negligible (−4.3%), indicating that the slight adjustment of the coal-based energy structure had little impact on carbon emissions.
The total effect of the carbon emissions in Tianjin (Figure 5) increased first and then decreased from 2007 to 2011 and stabilised at a low level thereafter. The economic development made the largest contribution (330.9%). Similar to Hebei, the trend was first to increase and then to decrease, with the peak in 2010, but the decline was more severe than that of Hebei, with only 25.3% of the maximum in 2016. This reflects that Tianjin has accelerated its green and low-carbon development, focused on building an ecologically liveable city, and paid more attention to quality in its economic development. The investment intensity was second only to the economic development, contributing 188.2% to total carbon emissions. The energy intensity was the most significant factor in curbing carbon emissions in Tianjin, contributing −212.3%, but was not enough to offset the increased carbon emissions from the economic development. In addition, research and development efficiency and research and development intensity also suppressed carbon emissions, contributing −138.7% and −49.6%, respectively. These factors reflect benefits from Tianjin’s push to upgrade high-energy-consuming and high-emission equipment, introduce foreign capital, and speed up scientific and technological innovation to continuously improve energy efficiency. In addition, the energy structure is also conducive to reducing carbon emissions in Tianjin (−18.6%), meaning that the transition to clean energy sources such as natural gas has gradually produced results.
Beijing’s energy-related carbon emission effect was stable at a low level and fluctuated slightly in individual years (Figure 6). The total effect was −25.01 million tonnes, the only region of the three with a negative total carbon emission effect. This is consistent with the previous conclusion that total carbon emissions in 2019 were lower than those in 2005. It means that the contribution of factors that caused the increase in carbon emissions to the total effect were negative, and the reductions were positive. For ease of understanding, the following contributions to the total effect are expressed as inverse numbers. The economic development was the most important stimulating factor of carbon emissions, contributing 494.6% to the total effect. Except for a slight increase in 2006, 2008, and 2009, it gradually declined overall, with a total decrease of 61.9% during the study period. This reflects Beijing’s efforts to build a new pattern of green development and a low-carbon economy. In second place was the research and development intensity (297.5%), which is also the effect with the largest increase over the study period (increase of 652.1%). This is due to Beijing’s in-depth implementation of an innovation-driven development strategy and accelerated construction of a national science and technology innovation centre. The scale of research and development expenditure was much higher than that of Hebei and Tianjin, and it has grown rapidly. The sharp increase in research and development expenditure was accompanied by an expansion in the scale of research and development, which enhanced the research and development intensity and lead to an increase in carbon emissions. Like Tianjin, the energy intensity was the main factor negatively affecting Beijing’s carbon emissions (−492.2%), basically offsetting the impact of the economic development. Since the economy entered a new normal, a low energy consumption and high output economic development approach has become the inevitable path for the capital’s development, and the application of advanced energy-saving and emission-reduction technologies has made it possible to greatly increase energy efficiency. Another factor that significantly inhibited Beijing’s carbon emissions was research and development efficiency. Although it fluctuated greatly between years, it was mainly negative, accounting for −255.8% of the total effect. The contribution of the energy structure was −102.5%, far exceeding its proportion in the total effects of Hebei and Tianjin. The implementation of the no-coalification policy in urban areas, the improvement of the natural gas infrastructure, and an increase in the proportion of clean energy sources, such as wind and solar power, have all facilitated the green, low-carbon transformation of Beijing’s energy structure that helped to reduce carbon emissions. The investment intensity also had a dampening effect on carbon emissions (−41.7%).

4.3. Tapio Analysis

During the study period, Hebei’s carbon emissions were weakly decoupled from economic development, with a decoupling coefficient of 0.3, indicating that carbon emissions increased with economic growth, but at a slower rate (Figure 7). The research period was further divided into three stages: 2005–2009, 2010–2015 and 2015–2019. Hebei showed weak decoupling at all stages, indicating that the work of reducing carbon emissions has achieved initial results, but there is a significant way to go before achieving a strong decoupling. Tianjin was also weakly decoupled (0.2) overall, and the presentations of different stages were: weak decoupling–weak decoupling–strong decoupling, indicating that the overall trend is improving and that economic development is gradually reducing environmental exploitation and entering a sustainable economic model. However, it is worth noting that Tianjin experienced expansionary negative decoupling in 2010 and 2018. This means that it is necessary to continue to adhere to high-quality development, optimise the energy structure, improve the level of energy conservation, and reduce carbon emissions to prevent retrogression of the decoupling thus far achieved. The decoupling coefficient of Beijing was −0.1, showing a strong decoupling between carbon emissions and economic development. This means that not only is GDP gradually increasing, but also that carbon emissions are decreasing, which is the most desirable state of decoupling. The cases in different stages were: weak decoupling–strong decoupling–strong decoupling. It means that a win–win situation for the economy and the environment has been achieved, a long-term carbon reduction mechanism has been established, and economic development has entered a new normal.
The decoupling index model can quantify the specific contribution of each factor to decoupling carbon emissions. For Hebei, investment intensity was the leading factor in promoting decoupling. This is because a large increase in fixed asset investment led to an increase in production capacity and thus increased carbon emissions, which is consistent with the conclusion reached in the previous LMDI model. Research and development intensity was the biggest obstacle to the decoupling of Hebei’s carbon emissions. By increasing the intensity of research and development, the construction of scientific research infrastructure was promoted, but at the same time it caused continuous growth of carbon emissions, thus inhibiting the decoupling of carbon emissions. The second obstacle was research and development efficiency. These first two factors completely offset the positive effect of investment intensity on carbon emissions’ decoupling.
Contrary to Hebei, the research and development intensity was the biggest driver of Tianjin’s decoupling. The research and development spending in Tianjin was low and growing slowly, avoiding a significant increase in carbon emissions. Investment intensity was the main inhibiting decoupling factor in Tianjin, followed by research and development efficiency, both of which were greatly affected by the rapid growth of GDP. The expansion of economic scale and the increase in energy demand have stimulated the growth of carbon emissions. For Beijing, the inhibition effect of research and development intensity on decoupling was much greater than that of other factors. Research and development expenditure increased by 6.1 times, which led to a significant increase in research and development intensity and intensified decoupling pressure. Research and development efficiency was a major factor in promoting decoupling. It means that a unit of research and development expenditure could bring greater economic output, thus amplifying the decoupling effect. Second only to research and development efficiency, economic development had also greatly promoted the decoupling of carbon emissions. This shows that Beijing has paid more attention to environmental protection and sustainability in its development. The green and low-carbon economic model was decoupled from carbon emissions, forming a virtuous circle.

5. Conclusions and Policy Recommendations

5.1. Conclusions

In this paper, LMDI and Tapio models were used to measure, decompose, and decouple the carbon emissions of B–T–H from 2005 to 2019. In addition to conventional factors such as economic development, energy structure, and industrial structure, the effects of investment intensity, research and development intensity, and research and development efficiency were considered. Then, by substituting the effect factors from the decomposition results into the decoupling model, the contribution of each factor to decoupling was further quantified. The conclusions are as follows:

5.1.1. Carbon Emissions Related

From 2005 to 2019, total B–T–H carbon emissions increased by 1.5 times, with Hebei’s carbon emissions, which grew rapidly and then remained relatively stable over the study period, accounting for the largest share of the total (74.9%). Tianjin and Beijing’s emissions (15.6% and 9.5%, respectively) followed, both proceeding from slow growth to steady decline during the study period. Coal dominated carbon emissions in Hebei (64.6%) with a trend of rapid increase to general stability to a slow decline, supplemented by coke (25.9%). Tianjin’s emissions were also dominated by coal (48.6%), which rose then fell with a sharp rate of decline. Crude oil was the second source (13.0%). Natural gas carbon emissions increased by 74 times but remained a relatively minor source. Beijing’s coal carbon emissions fell by 94%. Crude oil emissions increased first, and then decreased, and natural gas carbon emissions became Beijing’s largest source of carbon emissions after 2016.

5.1.2. Related Influencing Factors

Economic development had a major stimulating effect on carbon emissions, while energy intensity and energy structure generally had inhibiting effects. These findings are consistent with the conclusions of most existing studies. In addition, the research and development efficiency was the primary carbon emission inhibiting factor in Hebei and the secondary carbon emission inhibiting factor in Tianjin and Beijing, which cannot be ignored in the rational formulation of carbon emission reduction policies. Investment intensity was a secondary carbon emission-promoting factor in Hebei and Tianjin, but it had a restraining effect on Beijing. Conversely, research and development intensity was a minor promoting factor in Beijing but had an inhibitory effect on Hebei and Tianjin.

5.1.3. Tapio Related

Beijing took the lead in achieving strong decoupling and maintaining stability, followed by Tianjin. Hebei remained at the weak decoupling level. The influence of innovative factors even exceeded conventional factors. However, the way they work varied from region to region: the research and development efficiency was the main facilitator of decoupling in Beijing but a secondary inhibitor in Hebei and Tianjin; the research and development intensity was the main inhibitor of decoupling in Hebei and Beijing but the main facilitator in Tianjin; and the investment intensity was the main facilitator of decoupling in Hebei but the main inhibitor in Tianjin.

5.2. Policy Recommendations

Based on the above research, this paper puts forward the following policy recommendations:

5.2.1. From the Perspective of Carbon Emissions

Hebei should increase the proportion of clean energy, and gradually reduce its proportion of coal consumption. Priority should be given to phasing out production capacity with low energy efficiency and high emissions. The coal-fired equipment that is still in service should be reduced in an orderly manner and exited in a planned way to balance the potential economic benefits and environmental pressure. A technological transformation should be carried out to improve energy efficiency and reduce emissions. Tianjin needs to propel the low-carbon transformation of the oil and gas industry. Oil companies are suggested to increase the investment in natural gas, so as to meet the requirements of carbon neutrality and realize long-term benefits. Beijing’s coal-free experience is worth popularizing in more pilot cities. Moreover, Beijing should continue to take advantage of scientific and technological innovation, to increase the proportion of green gases.

5.2.2. From the Perspective of Influencing Factors

B–T–H should give full play to the inhibition effect of research and development efficiency on carbon emissions and adjust the investment intensity and research and development intensity according to local conditions. Encourage and stimulate technological innovation and explore disruptive and transformative technologies that support carbon neutrality. Bolster the field of energy conservation and emission reduction, insure research and development support in fixed assets, accelerate the green upgrading of existing facilities and key energy-using equipment, promote the high-quality development of wind and solar power.

5.2.3. From the Perspective of Decoupling

Hebei needs to gradually reduce its dependence on energy consumption to achieve the transition from weak decoupling to strong decoupling. Tianjin should continue to maintain the existing circular economy development mode, optimise the energy consumption structure to prevent the recurrence of expansionary negative decoupling. Beijing, while maintaining and expanding its own strong decoupling, should increase its influence on Hebei and Tianjin, and actively guide other qualified regions into their low-carbon development model. Sustainability 15 09681 i001

Funding

This work was supported by the Fundamental Research Funds for the Central Universities (2022YJSGL11), the project of Key Laboratory of Resource and Environmental Carrying Capacity Evaluation, Ministry of Natural Resources (CCA2019.16) and the Philosophy and Social Science Foundation of China (16BJY054).

Institutional Review Board Statement

Not applicable.

Informed Consent Statement

Not applicable.

Data Availability Statement

Not applicable as no new data were created in this study.

Acknowledgments

Thanks to Yuncai Ning and Xun Zhou for their contributions in the process of determining the research direction and revising the manuscript. Thanks to Shuangshuang Fan and Xintong Zhang for providing valuable suggestions.

Conflicts of Interest

The author declares no conflict of interest.

References

  1. Gu, R.; Li, C.; Li, D.; Yang, Y.; Gu, S. The Impact of Rationalizatin and Upgrading of Industrial Structure on Carbon Emissions in the Beijing-Tianjin-Hebei Urban Agglomeration. Int. J. Environ. Res. Public Health 2022, 19, 7997. [Google Scholar] [CrossRef] [PubMed]
  2. Chai, Y.; Lin, X.; Wang, D. Industrial Structure Transformation and Layout Optimization of Beijing-Tianjin-Hebei Region under Carbon Emission Constraints. Sustainability 2021, 13, 643. [Google Scholar] [CrossRef]
  3. Yue, J.; Zhu, H.; Yao, F. Does Industrial Transfer Change the Spatial Structure of CO2 Emissions?—Evidence from Beijing-Tianjin-Hebei Region in China. Int. J. Environ. Res. Public Health 2022, 19, 322. [Google Scholar] [CrossRef] [PubMed]
  4. Liang, Y.; Niu, D.; Zhou, W.; Fan, Y. Decomposition Analysis of Carbon Emissions from Energy Consumption in Beijing-Tianjin-Hebei, China: A Weighted-Combination Model Based on Logarithmic Mean Divisia Index and Shapley Value. Sustainability 2018, 10, 2535. [Google Scholar] [CrossRef] [Green Version]
  5. Lou, T.; Ma, J.; Liu, Y.; Yu, L.; Guo, Z.; He, Y. A Heterogeneity Study of Carbon Emissions Driving Factors in Beijing-Tianjin-Hebei Region, China, Based on PGTWR Model. Int. J. Environ. Res. Public Health 2022, 19, 6644. [Google Scholar] [CrossRef]
  6. Li, M.; Wang, W.; De, G.; Ji, X.; Tan, Z. Forecasting Carbon Emissions Related to Energy Consumption in Beijing-Tianjin-Hebei Region Based on Grey Prediction Theory and Extreme Learning Machine Optimized by Support Vector Machine Algorithm. Energies 2018, 11, 2475. [Google Scholar] [CrossRef] [Green Version]
  7. Zhou, J.; Jin, B.; Du, S.; Zhang, P. Scenario Analysis of Carbon Emissions of Beijing-Tianjin-Hebei. Energies 2018, 11, 1489. [Google Scholar] [CrossRef] [Green Version]
  8. Zhao, Z.; Xuan, X.; Zhang, F.; Cai, Y.; Wang, X. Scenario Analysis of Renewable Energy Development and Carbon Emission in the Beijing–Tianjin–Hebei Region. Land 2022, 11, 1659. [Google Scholar] [CrossRef]
  9. Kong, H.; Shi, L.; Da, D.; Li, Z.; Tang, D.; Xing, W. Simulation of China’s Carbon Emission Based on Influencing Factors. Energies 2022, 15, 3272. [Google Scholar] [CrossRef]
  10. Zhao, X.; Jiang, M.; Zhang, W. Decoupling between Economic Development and Carbon Emissions and Its Driving Factors: Evidence from China. Int. J. Environ. Res. Public Health 2022, 19, 2893. [Google Scholar] [CrossRef]
  11. Jiang, R.; Zhou, Y.; Li, R. Moving to a Low-Carbon Economy in China: Decoupling and Decomposition Analysis of Emission and Economy from a Sector Perspective. Sustainability 2018, 10, 978. [Google Scholar] [CrossRef] [Green Version]
  12. Dong, J.; Wang, Q.; Deng, C.; Wang, X.; Zhang, X. How to Move China toward a Green-Energy Economy: From a Sector Perspective. Sustainability 2016, 8, 337. [Google Scholar] [CrossRef] [Green Version]
  13. Peng, D.; Liu, H. Measurement and Driving Factors of Carbon Emissions from Coal Consumption in China Based on the Kaya-LMDI Model. Energies 2023, 16, 439. [Google Scholar] [CrossRef]
  14. Wang, W.; Chen, H.; Wang, L.; Li, X.; Mao, D.; Wang, S. Exploration of Spatio-Temporal Characteristics of Carbon Emissions from Energy Consumption and Their Driving Factors: A Case Analysis of the Yangtze River Delta, China. Int. J. Environ. Res. Public Health 2022, 19, 9483. [Google Scholar] [CrossRef]
  15. Dong, J.-F.; Deng, C.; Wang, X.-M.; Zhang, X.-L. Multilevel Index Decomposition of Energy-Related Carbon Emissions and Their Decoupling from Economic Growth in Northwest China. Energies 2016, 9, 680. [Google Scholar] [CrossRef]
  16. Qin, J.; Gao, L.; Tu, W.; He, J.; Tang, J.; Ma, S.; Zhao, X.; Zhu, X.; Brindha, K.; Tao, H. Decomposition and Decoupling Analysis of Carbon Emissions in Xinjiang Energy Base, China. Energies 2022, 15, 5526. [Google Scholar] [CrossRef]
  17. Xia, C.; Li, Y.; Ye, Y.; Shi, Z.; Liu, J. Decomposed Driving Factors of Carbon Emissions and Scenario Analyses of Low-Carbon Transformation in 2020 and 2030 for Zhejiang Province. Energies 2017, 10, 1747. [Google Scholar] [CrossRef] [Green Version]
  18. Yang, S.; Zhu, S.; Deng, G.; Li, H. Study on Influencing Factors and Spatial Effects of Carbon Emissions Based on Logarithmic Mean Divisia Index Model: A Case Study of Hunan Province. Sustainability 2022, 14, 15868. [Google Scholar] [CrossRef]
  19. Wang, F.; Wang, C.; Su, Y.; Jin, L.; Wang, Y.; Zhang, X. Decomposition Analysis of Carbon Emission Factors from Energy Consumption in Guangdong Province from 1990 to 2014. Sustainability 2017, 9, 274. [Google Scholar] [CrossRef] [Green Version]
  20. Fu, C.; Min, W.; Liu, H. Decomposition and Decoupling Analysis of Carbon Emissions from Cultivated Land Use in China’s Main Agricultural Producing Areas. Sustainability 2022, 14, 5145. [Google Scholar] [CrossRef]
  21. Liu, J.; Yang, Q.; Zhang, Y.; Sun, W.; Xu, Y. Analysis of CO2 Emissions in China’s Manufacturing Industry Based on Extended Logarithmic Mean Division Index Decomposition. Sustainability 2019, 11, 226. [Google Scholar] [CrossRef] [Green Version]
  22. Meng, Z.; Wang, H.; Wang, B. Empirical Analysis of Carbon Emission Accounting and Influencing Factors of Energy Consumption in China. Int. J. Environ. Res. Public Health 2018, 15, 2467. [Google Scholar] [CrossRef] [Green Version]
  23. Jin, L.; Duan, K.; Shi, C.; Ju, X. The Impact of Technological Progress in the Energy Sector on Carbon Emissions: An Empirical Analysis from China. Int. J. Environ. Res. Public Health 2017, 14, 1505. [Google Scholar] [CrossRef] [Green Version]
  24. Feng, F.; Peng, L. Is There Any Difference in the Effect of Different R and D Sources on Carbon Intensity in China? Sustainability 2019, 11, 1701. [Google Scholar] [CrossRef] [Green Version]
  25. Huang, C.; Qu, Y.; Huang, L.; Meng, X.; Chen, Y.; Pan, P. Quantifying the Impact of Urban Form and Socio-Economic Development on China’s Carbon Emissions. Int. J. Environ. Res. Public Health 2022, 19, 2976. [Google Scholar] [CrossRef]
  26. Shen, T.; Hu, R.; Hu, P.; Tao, Z. Decoupling between Economic Growth and Carbon Emissions: Based on Four Major Regions in China. Int. J. Environ. Res. Public Health 2023, 20, 1496. [Google Scholar] [CrossRef] [PubMed]
  27. Liu, K.; Zhao, M.; Xie, X.; Zhou, Q. Study on the Decoupling Relationship and Rebound Effect between Economic Growth and Carbon Emissions in Central China. Sustainability 2022, 14, 10233. [Google Scholar] [CrossRef]
  28. Hao, Y.; Huang, Z.; Wu, H. Do Carbon Emissions and Economic Growth Decouple in China? An Empirical Analysis Based on Provincial Panel Data. Energies 2019, 12, 2411. [Google Scholar] [CrossRef] [Green Version]
  29. Xiao, P.; Zhang, Y.; Qian, P.; Lu, M.; Yu, Z.; Xu, J.; Zhao, C.; Qian, H. Spatiotemporal Characteristics, Decoupling Effect and Driving Factors of Carbon Emission from Cultivated Land Utilization in Hubei Province. Int. J. Environ. Res. Public Health 2022, 19, 9326. [Google Scholar] [CrossRef]
  30. Zhang, S.; Li, Y.; Liu, Z.; Kou, X.; Zheng, W. Towards a Decoupling between Economic Expansion and Carbon Dioxide Emissions of the Transport Sector in the Yellow River Basin. Sustainability 2023, 15, 4152. [Google Scholar] [CrossRef]
  31. Kahia, M.; Ben Aïssa, M.S.; Lanouar, C. Renewable and non-renewable energy use—Economic growth nexus: The case of MENA Net Oil Importing Countries. Renew. Sustain. Energy Rev. 2017, 71, 127–140. [Google Scholar] [CrossRef]
  32. Komal, R.; Abbas, F. Linking financial development, economic growth and energy consumption in Pakistan. Renew. Sustain. Energy Rev. 2015, 44, 211–220. [Google Scholar] [CrossRef]
  33. Tapio, P. Towards a theory of decoupling: Degrees of decoupling in the EU and the case of road traffic in Finland between 1970 and 2001. Transp. Policy 2005, 12, 137–151. [Google Scholar] [CrossRef] [Green Version]
Figure 1. The Beijing–Tianjin–Hebei region (B–T–H).
Sustainability 15 09681 g001
Figure 2. Decoupling state division.
Sustainability 15 09681 g002
Figure 3. Energy-related carbon emissions and their accumulation in B–T–H (unit: 10,000 tonnes of carbon dioxide).
Sustainability 15 09681 g003
Figure 4. Decomposition of carbon emissions in Hebei.
Sustainability 15 09681 g004
Figure 5. Decomposition of carbon emissions in Tianjin.
Sustainability 15 09681 g005
Figure 6. Decomposition of carbon emissions in Beijing.
Sustainability 15 09681 g006
Figure 7. Decoupling index decomposition and year-by-year decoupling results in B–T–H.
Sustainability 15 09681 g007
Disclaimer/Publisher’s Note: The statements, opinions and data contained in all publications are solely those of the individual author(s) and contributor(s) and not of MDPI and/or the editor(s). MDPI and/or the editor(s) disclaim responsibility for any injury to people or property resulting from any ideas, methods, instructions or products referred to in the content.

