Article

Spatial Disequilibrium and Dynamic Evolution of Eco-Efficiency in China’s Tea Industry

College of Rural Revitalization, Fujian Agriculture and Forestry University, Fuzhou 350002, China
*
Author to whom correspondence should be addressed.
Sustainability 2023, 15(12), 9597; https://doi.org/10.3390/su15129597
Submission received: 24 April 2023 / Revised: 8 June 2023 / Accepted: 12 June 2023 / Published: 15 June 2023

Abstract

:
Eco-efficiency is a significant target for evaluating the agricultural ecosystem and measuring sustainable agricultural development through quantitative analysis. It is also an essential part of constructing the ecological tea garden, which offers a directional function in realizing the green development of the tea industry. After measuring the eco-efficiency of China’s tea industry using the super-efficiency SBM model, this paper analyzes the spatial disequilibrium and dynamic evolution trend of the eco-efficiency in China’s tea industry through the method of Dagum Gini Coefficient and Kernel Density Estimation. The results show that the level of eco-efficiency in China’s tea industry was improved overall, and the spatial disequilibrium was significantly reduced. The differences within the tea region decreased as follows: tea regions in Southwest China, South China, south of the Yangtze River, and north of the Yangtze River; the overall difference in the eco-efficiency in the tea industry mainly comes from the contribution of the interregional difference in tea regions, and the second contribution comes from the intraregional difference in tea regions and the difference in super-variable density. The eco-efficiency of the tea industry has been improved both nationally and within the top four tea regions; the disequilibrium between areas and within the tea region has been largely alleviated, but there is still room to optimize the input–output structure and promote the eco-efficiency.

1. Introduction

China is the homeland of tea that boasts a long-standing history of tea planting. Tea is one of the most significant economic crops in China. As of 2019, the area of tea gardens in China was 3,105,000 square hectares, an increase of 80.36% compared to 1,719,000 square hectares in 2008; tea production also increased from 1.258 million tons in 2008 to 2.777 million tons in 2019, with an increase of 120.75%. Meanwhile, in 2018, China became the country with the largest export share in the international tea market [1]. However, the rapid expansion of tea-planting areas and the growth spurt in tea output are bought about at the price of problems, including the consumption of many agricultural production resources, such as land and water, and the excessive use of chemical fertilizers, causing severe diffused pollution, which is detrimental to the sustainable development of the tea industry. Eco-efficiency can measure the undesired output produced in agricultural development, and the higher the eco-efficiency of the tea industry, the more attention is paid to environmental protection, and the less the problem of excessive application of chemical fertilizers will occur, which is necessary to achieve green agricultural development. The existing research on the eco-efficiency of the tea industry is mainly focused on technical and production efficiency, and the attention to eco-efficiency is not enough, which will not be conducive to the sustainable development of the tea industry and the green development of agriculture.

Literature Review

Eco-efficiency, the ratio of economic growth to environmental load brought about by input factors, is an effective quantitative analysis tool for sustainable development [2]. It was initially introduced by German scholars Schmalleger and Sturm [3]. In recent years, with the research and promotion of OECD (Organization for Economic Co-operation and Development) and WBCSD (World Business Council for Sustainable Development), industrial development has increasingly attached importance to eco-efficiency. It has become an indispensable instrument for measuring and assessing all walks of life. For instance, the relationship between eco-efficiency and enterprise economic value [4,5], the relationship between eco-efficiency and industrial development [6], and the function of eco-efficiency in electronics can all be measured [7], suggesting that eco-efficiency has become a fundamental evaluation indicator to measure whether the industry is healthy and sustainable [8].
In agriculture, eco-efficiency is a critical indicator for measuring agriculture’s sustainable development level [9]. Scholars from different nations have differing angles, including investigating the agricultural eco-efficiency of EU countries, other developing nations [10,11], and China from the macro-perspective [12]. Researchers are also working at the industry level, as evidenced by Muller’s investigation into the role of eco-efficiency in assessing the sustainability of kiwifruit production in New Zealand [13], Masuda’s assertion that understanding the eco-efficiency of wheat production can contribute to sustainable agriculture [14], and Ounsaneha’s assessment of eco-efficiency as a critical indicator in the evaluation and analysis of the expansion of rubber plantations in Thailand [15]. In addition, some scholars focus on eco-efficiency from the micro-perspective, such as farms and forestry companies [16,17,18]. Although scholars have a consensus that eco-efficiency is crucial to the sustainable development of agriculture, there is also a point of view that eco-efficiency centrism is unexpected. Korhonen claims that eco-efficiency can be used as a tool and indicator but is unsuitable as an overall goal of development [19]. Park contends that improving food security cannot only be addressed from the perspective of eco-efficiency [20]. Regarding research methods, the super-efficiency DEA-Malmquist model, the DEA-SBM model, and the DEA and SFA model based on GME are more frequently employed [21,22,23]. At the same time, innovative efforts have been made to analyze urban eco-efficiency with the hybrid Trigonometric Envelopment Analysis for Ideal Solutions (TEA-IS) model [24]. In the research process, this study refers to the research of the above scholars and uses the ultra-efficient SBM model to measure eco-efficiency.
In comparison with the above research, it can be found that there is less research on the eco-efficiency of the tea industry, which is incongruous given that tea is the second most popular non-alcoholic beverage in the world except water [25]. Scholars of existing research have concentrated more on theoretical analysis of the development status [26,27], scale and trend [28,29], and countermeasures to enhance the competitiveness of the tea industry [30]. Research concentrating on the eco-efficiency of the tea industry is much rarer than empirical studies on the development of tea production [31].
In addition, the existing research on the tea industry in the academic community pays too much attention to production efficiency and technical efficiency. It does not pay enough attention to eco-efficiency [32,33]. This research will mainly study the eco-efficiency of the tea industry, which can not only lead to innovation in this research but also remind scholars to pay attention to eco-efficiency as an important way to promote the sustainable development of the industry.

2. Data Sources and Research Methods

2.1. Data Sources

Since the statistics on China’s tea industry were only gradually completed after 2008, and some statistical work could not be carried out due to the impact of COVID-19 in the three years after 2019, this paper selects the period from 2008 to 2019 with more complete data as the research period. The inputs of land, fertilizer, machinery, and labor in the tea production process are taken as input factors, and the output value of the tea industry and the loss of total nitrogen and total phosphorus from the undesired output of fertilizer are taken as the output factors. The original values of the data used in the study are derived from the China Statistical Yearbook (http://www.stats.gov.cn/sj/ndsj/ (accessed on 13 June 2023)), China Rural Yearbook (http://cnki.nbsti.net/CSYDMirror/Trade/yearbook/single/N2019120190?z=Z009 (accessed on 13 June 2023)), China Agricultural Yearbook (http://cnki.nbsti.net/CSYDMirror/trade/yearbook/Single/N2022030154?z=Z009 (accessed on 13 June 2023)), China Tea Statistical Yearbook (http://www.tjcn.org/e/search/result/?searchid=4933 (accessed on 13 June 2023)), and Compilation of China Agricultural Product Cost Benefit Information over the years (https://zhuanlan.zhihu.com/p/462211262 (accessed on 13 June 2023)), as well as the statistical yearbooks of every province and city, as well as relevant websites, such as China Tea (https://www.teadata.net/fwm/index.html (accessed on 13 June 2023)), China Tea Circulation Association (https://www.ctma.com.cn/ (accessed on 13 June 2023)), and the data of 16 major tea-producing provinces from 2008 to 2019, are calculated and collated. In order to avoid the impact of the price factor, the output values involved in the indicators are adjusted to constant prices in 2010 based on the annual price index of the China Statistical Yearbook (http://www.stats.gov.cn/sj/ndsj/ (accessed on 13 June 2023)). Due to the particularity of the tea industry, some indicators lack direct data. For example, there are no direct statistics on the labor input part of the tea industry, and the tea area needs to be calculated through conversion, so the calculation method adopted by Liu and Zhang [34] and other predecessors is used for reference. In addition, this paper divides China’s 16 central tea-producing provinces into the top four tea regions based on the practices of Xiao Zhi et al. [35]: the tea region of Jiangnan (Jiangxi, Hubei, Jiangsu, Hunan, Zhejiang, Anhui), the tea region of Jiangbei (Shandong, Henan, Shaanxi), the tea region of South China (Fujian, Guangdong, Guangxi), and the tea region of Southwest China (Chongqing, Yunnan, Sichuan, Guizhou). This study obtains data on indicators, such as the input and output, of the tea industry in China’s 16 major tea-producing provinces from the above-mentioned statistical yearbook and other websites.
This paper employs the pollution discharge coefficient method to calculate the runoff or leaching loss of total nitrogen and total phosphorus in the tea industry because the loss of total nitrogen and total phosphorus in the tea industry is closely related to the topographic features, rainfall conditions, and the total nitrogen and total phosphorus fertilizing rate of a certain province. The calculation method is as follows:
K = K 0 + F × C
In Formula (1), K is the runoff or leaching loss of total nitrogen and total phosphorus; K 0 is the loss of total nitrogen and total phosphorus without fertilization; F is the total nitrogen and total phosphorus fertilizing rate in the tea industry; C is the rate of the runoff or leaching loss of total nitrogen and total phosphorus. K 0 and C are derived from “National First Pollution Source Census—Handbook of Agricultural Pollution Source Fertilizer Loss Coefficient”. Different models are used in accordance with how the topography varies amongst provinces. For instance, the total nitrogen loss coefficient in most southern provinces is 0.174%, and the total phosphorus loss coefficient is 0.072%; the total nitrogen loss coefficient in most northern provinces is 0.275%, and the total phosphorus loss coefficient is 0.02% [36]. The total application rate of nitrogen and phosphorus fertilizer in the tea industry includes the sum of the active constituent of nitrogen/phosphorus in single fertilizer and compound fertilizer. Based on the research of Sun Cheng et al. [37], the calculation for the active constituent of nitrogen and phosphorus in compound fertilizers uses a general fertilizer ratio of 15:15:15, meaning that the total application rate of nitrogen/phosphorus fertilizer in the tea industry is the application rate of nitrogen/phosphorus fertilizer + the application rate of compound fertilizer * 15%.

2.2. Research Method

2.2.1. Super-Efficiency SBM Model

The traditional DEA approach, created by Charnes and Cooper in 1978 [38], is characterized by the ability to measure the efficiency with multiple inputs and multiple outputs, but on the assumption that the returns to the size of the decision-making unit remain constant. Banker, Charnes, and Cooper proposed a variable-scale return data envelopment (BBC) model based on the original DEA model in 1984 [39], including pure technical efficiency and scale technical efficiency. However, these models have a common disadvantage, which is that the radial model that calculates production efficiency based on the input angle or output perspective and the processing of the decision-making unit is based on the same proportion of reducing input or expanding output proportionally, which may deviate from the actual efficiency value. Tone constructed a non-radial, non-angular SBM model in 2001 [40], which has the advantage of measuring the relaxation variables of inefficient decision units. However, the disadvantage is that the model does not consider undesired outputs, such as non-point source pollution and carbon emissions, in agricultural production. Therefore, in 2004, tone perfected the ultra-efficient SBM-DEA model based on undesired output [41]. In this paper, the total nitrogen loss of fertilizer and the total phosphorus loss of fertilizer in the tea industry are regarded as undesired outputs, and the super-efficient SBM model formula introduced by Cheng Gang [42] is referred to as follows:
min ρ = 1 + 1 m i = 1 m S i x X i k 1 1 S 1 + S 2 r = 1 S 1 S r y y r k + i = 1 S 2 S i Z Z i k
S . t . X i k j = 1 n , j k λ j X j S i X , y r k j = 1 n , j k λ j y j + S r y , Z i k j = 1 n , j k λ j Z j S i Z , 1 1 S 1 + S 2 r = 1 S 1 S r y y r k + i = 1 S 2 S i Z Z i k > 0 , λ j , S i X , S r y , S i Z 0 j = 1 , 2 , , n , j k
Among them, ρ is the eco-efficiency of the tea industry, with an interval range of 0–1. m is the input factor (in this study, land, fertilizer, machinery, and labor inputs in the tea production process). “ S 1 ” represents expected output (the output value of the tea industry); “ S 2 ” represents unexpected output (loss of total nitrogen and total phosphorus from fertilizers); and i , r , and ι represent the i -th, r -th, and ι -th elements. S i X S ι Z represents the input and unexpected output redundancy, and S r y represents insufficient expected output. When ρ 1 , it indicates that the eco-efficiency of the tea industry belongs to the effective decision-making unit (DMU) and does not need to be adjusted in terms of input and output; when ρ 1 , it means that the DMU belongs to the eco-efficiency ineffective DMU, which can be adjusted according to the gap between each DMU and the optimal DMU calculated by the formula to improve the eco-efficiency of China’s tea industry. The gap generally manifests in the input redundancy, the expected output deficiency, and the unexpected output redundancy. The input redundancy ratio I E X = 1 m i = 1 m S i X X i k represents the reducible proportion of input factors, such as land and labor; the insufficient expected output I E y = 1 S 1 + S 2 r = 1 S 1 S r y y r k indicates the expandable proportion of tea output value in the tea garden; the unexpected output redundancy ratio I E Z = 1 S 1 + S 2 ι = 1 S 2 S ι Z Z ι k indicates the reducible proportion of total nitrogen and total phosphorus loss in tea gardens.

2.2.2. Dagum Gini Coefficient and its Decomposition Approach

According to the study of Lin Chuntao et al. [43], in this paper, the Dagum Gini coefficient and its decomposition approach are employed in the research method to calculate the spatial disequilibrium characteristics of eco-efficiency in China’s tea industry. The method was first proposed by Dagum in 1997 [44]. Compared to the traditional Gini coefficient and the Thiel index, which cannot be decomposed with the defect of having too strong prerequisite assumptions in the process of gap decomposition, the Dagum Gini coefficient can not only study the distribution of the subsample but also decompose the respective contributions of intra-regional differences and inter-regional differences. Its calculation formula is as follows:
G = j = 1 k h = 1 k i = 1 n j r = 1 n h y j i y h r / 2 n 2 y ¯
In Formula (4), G is the total Gini ratio, and the larger the numerical value of G , the greater the total difference; k is the number of regional divisions(In this document, there are four regions), n is the number of provinces (the number of provinces in this study is 16), n j n h is the number of provinces in the j -th ( h -th) region, y j i y h r is the eco-efficiency value of the tea industry in any province in the j -th ( h -th) region, and y ¯ is the mean value of the eco-efficiency of the tea industry in all provinces.
Before the decomposition of the Gini coefficient, the mean value of eco-efficiency in the tea industry in each region needs to be ranked, as shown in Formula (5). According to the Dagum Gini coefficient decomposition method, the Gini coefficient can be decomposed into the contribution of inter-regional difference G n b , the contribution of intra-regional difference G w , and the contribution of hypervariable density G t . As shown in (6), the measurement result G reflects the magnitude of the relative differences in the eco-efficiency of the tea industry and its sources. Formulas (7) and (8) indicate the Gini coefficient G j j of the j -th region and the contribution of intra-regional difference G w , respectively. Formulas (9) and (10) represent, respectively, the inter-regional Gini coefficient G j h of the j -th and h -th regions and the contribution of inter-regional difference G n b , and the contribution of hypervariable density G t is shown in Formula (11). In the formula, P j = n j / n , S j = n j · y ¯ j / n · y ¯ ; meanwhile, P j = S j = 1 and j = 1 k h = 1 k P j S h = 1 . D j h denotes the relative impact of the eco-efficiency of the tea industry between the j -th and h -th regions, as shown in Formula (12). d j h stands for the difference between the eco-efficiency of the tea industry between regions, i.e., the mathematical expectation of the sum of all sample values of y j i > y h r in j , h regions, as shown in Formula (13); P j h is the first-order distance of the hypervariable density, which represents the mathematical expectation of the sum of all sample values of y j i < y h r in j , h regions, as shown in Formula (14). F j , F h represent the cumulative distribution function of j , h regions.
y ¯ 1 y ¯ 2 y ¯ j y ¯ k
G = G n b + G w + G t
G j j = i = 1 n j r = 1 n j y j i y j r / 2 y ¯ j n j 2
G w = j = 1 k G j j · P j · S j
G j h = i = 1 n j r = 1 n h y i j y h r n j · n h · y ¯ j + y ¯ h
G n b = j = 2 k h = 1 j 1 G j h P j S h + P h S j D j h
G t = j = 2 k h = 1 j 1 G j h P j S h P h S j 1 D j h
D j h = d j h P j h / d j h + P j h
d j h = 0 d F j y 0 y y X d F h X
P j h = 0 d F h y 0 y y X d F j X

2.2.3. Kernel Density Estimation Method

The kernel density estimation method uses continuous density curves to represent the distribution figure of random variables. This method is a crucial benchmark for research on spatial disequilibrium as it reflects variables’ distribution location, pattern, and extension characteristics. The fundamental principle is as follows:
Assuming that the random variables X 1 , X 2 , ..., and X N are independent and identically distributed, and their density functions f X are unknown, a kernel estimate of the density function can be obtained from the empirical distribution function. The empirical distribution function is as in Formula (15):
F n y = 1 N i = 1 N I X i y
I · is the indicator function, N is the number of observations (the number of N in this study is for the 16 tea-producing provinces between 2008 and 2019), and · is the conditional relationship. When · is true, I · = 1 ; when · is false, I · = 0 . The kernel density is estimated as shown in Formula (16):
f x = F n χ + h F n χ h / 2 h = 1 2 h · 1 N · i = 1 N Ι χ h Χ i χ + h = 1 h · 1 N · i = 1 N 1 2 Ι 1 χ Χ i h 1 = 1 N h · i = 1 N Κ Χ i χ h
f x is the density function of the eco-efficiency of the tea industry, N is the number of sample observations (the number of N in this study is for the 16 tea-producing provinces between 2008 and 2019), X i is the eco-efficiency level of each tea-producing province, and x is the average value. K · is the kernel function, which is a weighting function or smooth function and satisfies K 0 , K x = K x , + K x = d x = 1 , sup K x < + , + K 2 x d x < + . The kernel function mainly includes triangular kernel, quadratic kernel, Epanechnikov kernel, and the Gaussian kernel. In this paper, the more commonly used Gaussian kernel function is chosen to estimate the dynamic evolution of the distribution of eco-efficiency in the tea industry, and the expression of the Gaussian kernel function is K x = 1 2 π exp x 2 2 . Concerning Silverman’s study, the bandwidth is set to h = 1.06 σ n 1 / 5 , where σ is the sample standard deviation, and n is the number of observations [45].

3. Results and Analysis

3.1. Eco-Efficiency of China’s Tea Industry

In Figure 1, the overall eco-efficiency of the tea industry in each tea-producing province in China showed an increasing trend from 2008 to 2019. Among them, Guizhou and Shaanxi experienced the most significant increase, followed by Yunnan, Chongqing, Guangxi, Sichuan, and other central and western provinces, while traditional tea-producing provinces, such as Fujian and Zhejiang, saw a minor increase; Jiangsu, Shandong, Hunan, and Jiangxi had a slight decrease. The eco-efficiency of tea-producing provinces in the Jiangnan tea region except Jiangxi province and Hunan province has been improved over 11 years. The overall eco-efficiency of the tea region in Jiangbei is improved, except for a slight decrease in Shandong province. The eco-efficiency of the four tea regions in the South China tea region and the Southwest tea region has been improved, especially the eco-efficiency of the tea-producing provinces in the southwest region, which greatly improved from 2008 to 2019.
However, from the perspective of eco-efficiency value, none of the four major tea regions in 2019 had low eco-efficiency, nor was there a large gap between one province and another, indicating that China’s 16 tea-producing provinces paid more attention to the importance of ecological environmental protection in 2008–2019 and practiced the fertilizer reduction policy to reduce the undesired output of the tea industry and achieve a general increase in eco-efficiency [46].

3.2. The Disequilibrium of Eco-Efficiency of the Tea Industry and Its Decomposition

3.2.1. Overall Differences

The Gini coefficient of eco-efficiency of China’s tea industry from 2008 to 2019 was primarily spread between 0.09 and 0.18. It shows that the inter-regional eco-efficiency difference of major tea-producing areas is relatively small, and the spatial disequilibrium is less pronounced (Table 1). The Gini coefficient of eco-efficiency of China’s tea industry from 2008 to 2019 mainly displayed a wavelike decrease in terms of temporal development. The minimum coefficient value is 0.09. A smaller number means less regional difference and less spatial imbalance. It also shows that China attaches great importance to the ecological development of the tea industry to achieve an overall increase in eco-efficiency.
In Table 1, the evolution of the Gini coefficient in China and the four major tea regions from 2008 to 2019 mainly showed a W-shaped decreasing trend. The average annual decreasing rates of the tea regions in Southwest, Jiangnan, South China, and Jiangbei are 0.90%, 0.78%, 0.88%, and 0.06%, respectively, indicating that the intra-regional differences in the eco-efficiency of the tea industry in the four major tea regions are gradually reducing. Among them, the Gini coefficients of Jiangbei and Jiangnan tea regions are similar in evolution trend, especially between 2014 and 2019, when the two major tea regions showed almost the same direction of change. The South China tea region showed a significant fluctuation trend after 2014, while the trend of the Gini coefficient in the southwest tea region is decreasing overall, fluctuating between 2014 and 2019.
Overall, the intra-regional difference in eco-efficiency of the tea industry in South China’s tea regions is the largest, with an average annual Gini coefficient of 0.0463, higher than other tea regions. However, in 2019, the Gini coefficient dropped steeply to 0.05, indicating a significant reduction in the level of eco-efficiency in the tea industry within the region; the intra-regional difference in the southwest tea region was relatively large before 2012, with the Gini coefficient ranking second and remaining at a lower level for a long time after 2012. Both Jiangnan and Jiangbei tea regions exhibit an up-and-down trend. Before 2014, the mean value between the two was insignificant, and the change curves intersected. After 2014, the change curves of the two regions nearly overlapped, and the Gini coefficient was not high. The possible reason for this is that there is little difference between the two tea regions in the tea production environment and technical level. Hence, the difference in the eco-efficiency of the tea industry is slight and stable.

3.2.2. Intra-Regional Differences

Table 2 demonstrates a general downward trend in the Gini coefficient among the major tea regions. In the evolution trend of the Gini coefficient between regions between 2008 and 2019, the differences between tea regions in Jiangnan and southwest, and Jiangbei and southwest, showed a W-shaped downward trend, with Jiangbei and Jiangnan tea regions showing the same trend with a larger difference in magnitude; with the same W-shaped downward tendency, the changing trends in China’s four major tea regions—South China, Jiangnan, the southwest, and Jiangbei—are more similar to one another. It suggests that the disequilibrium of the tea industry’s eco-efficiency is gradually reducing. Additionally, the inter-regional differences between the South China tea region and other tea regions have maintained a high level for a long time. In 2017, it took a steep rise to reach the maximum difference, after which it shrunk again. It is probably because the South China tea region mainly produces black tea and oolong, while other tea regions are primarily green tea and dark tea, which makes the pollutant output of the South China tea region lower than other kinds during the process of tea garden management; furthermore, Fujian Province in the South China tea region has better tea production technology and owns superior eco-efficiency than other tea-producing provinces. Altogether, the difference between the South China tea region and other tea regions still shows a fluctuating downward trend. The changing trend is consistent with the diffusion law that technological popularization and application flow from high-level to low-level areas. In addition, the differences in the tea industry’s eco-efficiency levels between tea regions fluctuate the most between Jiangbei and southwest, Jiangbei and Jiangnan tea regions, with South China and southwest tea regions experiencing the slightest fluctuation; South China and Jiangnan, Jiangnan and southwest, and Jiangbei and South China tea regions experience the most fluctuation in the middle. Regarding the mean average percentage difference, the tea regions in Jiangnan and southwest, Jiangbei and Jiangnan, Jiangbei and southwest, South China and Jiangnan, South China and southwest, and Jiangbei and South China are ranked in descending order from small to large. The average annual difference rate variances are all negative, with decline rates of −0.52%, −1.02%, −1.13%, −0.79%, −0.09%, and −0.90%, respectively.

3.2.3. Sources of Regional Differences and Their Contribution

According to Table 3, the contribution of inter-regional differences, which is substantially higher than the contribution of intra-regional differences and hypervariable density differences, accounts for most regional differences in the eco-efficiency of China’s tea industry. With an average annual contribution growth rate of 1.78% and a maximum contribution rate of 82.67%, the changing trend also showed a W-shaped upward tendency from 44.53% in 2008 to 64.12% in 2019. The contribution rates of intra-regional differences and hypervariable density are relatively similar. However, the contribution rate of intra-regional differences shows a gentle downward trend, while the contribution rate of hypervariable density shows a fluctuating downward trend, with a minimum of 3.03%. As a result, the overall difference in the eco-efficiency of China’s tea industry mainly comes from the uneven development of eco-efficiency among different tea regions. The secondary reason is the differences within tea regions and the hypervariable density differences, with a slight difference in contribution rates between the two.
Based on the above, even though Fujian, Jiangsu, Guangdong, and other large tea provinces have higher eco-efficiency levels, theoretically, there will be a significant gap between the South China and Jiangnan tea regions and other tea regions with low eco-efficiency levels of the tea industry; however, there are also provinces with lower tea industry eco-efficiency levels within the South China and Jiangnan tea regions, such as Guangxi, Jiangxi, Hubei, etc., which weakens the imbalanced eco-efficiency of the tea industry in the tea regions to some extent.

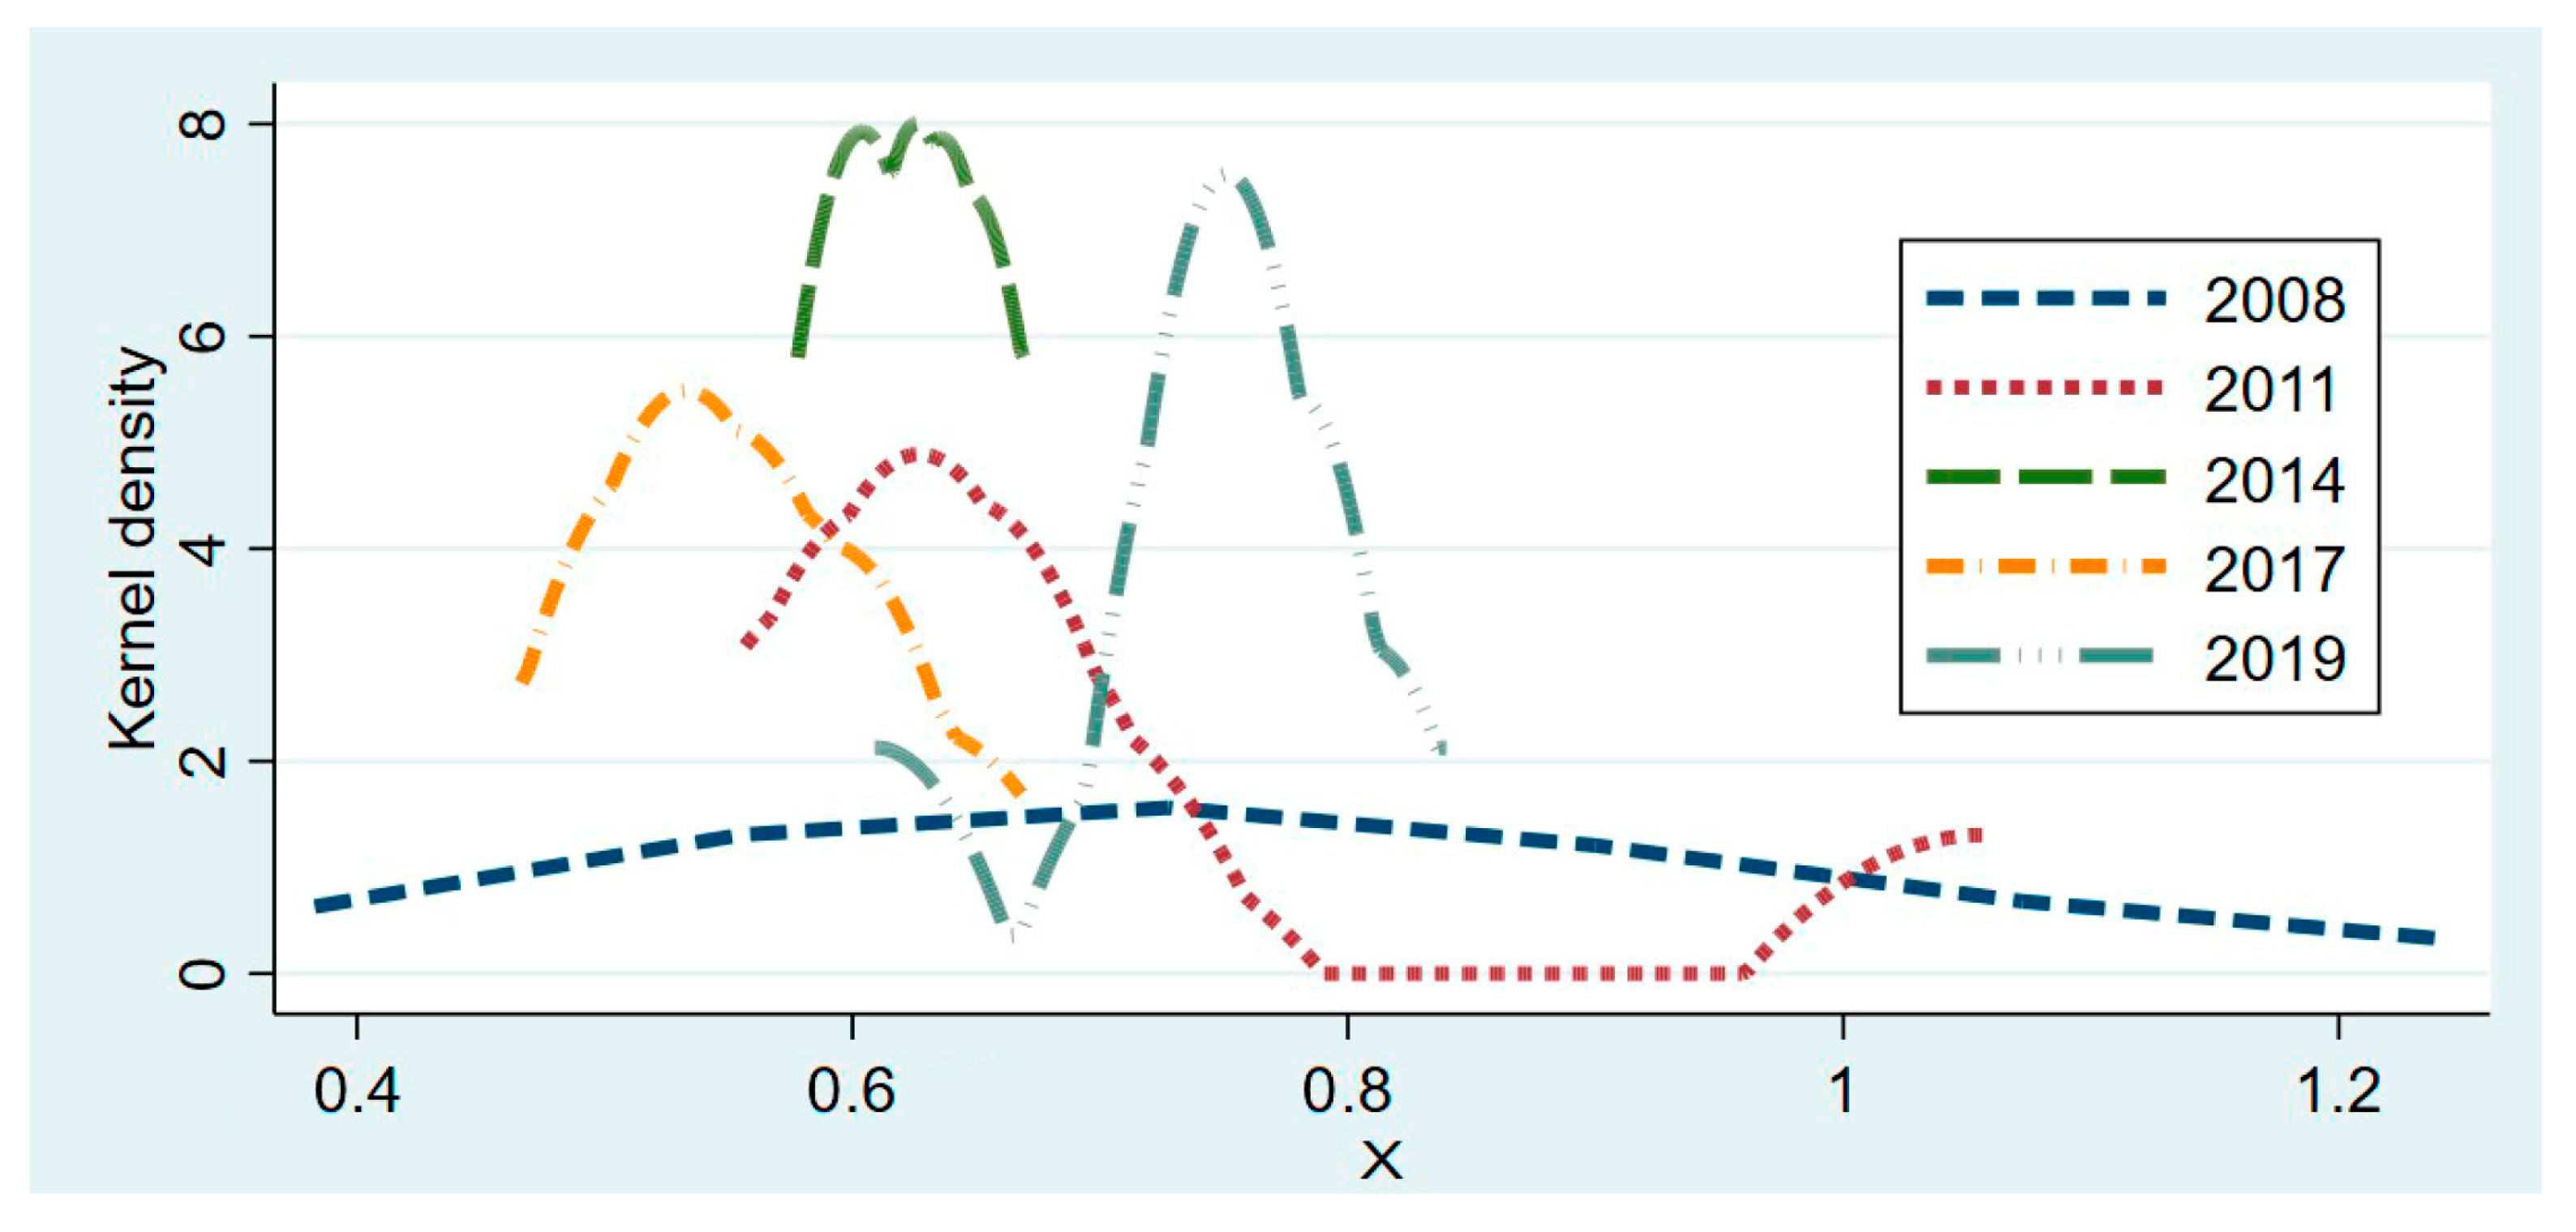
3.3. Distribution Dynamics of Eco-Efficiency in the Tea Industry

3.3.1. Kernel Density Estimation of Eco-Efficiency in China’s Tea Industry

Figure 2 analyzes the dynamic evolution of the eco-efficiency of the tea industry in various tea regions from the level of China’s major tea-producing provinces, using the years 2008, 2011, 2014, 2017, and 2019 as the examination points for studying the distribution dynamics of the eco-efficiency of the tea industry. Figure 2 also demonstrates that the eco-efficiency of China’s tea industry was generally higher in 2019 and that, in comparison to previous years, regional differences were significantly smaller, indicating that the level of eco-efficiency in the tea industry in each province was improved, and tea production technology was developed in a more balanced manner.
From 2008 to 2019, China’s tea industry improved its overall eco-efficiency. However, there is also a situation that the eco-efficiency peak in 2019 is lower than the other four examination points. In general, the evolution trend of eco-efficiency kernel density of China’s tea industry exhibits a rightward movement, and the regional difference gradually decreases; in terms of the distribution characteristics, it is mainly a single-peak distribution, and the width undergoes a “wide-narrow-wide” process. It is the agglomeration development from a low eco-efficiency level to high eco-efficiency level in terms of convergence. The above characteristics indicate that the eco-efficiency level of China’s tea industry is gradually improving, the regional differences are slowly narrowing, and the disequilibrium of spatial distribution is alleviated.

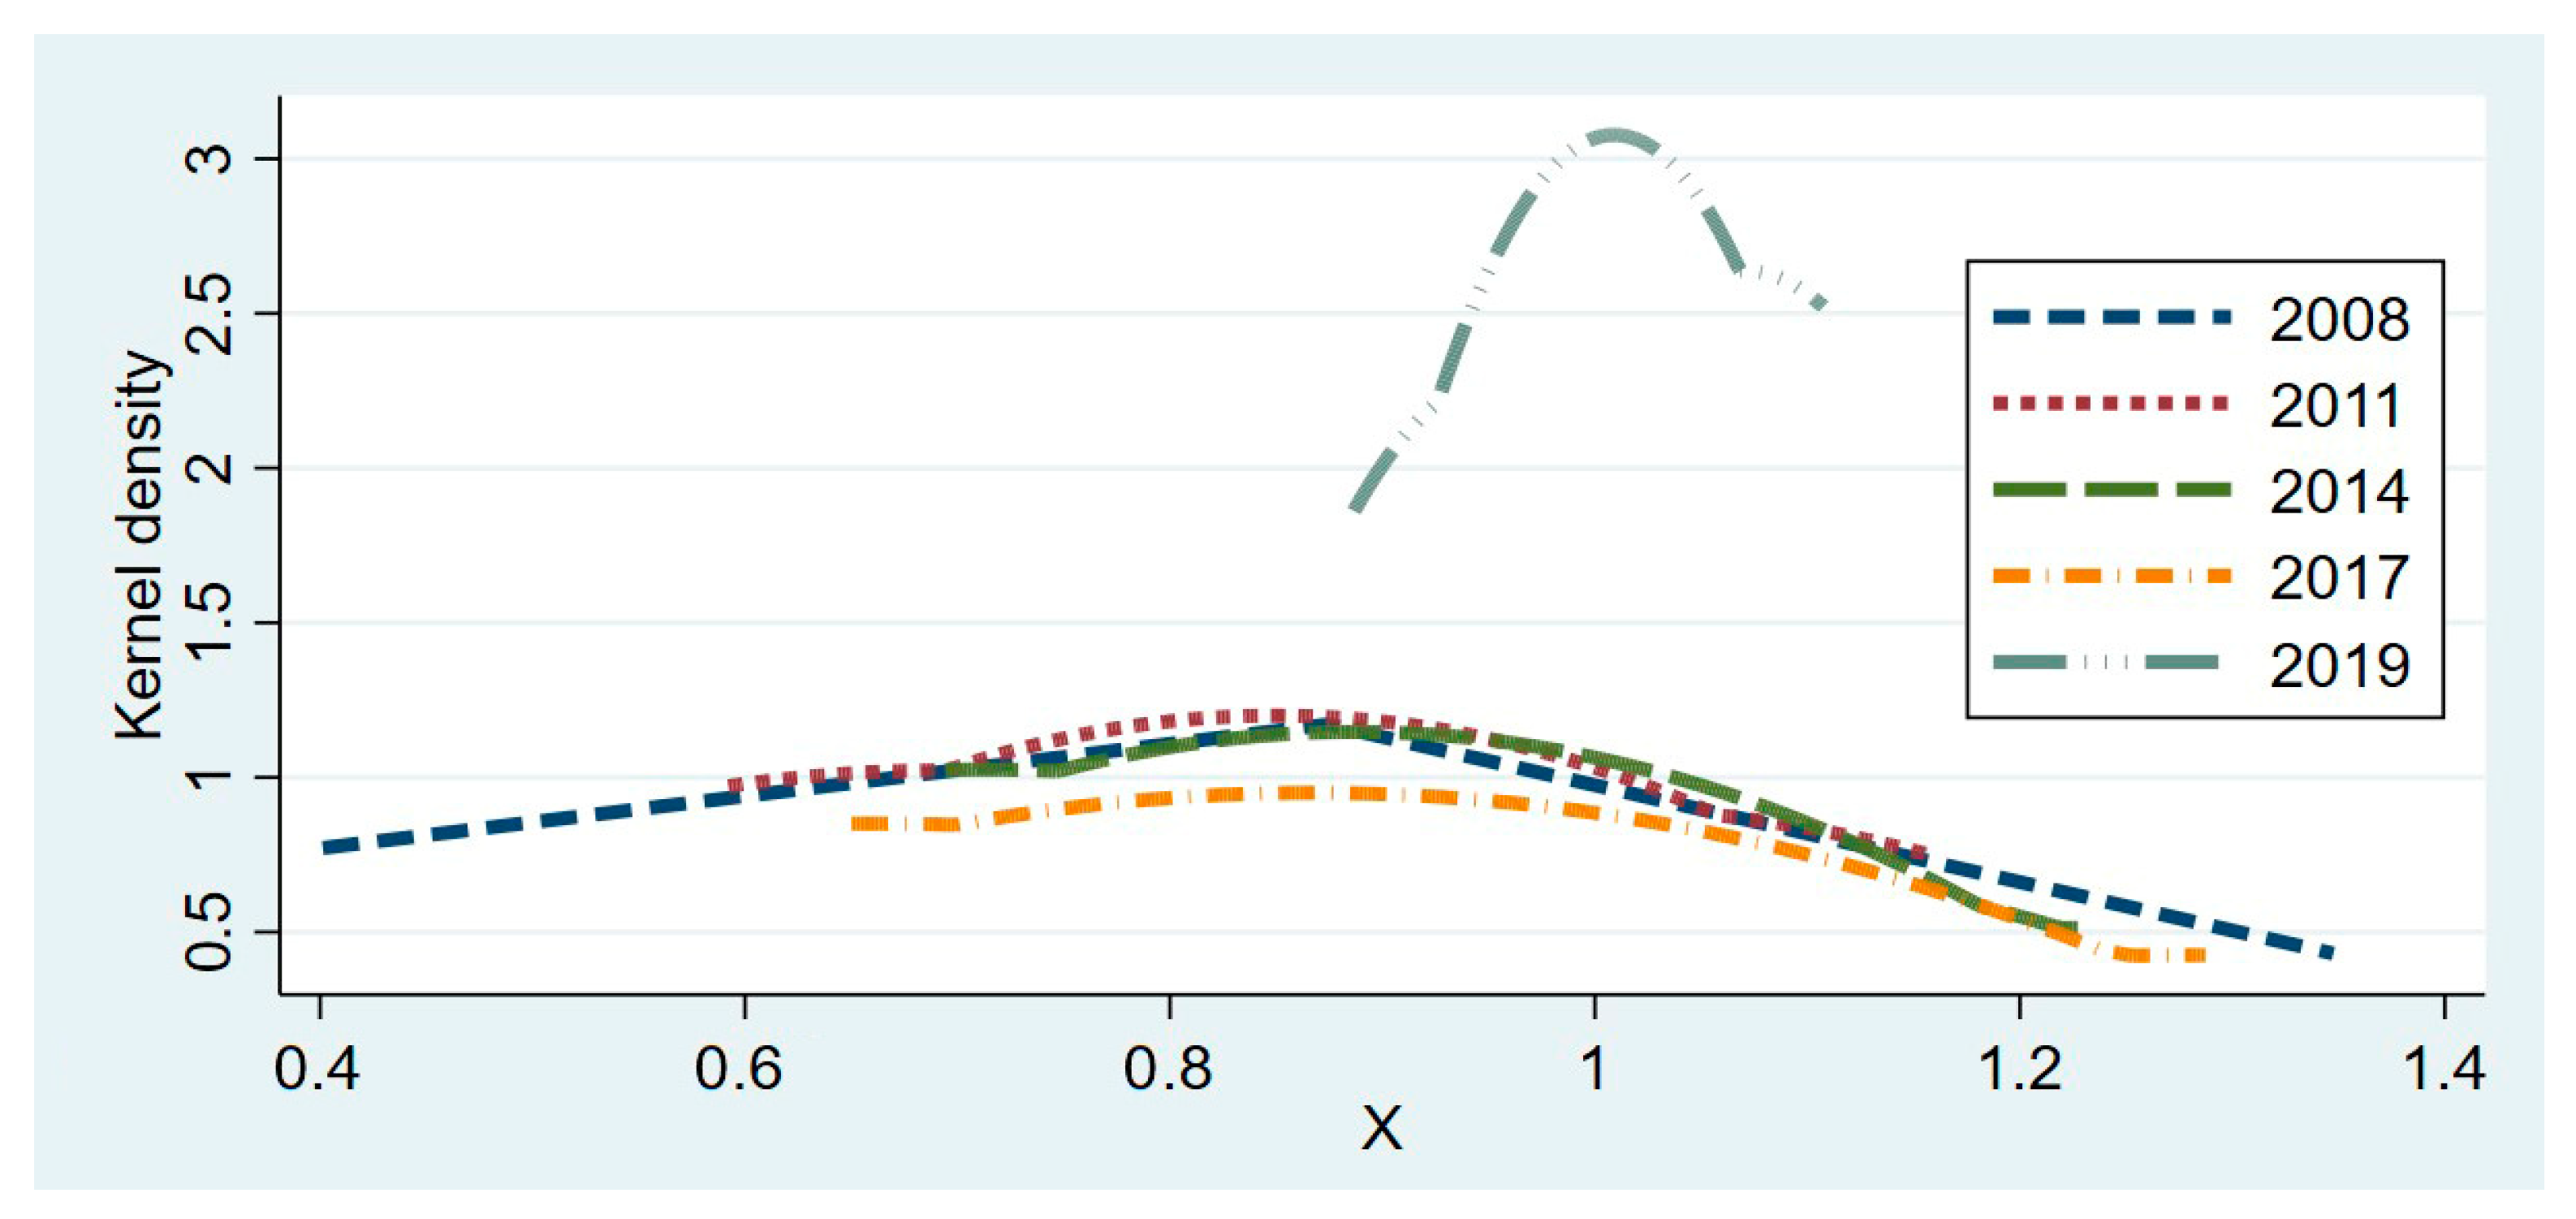
3.3.2. Kernel Density Estimation of Eco-Efficiency of the Tea Industry at the Regional Level

As shown in Figure 3 and Figure 4, the evolution law of South China and Jiangnan tea regions are relatively comparable. The kernel density evolutionary curves of the eco-efficiency of the tea industry in South China and Jiangnan tea regions have similarities between 2008 and 2017, both of which are shifted to the right and evolved from a flat distribution trend with severe intra-regional polarization to a distribution characteristic of convergence, reduced intra-regional differences, and significant unimodal or bimodal peaking. However, in 2019, the evolutionary characteristics of the kernel density curves in the South China and Jiangnan tea regions showed significant differences, with the South China tea region evolving from a unimodal distribution, with overall convergence at a lower level to a gentle distribution at a higher eco-efficiency level, and the overall technical efficiency level was greatly enhanced despite the widening of the intra-regional difference; the Jiangnan tea region, on the other hand, maintains the characteristic of convergent unimodal distribution, and although the intra-regional difference is relatively small, the overall eco-efficiency level only ranks low and medium among the eco-efficiency levels of China’s tea industry. It reveals that Fujian Province, as a province with advanced tea production technology in China, has driven the tea region in South China to widen the gap in eco-efficiency of the tea industry compared to other tea regions.
In Figure 5, the change in kernel density in the Jiangbei tea region is not as intense as in other tea regions. The eco-efficiency of the tea industry in the Jiangbei tea region varied significantly between 2008 and 2017, as shown by the kernel density curve, which showed a relatively insignificant single peak, a flat distribution, and severe polarization. Although the intra-regional disequilibrium has been alleviated since 2008, it has remained high. In 2019, the kernel density curve evolved into an apparent single-peaked distribution. It clustered at a higher tea industry eco-efficiency level, suggesting that although the maximum eco-efficiency level of the tea industry in the Jiangbei tea region has decreased, the intra-regional disequilibrium has been significantly improved, and the overall level of eco-efficiency of the tea industry has been promoted.
As shown in Figure 6, the kernel density curve of the eco-efficiency of the tea industry in the southwest tea region tends to move to the right in general. The repeated enlarging and narrowing of intra-regional difference indicate significant fluctuations in the eco-efficiency level of the tea industry in various provinces within the tea region. Before 2014, the intra-regional difference in the level of eco-efficiency of the tea industry in the southwest tea region narrowed significantly and converged at the medium eco-efficiency level; in 2017, a retreating trend emerged. In 2019, the overall eco-efficiency level of the tea industry was substantially improved, but this led to a significant expansion of the differences in the eco-efficiency of the tea industry within the tea region.

4. Conclusions and Policy Implications

In general, the spatial disequilibrium of the eco-efficiency in China’s tea industry from 2008 to 2019 has been greatly alleviated. The inter-regional differences among the tea-producing provinces have gradually weakened. The dynamic distribution of eco-efficiency has steadily improved, and the input–output structure of tea production has been significantly optimized. Based on the distribution characteristics and temporal and spatial evolution trends of China’s tea industry, the following three conclusions can be drawn:
First, the eco-efficiency of the tea industry is on the rise as a whole, but there are still problems of unbalanced and insufficient development in some regions. The public’s awareness of ecological and environmental protection needs to be further improved to achieve the sustainable development of the tea industry.
Second, according to the Dagum Gini coefficient and its decomposition results, the main source of spatial imbalance in the eco-efficiency of China’s tea industry is regional differences. The results suggest that barriers to technology diffusion between regions may be the main reasons for the widening regional development gaps, which are not conducive to the coordinated development of industries. The same is true of socio-economic development, and only by strengthening the flow of technology between regions can we promote sustainable development.
Changes in eco-efficiency are a long, iterative process. Technological advances increase output and improve eco-efficiency. However, over time, a large increase in input can make eco-efficiency worse, which is a cyclical process. Overall, the process is upward. This also reminds us that technology can temporarily improve eco-efficiency and reduce environmental pollution, but to achieve sustainable development, it is ultimately necessary to raise people’s awareness of ecological protection.
Based on the above, two suggestions are proposed:
First, optimize the production structure and reduce negative output. In June 2022, the Secretary-General of the United Nations, Guterres, appealed to all humanity to shift towards a circular and regenerative economic model at the “Stockholm + 50” International Environment Conference, commemorating the 50th anniversary of the Stockholm Conference. Agriculture and other industries should focus more on eco-efficiency than production efficiency or technological efficiency in their future development. Much of the reason for eco-inefficiency comes from undesired output. Therefore, according to the actual production demand and resource and environmental conditions, optimize the production structure, do not blindly pursue economic benefits, and pay attention to the protection of the environment in the production process in order to reduce the negative output of the industry and achieve sustainable development.
Secondly, strengthen technological intercommunication and promote common development. From the perspective of development economics, regional disparities are an important factor hindering overall balanced development. Therefore, only by promoting the flow of information between regions and strengthening technical exchanges can we achieve balanced development of the region as a whole. For advanced regions, technology circulation is conducive to maintaining the momentum of regional scientific and technological progress and maintaining advanced advantages. For less-developed regions, technology circulation is conducive to narrowing the development gap and promoting social development. On the whole, strengthening technology connectivity is an important way to promote sustainable economic and social development.
All in all, the temporal and spatial evolution characteristics of the eco-efficiency of China’s tea industry not only reveal the development status of China’s tea industry but also describe the development law of the eco-efficiency of the tea industry. This development law applies not only to the tea industry worldwide but to agriculture and all industries. At the same time, the development law also tells us that optimizing the production structure and strengthening regional technology circulation are an important means to narrow the imbalance of development and achieve sustainable development.

Author Contributions

Conceptualization, W.J. and B.S.; methodology, B.S. and S.F.; software, W.J.; validation, W.J., B.S. and S.F.; formal analysis, W.J.; investigation, W.J. and B.S.; resources, S.F. and B.S.; data curation, W.J., B.S. and S.F.; writing—original draft preparation, W.J., B.S. and S.F.; writing—review and editing, W.J.; visualization, B.S. and S.F.; supervision, W.J.; project administration, B.S. and S.F.; funding acquisition, B.S. All authors have read and agreed to the published version of the manuscript.

Funding

This research received no external funding. The APC was funded by Baocai Su.

Informed Consent Statement

Not applicable.

Conflicts of Interest

The authors declare no conflict of interest.

References

  1. Chen, Y.; Li, M.; Abu Hatab, A. A spatiotemporal analysis of comparative advantage in tea production in China. Agric. Econ. 2020, 66, 550–561. [Google Scholar] [CrossRef]
  2. Huppes, G.; Ishikawa, M. A Framework for Quantified Eco-efficiency Analysis. J. Ind. Ecol. 2005, 9, 25–41. [Google Scholar] [CrossRef]
  3. Schaltegger, S.; Rationalität, A.Ö. Ansatzpunkte zur Ausgestaltung von ökologieorientierten Managementinstrumenten. Die Unternehm. Swiss J. Bus. Res. Pract. 1990, 44. Available online: https://www.jstor.org/stable/24180467 (accessed on 13 June 2023).
  4. Guenster, N.; Bauer, R.; Derwall, J.; Koedijk, K. The Economic Value of Corporate Eco-Efficiency. Eur. Financ. Manag. 2011, 17, 679–704. [Google Scholar] [CrossRef] [Green Version]
  5. Sinkin, C.; Wright, C.J.; Burnett, R.D. Eco-efficiency and firm value. J. Account. Public. Policy 2008, 27, 167–176. [Google Scholar] [CrossRef]
  6. Chen, X.; Lin, B. Assessment of eco-efficiency change considering energy and environment: A study of China’s non-ferrous metals industry. J. Clean. Prod. 2020, 277, 123388. [Google Scholar] [CrossRef]
  7. Park, J.; Cha, K.; Hur, T. Tackling Challenges in Measuring and Communicating Eco-efficiency—A study of the Korean electronics industry. In Proceedings of the 2006 IEEE International Symposium on Electronics and the Environment (ISEE 2006), San Francisco, CA, USA, 19–22 May 2006. [Google Scholar] [CrossRef]
  8. Caiado, R.G.G.; De Freitas Dias, R.; Mattos, L.V.; Quelhas, O.L.G.; Filho, W.L. Towards sustainable development through the perspective of eco-efficiency—A systematic literature review. J. Clean. Prod. 2017, 165, 890–904. [Google Scholar] [CrossRef] [Green Version]
  9. Keating, B.A.; Carberry, P.S.; Bindraban, P.S.; Asseng, S.; Meinke, H.; Dixon, J. Eco-efficient Agriculture: Concepts, Challenges, and Opportunities. Crop. Sci. 2010, 50, S-109–S-119. [Google Scholar] [CrossRef]
  10. Rybaczewska-Błażejowska, M.; Gierulski, W. Eco-Efficiency Evaluation of Agricultural Production in the EU-28. Sustainability 2018, 10, 4544. [Google Scholar] [CrossRef] [Green Version]
  11. Xia, B.; Dong, S.; Li, Y.; Li, Z.; Sun, D.; Zhang, W.; Li, W. Evolution Characters and Influencing Factors of Regional Eco-Efficiency in a Developing Country: Evidence from Mongolia. Int. J. Environ. Res. Public. Health 2021, 18, 10719. [Google Scholar] [CrossRef]
  12. Pang, J.; Chen, X.; Zhang, Z.; Li, H. Measuring Eco-Efficiency of Agriculture in China. Sustainability 2016, 8, 398. [Google Scholar] [CrossRef] [Green Version]
  13. Müller, K.; Holmes, A.; Deurer, M.; Clothier, B.E. Eco-efficiency as a sustainability measure for kiwifruit production in New Zealand. J. Clean. Prod. 2015, 106, 333–342. [Google Scholar] [CrossRef]
  14. Masuda, K. Measuring eco-efficiency of wheat production in Japan: A combined application of life cycle assessment and data envelopment analysis. J. Clean. Prod. 2016, 126, 373–381. [Google Scholar] [CrossRef]
  15. Ounsaneha, W.; Suksaroj, T.T.; Chamondusit, K. Selection of the Sustainable Area for Rubber Plantation of Thailand by Eco-efficiency. Procedia Soc. Behav. Sci. 2012, 40, 58–64. [Google Scholar] [CrossRef] [Green Version]
  16. Gołaś, M.; Sulewski, P.; Wąs, A.; Kłoczko-Gajewska, A.; Pogodzińska, K. On the Way to Sustainable Agriculture—Eco-Efficiency of Polish Commercial Farms. Agriculture 2020, 10, 438. [Google Scholar] [CrossRef]
  17. Vilkė, R.; Gedminaitė-Raudonė, Ž.; Baležentis, T.; Štreimikienė, D. Farmers’ awareness of eco-efficiency and cleaner production as environmental responsibility: Lithuanian case. Corp. Soc. Responsib. Environ. Manag. 2020, 28, 288–298. [Google Scholar] [CrossRef]
  18. Koskela, M.; Vehmas, J. Defining Eco-efficiency: A Case Study on the Finnish Forest Industry. Bus. Strat. Environ. 2012, 21, 546–566. [Google Scholar] [CrossRef]
  19. Korhonen, J. Reconsidering the Economics Logic of Ecological Modernization. Environ. Plan. A Econ. Space 2008, 40, 1331–1346. [Google Scholar] [CrossRef]
  20. Park, S.E.; Howden, S.; Crimp, S.J.; Gaydon, D.; Attwood, S.J.; Kokic, P.N. More than Eco-efficiency is Required to Improve Food Security. Crop. Sci. 2010, 50, S-132–S-141. [Google Scholar] [CrossRef]
  21. Chen, F.; Qiao, G.; Wang, N.; Zhang, D. Study on the Influence of Population Urbanization on Agricultural Eco-Efficiency and on Agricultural Eco-Efficiency Remeasuring in China. Sustainability 2022, 14, 12996. [Google Scholar] [CrossRef]
  22. Liu, Q.; Wang, S.; Li, B.; Zhang, W. Dynamics, differences, influencing factors of eco-efficiency in China: A spatiotemporal perspective analysis. J. Environ. Manag. 2020, 264, 110442. [Google Scholar] [CrossRef]
  23. Moutinho, V.; Robaina, M.; Macedo, P. Economic-environmental efficiency of European agriculture—A generalized maximum entropy approach. Agric. Econ. 2018, 65, 423–435. [Google Scholar] [CrossRef] [Green Version]
  24. Du, M.; Antunes, J.; Wanke, P.; Chen, Z. Ecological efficiency assessment under the construction of low-carbon city: A perspective of green technology innovation. J. Environ. Plan. Manag. 2022, 65, 1727–1752. [Google Scholar] [CrossRef]
  25. Soheili-Fard, F.; Kouchaki-Penchah, H.; Raini, M.G.N.; Chen, G. Cradle to grave environmental-economic analysis of tea life cycle in Iran. J. Clean. Prod. 2018, 196, 953–960. [Google Scholar] [CrossRef]
  26. Yu, Y.-S. Study on the Tea Board of India, Sri Lanka, Kenya—Organization and Functions. J. Korean Tea Soc. 2015, 21, 13–24. [Google Scholar]
  27. Li, J. Northwest China’s Tea Industry Development Strategy Based on SWOT Analysis—As an Example of Shaanxi Province. 2017. Available online: https://www.webofscience.com/wos/alldb/full-record/WOS:000427389500058 (accessed on 14 June 2023).
  28. Liang, Y.R. The Development Trend of Tea Industry in China. J. Korean Tea Soc. 2015, 21, 38–41. [Google Scholar]
  29. A Study on Measures for Enhancing the International Competitiveness of Chinese Tea Industry. Korean Logist. Res. Assoc. 2016, 26, 89–98. [CrossRef]
  30. Rajadurai, R.; Abeysinghe, D.; Yoo, Y. Current Status and Major Challenges of the Tea Industry in Sri Lanka. Korean Tea Soc. 2019, 25, 25–32. [Google Scholar] [CrossRef]
  31. Ui Haq, S.; Boz, I.; Shahbaz, P.; Yıldırım, C. Evaluating eco-efficiency and optimal levels of fertilizer use based on the social cost and social benefits in tea production. Environ. Sci. Pollut. Res. 2020, 27, 33008–33019. [Google Scholar] [CrossRef]
  32. Baten, A.A.; Kamil, M.A.; Haque, M.A. Productive efficiency of tea industry A stochastic frontier approach. Afr. J. Biotechnol. 2010, 9, 3808–3816. Available online: https://www.webofscience.com/wos/alldb/full-record/WOS:000279947600018000279947600018 (accessed on 14 June 2023).
  33. Ngeno, V. Technical efficiency and technology gap in Kenya’s tea industry: Accounting for farm heterogeneity. J. Dev. Eff. 2023, 5, 22. [Google Scholar] [CrossRef]
  34. Liu, Z.; Zhang, C. Evaluation of Eco-efficiency and Production Efficiency of China’s Tea Industry: An Empirical Analysis Based on DEA Method. Ecol. Sci. 2017, 36, 111–117. (In Chinese) [Google Scholar] [CrossRef]
  35. Xiao, Z.; Huang, X.; Meng, H.; Zhao, Y. Spatial evolution pattern and change characteristics of tea production in China from 2009 to 2014. Geogr. Res. 2017, 36, 109–120. Available online: http://fx.fulink.superlib.net/detail_38502727e7500f267da2248e115852e8b3e77893de449b781921b0a3ea255101fc1cf1fbb4666ae6692d031b4fcf933e48b74d297fc0e9593b447c8e372f49ac10eab6bcd294ebede0ac89ce80c4bd84 (accessed on 14 June 2023). (In Chinese).
  36. Ministry of Ecology and Environment. Manual of Accounting Methods and Coefficients for Statistical SURVEY of Emission Sources; Ministry of Ecology and Environment: Beijing, China, 2021; Volume 6, p. 9. Available online: https://www.mee.gov.cn/xxgk2018/xxgk/xxgk01/202106/W020210624327149500026.pdf (accessed on 14 June 2023). (In Chinese)
  37. Sun, C.; Zhou, H.Z.; Chen, L.; Shen, Z.Y. The pollution risk assessment of nitrogen and phosphorus loss in surface runoff from farmland fertilizer. J. Agro-Environ. Sci. 2017, 36, 1266–1273. [Google Scholar] [CrossRef]
  38. Charnes, A.; Cooper, W.W.; Rhodes, E. Measuring the efficiency of decision making units. Eur. J. Oper. Res. 1978, 2, 429–444. [Google Scholar] [CrossRef]
  39. Banker, R.D.; Charnes, A.; Cooper, W.W. Some Models for Estimating Technical and Scale Inefficiencies in Data Envelopment Analysis. Manag. Sci. 1984, 30, 1078–1092. [Google Scholar] [CrossRef] [Green Version]
  40. Tone, K. A slacks-based measure of efficiency in data envelopment analysis. Eur. J. Oper. Res. 2001, 130, 498–509. [Google Scholar] [CrossRef] [Green Version]
  41. Tone, K.; Sahoo, B.K. Scale, indivisibilities and production function in data envelopment analysis. Int. J. Prod. Econ. 2003, 84, 165–192. [Google Scholar] [CrossRef] [Green Version]
  42. Cheng, G. Envelopment Analysis Method. with MaxDEA Software; Intellectual Property Press: Beijing, China, 2014; pp. 34–35. (In Chinese) [Google Scholar]
  43. Lin, C.; Li, Y.; Guan, X.; Zhang, Y.; Su, B. Spatial imbalance and dynamic evolution of tea regional public brand development. J. Tea Commun. 2021, 48, 333–340. (In Chinese) [Google Scholar]
  44. Dagum, C. A New Approach to the Decomposition of the Gini Income Inequality Ratio. In Income Inequality, Poverty, and Economic Welfare. Studies in Empirical Economics; Slottje, D.J., Raj, B., Eds.; Physica: Heidelberg, Germany, 1998. [Google Scholar] [CrossRef]
  45. Silverman, B.W. Density Estimation for Statistics and Data Analysis; CRC Press: Boca Raton, FL, USA, 1986; Volume 26. [Google Scholar]
  46. General Office of the Ministry of Agriculture. Zero Growth Action Plan for Fertilizer Use. 20 April 2015. Available online: http://www.zzys.moa.gov.cn/gzdt/201505/t20150525_6309954.htm (accessed on 14 June 2023). (In Chinese)
Figure 1. Eco-efficiency of the tea industry in 2008 and 2019.
Sustainability 15 09597 g001
Figure 2. Dynamic evolution of eco-efficiency kernel density in China’s tea industry.
Sustainability 15 09597 g002
Figure 3. Dynamic evolution of kernel density of eco-efficiency of the tea industry in the South China tea region.
Sustainability 15 09597 g003
Figure 4. Dynamic evolution of kernel density of eco-efficiency of tea industry in Jiangnan tea region.
Sustainability 15 09597 g004
Figure 5. Dynamic evolution of kernel density of eco-efficiency of the tea industry in Jiangbei tea region.
Sustainability 15 09597 g005
Figure 6. Dynamic evolution of kernel density of eco-efficiency of the tea industry in the southwest tea region.
Sustainability 15 09597 g006
Table 1. Gini coefficient of eco-efficiency of the tea industry in China’s four major tea regions.
Year16 Tea RegionRegion
Southwest Tea RegionJiangnan Tea RegionSouth China Tea RegionJiangbei Tea Region
20080.180.150.170.150.11
20090.150.140.040.160.09
20100.150.130.040.140.08
20110.130.110.050.150.07
20120.130.090.110.120.09
20130.110.030.120.130.05
20140.090.030.030.140.03
20150.110.050.100.020.11
20160.090.080.030.080.02
20170.130.060.050.160.07
20180.120.070.030.150.04
20190.100.050.080.050.10
Table 2. Inter-regional Gini coefficient of eco-efficiency of the tea industry.
YearInter-Regional Gini Coefficient
Jiangnan-SouthwestSouth China-SouthwestSouth China-JiangnanJiangbei-Southwest ChinaJiangbei-JiangnanJiangbei-South China
20080.160.160.170.210.220.24
20090.120.170.150.180.110.23
20100.130.150.140.200.110.22
20110.090.160.170.130.090.22
20120.100.160.150.120.160.24
20130.110.160.160.050.140.21
20140.040.170.140.040.060.20
20150.100.170.120.090.120.16
20160.100.100.120.100.030.12
20170.060.220.230.080.070.26
20180.060.220.190.060.050.23
20190.110.150.080.090.110.14
Table 3. Results of Gini coefficient decomposition.
YearContributionContribution Rate%
OverallIntra-RegionalInter-RegionalHypervariable DensityIntra-Regional Contribution RateInter-Regional Contribution RateHypervariable Density Contribution Rate
20080.180.040.080.0622.1944.5333.28
20090.150.030.090.0321.7359.2219.05
20100.150.030.090.0321.4859.2619.25
20110.130.030.080.0321.0159.9219.07
20120.130.030.080.0318.9660.3720.68
20130.110.020.080.0114.8774.9310.19
20140.090.010.080.0014.3082.673.03
20150.110.020.070.0215.4162.3022.29
20160.090.020.050.0220.6361.3618.01
20170.130.020.100.0116.3772.3611.27
20180.120.020.080.0116.6471.9911.37
20190.100.020.060.0217.3064.1218.58
Disclaimer/Publisher’s Note: The statements, opinions and data contained in all publications are solely those of the individual author(s) and contributor(s) and not of MDPI and/or the editor(s). MDPI and/or the editor(s) disclaim responsibility for any injury to people or property resulting from any ideas, methods, instructions or products referred to in the content.

