1. Introduction
After recognizing the challenges of implementation of Industry 4.0, the European Union presented the Industry 5.0 strategy to overcome the barriers and to place the European industry as the key driver in the economic and societal transitions [
1]. The digital and green transitions with the introduction of Industry 5.0 concept remain imperative, now with a human worker placed again in the center of the system to improve efficiency and productivity with a special contribution to general society [
2]. The implementation of digital technologies by Industry 4.0 standards implicated the removal of a physical worker from the production process, complete automatization of operations, and, therefore, a need for new skills and workplaces. This has created the most common barrier in Industry 4.0 implementation, which is the lack of human knowledge and skills to provide the transition and their capability to work in new positions of an Operator 4.0, included in control, optimization, and decision-making processes rather than manual work [
3]. This has also created dissatisfaction among the workers as well as fear of job loss and inability to adapt to new technologies. Industry 4.0 elements (such as big data, advanced analytics, Internet of Things, cloud computing, augmented reality, autonomous robots, horizontal and vertical system integration, cognitive computing, or digital twin [
4]) in the beginning were subject to availability and required a very high investment cost but, at the same time, they were needed to remain competitive on the market for production companies. The trend of high variability and fast customization of products required design of systems of high flexibility and modularity with unclear predictable benefits in the future [
5]. Industry 5.0 focuses on developing a human-centered, sustainable, and resilient production system, which could answer the market demands and unpredictable local and global events in society that might occur and affect the production in a negative manner [
6]. The sustainable system is encouraged to be achieved using green technologies by principles of circular economy, which also implies the use of the renewable energy resources in the production as well as a high degree of recycling and reuse of resources within the system [
7]. Digital and green principles can be implemented in the logistics system, which is why the framework of Logistics 4.0 implies the use of wireless sensor networks, Internet of Things, automated guided vehicles, drones, cloud computing, big data, robotics and automation, or augmented reality to optimize the standard logistics activities [
8]. Green logistics, on the other hand, can be described in terms of green office (reducing use of paper materials, increase in recycling of the waste, excess usage of water and electricity, and implementing environment-based training and activities), green inventory control and material handling (using barcode inventory systems and RIFD inventory systems, inventory wastage control, or automatic material handling systems), green warehouse (decreasing use of paper materials, water, and electricity, reusing of the reusable materials, reduction and management of warehouse wastage, or green recycling for warehouse waste materials), and green transport (using technologically advanced transport that emits low carbon dioxide, using alternative sources of energy, following green transport strategies, or promoting eco-driving training) [
9].
In this paper, the focus will be placed on the implementation of Industry 5.0 elements in logistics activities in manufacturing companies, specifically in the internal (processes involved in moving materials or goods inside the plant and its warehouse) and external (processes involved in moving materials or goods outside of the plant towards the final customers) transportation processes [
10]. This requires research of the current and potential human-centricity level, as well as the use of sustainable and green technologies in transition towards Industry 5.0 implementation.
Therefore, this research will be set to answer the following research questions:
RQ1: What are the biggest barriers to implementing green and digital technologies in the internal and external transportation systems of Croatian manufacturing companies?
RQ2: What is the perception of green and digital technologies implementation in internal and external transport of Croatian manufacturing companies?
RQ3: What is the perception of benefits and possibilities of implementing renewable energy resources in internal and external transportation of Croatian companies?
2. Related Works
As preliminary research, the literature was reviewed, relying on the PRISMA literature review guidelines [
11] to obtain a preview of previously published work and the state of the art on the Green Logistics 5.0 topic. The Web of Knowledge platform was browsed, being the most relevant database of published scientific work (
Figure 1). The searched terms were “Green Logistics”, “Logistics 5.0”, “Green transportation” or “Green warehousing” AND “Industry 4.0” or “Industry 5.0”. For the purpose of this research, papers with the topic of “Logistics 4.0” or “Logistics 5.0” AND “human safety” were included. The timespan was set from 2011 to 2023 due to the fact that Industry 4.0 dates back to 2011.
The research field was limited to “engineering, industrial”, “engineering, manufacturing”, and “engineering, multidisciplinary” in order to gain more accurate results related to logistics processes of the manufacturing industry. As shown in
Figure 1, a total of 632 abstracts were browsed, with 10 duplicates excluded. After the screening process, 72 full texts were available and assessed for eligibility, with 19 of them excluded due to insufficient data provided both in terms of theoretical background or research result. Therefore, 53 papers were examined in detail for the purposes of this research.
2.1. Green Management
Green technologies are aimed at significant energy savings and use of renewable energy sources. Hence, energy management of warehousing tends to be one of the most challenging factors. Implementation of Industry 4.0/5.0 technologies enables companies to monitor energy consumption in real time, as well as the optimization of the consumption processes.
Research has, therefore, shown that, with adequate energy management, sustainable and green development can be achieved. The most common topic referred to in the literature is energy saving, followed by the impact of warehouse building and its management [
12].
Energy consumption, as one of the essential components, is a complex and multilayered challenge. In the comparative study of both manual and fully automated warehouses, it is suggested that energy balance should be established for the material handling equipment, energy consumption for building maintenance (heating, cooling, lighting, etc.), and energy generated by the photovoltaic system on the roof. A significant part of consumed energy is noticed to be spent on maintaining warehouse buildings, especially in the case of facilities with a low degree of automation [
13,
14].
One of the key drivers of green warehousing is the reduction in energy consumption. Different material handling activities have different constraints in this matter, while adopting smart automatic picking systems by Industry 4.0 standards increases energy efficiency. In this case, managerial strategies also play an important role in adoption of available equipment to increase warehouse productivity at negligible costs [
15].
Another study has shown that energy consumption level could also be minimized through advanced optimization methods, such as genetic algorithms, and claims that green principles should be implemented in warehouse management to minimize the negative impact on the environment. This can generate higher investment costs in the beginning but enables sustainability of the system in the future [
16].
2.2. Carbon Footprint Reduction
One of the key goals in the EU, but also in global environmental strategies, is the reduction of the carbon footprint. In logistics of the manufacturing industry, this can be provided by using renewable energy sources, Industry 4.0/5.0 technologies, and optimized processes. The reduction of the carbon footprint also enables the decrease in overall costs and leads to economic sustainability. A total of 10% of worldwide CO
2 emissions derive from logistical supply chains, while 20% of the overall logistical cost relates to the amount of energy required for heating, cooling, and lighting, as well as material handling equipment [
17]. Management has a significant role in developing a carbon-efficient supply chain but, also, for the matter of internal logistics processes, it is possible to significantly lower the CO
2 emissions through energy optimization and monitoring of energy usage [
18]. Optimal managerial decisions should be made to optimize both economic benefits and environmental impacts [
19].
The research on green warehousing in Thailand has shown that the utilities for green warehousing had the highest score in carbon footprint reduction, while the remaining challenge is the improvement of green management. One of the motivational factors in implementing green warehousing was social responsibility, while one of the biggest barriers was local law and regulation. Therefore, the top management should be the key initiator of green technology implementation in the warehouse. Moreover, waste reduction through green management can improve employees’ living conditions and productivity by Industry 5.0 human-centric and sustainable standards [
20].
Industries often aim to find a balance in using fossil fuels and reducing carbon emissions. Product deterioration is another motivation to improve processes to maximize product shelf-life because this might be the cause of larger carbon emissions due to increased transportation needed for such products. The use of advanced optimization and simulation methods can improve environmental impact of this kind [
21].
Optimization is very important when using green technologies of transport and material handling, such as electric drive, and one of the suggestions found in the literature is the two-step optimization model based on integer programing for the optimal schedule of the material handling activities of electric mobile, ensuring that jobs are executed in accordance with priority queuing and that the completion time of battery recharging is minimized, which lowers the overall costs [
17]. Hybrid simulated annealing and tempering algorithm is another proposed solution for the routing optimization, which can enable the reduction in carbon emissions and, therefore, lower the cost for the enterprises and their sustainable development [
22].
On the other hand, the Mixed Integer Linear Programing algorithm is proven to provide improvements for an optimized relocation of the warehouses. The objective was to find an economical route, with the goal to minimize fuel consumption and emission of greenhouse gasses. This is how the supply chain managers can, apart from the route optimization, obtain results within an environmentally friendly level to attain sustainability in the warehouses and the entire supply chain [
23].
The simulation of the paths and internal warehousing layouts can also improve efficiency of warehouse operation, warehouse space utilization, and energy consumption, which are related to the reduction of the carbon footprint [
24].
2.3. Green Transport
Green transportation methods and vehicles can have a positive impact on energy efficiency and reduction of the carbon footprint but there are several challenges that a company must overcome in the internal and external transportation system to remain efficient and achieve sustainability of a system.
Transport is referred to as the fastest growing source of greenhouse gas emissions. The goal of green transport is not only to reduce greenhouse gas emissions, air pollution, noise, and space use, but to promote economic growth as well. It provides environmental safety and new customer relationships and product experience [
25].
The implementation of lithium-ion battery (electrical drive) in internal transport reduces the environmental impact in the warehousing on forklifts, with many benefits regarding the reduction in the material handling equipment gas emissions [
26]. The use of electric vehicles can still be very challenging, while the conventional vehicles cause considerable environmental damage. The performance of electric vehicles has numerous constraints, such as battery performance, technological advances, and energy management, so routing challenges must be considered [
27].
Routing optimization is also shown to be very useful in improving the environmental impact [
28,
29,
30], while the decisions on supply lead time, reorder quantities, and storage equipment also have an impact on costs and emissions [
31]. High frequent deliveries with trucks result in high emission during transport but low emission during the storage process [
32].
Subsidies for green vehicles could allow changes in the current fleet, while new solutions, such as own charging stations, could have an impact on energy efficiency.
Intermodal transport can be improved by using lean and green approaches. In the case study of Italy, the proposed green improvement solution was to shift demand from road to rail, which would improve the environmental impact of the transport and lower costs [
33].
Using biofuels is another way to reduce environmental impact in transport, but it also has certain limitations. The case study of the energy and transport sectors in the United Kingdom recognized the main risks to be the lack of investor confidence in biofuel developments (the highest score); energy or fuel security issues; negative public perception of biofuels (equal second highest); increased food prices; high barriers to entry into the fuel market; and misdirected agricultural expansion or land use (equal fifth highest) [
34].
2.4. Industry 4.0 Elements
To achieve optimum results and enable sustainable development of the internal and external transportation systems as well as other logistics processes, the elements of Industry 4.0 can be very useful. The advanced optimization methods play an important role, while the decisions must be as accurate and reliable as possible, with many constraints and influential factors. The dynamic market demands a high flexibility level and optimization in real time; therefore, elements such as Internet of Things can be very useful in green logistics implementation. It provides increased information accuracy while enabling cost reduction and achievement of long-term sustainability [
35]. Real-time monitoring of logistics vehicles such as fuel levels, wheel axle and engine vibration, temperature monitoring, and effective design of maintenance schedule showed improvement from 77 to 98% in overall performance. This resulted in higher customer satisfaction, process efficiency, decreasing cost of operation with energy efficiency, and low latency performance of the implemented IoT-based framework [
36].
The manual order picking generates high costs and the human impacts the efficiency of the supply chain. Therefore, proper human interaction with technology is crucial for operational success, especially within the human-centric systems by Industry 5.0 standards [
37].
Collaborative robots in the logistics sector enable cost savings, as well as the reduction in CO
2 emissions [
38], but special caution must be placed on the workplace design in order to create a safe environment for the human worker [
39].
Research has shown that green transport can have a significant impact on company performance [
40].
Automatic warehousing systems are one of the green technologies and their implementation is influenced by perceived advantage, cost, technological turbulence, business partner influence, firm size, firm scope, and operational performance, especially in SMEs [
41].
Along with the green perspective, the tools of lean management incorporated in the Industry 4.0 technologies can lead to improvements in the transportation processes [
42,
43]. Digital, lean, and green concepts can lead to viable, sustainable, and digital supply chain performance [
44].
Managers should, therefore, once again take the initiative in the area of incorporating environmental management principles into their daily decision-making processes [
45].
2.5. Corporate Strategy and Local Regulations
The green initiative in the manufacturing processes can often be used as a marketing asset, while many works in the literature deal with the relation between the actual implementation of green technologies within the manufacturing companies and the corporate brand strategy. A difference was noticed between the green initiative as a brand strategy and the actual realization in the logistics activities. The green initiative is mostly focused on hardware modifications the studies have shown but it can be considered also as part of the software development segment. The development of low-energy-requirement software is proposed as one of the green solutions requiring less hardware, which then has a green impact in the warehouse management systems [
46].
Environmental awareness should certainly be part of the business strategy but alongside continuous integration and evaluation of green elements. This has been demonstrated in a case study of frozen food supply chains in Saudi Arabia. The emphasis was placed on green operations for energy and resource conservations, which was positively correlated to, while promoting sustainable work culture, sustainable strategies, and policies for their role in encouraging sustainability performance outcomes [
47].
Green logistics management impacts corporate social responsibility and corporate reputation. More precisely, green supply, green packaging, green transportation, and green warehousing have been established to positively affect enterprises’ corporate reputation. Consequently, awareness of green technologies in logistics remains very important [
48].
Green human resource management can also be a useful tool in achieving sustainable corporate environmental management, which positively impacts corporate social responsibility and brand image. Transportation intensity, modal split, emissions intensity, energy efficiency, and vehicle utilization efficiency are suggested to be taken into consideration as the most important elements, while the mediating role of management and employee attitudes and knowledge should also be included [
49].
Local governance regulations and taxes have an influence on green and digital technology implementation in the logistics processes [
22]. The price of conventional vehicles, such as a carbon tax, may lead to both an increase or a decrease in environmental performance [
50].
2.6. Global Evidences
For the purposes of study in this paper, the global evidence of implementation of green Industry 4.0/5.0 technologies in logistics process of internal and external transportation in manufacturing industry was explored in the current literature to be able to structure the research and compare the results on the barriers and challenges of their implementation.
The case study of Indonesia in the leather tanning industry showed that the green modification in the field of both production and logistics needed to enable the functioning of the company on the international market. One of the key technologies to be implemented was a system for business process monitoring, while green warehousing was monitored by ERP system. An information system is built to monitor the activities and management of goods in the warehouse to pay attention to environmentally friendly aspects [
51].
In Zimbabwe, SMEs find the biggest barriers in costs, lack of resources, and knowledge for green logistics adoption. Most of them are still not applying green logistics practices, although several are dealing with adoption of packaging optimization, warehousing, inventory management optimization, along with transport optimization and efficiency (particularly route optimization and fuel efficiency). The green logistics is identified with brand loyalty, good brand image, and profitability for a long run [
52].
The influence of green warehousing, logistics optimization, and social values and ethics on supply chain sustainability and economic performance was studied in Ghana. Green warehousing and logistics negatively influence economic performance but improve their performance through supply chain sustainability. Social values and ethics have positive influence on sustainability and economic performance [
53].
In a developing country, such as the Philippines, the study showed the importance of using green logistics practices in small and medium enterprises, which improves localized sourcing of environment-friendly materials, greener transport options, and subsidized electric vehicles for fleet services, utilization of shared facility to optimize the use of warehouse space, and a strategic take-back scheme and rewards system. The level of implementation of green logistics in industrialized countries differs from that of developing countries and is related to an unsolved problem concerning local logistics solutions and poor quality of logistics services and their high cost. Green technologies which can easily be implemented within small companies are the reuse of packaging, thermo-insulation of warehouses, refusal of paper documents, and reduction in CO
2 emissions to the atmosphere by planning optimal routes [
54].
In the case study of Lithuanian industry, the most encouraged factors to achieve the principles of green logistics are shown to be legal regulation and policies, requirements of business partners, service users, customers and society, awareness of the company’s top management, and corporate culture focused on environmental conservation and sustainable development [
55], similarly to Hong Kong, where the emphasis is placed on the government policy regarding green solutions [
9].
In Thailand, it was revealed that the social and operating performance mediated the impact of four different green supply chain practices on employee engagement and organizational commitment, including environmental education, green marketing, and green warehousing and distribution, which had positive effects, and green manufacturing, which had a negative effect on the firm performance [
56].
The Greek agri-food supply chains study revealed that information sharing, logistics networking, and transportation are the most powerful factors that impact sustainable, business and supply chain performance. On the other hand, green warehousing and logistics emissions had no relation to performance outcomes [
57].
Eco-design, green production, green purchasing, green recycling, green transportation, and green warehousing were shown to be the highest priority in achieving green supply chain in Malaysian companies [
58].
In Slovakia, the study of implementation of Industry 4.0 green logistics elements showed that automotive industry companies are the leaders in the implementation. Companies use voluntary tools of environmental policy and the most important one is corporate social responsibility, primarily in logistics processes of warehousing and storage. The biggest barrier is the lack of financial resources, but one of the benefits is the improvement of customer–supplier relations [
59].
In France, a positive influence of proactive environmental strategies on environmental performance was noticed, especially in distribution and transport, warehousing and green building, and reverse logistics. However, the co-operation with customers and eco design and packaging, and only eco-efficiency orientations positively influence environmental performance through green supply [
60].
In Mexico, a novel methodology called Sustainable Transportation Value Stream Map was proposed, and the results indicated that the lean and green principles are an effective approach, which benefit both operational efficiency and environmental performance of road transport operations [
61].
In China, the transportation industry generates high pollution emission and energy consumption, as well as traffic congestion. The improvement of energy efficiency and control of environmental pollution is suggested as a part of a green transport system building with bigger traffic planning, optimization of transport structure, and administration of energy saving and environmental conservation. Furthermore, the development of intelligent transportation systems and technical innovation are noticed to be two of the key factors in the sustainable system [
62].
In Poland, social expectations from Industry 4.0 implementation are focused on the development being human-centric, sustainable, and resilient logistics systems were established [
63], while, in the construction industry of New Zealand, transportation costs are more than half of overall logistics costs. Mostly, it is road transport and, to ensure sustainability, environmentally friendly improvements should be considered, because 99% of freight transport is dependent on fossil fuels. Decarbonization is related to Industry 5.0 implementation, but there are still no proposed solutions available [
64].
3. Research Design, Materials and Methods
The aim of this research was to examine the current state, potentials, and challenges in implementation of green Industry 4.0 or 5.0 technologies in internal and external transport processes of Croatian manufacturing companies. The implementation of both Industry 4.0 and its future development 5.0 will be examined, due to the previously conducted research in Croatia [
65,
66,
67,
68,
69], which has shown that there is a low level of implementation of Industry 4.0 elements, along with the familiarity of companies with the concept. As Industry 4.0 remains better known and a longer known concept and Industry 5.0 includes all of the elements of 4.0, the familiarity and implementation of both concepts will be examined to make it clearer to the participants in the research. Therefore, a survey was created based on the most common green and digital elements of internal and external transport recognized from related works, explained in
Section 2, and previous work by the authors [
65,
66,
67,
68].
3.1. Questionnaire
The target group of the research was Croatian manufacturing companies. The data were collected through an online questionnaire, structured in the Google Forms online application and sent to 952 active manufacturers with available contact. A total of 134 results were received. The majority of the participants are CEOs of the contacted companies but, also, the answers were received from logistics managers, project managers, R&D engineers, executive managers, and plant managers, which makes them reliable for the research. Answers from the positions of the secretary, finance, and sales manager were excluded from the research to provide accuracy of the results. Also, the questionnaires with fake and invalid responses were removed from the research, so, in total, 112 participants were reliable for the result analysis, which makes a total response rate of 11.76%.
The survey (available in
Supplementary File S1) was structured to have four parts. In the first part, the basic information about the manufacturer was collected, such as the company size, years of active presence on the market, number of participant’s work experience years within the current company, and whether the green technologies and the use of renewable energy sources are part of the corporative brand and strategy. The second part of the survey was related to the current level of digitalization and general use of Industry 4.0/5.0 technologies. Familiarity with Industry 4.0/5.0, current level of digitalization within the company, challenges in the digitalization process, as well as the current use of green technologies, renewable energy sources, and interest for green technology implementation were examined. In the third part, the participants had to answer questions regarding digitalization and green technology implementation in internal transport, while, in the fourth part, the questions were based on green technologies’ implementation and digitalization in the activities of external transport. Besides that, safety and the influence of human workers on those activities were also examined, being related to the human-centricity of Industry 5.0 concept. Two types of questions were proposed to make results relatable to the previously conducted research found in the literature and described in
Section 2 and the previous work by the authors [
65,
66,
67,
68]. Questions regarding the existence of green and digital elements in the company were proposed with predefined answers, while the evaluation of the current level of the digitalization and green principle use is proposed on a Likert scale (1–5) for the easier perception of the user [
70]. Also, based on previous experience [
65,
66,
67,
68], the rankings were made simple for the user in terms of equal number of elements and rank numbers. The data were collected in March 2023, while the statistical analysis was provided by IBM SPSS v27 software.
3.2. Statistical Analysis
The data were analyzed with z-test, t-test (with Bonferroni correction), and the Pearson correlation coefficient.
A z-test [
71] is used to determine whether two population means are different when the variances are known and the sample size is large (n > 30). A z-test is used in hypothesis testing to evaluate whether a finding or association is statistically significant or not. In particular, it tests whether two means are the same (the null hypothesis). A z-test can only be used if the population standard deviation is known and the sample size is 30 data points or larger. Otherwise, a t-test will be employed.
For null hypothesis H0: μ = μ0 vs. alternative hypothesis H1: μ ≠ μ0, a two-tailed test is used.
A
t test [
72] is a statistical test that is used to compare the means of two groups. It is used in hypothesis testing to determine whether two groups are different from one another. The 95% confidence interval is considered. This is the range of numbers within which the true difference in means will be 95% of the time.
The Bonferroni test is a type of multiple comparison test used in statistical analysis. When performing a hypothesis test with multiple comparisons, eventually, a result could occur that appears to demonstrate statistical significance in the dependent variable, even when there is none. The Bonferroni test is a statistical test used to reduce the incidence of a false positive. The Bonferroni test, also known as “Bonferroni correction” or “Bonferroni adjustment” suggests that the p-value for each test must be equal to its alpha divided by the number of tests performed.
The Pearson correlation coefficient (
r) [
73] is the most common way of measuring a linear correlation. It is a number between –1 and 1 that measures the strength and direction of the relationship between two variables.
4. Results
In the total of 112 participants, 43.75% are representatives of micro, 39.3% of small, 10.7% of medium, and 6.25% of large enterprises. The size of companies is defined by the Croatian law and the European Union directives. This is why, for the purposes of the future analysis and testing of the significant differences of the groups by size, large and medium enterprises will be examined as one group, while the other group will consist of small and micro enterprises. Regarding the years of the active presence of the company on the market, there are 9.82% of those present 1–5 years, 18.75% present 5–10 years, 19.64% present 10–20 years, and 51.76% present more than 20 years. For the future analysis, the results will be grouped into three categories: (1) up to 10 years, (2) 10–20 years, and (3) more than 20 years present on the market. The mean value of work experience within the company of a representative is 12.84, with a standard deviation (st.dev.) of 8.78 years. The participants will also be grouped according to their familiarity with Industry 4.0 and 5.0 concepts. There are 19% of those familiar with Industry 4.0, 4% familiar with Industry 5.0, 17% familiar with both Industry 4.0 and 5.0, while 60% are not familiar with Industry 4.0 or Industry 5.0. Participants will, therefore, be grouped into (1) those familiar with Industry 4.0 or 5.0 or both and (2) those who are not familiar with Industry 4.0 or Industry 5.0. In total, 70% of the participants claim that green technologies and use of renewable energy sources are part of their corporate brand and strategy and 30% do not. This is another group within which significant differences will be tested.
4.1. Green Technologies and Digitalization
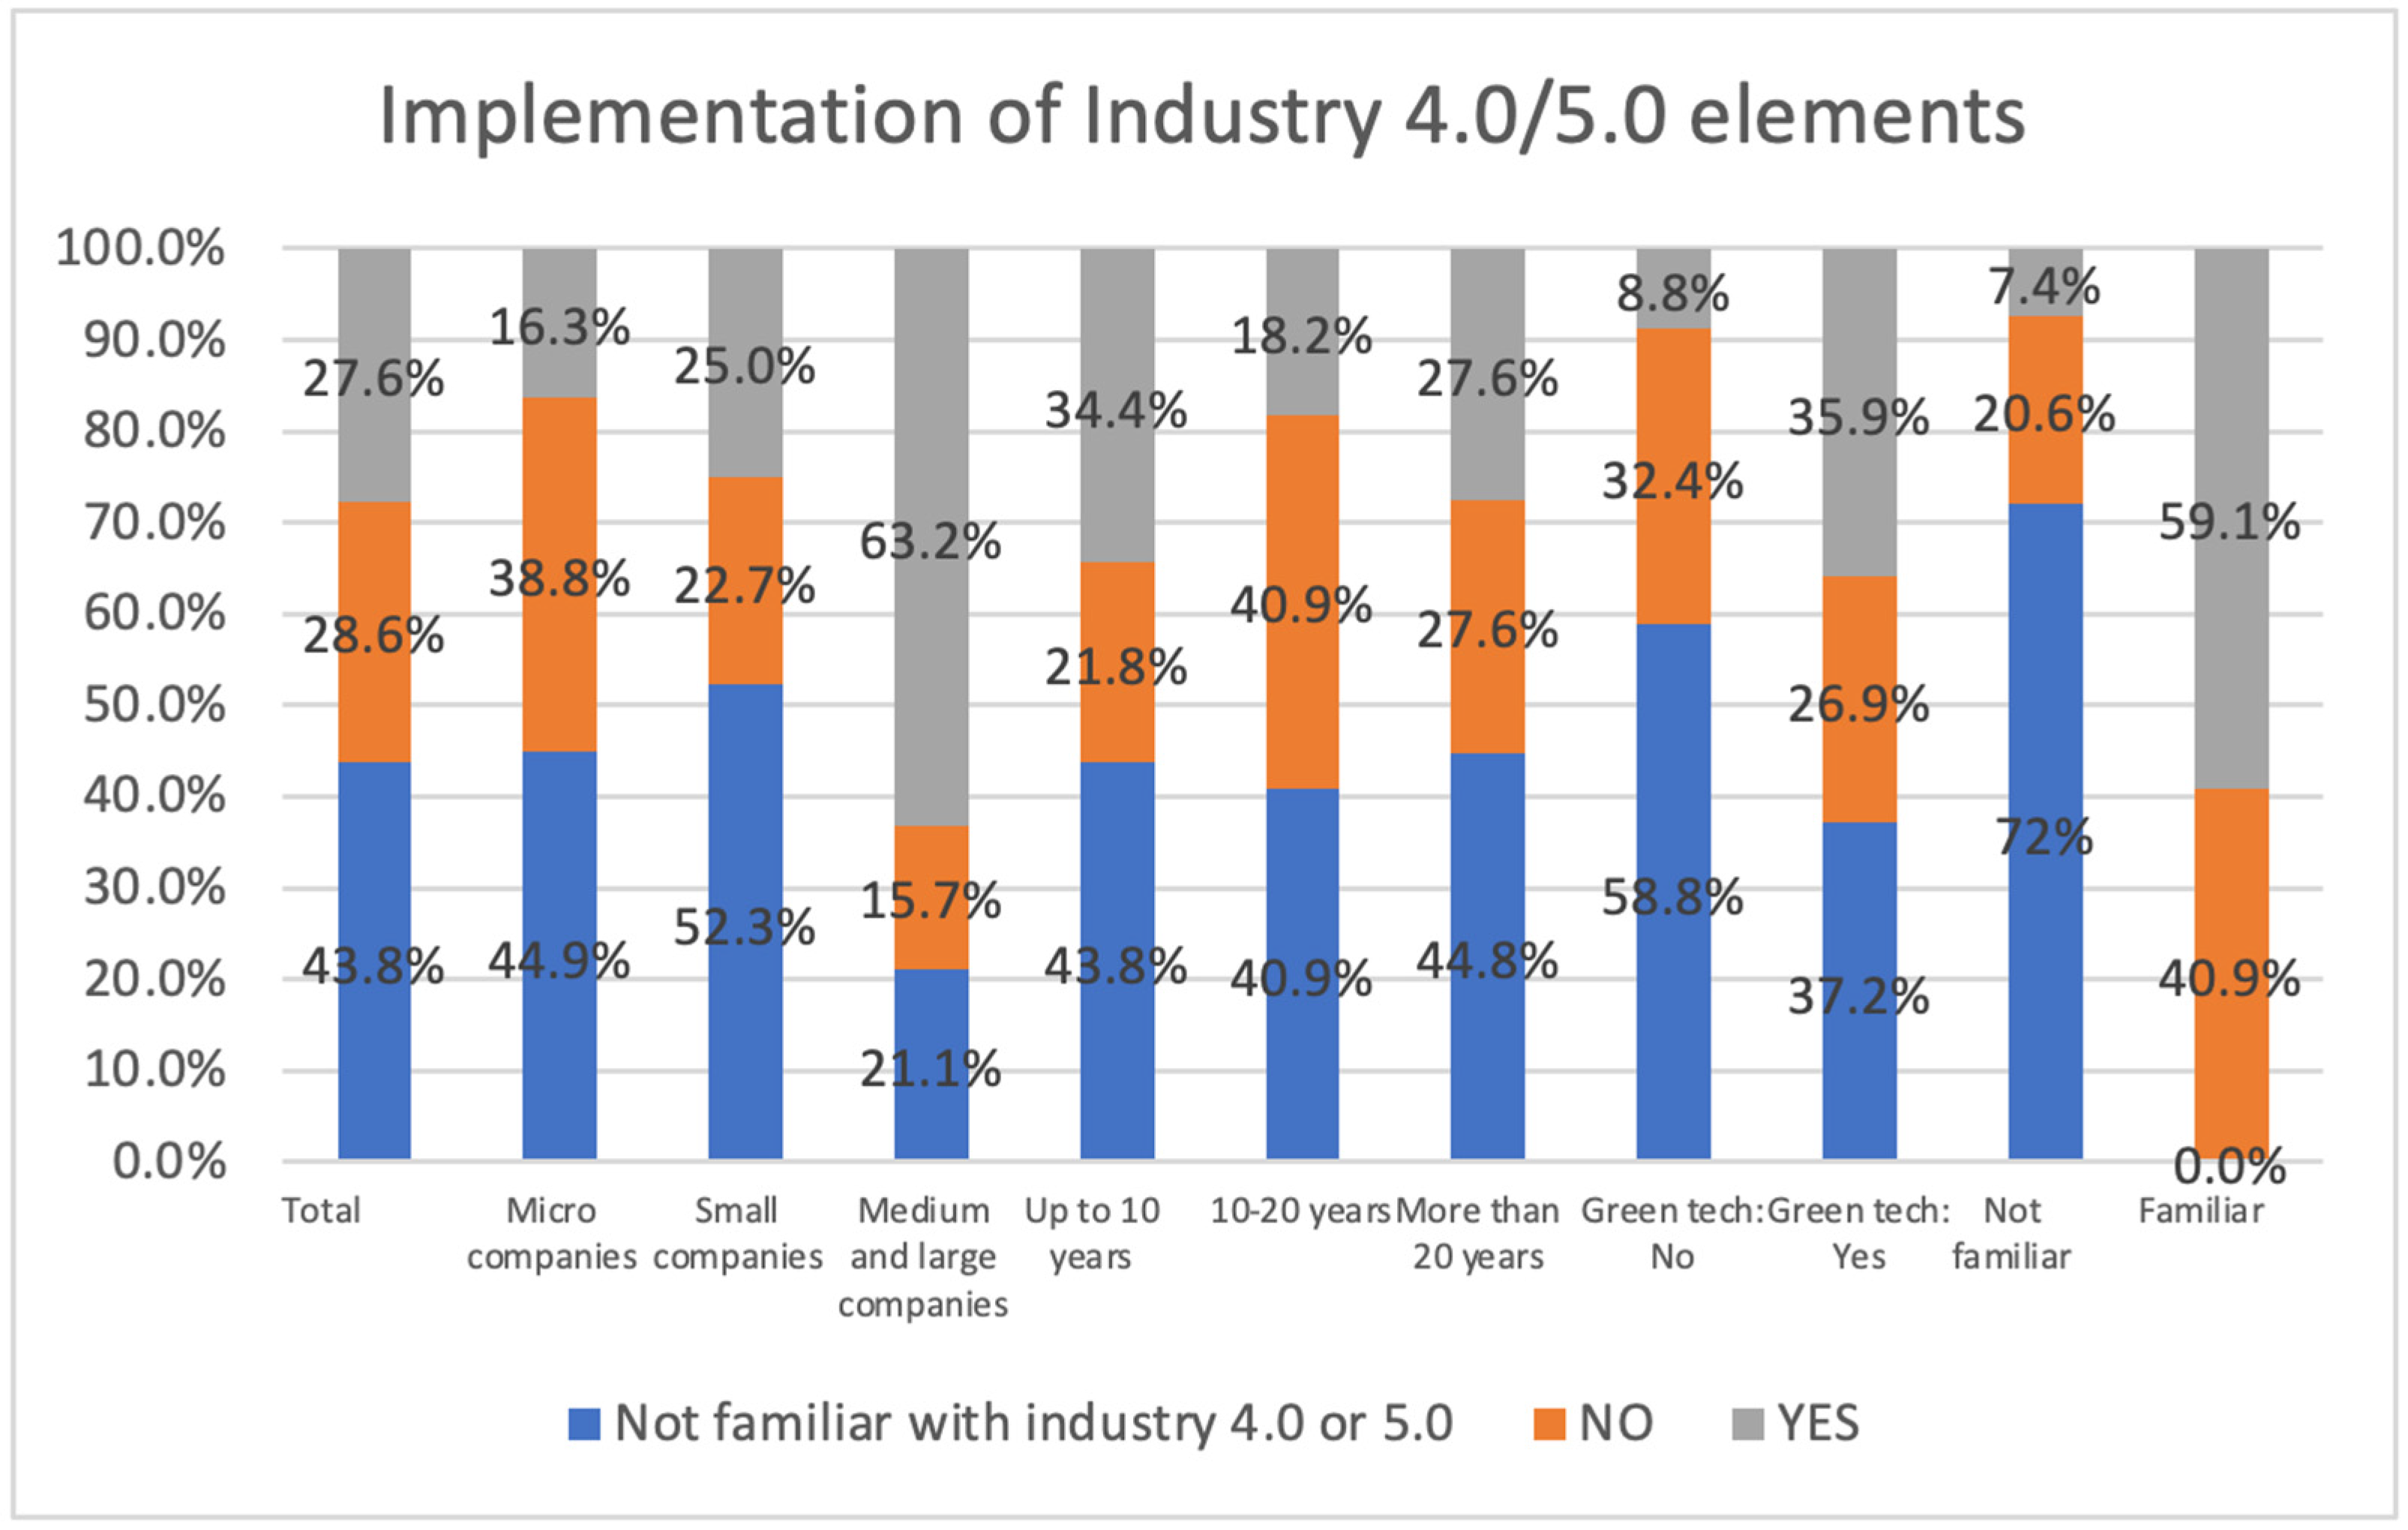
The participants were asked if they had already implemented segments of Industry 4.0 or 5.0 within their company. Since previous research has shown that many were not familiar with those concepts, which, once again, was proven also in the current research, the “implementation of digital technologies” was added as part of the question, which is why 7.4% of those unfamiliar with Industry 4.0 or 5.0 stated that their company had implemented certain levels of digital technologies within the company. The results are shown in
Figure 2.
In total, only 27.7% of manufacturing companies in Croatia have implemented certain elements of Industry 4.0 or 5.0, within which 59.1% of them are familiar with Industry 4.0 or 5.0. The lowest rate of implementation is demonstrated by companies which are 10–20 years present on the market (18.2%), while the highest rate of implementation is present in medium and large companies (63.2%). Also, 35.9% of the companies have green technologies as part of their corporate strategy and their brand implemented certain digital technologies, compared to only 8.8% of those who do not have a tendency towards green technologies as corporate strategy. A significant difference was also proven by statistical analysis and noticed in the company size (p = 0.012) in the green tech group (p = 0.003) and familiarity with Industry 4.0/5.0 (p = 0.02).
The participants were asked to approximate the level of interest of their company in digitalization and the current level of digitalization. The results are shown in
Figure 3.
The average grade of interest of companies in digitalization is 3.47 (where 1 is the lowest and 5 the highest level). Those without green corporate strategy (2.71) have the lowest average interest, while the highest is shown by medium and large enterprises (3.95). A significant difference is noticed in familiarity with Industry 4.0/5.0, p = 0.005. The average grade of personal approximation of the current level of digitalization within the company is 2.82, where the highest rate is shown by those with green tech strategy (3.0), while the lowest, again, by those without green tech strategy (2.41), with a significant difference proven by p = 0.005. A significant difference has been noticed in the group of company size between medium/large (3.42) and micro companies (2.63), p = 0.016.
The participants were asked to assess the challenges in the digitalization of the company on a scale 1 to 5, where 1 represents the biggest and 5 the smallest value of challenge. The challenges were too little time to develop new concepts (C1), unavailability of technologies on the market (C2), employee resistance to change (C3), high investment (C4), and lack of people with necessary knowledge and skills within the collective (C5) and they were defined by the previous research by the authors [
65,
66,
67,
68] and evidence from the literature (
Section 2.6). The results are shown in
Table 1.
The greatest challenge in digitalization in total is unavailability of the technologies on the market and employee resistance to change (2.88), followed by too little time to develop new concepts (2.91), while the least challenging proved to be the lack of people with necessary knowledge and skills (3.05). Among those familiar with Industry 4.0/5.0 concept, the greatest challenge perceived is the unavailability of technologies on the market (2.89), followed by the lack of knowledge and skills (2.95). Employee resistance to change is a highly perceived challenge in medium and large companies (2.47), as well in companies present up to 10 years on the market (2.72).
The average grade of use of green technologies (in which 1 represents no use of green technologies and 5 represents green technologies being an integral part of the processes) is 2.53, in which those with green technologies as corporate strategy have the highest grade of 2.99 and those without the lowest of 1.47. The results are shown in
Figure 4.
Those familiar with Industry 4.0/5.0 have a higher tendency towards using green technologies (2.77) than those who are not familiar with it (2.37). Also, the highest tendency towards green technologies is present in small companies (2.64) and companies up to 10 years present on the market (2.75).
In total, 61.6% of companies do not use renewable energy sources, while 52.3% of small companies use some sort of renewable energy source in the company. The results are shown in
Figure 5.
The most frequently used renewable energy source is sun energy (32.1%), while the least frequently used is hydrogen energy (0.9%). The average level of interest, where 1 represents the lowest and 5 the highest interest in renewable energy source implementation, is 3.48, while the highest interest (3.89) is shown by medium and large companies. The participants were asked to assess the level of interest in their company in renewable energy resource implementation, where 1 represents no interest and 5 a very high interest in implementation. The results are shown in
Figure 6.
The overall interest is 3.48, while medium and large enterprises have the highest rate of interest of 3.89. Those without green corporate strategy rated the lowest interest, with an average of 2.65, while those with green corporate strategy rated 3.85, where a significant difference is noticed.
4.2. Green and Digital Internal Transport
In the second section, methods of internal transport were examined, the level of their digitization, the use of green technologies, human influence and safety, and perceived benefits and challenges of digital and green technologies. The overall results of internal transport methods are shown in
Figure 7.
The majority of companies (71.4%) use manual transport of human workers, while 66% use forklifts in internal transport. The largest percentage of usage of advanced automatized transport systems is noticed in medium and large enterprises (10.5%). A similar percentage of 9.4% of companies present up to 10 years use advanced automatized transport systems, unlike only 3.4% of companies present more than 20 years on the market. Those familiar with Industry 4.0 have a lower rate (68.2%) of human transport, compared to those who are not familiar with it (73.5%). Medium and large companies have the highest rate of forklift usage (89.5%). In total, 49% of micro companies use forklifts, as well as 75% of small companies, which constitutes a significant difference between small and large companies compared to micro companies (p = 0.03, p = 0.007).
Most of the companies (53.7%) use electricity as internal transport drive, as shown in
Figure 8. Medium and large companies are leaders in the use of electric drive (78.9%). The second most used drive is diesel (37% in total), while companies with 10–20 years of presence on the market use diesel and electricity equally. Medium and large companies prefer gas over diesel (42.1% and 31.6%), while there were no significant differences noticed between those with green technologies as corporate strategies and those without.
Next, the participants were asked to rate the need for automatization and digitalization of internal transport on a Likert scale (1–5, with 1 meaning that automatization and digitalization is not needed and 5 that it is extremely needed). They were also asked to rate how much energy price changes affect the final product price (1—minimally; 5—extremely) and rate the need for replacement of existing energy sources with renewable ones (1—not needed; 5—extremely needed). The results are shown in
Figure 9.
In total, the average need for automatization and digitalization of internal transport is rated with 2.64. The highest interest in digitalization is present in medium and large companies (3.58) and the lowest, 2.09, in companies without green technologies in corporate strategy. Therefore, a significant difference has been noticed among the groups regarding the company size, where middle and large companies differ from micro and small companies (p = 0.007, p = 0.16), and, also, among those with green technologies as corporate strategy (p = 0.004).
The average influence of rate of energy price towards the final product is 3.40, the highest in medium and large companies (4.0), and the lowest again in companies without green strategy (2.88), where a significant difference in the group has been noticed (3.63; p = 0.002). The average need for the transition towards renewable energy sources is rated with 2.98, with the highest among medium and large companies (3.58) and the lowest in those without green strategy (2.24), where, as expected, a significant difference within the group has been noticed (p = 0).
The average influence of the human in internal transport is rated with 4.03, with 1 meaning that the process is not dependable on the human and 5 meaning that the process is entirely dependent on the human. There are no significant differences between the groups noticed, with the minimal value of 3.64 (10–20 years) and the highest value of 4.22 (more than 20 years). Additionally, the safety of a worker within the facility has been rated highly, with an average grade of 4.08, while the level of the workers’ awareness of safety is rated with 4.02, with no significant differences within the groups. The occupational safety methods (fenced areas for movement and operation of machines—O1; other—O2; market places of movement and operations of the machines—O3; sensors for stopping the machine in case of emergency—O4; protective footwear—O5; protective clothing—O6) in internal transport are shown in
Table 2. The occupational safety methods were defined by the previous research by the authors [
65,
66,
67,
68] and evidence from the literature (
Section 2.6).
The most frequently used occupational safety method is protective clothing (87.5%), while the least frequently used are sensors for stopping the machine in case of emergency (25.9%). A significant difference was noticed in the use of sensors between medium/large and micro companies (p = 0.024). Furthermore, in the green technologies as corporate strategy group, significant differences have been noticed in the use of fenced areas for movement and operation of machines and marked places of movement and operation of machines (p = 0; p = 0.001).
The levels of resource recycling are shown in
Figure 10.
The average level of resource recycling is 3.40 (1—extremely low; 5—extremely high), where the lowest rate is present in companies without green strategy, 2.85 (with a significant difference noticed in the group, p = 0.001), and the highest in medium and large companies (3.74). On the other hand, the monitoring of energy efficiency within the company is rated relatively low, with an average grade of 2.48 (1—extremely low; 5—extremely high), with no significant differences among the groups and the maximum average value of 2.78 in companies present up to 10 years on the market.
The companies were asked to rank the importance and benefits of the usage of renewable energy resources in internal transport: simplicity of use (R1), availability (R2), environmental awareness (R3), human safety (R4), and flexibility (R5). Benefits of the usage of the renewable energy resources in internal transport were defined by the previous research by the authors [
65,
66,
67,
68] and evidence from the literature (
Section 2.6). The evaluation was provided on the scale 1–5, where 1 has the highest importance and 5 the lowest. The results are shown in
Table 3.
The element rated the highest is environmental awareness (2.78), while availability has the lowest importance (2.92). Small companies and those present up to 10 years consider availability to be the most important element. A significant difference was noticed in the ranking of element “simplicity of use” between the micro companies and small companies (p = 0.044), as well as flexibility (p = 0.02). A difference was also noticed in the ranking of element simplicity of use and availability in the group of familiarity with Industry 4.0/5.0 (p = 0.049, p = 0.021).
Participants were asked to rank the reasons for potential digitalization of internal transportation system. The elements ranked were human safety (D1), flexibility (D2), increase in productivity (D3), cost minimization (D4), increase in quality (D5), and possibility of activity monitoring (D6). Reasons for potential digitalization of the internal transportation system were defined by the previous research by the authors [
65,
66,
67,
68] and evidence from the literature (
Section 2.6). The results are shown in
Table 4.
The most important reason for potential digitalization considered by the companies is the increase in productivity (2.92), followed by human safety (2.98). Medium and large companies, as well as those not familiar with Industry 4.0 or 5.0, consider human safety to be the most important (2.58 and 2.81). Companies find possibility of activity monitoring to be the least important (3.20).
4.3. Green and Digital External Transport
In the third section, methods of external transport were examined, the level of their digitization, the use of green technologies, human influence and safety, and perceived benefits and challenges of digital and green technologies. The overall results of internal transport methods are shown in
Figure 11.
Overall, 99.1% of the companies in Croatia use road transport, which is expected, since most of the cargo transport in Croatia is road-based. Only 3.6% use rail transport, while a significant difference was noticed in the familiarity with Industry 4.0/5.0 group, in which 31.8% of those familiar with Industry 4.0/5.0 use sea transport and 29.5% air transport. A total of 8.8% of those who are not familiar with Industry 4.0/5.0 use sea transport and 7.4% air transport, which makes a significant difference (p = 0.002, p = 0.002).
The most common drive of the external transportation vehicles is diesel (92%), while only 5.4% use electricity and 2.7% use gas.
The average grade of usefulness of the “green” vehicles in external transport is 3.38, where 1 means that they are not useful and 5 that they are extremely useful. The highest rating of usefulness is present in medium and large enterprises (3.84) and those familiar with Industry 4.0/5.0 (3.27). The safety of workers was graded with an average of 3.74, where 1 represents an extremely low and 5 an extremely high level. The highest level of safety is perceived by those unfamiliar with Industry 4.0/5.0 (3.85) and small enterprises (3.80). The lowest safety is perceived by companies 10–20 years present on the market (3.5).
Only 39.3% of companies monitor the condition of the worker in real time, with the lowest rate in micro companies (26.5%) and the highest in small companies (52.3%), with a significant difference (p = 0.033).
The average grade of driver safety is 3.74 (1—minimal safety; 5—completely safe), with the highest safety present in those unfamiliar with Industry 4.0/5.0 (3.85) and companies present up to 10 years (3.84), with no significant differences in groups noticed.
The interest in digital technologies for external transport monitoring (1—not interested; 5—extremely interested), perception of future cost minimization with green technology implementation (1—minimum cost minimization; 5—maximum cost minimization), and perception of readiness of customers to pay for greener technology implementation (1—not ready to pay; 5—completely ready to pay) is shown in
Figure 12.
Customers are perceived as not ready to pay for the implementation of green technologies, with an average grade of 1.79, with a difference noticed between the groups in green strategy (1.5/1.92; p = 0.026). The highest interest in implementation of digital technologies in external transport is shown by medium and large companies (3.79), while the lowest interest was found in micro companies (2.27), with an average of 2.89.
The average perception of cost minimization by green technology implementation is 2.49, with the lowest perception present in those with no green strategy (1.97), where a difference in the group is noticed (p = 0.002), and the highest perception of cost minimization in companies with up to 10 years of existence (2.78).
The barriers of high price (E1), unavailability (E2), no need (E3), insufficient development of technologies (E4), low endurance (E5), and low safety of the worker (E6) were ranked, where 1 represents the biggest barrier and 7 the lowest barrier in renewable resource implementation in external transport. The barriers for renewable energy resource use in external transport were defined by the previous research by the authors [
65,
66,
67,
68] and evidence from the literature (
Section 2.6). The results are shown in
Table 5.
The biggest barrier overall is the high price (2.64) and low endurance (2.79), while those familiar with Industry 4.0 or 5.0 consider the insufficiency of development of technologies to be the biggest barrier. Those not familiar with it consider the high price to be the biggest barrier.
Perceived importance of reasons for use or implementation of electrical drive in external transport (defined by the previous research by the authors [
65,
66,
67,
68] and evidence from the literature (
Section 2.6)) was ranked according to the following elements: safety (T1), environmental awareness (T2), availability (T3), sustainability (T4), profitability (T5), simplicity (T6), flexibility (T7), increase in productivity (T8), and increase in quality (T9). A score of 1 represents the highest priority and 5 the lowest. The results are shown in
Table 6.
The most important element of electric transportation perceived is environmental awareness (4.19). In companies with green strategy, the highest importance was given to environmental awareness and sustainability (4.15), while those with no green strategy mention profitability as the most important reason. Those familiar with Industry 4.0 gave the highest priority to environmental awareness, while those unfamiliar with Industry 5.0 consider profitability to be the most important element (3.84).
Companies believe that the implementation of digital and green technologies would make work for the human easier, with an average grade of 2.57 (1—would not make it easier; 5—would make it extremely easier). The highest level of perception is found in medium and large enterprises (3.32), while the lowest level of perception is found in those without green strategy (2.06; p = 0.002).
5. Discussion
Interestingly, 12 years after the presentation of the Industry 4.0 concept in 2011, 60% of the participants are still not familiar with the concept. This can be compared to the research conducted in 2020 [
67] among the metal machining companies in Croatia, in which 46% of the participants were said to be unfamiliar with the Industry 4.0 concept. One of the possible conclusions is that the representatives of the metal machining sector are more aware of the possibilities of digital transformation and its benefits compared to other manufacturing sectors. Only 27.7% of the participants claim to have already implemented elements of Industry 4.0 in their systems, while the average level of digitalization perceived by the companies is 2.82. Roughly compared to the results from the 2015 research, where the average level of readiness of Croatian companies was 2.15 [
69], it cannot be said that significant changes in digitalization level have been achieved over the years, although the initiative for the digital transformation has a highly perceived result of 3.47. A correlation was found between those two variables (r = 0.356;
p = 0.001). There is a correlation between the familiarity with Industry 4.0 and the level of digitalization in the company (r = 0.252;
p = 0.018) but also with the use of green technologies (r = 0.232,
p = 0.029). There is no correlation between the level of digitalization or familiarity with Industry 4.0/5.0 and the level of interest in implementing renewable energy sources in the company. The level of general digitalization correlates with the level of digitalization in both internal and external transport (r = 0.323,
p = 0.001/r = 0.347,
p = 0.01)), while no correlation was found in the choice of internal vehicles or their drive. Interestingly, 70% of the participants have green technologies implemented in the corporate brand or strategy. The role of the human in the system remains high, with a large percentage of manual transportation (71.4%). The perceived level of safety of the worker is high (4.08), along with their awareness of safety measures and regulations (4.02). The companies are aware that digitalization would enable improvement of human safety, which is aligned with Industry 5.0 principles.
Compared to global research, countries of emerging economies [
47] have mentioned the greatest challenges in adoption of energy efficient operations, followed by green strategy. The challenge with the largest impact is the implementation of green infrastructure. The situation is similar in Croatia, where the greatest challenge recognized was the unavailability of the technologies and employee resistance to change, followed by time needed for the adoption of green technologies, which differs from the Croatian perception of the lack of people with necessary knowledge and skills. The situation is the opposite in Lithuania, where one of the greatest challenges mentioned is the quality of the managerial practice [
55]. Concerning the digitalization of the internal transportation system, the research from Lithuania has found monitoring of emissions from the vehicles to be one of the most important benefits, while, in Croatia, this is considered to be the least important within internal export. In warehousing, they found maximization of the use of the warehouse space to be the most important criteria, while the increase in productivity and human safety was found very important for the digitalization of internal transport among Croatian companies. While emerging countries, therefore, find the financial aspect of the implementation of green elements most challenging, those with a higher level of development consider the regulations of the governance very important for their future green development. Croatia can be said to be somewhere in between, where the economy is not anymore emerging but, yet, is not one of the leaders in the EU; therefore, there are moderate similarities found with both sides, meaning that the investments in both financial and time matters remain high for the local companies but, also, the local regulations are recognized to be encouraging for the future digital and green development [
74]. There is little evidence which claims that customer relation improvement is noticed with the implementation of green and digital technologies [
15,
55,
59], while this research has shown that, in Croatia, the customers are not ready to pay for the green solutions implemented in their product, which makes the transition even more challenging.
The green agro-food sector finds the possibility of rapid information sharing and cost reduction to be beneficial segments of digital and green technology implementation, along with energy saving and reduction in waste [
57], while the Croatian companies again recognize the increase in productivity and human safety to be the most beneficial. Companies from Slovakia, similarly to Croatian companies, consider the lack of financial resources to be the biggest barrier in implementation of digital and green technologies. Moreover, they find the lack of staff dealing with this issue in enterprise to be the least challenging barrier, again similar to Croatian companies. They consider the use of green technologies to be a possible tool in improving the customer–supplier relationship, while improvement of self-image is considered to be the least important. Slovakian geographical position and the similar level of economy development level explains the expected similarities found in this research [
75]. Developing countries, such as the Philippines [
54], find the reduction in waste and the possibility of resource recycling to be the key benefit in implementing green technologies in external transport. Croatian companies find the highest benefits in raising environmental awareness and achieving sustainability but, also, see their high price to be the most challenging in implementation. Likewise, companies in Zimbabwe [
52] have also recognized the financial aspects of initial investment, operational costs, and certification costs as the most challenging. Unlike Croatian companies, they find the lack of knowledge and skills of the workers to be the biggest barrier but, similarly to Croatian companies, they find the unavailability of certain digital technologies to be one of the biggest barriers. Environmental awareness and sustainability is also a motivation for the companies in New Zealand to implement renewable energy resources in external transportation systems [
64]. In Indonesia [
51], companies have given a high level of importance to implementation of advanced business process monitoring systems, while the Croatian companies did not perceive it to have relatively high importance (2.89/5). Mexican external transport of manufacturing companies [
61] through the implementation of green and digital technologies would benefit in operational efficiency and overall environmental performance, while the Croatian companies see increase in productivity and profitability to be the fourth and third factor in importance. Regarding the company sizes, there is much global evidence found where the small companies have a higher tendency towards the green and digital transition, along with the simplicity of the implementation due to a smaller system [
52,
54,
63]. The results of this research have found that medium and large companies in Croatia have a higher tendency towards the digital and green transition, which can be explained in the percentage of the micro and small companies involved in this research (43.75% micro and 39.3% small), which can be recognized as a limitation.


