Article

A Fuzzy-Based Analysis of the Mediating Factors Affecting Sustainable Purchase Intentions of Smartphones: The Case of Two Brands in Two Asian Countries

1
Department of Business Administration, Asia University, 500, Lioufeng Rd., Wufeng, Taichung 41354, Taiwan
2
Department of Management, California State University, San Bernardino, 5500 University Parkway, San Bernardino, CA 92407, USA
3
Center for Study of South Asia and Middle East, Graduate Institute of International Politics, National Chung Hsing University, Taichung 402202, Taiwan
4
Faculty of Economics, University of Mazandaran, Babolsar 4741613534, Iran
5
International Center for AI and Cyber Security Research and Innovations & Department of Computer Science and Information Engineering, Asia University, Taichung 41354, Taiwan
6
Symbiosis Centre for Information Technology (SCIT), Symbiosis International University, Pune 412115, India
7
Department of Electrical and Computer Engineering, Lebanese American University, Beirut 1102, Lebanon
8
Center for Interdisciplinary Research, University of Petroleum and Energy Studies (UPES), Dehradun 248007, India
9
University Center for Research & Development (UCRD), Chandigarh University, Chandigarh 140413, India
*
Author to whom correspondence should be addressed.
Sustainability 2023, 15(12), 9396; https://doi.org/10.3390/su15129396
Submission received: 11 May 2023 / Revised: 29 May 2023 / Accepted: 6 June 2023 / Published: 12 June 2023

Abstract

:
Given their functionality, all smartphone brands are the same. Their similarities notwithstanding, they supply the same product at different prices in the same market. Strangely enough, the consumers do comply and willingly pay such price premiums. This study examines the mediation effect of price premium and brand preference on the causal impact of brand equity on sustainable purchase intention. The novelty of this study is in transforming the initial measures in a 5-point Likert scale into continuous values through a fuzzification and defuzzification process. Brand equity comprises three factors: brand awareness, perceived quality, and prestige value. Standardized questionnaire collected data in two countries (Taiwan and Indonesia) on two brands of smartphones (iPhone and HTC). Overall, 404 questionnaires were distributed in Taiwan, and 434 questionnaires were distributed in Indonesia. The data were analyzed by applying a structural equation model after conducting an exploratory and confirmatory factors analysis. In order to improve the estimations’ accuracy, the initial measures in a 5-point Likert scale were transformed into continuous values through a fuzzification and defuzzification process. The former consisted of assigning triangular fuzzy numbers, and the latter entailed assigning a center of gravity to each triangular fuzzy number and then extracting a random number from a normal distribution function based on the center of gravity. According to the results, price premium and brand preference exhibited significant mediation effects, with price premium having stronger effects than brand preference. Furthermore, the mediation effect was strongest for perceived quality and weakest for perceived prestige value.

1. Introduction

At first, cell phones were luxurious products only accessible to the rich. They did not meet immediate needs, and the customers did not feel their absence. However, over a short period, especially after the introduction of smartphones, cell phones became an indispensable part of everybody’s daily life. 
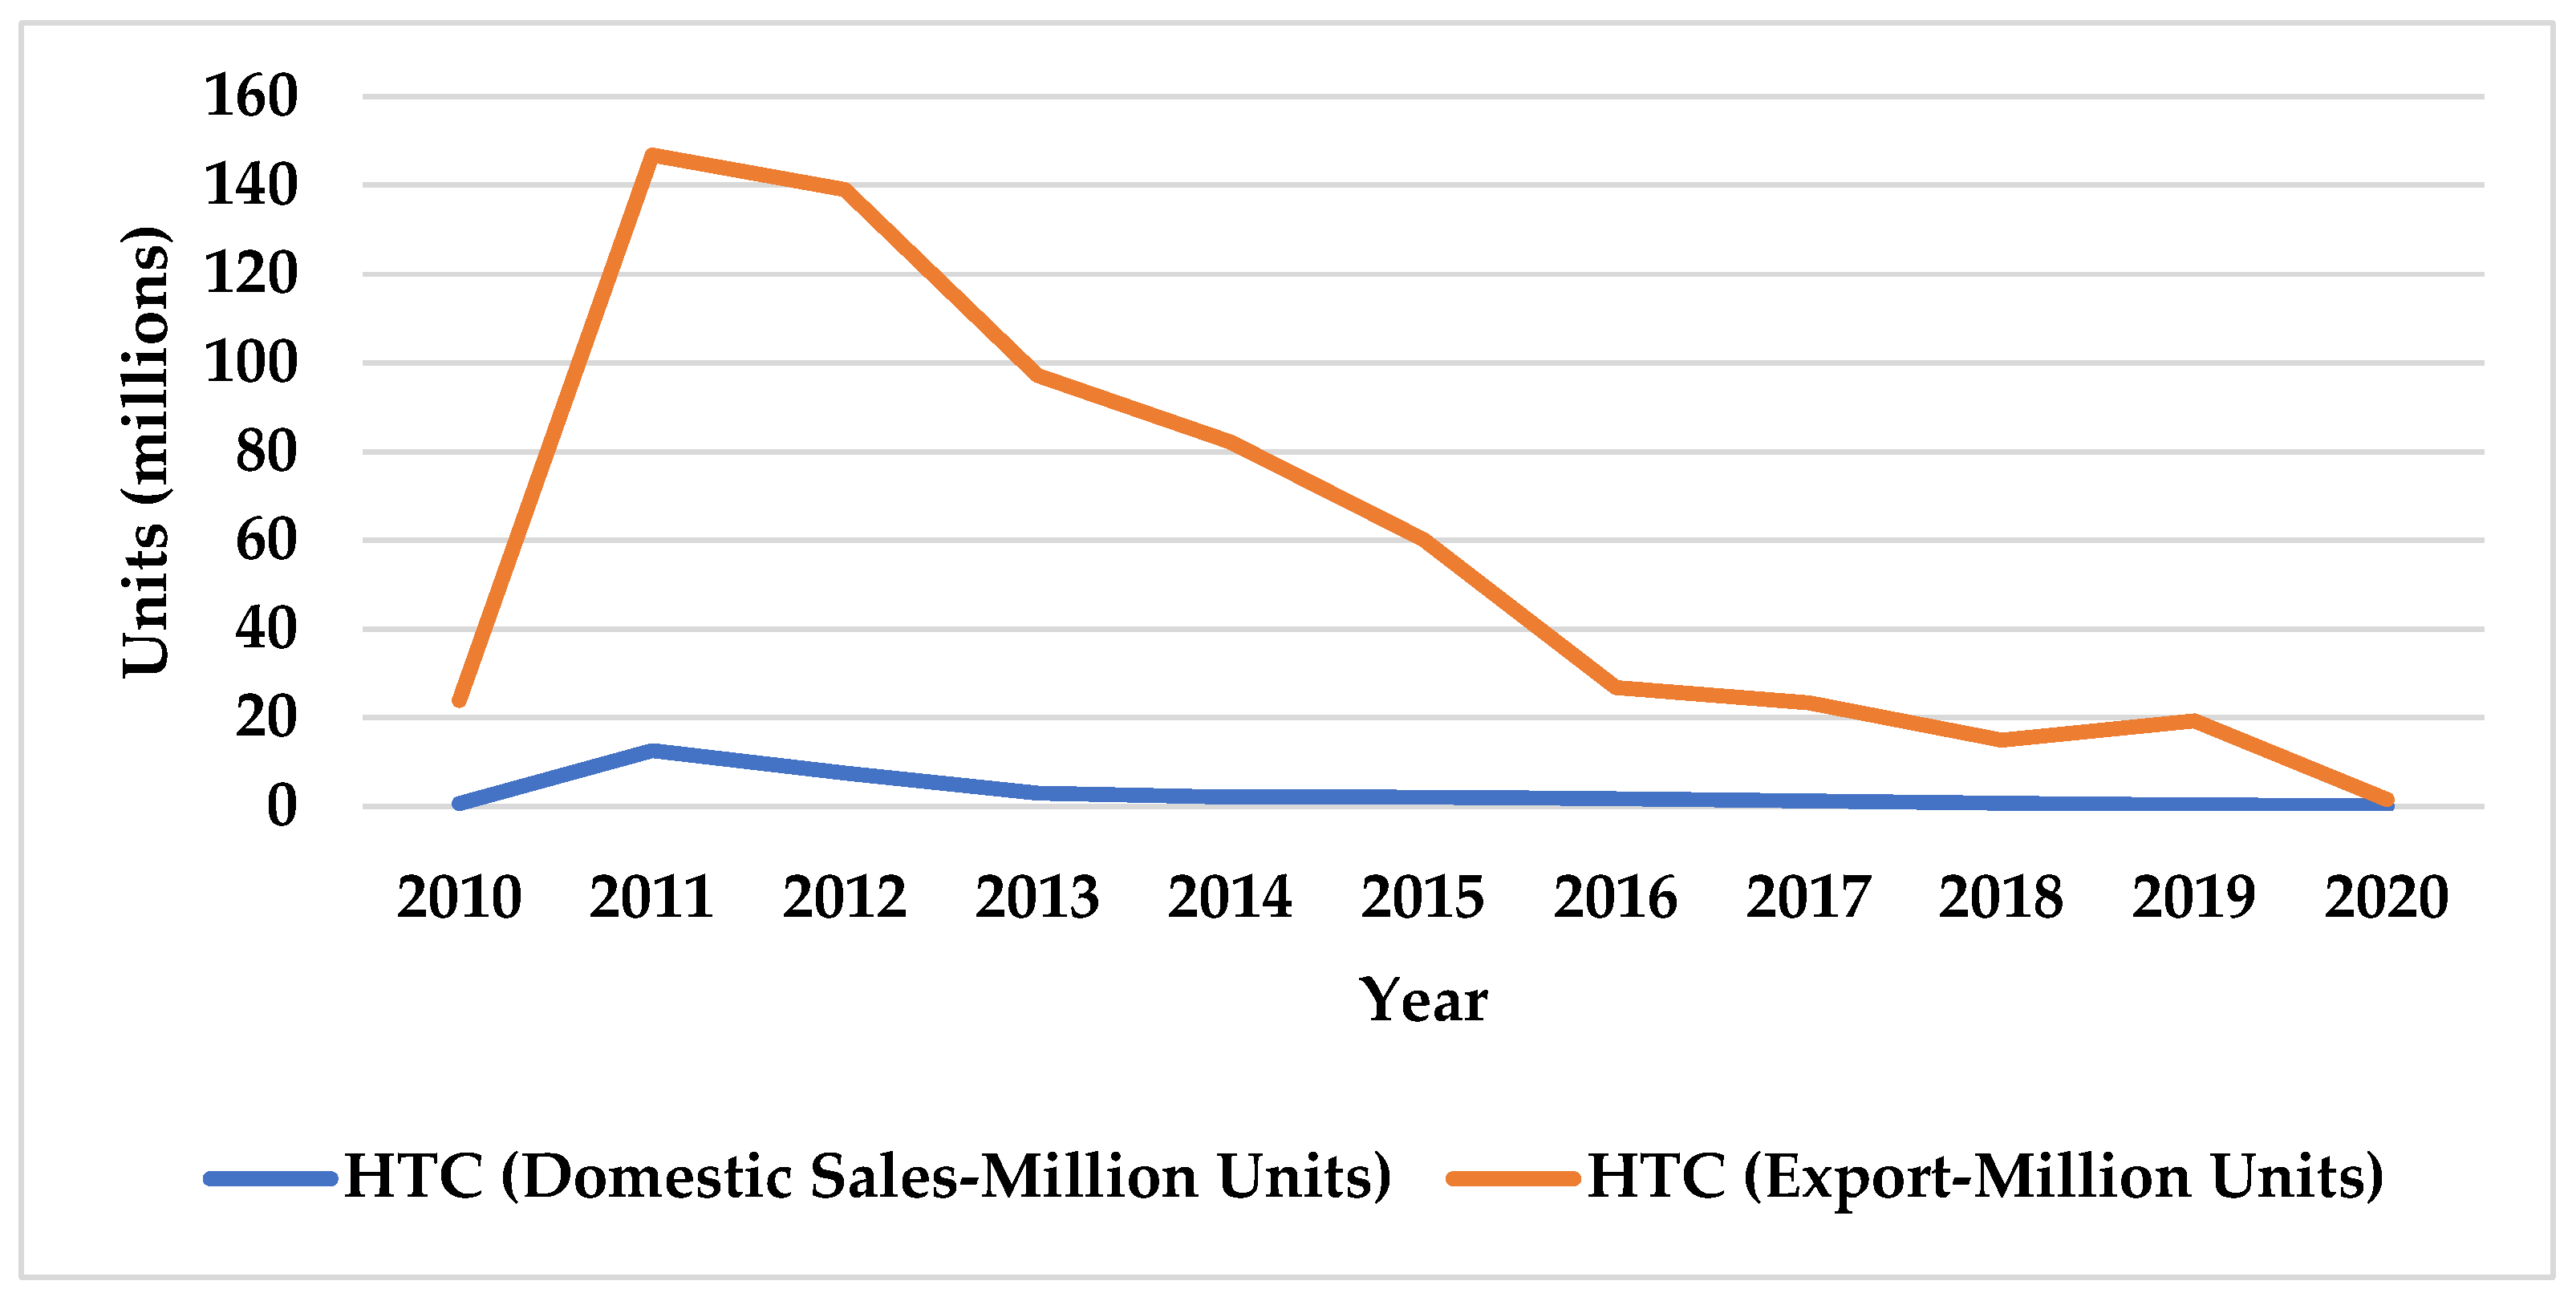
Figure 1 illustrates HTC smartphone domestic sales and exports in 2010–2020 and 
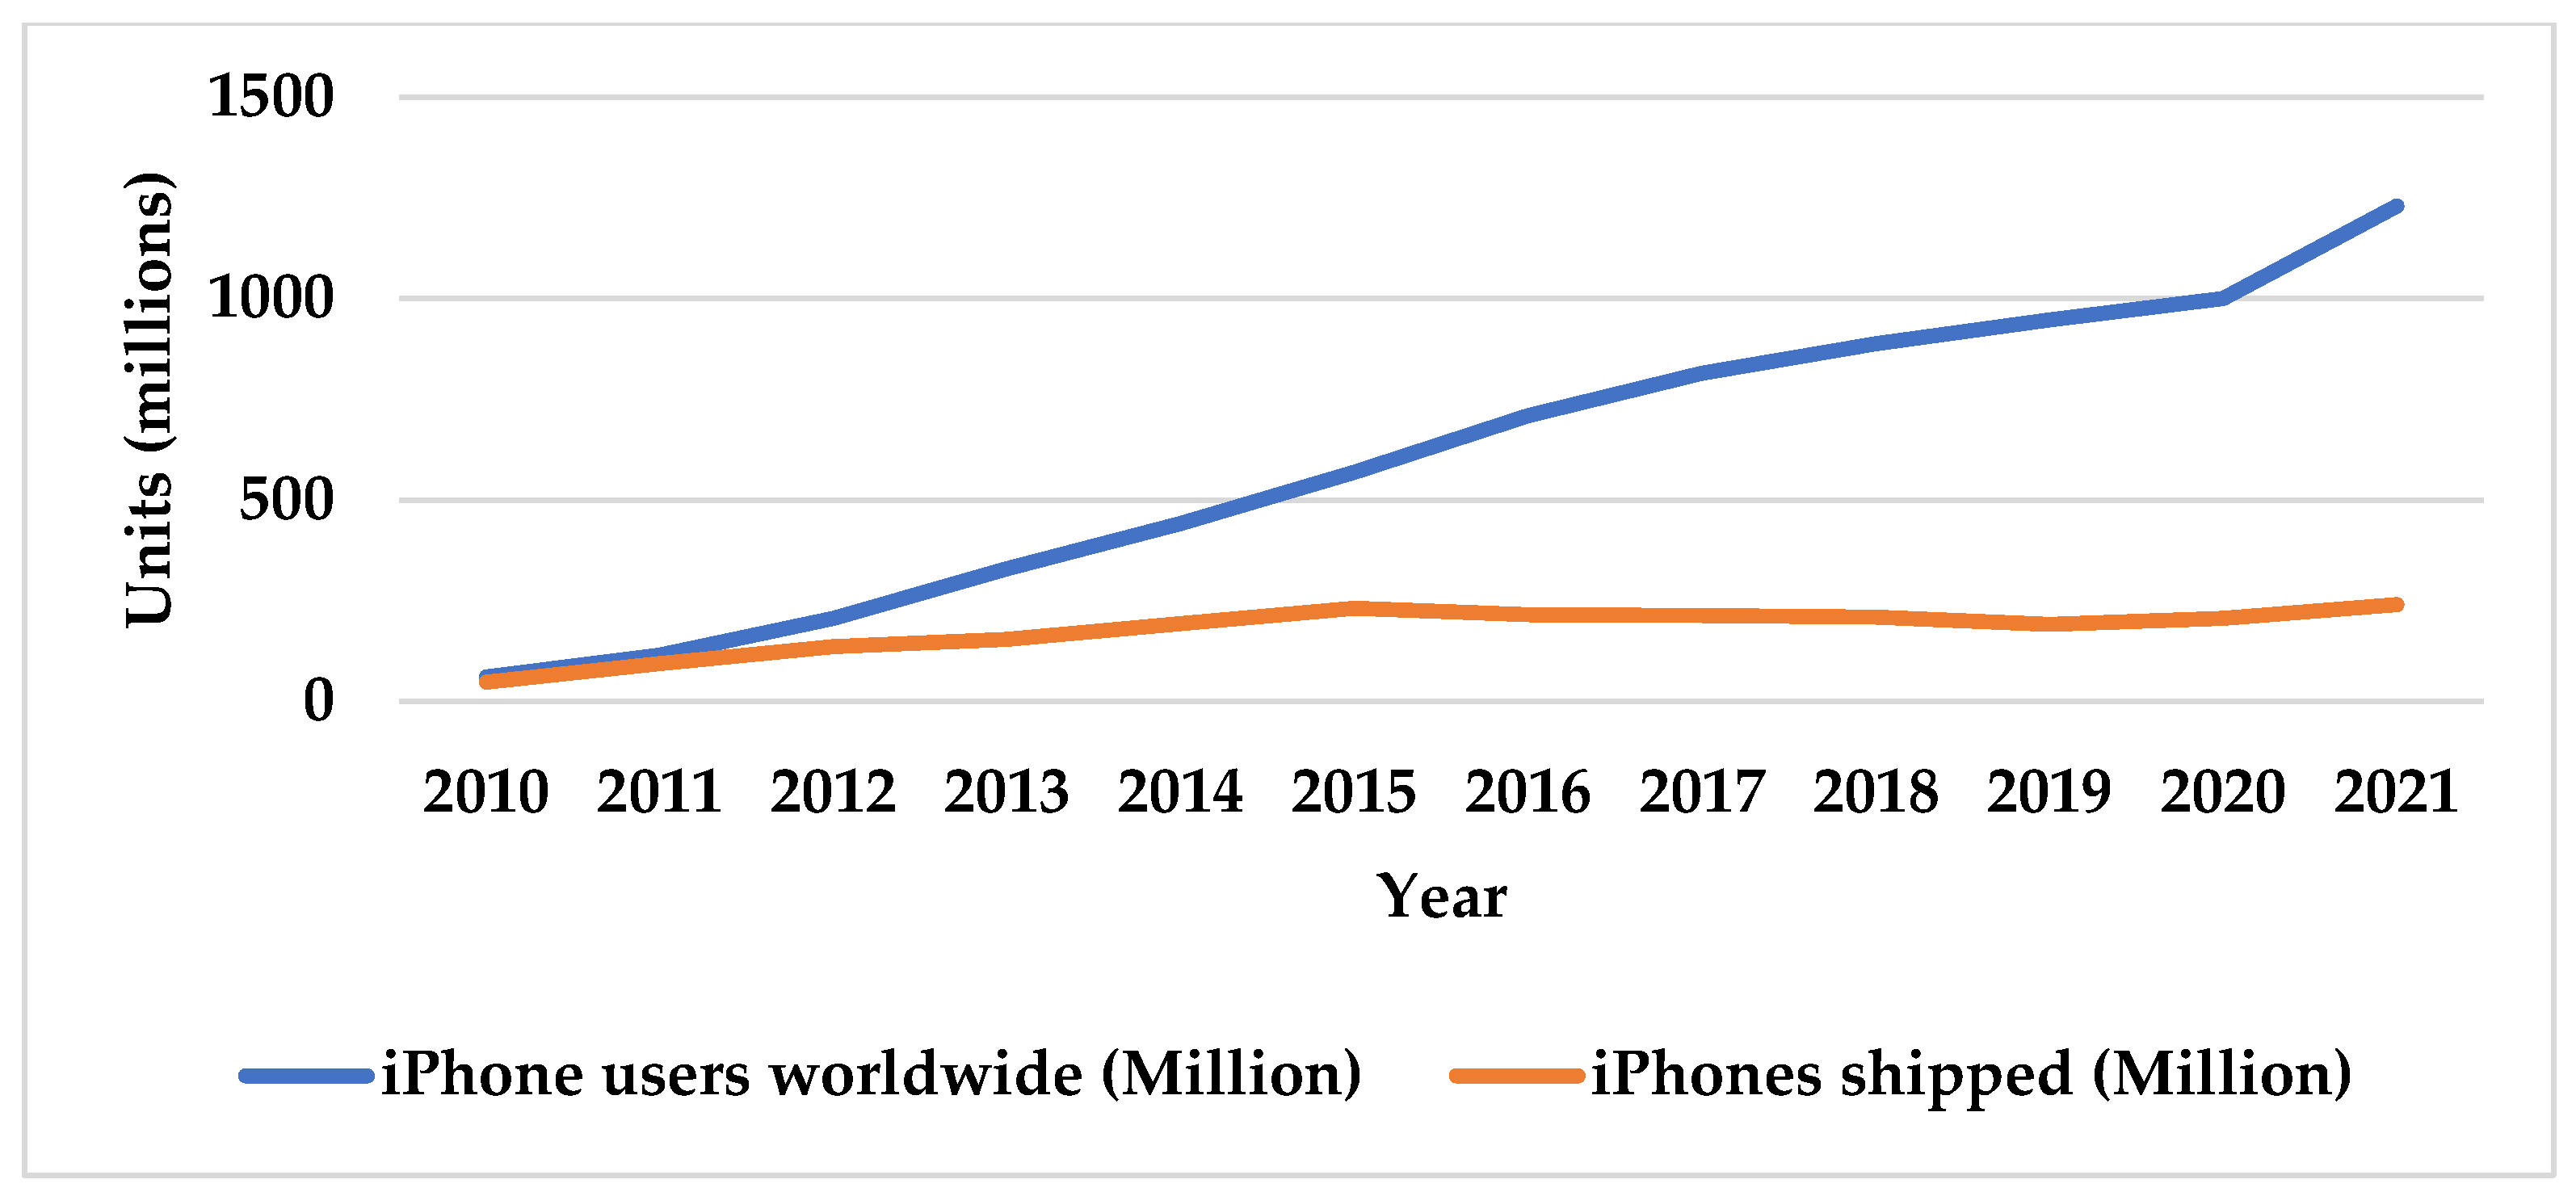
Figure 2 depicts iPhone users and iPhones shipped worldwide (2010–2021) [1].
This phenomenon became even stronger after social media, such as Facebook, Instagram, and Twitter entered the mix [2]. Almost everybody now owns a product once possessed only by a few wealthy consumers. Some consumers have more than one smartphone. Moreover, in recent years, smartphone brands developed an identity-forming aspect. As a result, some brands could charge considerably higher price premiums than other brands.
At first glance, what comes to mind is the downward trend in consumption of HTC parallel to an upward trend in consumption of iPhone. In other words, while the former brand of smartphone has been losing popularity, the latter brand of smartphone is gaining popularity. While comparing similar models from the two brands, such as HTC U23 vs. iPhone 14, one could find little advantages in the latter relative to the former, one could see a substantial difference in prices (HTC: $499, iPhone: $799). Yet, iPhone 14 has shipped over 40 million units in the first quarter of 2023 alone. While given the trends in sales so far, HTC does not seem to fare as well. This begs the question that why HTC fails to attract the costumers despite its compatible quality and considerably lower prices. Therefore, the two brands are suitable candidates for a deeper comparison of brand equity and for assessing the role of price premium in forming purchase intention.
In the body of literature, the brand’s power is usually studied via the assessment of brand equity [3,4]. Brand awareness, perceived quality, and perceived prestige values form brand equity [5]. The literature suggests a significantly strong effect of brand equity on purchase intention. However, there is still room to analyze the roots through which the said effects are formed. Given the diversity of brands in the smartphone market and the much higher price premiums, even when some brands have the same quality as others, the question that comes to mind is, “how could these two factors affect the causal relationship between brand equity and purchase intention?’. Answering this question is the main objective of the present study.
In the realm of academic research, the current body of literature reveals a notable reliance on primary data obtained through the distribution of standardized questionnaires [6,7,8,9,10,11,12,13,14,15,16,17,18,19]. These studies commonly utilized a 5-point Likert scale encompassing response options ranging from “strongly disagree” to “strongly agree”. While this method is commonly used and bears the resemblance of a quantitative method, it is not without disadvantages. The results may not be objective. Some respondents will lean toward a neutral opinion or evaluation, while others might skew towards the extremes. Moreover, this method provides discrete measures and fails to account for relative numbers and the space between each two scale. Thus, methods, such as fuzzy set theory, have been applied in the literature to overcome said shortcomings [20,21].
However, in an effort to improve the accuracy and depth of the findings, this particular study endeavors to employ a fuzzification and defuzzification process [20,21]. This process involves transforming the crisp linguistic values, obtained through the Likert scale, into continuous values. By doing so, this study aims to capture a more nuanced representation of the respondents’ perceptions and opinions.
In quantitative studies, fuzzy set theory is an approach which is applied for the purpose of increasing the study’s accuracy. It follows at least one round of fuzzification (converting crisp values into triangular fuzzy numbers) and defuzzification (converting the three triangular fuzzy numbers into one number following different approaches, such as the center of gravity approach) process which converts discrete categorial or qualitative crisp values into continuous numeric values; hence, increasing the accuracy and efficiency of the estimations [20,21].
The fuzzification process aims to transform the discrete linguistic values obtained from the Likert scale (e.g., “strongly disagree”, “disagree”, “indifferent”, “agree”, and “strongly agree”) into fuzzy sets. Fuzzy sets allow for the representation of varying degrees of membership or truth values, acknowledging the uncertainty and ambiguity inherent in linguistic terms. This enables a more nuanced and comprehensive representation of the respondents’ perceptions and opinions.
Defuzzification, on the other hand, involves the reverse process of converting fuzzy sets back into crisp numerical values. It aims to extract meaningful and interpretable information from the fuzzy representation. Defuzzification techniques consider the degrees of membership obtained from the fuzzification process and convert them into crisp values that can be further analyzed statistically or used for decision-making purposes.
By employing the fuzzification and defuzzification process, this study seeks to bridge the gap between qualitative linguistic information and quantitative analysis. This approach enhances the accuracy and depth of the findings by capturing the uncertainties and shades of meaning present in the respondents’ answers. The utilization of this methodology contributes to the ongoing efforts to improve the rigor and validity of research findings by providing a more comprehensive understanding of the phenomenon under investigation [22,23]. More specifically, this research intents to answer the following questions:
  • How does brand equity impact sustainable purchase intention, and to what extent is this relationship mediated by price premium and brand preference?
  • What is the effect of transforming initial measures from a 5-point Likert scale into continuous values using a fuzzification and defuzzification process on the analysis of the causal impact of brand equity on sustainable purchase intention, mediated by price premium and brand preference?
Research question one delves into the impact of brand equity on sustainable purchase intention, while considering the potential mediating roles of price premium and brand preference. To answer this question, the direct relationship between brand equity and sustainable purchase intention, as well as the extent to which price premium and brand preference mediate this relationship, is examined. Exploring these interconnections provides a comprehensive understanding of the factors influencing consumers’ sustainable purchase decisions.
Research question two addresses the methodology aspect of this study. Here, the aim is to investigate the effect of transforming the initial Likert scale measurements into continuous values using a fuzzification and defuzzification process. By doing so, this study explores the impact of this transformation on the analysis of the causal relationship between brand equity, sustainable purchase intention, and the mediating variables of price premium and brand preference. This question highlights the novelty of this study and emphasizes the importance of employing an innovative methodology to enhance the precision of the results.
Overall, these research questions provide a clear direction for this study. They emphasize the importance of understanding the complex relationships between brand equity, sustainable purchase intention, and the mediating variables of price premium and brand preference. Additionally, the second research question highlights the unique contribution of this study by introducing a novel methodological approach to analyze the data.
The remainder of this paper will be as follows. First, the theoretical debate is reported, which forms the study’s conceptual framework and infers the study’s hypotheses. Second, the data, the methodology and the empirical model used for the study are discussed. Third, the findings of the empirical model, including pre and post-estimation processes and the main model, are reported. Finally, the conclusions are reported, including the discussion of the findings, their practical implications, and the current study’s limitations.

2. Theoretical Debate

This section provides a theoretical discussion of this study’s variables. It begins by forming the conceptual framework based on the literature on consumer preference when choosing between perfect substitutes, highlighting how a sustainable intent to purchase is formed in a market with two perfect substitutes. Afterward, borrowing from the body of literature on marketing studies, the variables are introduced and discussed. This is done because the present study’s empirical section endeavors to improve the typical methodology in the marketing literature for analyzing the factors affecting sustainable purchase intention. Finally, the study’s hypotheses are inferred.

2.1. Conceptual Framework

The purpose of this study is to examine the factors which affect the consumer’s preferences between two brands of smartphones, namely iPhone and HTC. The two brands are the same in essence and meet the exact needs. However, the desires they appease could be quite different. Furthermore, rarely if ever, will they be used as a bundle. In other words, consumers choose one or the other as their brand of choice. Consequently, they may be treated as perfect substitutes [24,25,26,27,28]. Therefore, the utility maximization problem for them would be as follows.
M a x   U i = a . i P h o n e + b . H T C  
s . t .
I i p 1 . i P h o n e + p 2 . H T C  
where, Ui is the utility of consuming a smartphone for individual i; iPhone and HTC are the numbers of smartphone brands that consumer i consumes; Ii is individual i’s income; and p1 and p2 are each brand’s price. Finally, a and b are the intrinsic value the consumer assigns to either brand. Based on some simple algebra, the demand for iPhone can be written as a function of the consumer’s income, the iPhone’s price, the consumer’s intrinsic value for either brand and the number of other brands the consumer possesses. It will be as follows.
i P h o n e = I i p 1 b a H T C  
Given the linear structure of the utility function and the budget constraint for perfect substitutes, the argument is better depicted in a graphic manner as follows. Figure 3 provides such a depiction. It is a two-dimensional chart for Equations (1) and (2). The intersection of the black line, which is the budget constraint, and the grey line, which is the indifference curve, for the two brands for different prices of iPhone provides the respective points on Equation (3). It should be noted that since the two graphs are linear, the point of maximum utility for any given budget constraint would be either {0,HTC} or {iPhone,0}.
Consequently, the optimum solution to maximize the consumer’s utility would be a corner solution with the consumer choosing to use only one of the brands. The choice would be dependent on the equality or lack thereof between b a and p 2 p 1 which depicts the two brands’ intrinsic value relative to their nominal value. The choice set for the two brands based on the two ratios can be graphically depicted as follows. Figure 4 has three distinct regions; the indifferent line (45 degrees) where the relative utility is equal to the relative price, making the costumer indifferent between the two options; above the 45 degree line where HTC has a clear preference over iPhone; and below the 45 degree line where iPhone has the preference over HTC. If b/a (the slope of the indifference curve) is greater than p2/p1 the maximum utility point will be {0,HTC}. On the other hand, if the opposite is true, the maximum utility can be achieved at {iPhone,0}. In case of equality, the two curves will be tangent to one another and any point will give the maximum utility.

2.2. Hypotheses Development

Casalegno et al. [32] studied the antecedents of green and sustainable purchase behavior. Latip et al. [33] discovered that an individual’s attitude, perceived social pressure, and perceived autonomy all affected their intention to make a sustainable purchase. In this study, the intrinsic value of the brands based on which the consumer makes their choice is measured as brand awareness, perceived quality and perceived prestige value. Furthermore, the nominal value of each brand is measured as brand preference and price premium. Finally, the continued demand for each brand is measured as sustainable purchase intention. Based on the existing body of literature, this section discusses the relation between said factors to infer this study’s hypotheses.
According to the literature, brand awareness can be defined as the consumer’s ability to distinguish a particular brand from a bundle of similar products [34]. In other words, brand awareness evaluates how strong a brand is in the consumer’s mind [35]. Brand awareness consists of two main features; brand recall and brand recognition [36]. The former refers to the consumer’s ability to recall the brand when browsing through similar products of different brands; the latter refers to the consumer’s ability to recognize the brand’s logo. Brand awareness is the ability of the consumer. As such, it has different extents for different consumers [37,38,39]. Brand awareness significantly affects the consumer’s sustainable purchase intention [40,41].
Another factor of interest in forming sustainable purchase intention is perceived quality. It is a motivating factor [42,43] which signifies the consumer’s subjective assessment of the brand’s quality [44]. However, it is a perception and, in essence, includes the consumer’s feelings regarding the brand of interest and the consumer’s knowledge. Furthermore, perceived quality comprises a comparative aspect [45,46]. In other words, perceived quality, at least in part, is formed through the consumer’s comparison between different brands. While perceived quality significantly affects the consumer’s intent [47,48], it is a perception. Therefore, to be significantly effective, the producers need to implant the said perception into the consumer’s mind. In other words, the consumer must be convinced of the product’s quality [49,50,51].
The consumer’s perceived prestige value is the next factor of interest in this study. The Merriam-Webster dictionary defines prestige as ‘weight or credit in general opinion’. In marketing, perceived prestige is the consumer’s judgment regarding the brand [10,52,53,54]. It is formed in the consumer’s mind to compare alternative brands [54]. It is a psychological concept [55] that directly relates to the consumer’s level of satisfaction [56,57]. According to the literature on marketing studies [58], perceived prestige significantly affects consumers’ intentions [59,60]. Moreover, in the case of high-value social target audiences, prestige exhibits more substantial effects. Smartphones are among the said products, the perceived prestige of which makes them unique from the consumer’s perspective [52,53].
The two mediating factors included in this study are brand preference and price premium. In simplest terms, brand preference signifies the extent of brand loyalty. It is based on brand awareness, perceived quality, and perceived prestige value [61,62,63]. These three constructs signify something known in the literature as brand equity [3,64]. The literature considers brand preference as a concept that forms the consumer’s choice [37,61,65]. Consequently, it boosts sales [66] by lessening the brand’s complexity [65]. To form the intent to make a purchase, the consumer must choose from a bundle of different brands [67,68]. Moreover, it is a significant bridge between brand equity (brand awareness, perceived prestige value and perceived quality) and sustainable purchase intention [69,70].
The other mediating effect in the current study is the price premium. It refers to the difference between the brand’s price and its alternatives [71]. As the body of literature suggests [6,7,8,9,10,11,12,13], the brand’s strength, stated in the form of brand equity, significantly affects the price premium the consumer is willing to pay for a specific brand [48,72]. On the other hand, studies show ample evidence that the price premium is a significant factor affecting consumers’ intentions [40]. In other words, on one hand, brand awareness, perceived prestige value, and perceived quality affect the threshold of the consumer’s acceptable price premium, while on the other hand, the level of the price premium that the market dictates, affects the consumer’s intention. Therefore, price premium could mediate between brand equity and sustainable purchase intention.
Overall, given the theoretical debate discussed in this section, the following hypotheses are formed and depicted in Figure 5.
H1. 
Brand preference is a significant mediatory factor for the effect of brand awareness on sustainable purchase intention.
H2. 
Price premium is a significant mediatory factor for the effect of brand awareness on sustainable purchase intention.
H3. 
Brand preference is a significant mediatory factor for the effect of perceived quality on sustainable purchase intention.
H4. 
Price premium is a significant mediatory factor for the effect of perceived quality on sustainable purchase intention.
H5. 
Brand preference is a significant mediatory factor for the effect of perceived value on sustainable purchase intention.
H6. 
Price premium is a significant mediatory factor for the effect of perceived value on sustainable purchase intention.

3. Data and Methodology

This section covers the study’s empirical aspect. It includes data discussion, the sampling procedure, the data gathering method, the introduction of the statistical model and the variables used in the model, and the methods for ensuring a more robust and efficient outcome.

3.1. Population and Sampling

The information for this study was acquired by distributing a standardized questionnaire to the general public in Taiwan and Indonesia. The sample size was chosen based on Cochran’s formula for sample size, which consists of the share of the population, the sample’s degree of confidence, and the normal distribution’s value for the said degree of confidence. According to the latest statistics available, by June 2022, 51.89% of Taiwanese cellphone users used either iPhones (50.46%) or HTCs (1.43%). In the case of Indonesia, the percentage was 10.45%, with 9.06% for iPhone and 1.39% for HTC. These figures indicate two main points. First, despite being a Taiwanese brand, HTC does not possess a considerable market share, while iPhone almost dominates Taiwan’s cellphone market. This is the rationale behind choosing Taiwan as part of the data source for this study. Although iPhone has a considerable edge over HTC in Taiwan, it does not seem to have the same dominance in the Indonesian market. Be that as it may, Indonesia is a huge consumer of smartphone brands (world’s 4th largest smartphone market). Yet, a brand which triumphed in a country with a strong competitor (Taiwan), fails substantially in Indonesia; hence, making the two countries the two ends of a spectrum when analyzing the brands under study. Second, given these stats and based on Cochran’s formula, the minimum sample size for Taiwan and Indonesia with a 95% degree of confidence would be 384 and 144, respectively. The study covers 404 participants in Taiwan and 434 in Indonesia, ensuring an acceptable minimum sample size.

3.2. The Questionnaire

The data for this study were gathered through the distribution of a standardized questionnaire. It covered the participants’ demographics, including their age, gender, level of education, employment status, and income level. It also asked them about the reasons behind their choice of the smartphone brand in the form of several questions. The questions are on a 5-point Likert scale covering the participants’ opinions regarding brand awareness, perceived quality, perceived prestige value, price premium, brand preferences, and sustainable purchase intention. Table 1 reports the questions and the references for each construct’s questions.
Table 2 reports the demographics of the participants. In Taiwan, 404 participants and in Indonesia, 434 participants were questioned. While 50% of each group was questioned with a focus on Apple, the other 50% were questioned with a focus on HTC. Furthermore, the samples in Taiwan and Indonesia consisted of 2 women for every man. Additionally, the majority of the sample consisted of 25-year-olds or younger people. As for the level of education, around 80% of participants in both countries possessed a university degree. Around 60% of participants in Taiwan and Indonesia were students. Finally, the data suggest that most of the participants in Taiwan belonged to the second income bracket, while in Indonesia, the income was distributed more evenly.

3.3. Empirical Model

This section covers the technical discussions of the empirical model used for this study.

3.3.1. Fuzzification and Defuzzification Process

As stated in the introduction, previous studies have applied a 5-point Likert scale questionnaire to gather the data. They then entered the crisp linguistic values from the questionnaire into a Structural Equation Model to test their hypotheses. Zadeh [86] was the first to criticize this method and raise severe reservations regarding the data’s accuracy and the results’ efficacy. Consequently, a new way of improving the data’s accuracy was born, i.e., fuzzification. In short, fuzzification converts a crisp quantity into a fuzzy quantity [87,88]. In the case of this study, the crisp quantities are the five common linguistic values in a 5-point Likert scale (totally disagree, disagree, indifferent, agree, and totally agree), and the fuzzy values are triangular fuzzy numbers [89,90]. The three values in each triangular fuzzy number are then transformed into a single integer through defuzzification [91]. This multi-level transformation process significantly improves the data’s accuracy and the estimations’ efficacy [92].
The data gathered via the questionnaire provided crisp and discrete values for each construct. The data were put through a fuzzification process to increase the results’ efficiency and accuracy. It was first introduced into the literature in 1965 by Zadeh. Since then, the concept and the process have evolved and are still evolving considerably. In this study, following the work of Chen and Hsieh [20], the 5-point Likert scale went through several fuzzification and defuzzification processes. Figure 6 depicts the said process.
The first step in the fuzzy procedure was to assign triangular fuzzy numbers to each crisp value. The respective TFNs (s, t, and u) for each linguistic and crisp value are reported in Table 3. The defuzzification process then transformed the triangular fuzzy numbers through two phases. First, each triangular fuzzy number was transformed into a center of gravity. This step was done based on the work of Chen and Hsieh [20] via the application of the following equation.
C o G i = s i + 4 t i + u i 6
where, s, t, and u are the lower, middle and upper values that construct the triangular fuzzy numbers for each crisp value, respectively. Afterward, said CoGs provided the means and standard deviations that were put into a normal membership function for each value. The membership function in this study was the normal distribution function which provided random stochastic numbers for each entry. The final values were extracted from the following equation [93], and each process’s relative measures are reported in Table 3.
f x i = 1 σ i 2 π e 1 2 x i μ i σ i  

3.3.2. Constructs, Factors and Variables

After the fuzzification and defuzzification process was conducted, the descriptive statistics for each construct were estimated. Overall, the average value for brand awareness was 0.6049 with a standard deviation of 0.3643. As for perceived quality, these figures were 0.6001 and 0.3186, respectively. Furthermore, considering perceived prestige value, the average was 0.5759 and the Std. Dev. was 0.3669. The price premium averaged at 0.46 with a Std. Dev. of 0.3229. The average for brand preference was 0.4359, and the Std. Dev. was 0.3290. Finally, the average and Std. Dev. for purchase intention were 0.4693 and 0.3567, respectively. The information presented in Table 4 includes the mean as well as the standard deviation for every single construct.

4. Empirical Results and Discussion

This section reports the results of the estimations of this study’s empirical model, including the pre and post-estimation tests required to ensure the results’ efficiency and accuracy.

4.1. Pre and Post-Estimation Tests

This section covers the findings of the empirical model. Given the use of factor analysis as the primary empirical model, first, via the application of the KMO’s measures and Bartlett’s test of sphericity, the suitability of the data for conducting a factor analysis was tested. Table 5 reports the said statistics plus the values for composite reliability (CR) and average variance extracted (AVE). The data are divided into two; one according to country (Taiwan, Indonesia), and one according to cellphone brand (HTC, iPhone). Based on the measures reported in Table 5, the data show acceptable values for CR and AVE for each group. Although several estimated AVEs are lower than the threshold (0.5) based on the work of Fornell and Larcker [94], the factors are still acceptable since the CR is above the acceptable threshold (0.6).
Furthermore, the reliability of the data gathered via the standardized questionnaire was tested by estimating Cronbach’s alpha for each factor and the total alpha. The results are reported in Table 6.
With values above 60%, the estimated alphas indicate adequate reliability. Afterward, the goodness of fit for the estimated CFA and SEM measures were tested. This has been done by assessing several estimates, including Chi-squared, GFI, CFI, TLI and RMSEA. Table 7 and Table 8 report the said estimates.

4.2. The Main Model and Test of Hypotheses

These measures indicate an adequate model. Therefore, the models’ final estimations were conducted to test the study’s main hypotheses. Table 9 reports the measures for testing the study’s hypotheses. According to the results, no significant mediation effect was found for the effect of brand awareness on sustainable purchase intention in Taiwan. Furthermore, while price premium showed a significant mediatory effect for the impact of perceived prestige value on sustainable purchase intention for iPhone, no significant mediatory effect was observed for HTC. Moreover, no significant effect was observed for brand preference as a mediator for the effect of perceived prestige value on sustainable purchase intention. In the case of Indonesia, other than the mediatory effect of price premium for perceived prestige value’s impact on purchase intention, the other estimates are statistically significant. Since the EFA results suggested inadequate factor loadings for perceived prestige value in the case of iPhone in Indonesia, the respective estimates for this factor are absent in Table 9. Overall, the mediatory effects were statistically insignificant for the mediatory effect of price premium between brand awareness and sustainable purchase intention and the mediatory effect of price premium and brand preference between perceived prestige value and sustainable purchase intention for the case of iPhone. In other cases, the mediatory effects were statistically significant for both mediatory factors (PP, and BP) between the three explanatory factors (BA, PQ, and PV) and the dependent factor (PI). The threshold for statistical significance was 90% and above.

5. Discussion, Implications, Conclusions and Limitations

5.1. Discussion

The primary purpose of this research is to examine the role that brand preference and price premium play in mediating the connection between brand equity and long-term intent to buy. This study is noteworthy for its innovative approach, which entails converting the original measures from a 5-point Likert scale to continuous values. A novel dimension is introduced to the analysis by employing fuzzification and defuzzification, allowing for a more thorough and accurate representation of the data. More specifically, this study intends to answer the following questions: (1). How does brand equity impact sustainable purchase intention, and to what extent is this relationship mediated by price premium and brand preference? and (2). What is the effect of transforming initial measures from a 5-point Likert scale into continuous values using a fuzzification and defuzzification process on the analysis of the causal impact of brand equity on sustainable purchase intention, mediated by price premium and brand preference?
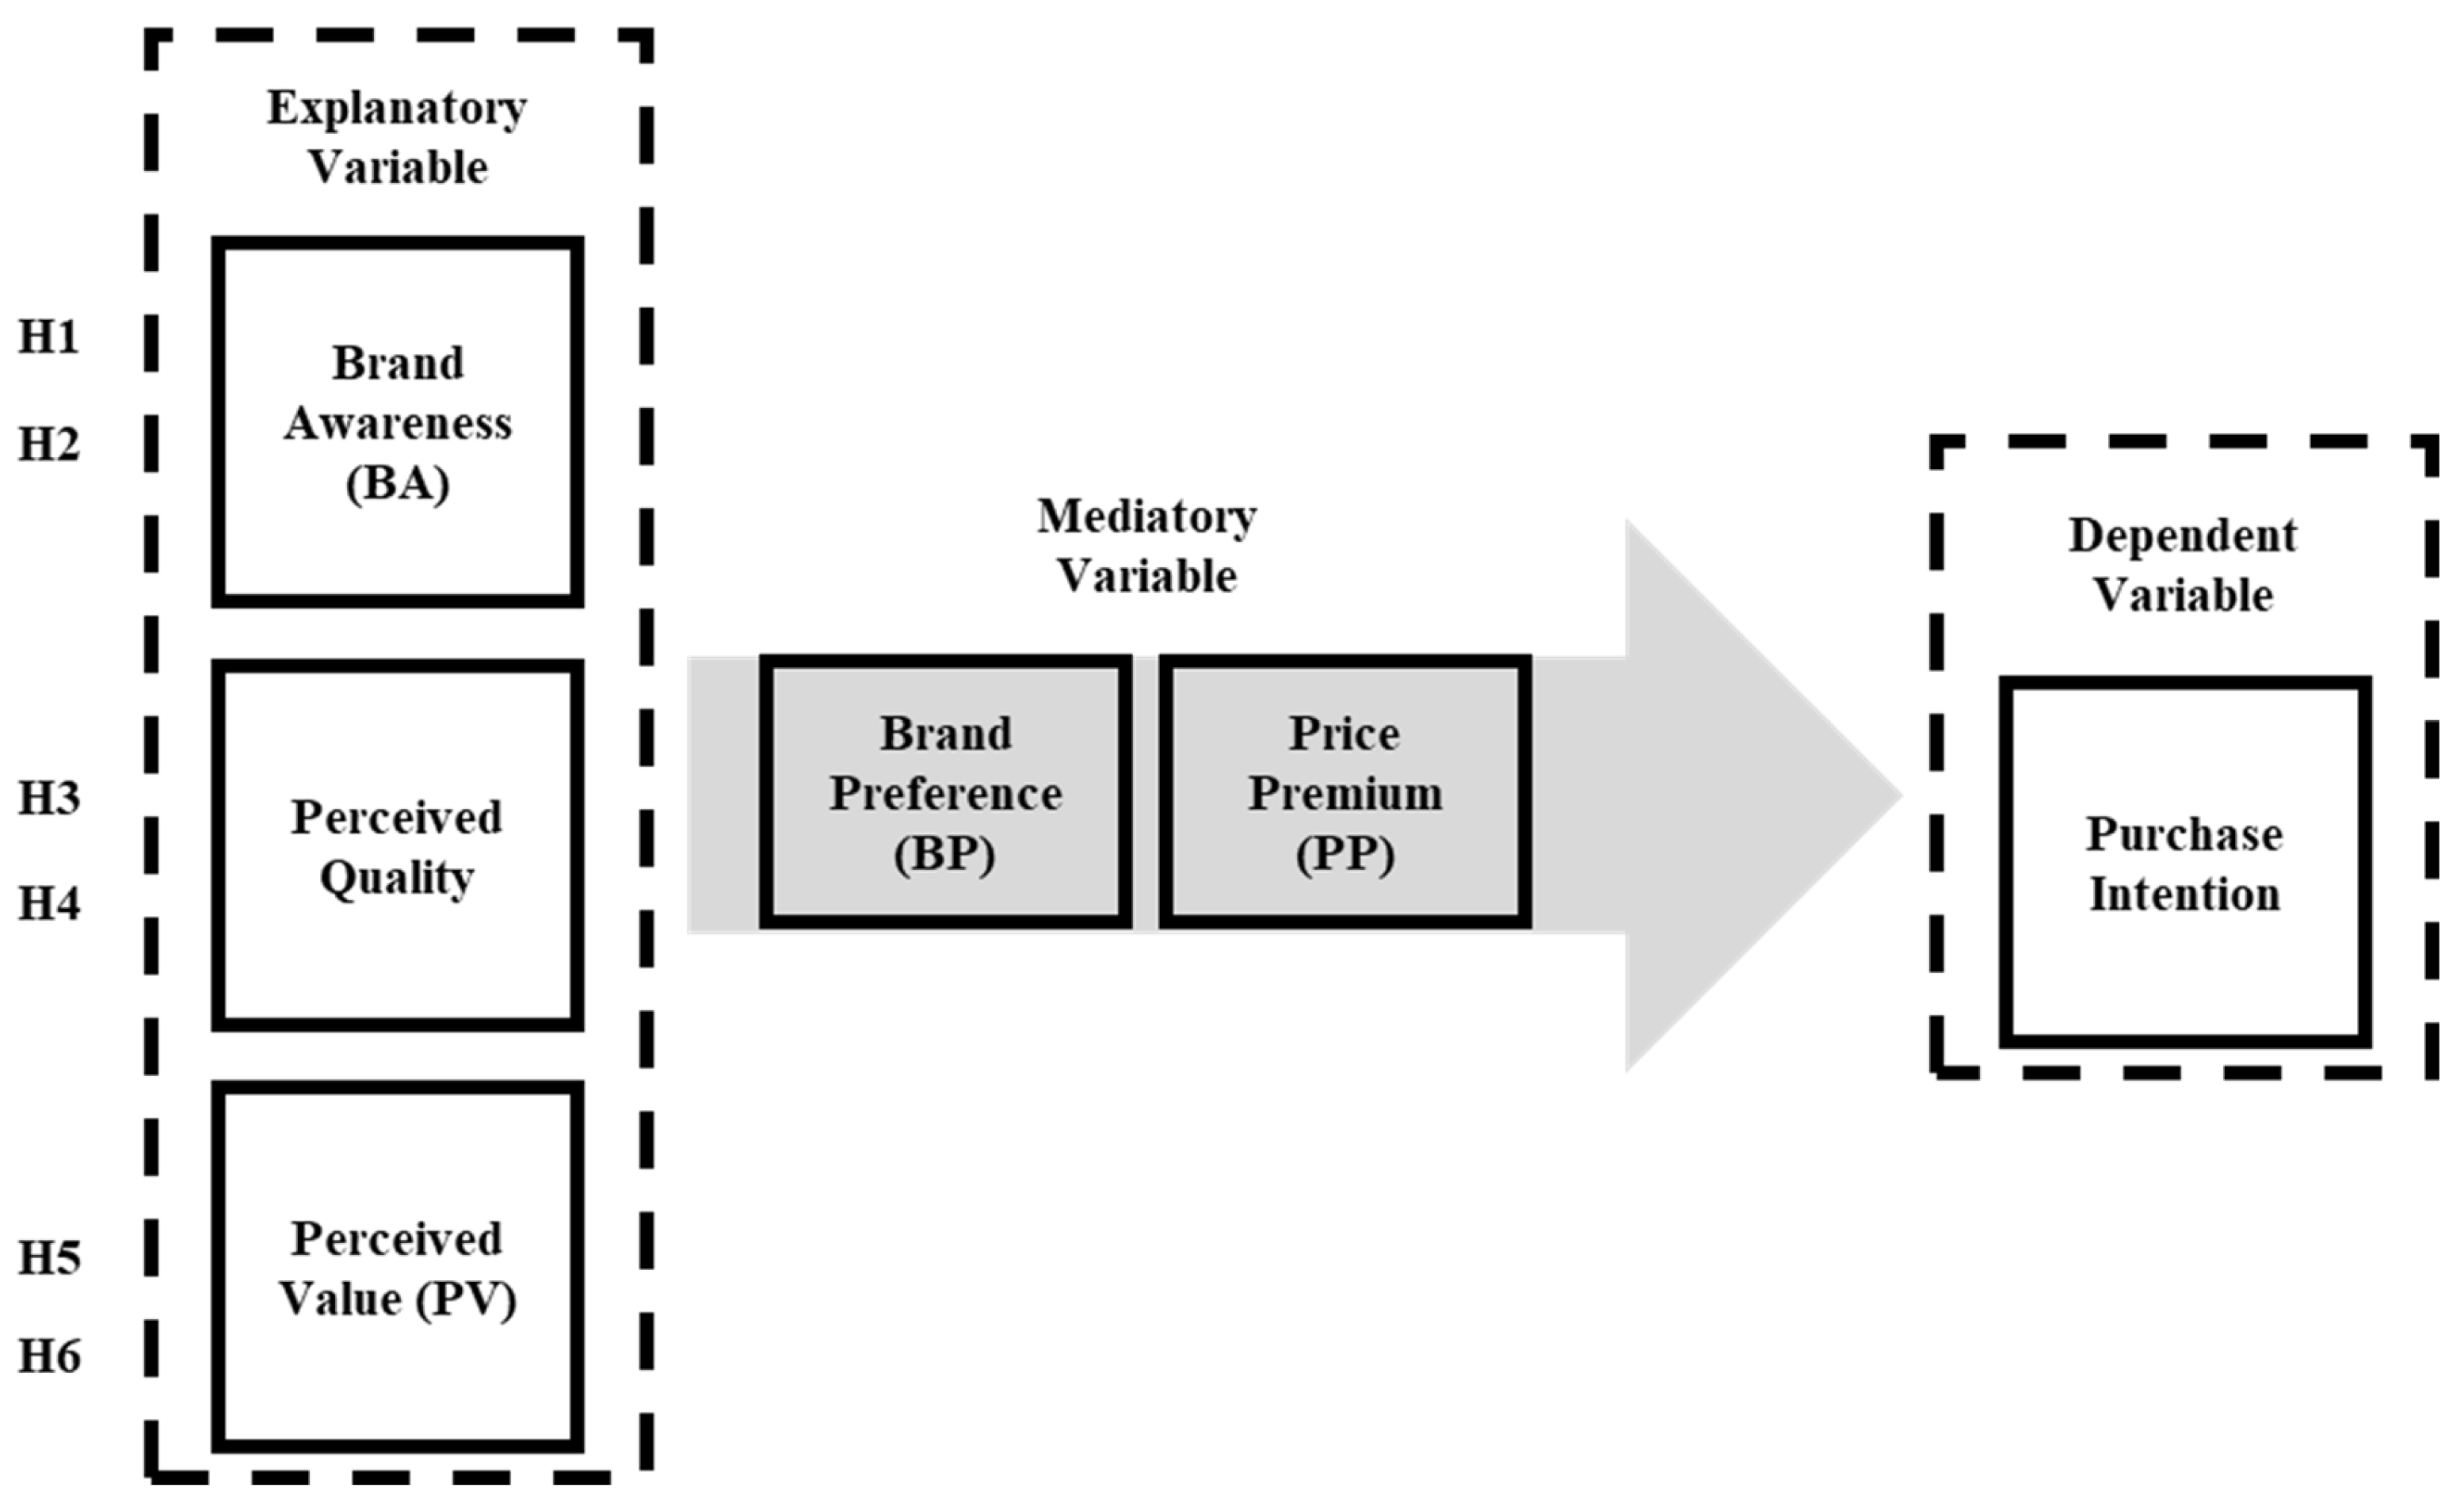
The findings of this study shed light on the relationships between brand awareness (BA), perceived quality (PQ), perceived prestige value (PV), price premium (PP), brand preference (BP), and purchase intention in the context of smartphones [95,96,97]. The results indicate interesting variations across different countries and brands, revealing valuable insights into consumer behavior.
Starting with brand awareness, the study found no significant mediation effect in Taiwan for the relationship between brand awareness and purchase intention. This suggests that in Taiwan, other factors may have a more direct influence on consumers’ purchase decisions, and brand awareness alone may not be a strong predictor of purchase intention [98]. However, it is important to note that these findings may be specific to the context of Taiwan and may differ in other regions.
Moving on to perceived quality, the study found that in Taiwan, price premium exhibited higher mediation effects compared to brand preference. This suggests that consumers in Taiwan may be more influenced by the price they are willing to pay for a smartphone, rather than their brand preferences, when considering perceived quality and purchase intention. Interestingly, when analyzing specific brands, HTC showed a considerably stronger mediation effect than iPhone in Taiwan, indicating that the relationship between perceived quality, price premium, and purchase intention varies across different smartphone brands.
In Indonesia, the overall mediation effect of brand preference was stronger than that of price premium for the relationship between perceived quality and purchase intention. This suggests that in the Indonesian market, consumers’ brand preferences play a more significant role in influencing their purchase decisions based on perceived quality. However, when examining individual brands, the mediation effect of price premium was found to be higher for HTC, while the opposite was observed for iPhone. These findings highlight the brand-specific nature of consumer behavior and the varying impact of price premium and brand preference on purchase intention.
Regarding perceived prestige value, the study revealed that in Taiwan, the mediation effect of price premium was the only significant effect observed. This implies that in Taiwan, consumers may be more swayed by the monetary aspect, such as the perceived value associated with a higher price, rather than the prestige value alone when making smartphone purchase decisions. Conversely, in Indonesia, the only significant mediation effect was found for brand preference, indicating that consumers in this market may be more influenced by the brand’s image and reputation when considering perceived prestige value and purchase intention.
Overall, the results suggest that the physical aspect (perceived quality) and the monetary aspect (price premium) of smartphones hold stronger influence on purchase intention compared to perceived prestige value. This implies that consumers prioritize their needs over their desires when it comes to smartphone purchases.

5.2. Implications

5.2.1. Theoretical Implications

The present study has two lines of theoretical implication. One falls into the category of marketing ontology. The other falls into the category of statistical methodology. Overall, the results suggested a more substantial mediation effect for price premiums than brand preferences. This suggests a considerably high elasticity of substitution between the brands under study, which has been examined extensively in the body of literature [99]. It also aligns with the theory of relative consumption in economics [100] and the decoy effect in marketing [101]. According to the findings, consumers rarely make their choices without comparing the chosen brand with its competitors. As for methodological implications, the study’s findings do show a substantially high degree of estimation efficiency and accuracy which is evident in the p-values and Cronbach’s alphas. It becomes more evident when comparing the findings with that of previous studies of the same subject which did not go through the fuzzification process [102,103]. The following paragraphs detail theoretical implications of this study:
  • Advancing the understanding of brand equity: This study contributes to the theoretical understanding of brand equity by examining its causal impact on sustainable purchase intention. By investigating the mediation effects of price premium and brand preference, this study provides insights into the underlying mechanisms through which brand equity influences consumers’ sustainable purchase decisions. This expands the knowledge of how brand equity operates in the context of sustainability and also extends the existing theoretical frameworks.
  • Uncovering the role of price premium and brand preference as mediators: This study highlights the importance of considering price premium and brand preference as mediating factors between brand equity and sustainable purchase intention. By investigating their mediating effects, this study reveals the specific pathways through which brand equity influences consumers’ intentions to engage in sustainable purchasing practices. These findings contribute to the theoretical discussions on the interplay between brand equity, consumer preferences, and the willingness to pay a premium for sustainable products.
  • Understanding the hierarchy of factors influencing purchase intention: This study provides insights into the relative importance of different factors in shaping consumers’ purchase intentions in the context of smartphones. The findings suggest that perceived quality and price premium exert stronger mediation effects compared to perceived prestige value. This hierarchical understanding of factors influencing purchase intention adds depth to the existing theoretical models and underscores the significance of considering both functional and monetary aspects in consumer decision-making processes.
  • Methodological implications: This study introduces a novel methodological approach by transforming the Likert scale measurements into continuous values through fuzzification and defuzzification. This methodological innovation offers potential implications for future research, demonstrating how this transformation can enhance the precision and accuracy of data analysis. Thus, this study opens avenues for further exploration of alternative measurement techniques that allow for a more nuanced understanding of consumer behavior and perception.
  • Extending sustainable consumption theories: This study contributes to the field of sustainable consumption by examining the role of brand equity in influencing consumers’ sustainable purchase intention. By uncovering the specific mediating effects of price premium and brand preference, this study enriches theoretical frameworks related to sustainable consumption. The findings highlight the importance of brand-related factors in shaping sustainable purchase decisions and provide theoretical insights into consumer behavior in the context of sustainability.
Overall, the theoretical implications of this study lie in advancing the understanding of brand equity, uncovering the mediation effects of price premium and brand preference, understanding the hierarchy of factors influencing purchase intention, highlighting methodological innovations, and extending theories related to sustainable consumption. These implications contribute to the existing knowledge base and provide a foundation for future research in the areas of branding, consumer behavior, and sustainable consumption.

5.2.2. Practical Implications

This study’s results are most useful for marketing managers. Mainly, they could benefit those who focus on advertisement content. Given the results, this study suggests that ads would benefit more if they focused on the product’s quality and the needs it can best meet rather than on its desirability and the positive feeling it might induce. Furthermore, the findings support the argument that consumers are conscious of the product’s financial aspect. Therefore, the producers need to be able to justify the prime cost they demand their product. There is a vast spectrum of prices for different brands of smartphones that meet the exact needs. This study’s findings indicate that this high level of difference requires considerable justification. Practical implications of this study are multifaceted. Following are some of the practical implications of this study:
  • Product development and innovation: This study highlights the importance of integrating sustainability attributes into product development and innovation processes. Managers should prioritize the development of sustainable products that align with consumers’ preferences which will promote their sustainable purchase intentions. By incorporating eco-friendly materials, energy efficiency, or other sustainability features, companies can differentiate their products and attract sustainability-conscious consumers.
  • Marketing and communication strategies: The findings of this study indicate the significance of effectively communicating the sustainability benefits of products to the consumers. Managers should develop marketing and communication strategies that highlight the environmental and social impacts of their products. This includes utilizing various channels, such as social media, eco-labeling, and advertising campaigns, to convey the sustainable attributes of their products, thereby influencing consumers’ sustainable purchase intentions.
  • Partnerships and collaborations: Managers should consider forming partnerships and collaborations with suppliers, NGOs, or other organizations with expertise in sustainability. By collaborating with external entities, companies can gain insights, access resources, and leverage their credibility in the sustainability domain. These partnerships can enhance the company’s sustainability efforts and positively influence consumers’ perceptions and purchase intentions.
  • Pricing and value proposition: This study’s findings emphasize the role of price premium as a mediator between brand equity and sustainable purchase intention. Managers should carefully consider pricing strategies and ensure that the perceived value of sustainable products justifies any premium pricing. Companies can enhance consumers’ willingness to pay the premium by highlighting the superior quality, durability, or other unique attributes associated with their sustainable products.
  • Consumer education and awareness: Given the relatively weaker mediation effects of perceived prestige value compared to other factors, managers should focus on educating and raising consumer awareness regarding the importance of sustainability. By providing information about the environmental and social benefits of sustainable products, companies can help consumers make more informed choices and increase their sustainable purchase intentions.
  • Employee engagement and training: Managers should prioritize employee engagement and training on sustainability-related topics. By fostering a sustainability-oriented culture within the organization, employees can become advocates for sustainable practices and products. Companies should provide training programs that educate employees about sustainability principles and their role in promoting sustainable offerings to customers.
  • Continuous improvement and measurement: To ensure the effectiveness of sustainability initiatives and their impact on consumers’ purchase intentions, managers should establish mechanisms for continuous improvement and measurement. This involves regularly monitoring key performance indicators related to sustainable product sales, consumer feedback, and market trends. By analyzing data and feedback, companies can identify areas for improvement, make informed decisions, and adapt their strategies accordingly.
In summary, the practical implications derived from this study suggest that managers should focus on product development and innovation, develop effective marketing and communication strategies, form partnerships and collaborations, carefully consider pricing and value proposition, prioritize consumer education and awareness, engage and train employees, and establish mechanisms for continuous improvement and measurement. By implementing these practical strategies, companies can effectively promote sustainable products, influence consumers’ purchase intentions, and contribute to a more sustainable future.

5.2.3. Managerial Implications

Managerial implications of this study are as follows:
  • Developing brand equity strategies: The findings of this study highlight the importance of brand equity in influencing consumers’ sustainable purchase intentions. Managers can leverage this insight by investing in brand-building activities that enhance brand awareness, perceived quality, and perceived prestige value. By strengthening brand equity, companies can increase their appeal to sustainability-conscious consumers and drive sustainable purchase intentions.
  • Pricing strategies: This study reveals the mediating role of price premium in the relationship between brand equity and sustainable purchase intention. Managers can strategically employ pricing strategies that align with consumers’ perceptions of quality and sustainability. By justifying a premium price through a strong brand equity and emphasizing the sustainable attributes of their products, companies can enhance consumers’ willingness to pay the premium and drive sustainable purchase intentions.
  • Brand preference cultivation: This study emphasizes the significance of brand preference as a mediator between brand equity and sustainable purchase intention. Managers should focus on building strong brand–customer relationships and fostering positive brand associations. By creating meaningful connections with consumers and cultivating brand loyalty, companies can enhance brand preference, thereby positively influencing consumers’ sustainable purchase intentions.
  • Market segmentation: This study’s findings on the variations in mediation effects across different countries and brands indicate the importance of market segmentation. Managers should consider country-specific and brand-specific factors when developing marketing strategies. By understanding the unique preferences and the behaviors of target markets, companies can tailor their messaging, pricing, and product offerings to effectively influence sustainable purchase intentions.
  • Communicating sustainability benefits: This study underscores the significance of communicating the sustainability benefits of products to consumers. Managers should highlight the environmental and social advantages of their products in their marketing communications. By effectively conveying the positive impact of their products on sustainability, companies can enhance brand equity and influence consumers’ sustainable purchase intentions.
  • Collaboration with sustainability initiatives: Given the importance of sustainability in shaping consumers’ purchase intentions, managers should consider collaborating with relevant sustainability initiatives or organizations. By partnering with recognized sustainability programs, companies can further enhance their brand equity and credibility in the sustainability domain. Such collaborations can positively influence consumers’ perceptions and increase their inclination to engage in sustainable purchasing.
  • Continuous monitoring and adaptation: Consumer preferences and behaviors regarding sustainability are continually evolving. Managers should stay attuned to market trends, conduct regular consumer research, and adapt their strategies accordingly. By continuously monitoring consumer perceptions, preferences, and purchase intentions, companies can make informed decisions and ensure that their strategies remain aligned with changing consumer demands.
In summary, the managerial implications derived from this study suggest that managers should focus on building strong brand equity, strategically pricing their products, cultivating brand preference, segmenting their markets, communicating sustainability benefits, collaborating with sustainability initiatives, and continuously monitoring and adapting their strategies. By incorporating these insights into their decision-making processes, managers can effectively influence consumers’ sustainable purchase intentions and drive business success in the context of sustainability.

5.3. Conclusions

The main factors of interest in this study were brand awareness (BA), perceived quality (PQ), and perceived prestige value (PV). Furthermore, the mediators in this study were price premium (PP) and brand preference (BP). As the results indicate, no significant mediation effect was observed in the case of Taiwan for the effect of brand awareness on sustainable purchase intention. Furthermore, in the case of Indonesia, the overall mediation effect of brand preference was more substantial than that of the price premium. However, when divided by brand, more substantial mediation effects for price premium and brand preference were observed for iPhone.
Considering the effect of perceived quality on purchase intention, in the case of Taiwan, price premium exhibited higher mediation effects. The mediation effect was considerably stronger (nearly twice) for HTC than iPhone. In the case of Indonesia, the overall effect of brand preference as a mediator between perceived quality and purchase intention was higher than the mediatory effect of the price premium. However, the mediatory effect of price premium was higher for HTC. For iPhone in Indonesia, the opposite was observed.
As for the effect of perceived prestige value (PV), the mediation effect for price premium was the only significant effect in Taiwan. In the case of Indonesia, the only significant mediation effect was observed for brand preference. Furthermore, the effect was strongest for perceived quality, followed by brand awareness and it was the weakest for perceived prestige value. In other words, the results suggest that while the prestige value of smartphones was a significant factor, the physical (quality) and the monetary (price premium) aspects of the smartphones were the most vital factors when it came to forming the intent to purchase a smartphone. The results support the argument that the needs for which one purchases a smartphone are more important than the desires a smartphone meet.
In conclusion, this study contributes to the existing literature by highlighting the varying mediation effects of price premium and brand preference on the relationships between brand awareness, perceived quality, perceived prestige value, and purchase intention in the smartphone industry. The findings emphasize the significance of considering country-specific and brand-specific factors in understanding consumer behavior, thereby offering valuable implications for marketing practices and strategies in the ever-evolving smartphone market.

5.4. Limitations and Suggestions for Further Studies

This study was an endeavor to examine the mediation effect of price premium and brand preference on the causal effect of brand awareness, perceived quality, and perceived prestige value on smartphone purchase intention in Taiwan and Indonesia. The brands under study were iPhone and HTC. It is important to acknowledge the limitations of this study, such as the focus on specific countries and brands. Further research could explore additional factors and investigate other contexts to gain a more comprehensive understanding of consumer behavior in the smartphone market. Nonetheless, these findings provide valuable insights for smartphone manufacturers and marketers seeking to develop effective strategies to influence consumers’ purchase decisions.
Several aspects beg the need for future studies. First, other smartphone brands could enhance the findings of future studies. Second, this study was conducted via a standardized questionnaire that evaluated the participants’ perceptions. The findings could be complemented with a study on the actual smartphone market developments. Finally, this study was conducted at a single point in time. In future studies, a follow-up method would enhance the findings by including a time dimension. On methodological ends, the present study based its fuzzification process on a traditional approach (TFNs and CoG) and then built its innovation (Random Normal Values). However, as the fuzzy set theory has evolved extensively since its introduction in 1965, more novel approaches to fuzzification, such as spherical fuzzy sets [103], could enhance the findings of future studies.

Author Contributions

Conceptualization, M.M. and V.A.; Methodology, S.E.P.F.; Software, S.E.P.F.; Writing–original draft, S.E.P.F.; Writing–review & editing, B.B.G.; Supervision, M.M. and B.B.G. All authors have read and agreed to the published version of the manuscript.

Funding

This research received no external funding.

Institutional Review Board Statement

Not applicable. This study did not involving humans or animals.

Informed Consent Statement

Not applicable.

Data Availability Statement

The data is available upon request through the corresponding author.

Conflicts of Interest

The data is available upon request through the corresponding author.

References

  1. Statistica. 2023. Available online: https://www.statista.com/statistics/208911/htc-smartphone-sales-since-2007/ (accessed on 10 May 2023).
  2. Shetu, S.N. An Empirical Investigation on University Students’ Smartphone Dependency: The Role of Social Needs, Social Values, and Social Influences. Int. J. Cyber Behav. Psychol. Learn. 2021, 11, 1–14. [Google Scholar] [CrossRef]
  3. Rojas-Lamorena, Á.J.; Del Barrio-García, S.; Alcántara-Pilar, J.M. A review of three decades of academic research on brand equity: A bibliometric approach using co-word analysis and bibliographic coupling. J. Bus. Res. 2022, 139, 1067–1083. [Google Scholar] [CrossRef]
  4. Hossain, T.M. The Impact of Brand Loyalty and Perceived Quality on Brand Equity: A Study on Selected Brands of Smartphone Handsets. 2021. Available online: http://dspace.uiu.ac.bd/handle/52243/2227 (accessed on 18 May 2023).
  5. Lassar, W.; Mittal, B.; Sharma, A. Measuring customer-based brand equity. J. Consum. Mark. 1995, 12, 11–19. [Google Scholar] [CrossRef]
  6. Yoo, B.; Donthu, N.; Lee, S. An examination of selected marketing mix elements and brand equity. J. Acad. Mark. Sci. 2000, 28, 195–211. [Google Scholar] [CrossRef]
  7. Pappu, R.; Quester, P.G.; Cooksey, R.W. Consumer-based brand equity: Improving the measurement–empirical evidence. J. Prod. Brand Manag. 2005, 14, 143–154. [Google Scholar] [CrossRef]
  8. Pappu, R.; Quester, P.G.; Cooksey, R.W. Consumer-based brand equity and country-of-origin relationships: Some empirical evidence. Eur. J. Mark. 2006, 40, 696–717. [Google Scholar] [CrossRef]
  9. Han, C.M.; Terpstra, V. Country-of-origin effects for uni-national and bi-national products. J. Int. Bus. Stud. 1988, 19, 235–255. [Google Scholar] [CrossRef]
  10. Steenkamp, J.B.; Batra, R.; Alden, D.L. How perceived brand globalness creates brand value. J. Int. Bus. Stud. 2003, 34, 53–65. [Google Scholar] [CrossRef]
  11. Netemeyer, R.G.; Krishnan, B.; Pullig, C.; Wang, G.; Yagci, M.; Dean, D.; Wirth, F. Developing and validating measures of facets of customer-based brand equity. J. Bus. Res. 2004, 57, 209–224. [Google Scholar] [CrossRef]
  12. Sirgy, M.J.; Grewal, D.; Mangleburg, T.F.; Park, J.O.; Chon, K.S.; Claiborne, C.B.; Berkman, H. Assessing the predictive validity of two methods of measuring self-image congruence. J. Acad. Mark. Sci. 1997, 25, 229–241. [Google Scholar] [CrossRef]
  13. Erdem, T.; Swait, J.; Valenzuela, A. Brands as signals: A cross-country validation study. J. Mark. 2006, 70, 34–49. [Google Scholar] [CrossRef]
  14. Vikaliana, R.; Panjaitan, R.; Adam, E.; Fasa, M.I.; Roslan, A.H. Brand loyalty in the smartphone user’s: The role of brand credibility and consumer convenience. Stud. Appl. Econ. 2021, 39. [Google Scholar] [CrossRef]
  15. Gupta, S.; Gallear, D.; Rudd, J.; Foroudi, P. The impact of brand value on brand competitiveness. J. Bus. Res. 2020, 112, 210–222. [Google Scholar] [CrossRef]
  16. Chen, C.; Gu, T.; Cai, Y.; Yang, Y. Impact of supply chain information sharing on performance of fashion enterprises: An empirical study using SEM. J. Enterp. Inf. Manag. 2019, 32, 913–935. [Google Scholar] [CrossRef]
  17. Chen, Y.S.; Chang, T.W.; Li, H.X.; Chen, Y.R. The influence of green brand affect on green purchase intentions: The mediation effects of green brand associations and green brand attitude. Int. J. Environ. Res. Public Health 2020, 17, 4089. [Google Scholar] [CrossRef]
  18. Tangtatswas, R.; Sornsaruht, P.; Pimdee, P. Structural Equation Model of Variables that Influence Thai Fast Food Restaurant Brand Loyalty. Turk. J. Comput. Math. Educ. 2021, 12, 5817–5825. [Google Scholar]
  19. Jadhav, D.S.; Upadhyay, N.; Bhatt, V. Applying the Customer Based Brand Equity Model in examining Brand Loyalty of Consumers towards Johnson & Johnson Baby Care Products: A PLS-SEM Approach. ADBU J. Eng. Technol. 2021, 10, 0100200332. [Google Scholar]
  20. Chen, S.H.; Hsieh, C.H. Representation, ranking, distance, and similarity of LR type fuzzy number and application. Aust. J. Intell. Process. Syst. 2000, 6, 217–229. [Google Scholar]
  21. Demidenko, E. Advanced Statistics with Applications in R.; John Wiley & Sons: Hoboken, NJ, USA, 2019; Volume 392. [Google Scholar]
  22. Chakraverty, S.; Sahoo, D.M.; Mahato, N.R.; Chakraverty, S.; Sahoo, D.M.; Mahato, N.R. Defuzzification. In Concepts of Soft Computing: Fuzzy and ANN with Programming; Springer: Berlin/Heidelberg, Germany, 2019; pp. 117–127. [Google Scholar]
  23. Khang, T.D.; Vuong, N.D.; Tran, M.K.; Fowler, M. Fuzzy C-means clustering algorithm with multiple fuzzification coefficients. Algorithms 2020, 13, 158. [Google Scholar] [CrossRef]
  24. Jehle, G.A.; Reny, P.J. Advanced Microeconomic Theory, 3rd ed.; Pearson Education Limited: Essex, UK, 2011. [Google Scholar]
  25. Tang, H. Peer-to-peer lenders versus banks: Substitutes or complements? Rev. Financ. Stud. 2019, 32, 1900–1938. [Google Scholar] [CrossRef]
  26. Indahingwati, A.; Launtu, A.; Tamsah, H.; Firman, A.; Putra, A.H.P.K.; Aswari, A. How Digital Technology Driven Millenial Consumer Behaviour in Indonesia. J. Distrib. Sci. 2019, 17, 25–34. [Google Scholar] [CrossRef]
  27. Hjertstrand, P. Homogeneity, Returns to Scale and (Log) Concavity. 2020. Available online: https://www.econstor.eu/bitstream/10419/240471/1/wp1328.pdf (accessed on 10 May 2023).
  28. Massidda, C.; Piras, R.; Seetaram, N. A microeconomics analysis of the per diem expenditure of British travellers. Ann. Tour. Res. 2020, 82, 102877. [Google Scholar] [CrossRef]
  29. Varian, H.R. Intermediate Microeconomics: A Modern Approach: Ninth International Student Edition; WW Norton & Company: New York, NY, USA, 2014. [Google Scholar]
  30. Saxena, S.; Pinjari, A.R.; Bhat, C.R. Multiple discrete-continuous choice models with additively separable utility functions and linear utility on outside good: Model properties and characterization of demand functions. Transp. Res. Part B Methodol. 2022, 155, 526–557. [Google Scholar] [CrossRef]
  31. Patejdl, R. Equilibrium of the Duopoly with Linear Utility Function of The Demand. Ekon. Rozhl’ady/Ecomomic Rev. 2021, 50, 40–59. [Google Scholar]
  32. Casalegno, C.; Candelo, E.; Santoro, G. Exploring the antecedents of green and sustainable purchase behaviour: A comparison among different generations. Psychol. Mark. 2022, 39, 1007–1021. [Google Scholar] [CrossRef]
  33. Latip, M.S.A.; Newaz, F.T.; Latip, S.N.N.A.; May, R.Y.Y.; Rahman, A.E.A. The sustainable purchase intention in a new normal of COVID-19: An empirical study in Malaysia. J. Asian Financ. Econ. Bus. 2021, 8, 951–959. [Google Scholar]
  34. Aaker, D.A. The value of brand equity. J. Bus. Strategy 1992, 13, 27–32. [Google Scholar] [CrossRef]
  35. Hutter, K.; Hautz, J.; Dennhardt, S.; Füller, J. The impact of user interactions in social media on brand awareness and purchase intention: The case of MINI on Facebook. J. Prod. Brand Manag. 2013, 22, 342–351. [Google Scholar] [CrossRef] [Green Version]
  36. Chi, H.K.; Yeh, H.R.; Yang, Y.T. The impact of brand awareness on consumer purchase intention: The mediating effect of perceived quality and brand loyalty. J. Int. Manag. Stud. 2009, 4, 135–144. [Google Scholar]
  37. Hoeffler, S.; Keller, K.L. The marketing advantages of strong brands. J. Brand Manag. 2003, 10, 421–445. [Google Scholar] [CrossRef]
  38. Romaniuk, J.; Wight, S.; Faulkner, M. Brand awareness: Revisiting an old metric for a new world. J. Prod. Brand Manag. 2017, 26, 469–476. [Google Scholar] [CrossRef]
  39. Ahn, J.; Park, J.K.; Hyun, H. Luxury product to service brand extension and brand equity transfer. J. Retail. Consum. Serv. 2018, 42, 22–28. [Google Scholar] [CrossRef]
  40. Abou-Shouk, M.; Soliman, M. The impact of gamification adoption intention on brand awareness and loyalty in tourism: The mediating effect of customer engagement. J. Destin. Mark. Manag. 2021, 20, 100559. [Google Scholar] [CrossRef]
  41. Kim, S.S.; Choe, J.Y.J.; Petrick, J.F. The effect of celebrity on brand awareness, perceived quality, brand image, brand loyalty, and destination attachment to a literary festival. J. Destin. Mark. Manag. 2018, 9, 320–329. [Google Scholar] [CrossRef]
  42. Cronin Jr, J.J.; Brady, M.K.; Hult, G.T.M. Assessing the effects of quality, value, and customer satisfaction on consumer behavioral intentions in service environments. J. Retail. 2000, 76, 193–218. [Google Scholar] [CrossRef]
  43. Konuk, F.A. The role of store image, perceived quality, trust and perceived value in predicting consumers’ purchase intentions towards organic private label food. J. Retail. Consum. Serv. 2018, 43, 304–310. [Google Scholar] [CrossRef]
  44. Ramaseshan, B.; Tsao, H.Y. Moderating effects of the brand concept on the relationship between brand personality and perceived quality. J. Brand Manag. 2007, 14, 458–466. [Google Scholar] [CrossRef]
  45. Zeithaml, V.A. Consumer perceptions of price, quality, and value: A means-end model and synthesis of evidence. J. Mark. 1988, 52, 2–22. [Google Scholar] [CrossRef]
  46. Yang, Z.; Sun, S.; Lalwani, A.K.; Janakiraman, N. How does consumers’ local or global identity influence price–perceived quality associations? The role of perceived quality variance. J. Mark. 2019, 83, 145–162. [Google Scholar] [CrossRef] [Green Version]
  47. Aakko, M.; Niinimäki, K. Quality matters: Reviewing the connections between perceived quality and clothing use time. J. Fash. Mark. Manag. Int. J. 2021, 26, 107–125. [Google Scholar] [CrossRef]
  48. Kurokawa, S.; Matsubayashi, N. Price and quality competition with quality positions. J. Econ. Manag. Strategy 2018, 27, 71–81. [Google Scholar] [CrossRef]
  49. Konuk, F.A. The moderating impact of taste award on the interplay between perceived taste, perceived quality and brand trust. J. Retail. Consum. Serv. 2021, 63, 102698. [Google Scholar] [CrossRef]
  50. Zheng, D.; Chen, Y.; Zhang, Z.; Che, H. Retail price discount depth and perceived quality uncertainty. J. Retailing 2021, 98, 542–557. [Google Scholar] [CrossRef]
  51. Koch, C.; Hartmann, M. The Impact of a Company Website and Its Perceived Quality on the Buying Intention in B2B-Settings. In Advances in Digital Marketing and eCommerce; Springer: Cham, Switzerland, 2022; pp. 9–18. [Google Scholar]
  52. Monga, A.B.; John, D.R. What makes brands elastic? The influence of brand concept and styles of thinking on brand extension evaluation. J. Mark. 2010, 74, 80–92. [Google Scholar] [CrossRef]
  53. O’Shaughnessy, J.; O’Shaughnessy, N.J. Marketing, the consumer society and hedonism. Eur. J. Mark. 2002, 36, 524–547. [Google Scholar] [CrossRef] [Green Version]
  54. Truong, Y.; McColl, R.; Kitchen, P.J. New luxury brand positioning and the emergence of masstige brands. J. Brand Manag. 2009, 16, 375–382. [Google Scholar] [CrossRef]
  55. Li, G.; Li, G.; Kambele, Z. Luxury fashion brand consumers in China: Perceived value, fashion lifestyle, and willingness to pay. J. Bus. Res. 2012, 65, 1516–1522. [Google Scholar] [CrossRef]
  56. El-Adly, M.I. Modelling the relationship between hotel perceived value, customer satisfaction, and customer loyalty. J. Retail. Consum. Serv. 2019, 50, 322–332. [Google Scholar] [CrossRef]
  57. Wang, J.; Wallendorf, M. Materialism, status signaling, and product satisfaction. J. Acad. Mark. Sci. 2006, 34, 494–505. [Google Scholar] [CrossRef]
  58. Hwang, Y.; Ko, E.; Megehee, C.M. When higher prices increase sales: How chronic and manipulated desires for conspicuousness and rarity moderate price’s impact on choice of luxury brands. J. Bus. Res. 2014, 67, 1912–1920. [Google Scholar] [CrossRef]
  59. Sung, Y.; Choi, S.M.; Ahn, H.; Song, Y.A. Dimensions of luxury brand personality: Scale development and validation. Psychol. Mark. 2015, 32, 121–132. [Google Scholar] [CrossRef]
  60. Baek, T.H.; Kim, J.; Yu, J.H. The differential roles of brand credibility and brand prestige in consumer brand choice. Psychol. Mark. 2010, 27, 662–678. [Google Scholar] [CrossRef] [Green Version]
  61. Chang, H.H.; Liu, Y.M. The impact of brand equity on brand preference and purchase intentions in the service industries. Serv. Ind. J. 2009, 29, 1687–1706. [Google Scholar] [CrossRef]
  62. Wang, E.S.T. Impact of multiple perceived value on consumers’ brand preference and purchase intention: A case of snack foods. J. Food Prod. Mark. 2010, 16, 386–397. [Google Scholar] [CrossRef]
  63. Milberg, S.J.; Sinn, F. Vulnerability of global brands to negative feedback effects. J. Bus. Res. 2008, 61, 684–690. [Google Scholar] [CrossRef]
  64. Keller, K.L.; Brexendorf, T.O. Measuring brand equity. In Handbuch Markenführung; Springer: Berlin/Heidelberg, Germany, 2019; pp. 1409–1439. [Google Scholar]
  65. Ebrahim, R.; Ghoneim, A.; Irani, Z.; Fan, Y. A brand preference and repurchase intention model: The role of consumer experience. J. Mark. Manag. 2016, 32, 1230–1259. [Google Scholar] [CrossRef] [Green Version]
  66. Rundle-Thiele, S.; Mackay, M.M. Assessing the performance of brand loyalty measures. J. Serv. Mark. 2001, 15, 529–546. [Google Scholar] [CrossRef]
  67. Roberts, J.H.; Lattin, J.M. Development and testing of a model of consideration set composition. J. Mark. Res. 1991, 28, 429–440. [Google Scholar] [CrossRef]
  68. Mathur, A.; Moschis, G.P.; Lee, E. Life events and brand preference changes. J. Consum. Behav. Int. Res. Rev. 2003, 3, 129–141. [Google Scholar] [CrossRef]
  69. Halkias, G.; Davvetas, V.; Diamantopoulos, A. The interplay between country stereotypes and perceived brand globalness/localness as drivers of brand preference. J. Bus. Res. 2016, 69, 3621–3628. [Google Scholar] [CrossRef]
  70. Aaker, D.A. Managing brand equity: Capitalizing on the value of a brand name: David A. Aaker 1994, The Free Press, New York. J. Bus. Res. 1991, 29, 247–248. [Google Scholar]
  71. Rahmanisah, H.; Fadli, J.A. The Effect Of Celebrity Endorsement Credibility On Purchase Intention In Premium Price Food. J. Terap. Manaj. Dan Bisnis 2022, 8, 12–28. [Google Scholar]
  72. Khaleeli, M.; Oswal, N.; Sleem, H. The moderating effect of price consciousness on the relationship between green products purchase intention and customers’ purchase behavior: Does environmental knowledge matters? Manag. Sci. Lett. 2021, 11, 1651–1658. [Google Scholar] [CrossRef]
  73. Jeon, H.M.; Yoo, S.R. The relationship between brand experience and consumer-based brand equity in grocerants. Serv. Bus. 2021, 15, 369–389. [Google Scholar] [CrossRef]
  74. Moise, M.S.; Gil-Saura, I.; Šerić, M.; Ruiz Molina, M.E. Influence of environmental practices on brand equity, satisfaction and word of mouth. J. Brand Manag. 2019, 26, 646–657. [Google Scholar] [CrossRef]
  75. Joseph, J.; Sivakumaran, B.; Mathew, S. Does loyalty matter? Impact of brand loyalty and sales promotion on brand equity. J. Promot. Manag. 2020, 26, 524–543. [Google Scholar] [CrossRef]
  76. Nguyen Viet, B.; Nguyen Anh, T. The role of selected marketing mix elements in consumer based brand equity creation: Milk industry in Vietnam. J. Food Prod. Mark. 2021, 27, 72–88. [Google Scholar] [CrossRef]
  77. Kim, S.; Ham, S.; Moon, H.; Chua, B.L.; Han, H. Experience, brand prestige, perceived value (functional, hedonic, social, and financial), and loyalty among GROCERANT customers. Int. J. Hosp. Manag. 2019, 77, 169–177. [Google Scholar] [CrossRef]
  78. Šapić, S.; Furtula, S.; Durkalić, D. Prestige and national identity as predictors of food products purchase. Eкoнoмикa Пoљoпpивpeдe 2018, 65, 643–657. [Google Scholar] [CrossRef] [Green Version]
  79. Dwivedi, A.; Nayeem, T.; Murshed, F. Brand experience and consumers’ willingness-to-pay (WTP) a price premium: Mediating role of brand credibility and perceived uniqueness. J. Retail. Consum. Serv. 2018, 44, 100–107. [Google Scholar] [CrossRef]
  80. Singh, G.; Pandey, N. The determinants of green packaging that influence buyers’ willingness to pay a price premium. Australas. Mark. J. 2018, 26, 221–230. [Google Scholar] [CrossRef]
  81. Liu, C.R.; Kuo, T.M.; Wang, Y.C.; Shen, Y.J.; Chen, S.P.; Hong, J.W. Perceived luxurious values and pay a price premium for Michelin-starred restaurants: A sequential mediation model with self-expansion and customer gratitude. Int. J. Hosp. Manag. 2022, 103, 103185. [Google Scholar] [CrossRef]
  82. Rahman, M.A.; Haque, M.S. Customer-perceived value on Samsung and Apple smartphone: A comparative study on Japanese and Bangladesh university students. J. Int. Bus. Manag. 2021, 4, 1–20. [Google Scholar]
  83. Kim, J.; Lee, H.; Lee, J. Smartphone preferences and brand loyalty: A discrete choice model reflecting the reference point and peer effect. J. Retail. Consum. Serv. 2020, 52, 101907. [Google Scholar] [CrossRef]
  84. Wijayaa, O.; Sulistiyanib, S.; Pudjowatic, J.; Kurniasih, N.; Purwanto, A. The role of social media marketing, entertainment, customization, trendiness, interaction and word-of-mouth on purchase intention: An empirical study from Indonesian smartphone consumers. Int. J. Data Netw. Sci. 2021, 5, 231–238. [Google Scholar] [CrossRef]
  85. Mustafi, M.A.A.; Hosain, M.S. The role of online advertising on purchase intention of smartphones: Mediating effects of flow experience and advertising value. J. Contemp. Mark. Sci. 2020, 3, 385–410. [Google Scholar] [CrossRef]
  86. Zadeh, L.A. Fuzzy sets. Inf. Control 1965, 8, 338–353. [Google Scholar] [CrossRef] [Green Version]
  87. Chakraborty, A.; Mondal, S.P.; Alam, S.; Ahmadian, A.; Senu, N.; De, D.; Salahshour, S. The pentagonal fuzzy number: Its different representations, properties, ranking, defuzzification and application in game problems. Symmetry 2019, 11, 248. [Google Scholar] [CrossRef] [Green Version]
  88. Deveci, M.; Pamucar, D.; Gokasar, I.; Köppen, M.; Gupta, B.B. Personal mobility in metaverse with autonomous vehicles using Q-rung orthopair fuzzy sets based OPA-RAFSI model. IEEE Trans. Intell. Transp. Syst. 2022, 1–10. [Google Scholar] [CrossRef]
  89. Dong, J.; Wan, S.; Chen, S.M. Fuzzy best-worst method based on triangular fuzzy numbers for multi-criteria decision-making. Inf. Sci. 2021, 547, 1080–1104. [Google Scholar] [CrossRef]
  90. Seresht, N.G.; Fayek, A.R. Computational method for fuzzy arithmetic operations on triangular fuzzy numbers by extension principle. Int. J. Approx. Reason. 2019, 106, 172–193. [Google Scholar] [CrossRef]
  91. Thaker, S.; Nagori, V. Analysis of fuzzification process in fuzzy expert system. Procedia Comput. Sci. 2018, 132, 1308–1316. [Google Scholar] [CrossRef]
  92. Karimi, H.; Sadeghi-Dastaki, M.; Javan, M. A fully fuzzy best–worst multi attribute decision making method with triangular fuzzy number: A case study of maintenance assessment in the hospitals. Appl. Soft Comput. 2020, 86, 105882. [Google Scholar] [CrossRef]
  93. Hanandeh, A.; Eidous, O.M. Some improvements for existing simple Approximations of the Normal Distribution Function. Pak. J. Stat. Oper. Res. 2022, 18, 555–559. [Google Scholar] [CrossRef]
  94. Fornell, C.; Larcker, D.F. Structural Equation Models with Unobservable Variables and Measurement Error: Algebra and Statistics. J. Mark. Res. 1981, 18, 382–388. [Google Scholar] [CrossRef]
  95. Ahvanooey, M.T.; Zhu, M.X.; Li, Q.; Mazurczyk, W.; Choo, K.-K.R.; Gupta, B.B.; Conti, M. Modern authentication schemes in smartphones and IoT devices: An empirical survey. IEEE Internet Things J. 2021, 9, 7639–7663. [Google Scholar] [CrossRef]
  96. Hussain, A.I.; Sayed, A.Z. Optimal user association of lte/wi-fi/wi-gig bands in 5g cellular networks. Int. J. Semant. Web Inf. Syst. 2021, 17, 22–40. [Google Scholar] [CrossRef]
  97. Zemmouchi-Ghomari, L.; Belilet, D.; Mekideche, I.; Ghomari, A.R. Implementing Web and Mobile Applications From Linked Open Data. J. Software Sci. Comput. Intell. (IJSSCI) 2022, 14, 1–18. [Google Scholar] [CrossRef]
  98. Gupta, B.B.; Gaurav, A.; Panigrahi, P.K. Analysis of the development of sustainable entrepreneurship practices through knowledge and smart innovative based education system. Int. Entrep. Manag. J. 2023, 19, 923–940. [Google Scholar] [CrossRef]
  99. Grzybowski, L.; Nicolle, A. Estimating consumer inertia in repeated choices of smartphones. J. Ind. Econ. 2021, 69, 33–82. [Google Scholar] [CrossRef]
  100. FitzRoy, F.R.; Nolan, M.A. Income status and life satisfaction. J. Happiness Stud. 2022, 23, 233–256. [Google Scholar] [CrossRef]
  101. Stanley, J.M. Impact of Number of Alternatives and Spatial Arrangement on Decoy Effects. Ph.D. Dissertation, University of South Carolina, Columbia, SC, USA, 2022. [Google Scholar]
  102. Moslehpour, M.; Chau, K.Y.; Dadvari, A.; Do, B.R.; Seitz, V. What killed HTC and kept Apple alive? Brand sustainability comparison of two Asian countries. Sustainability 2019, 11, 6973. [Google Scholar] [CrossRef] [Green Version]
  103. Khan, Q.; Mahmood, T.; Ullah, K. Applications of improved spherical fuzzy Dombi aggregation operators in decision support system. Soft Comput. 2021, 25, 9097–9119. [Google Scholar] [CrossRef]
Figure 1. HTC smartphones domestic sales and exports 2010–2020. Source: [1].
Sustainability 15 09396 g001
Figure 2. iPhone users and iPhones shipped worldwide (2010–2021). Source: [1].
Sustainability 15 09396 g002
Figure 3. The utility function and budget constraint for perfect substitutes. Source. Research inference based on [29,30,31].
Sustainability 15 09396 g003
Figure 4. The choice set for iPhone and HTC. Source. Research inference based on [29,30,31].
Sustainability 15 09396 g004
Figure 5. The study’s theoretical framework. Source. Research inference.
Sustainability 15 09396 g005
Figure 6. The fuzzification and defuzzification process. Source. Research estimations.
Sustainability 15 09396 g006
Table 1. The questionnaire’s constructs.
FactorConstructQuestionReference
Brand Awareness (BA)BA1I am aware of Apple/HTC.[6,73,74,75]
BA2When I think of smartphones, Apple/HTC is one of the brands that come to mind.
BA3Apple/HTC is a brand of smartphone I am very familiar.
BA4I know what Apple/HTC looks like.
Perceived Quality (PQ)PQ1Apple/HTC offers very good quality products.[7,8,76]
PQ2Apple/HTC offers products of consistent quality.
PQ3Apple/HTC offers reliable products.
PQ4Apple/HTC offers products with quality features.
Perceived Prestige Value (PV)PV1Apple/HTC is a prestigious product.[9,10,77,78]
PV2Apple/HTC has a high status.
PV3Apple/HTC is upscale among my friends.
Price Premium (PP)PP1Apple/HTC is a good value for the money.[11,79,80,81]
PP2The price of Apple/HTC is acceptable.
PP3Buying Apple/HTC is money well spent.
Brand Preferences (BP)BP1I like Apple/HTC better than other brands of smartphones.[12,82,83]
BP2I would use Apple/HTC more than other brands of smartphones.
BP3In smartphones, Apple/HTC is my preferred brand.
Purchase Intention (PI)PI1Apple/HTC is one of the preferred brands I want to buy.[13,84,85]
PI2I would definitely buy Apple/HTC in the future.
PI3I would seriously consider buying Apple/HTC.
Source. Research inference based on the mentioned studies.
Table 2. Demographics of respondents.
TaiwanIndonesiaTotal
iPhoneHTC iPhoneHTC iPhoneHTC
ProfileCategories#%#%#%#%#%#%#%#%#%
GenderFemale25563.1211958.9113667.3326460.8313160.3713361.2951961.9325059.6726964.20
Male14936.888341.096632.6717039.178639.638438.7131938.0716940.3315035.80
Total404100202100202100434100217100217100838100419100419100
Age20 below13332.926934.166431.689622.125023.044621.2022927.3311928.4011026.25
21 to 2522254.9511757.9210551.9825057.6012356.6812758.5347256.3224057.2823255.37
26 to 30245.9462.97188.916915.903013.823917.979311.10368.595713.60
31 and above256.19104.95157.43194.38146.4552.30445.25245.73204.77
Total404100202100202100434100217100217100838100419100419100
EducationSenior High School174.2183.9694.465312.212611.982712.44708.35348.11368.59
Bachelor34384.9017687.1316782.6732775.3516576.0416274.6567079.9534181.3832978.52
Master4110.15167.922512.384811.062310.602511.528910.62399.315011.93
PhD30.7420.9910.5061.3831.3831.3891.0751.1940.95
Total404100202100202100434100217100217100838100419100419100
OccupationStudent32279.7016883.1715476.2425258.0612758.5312557.6057468.5029570.4127966.59
Employee6115.102512.383617.8214032.267032.267032.2620123.999522.6710625.30
Self-Employed153.7173.4783.96306.91146.45167.37455.37215.01245.73
Housework61.4920.9941.98122.7662.7662.76182.1581.91102.39
IncomeTotal404100202100202100434100217100217100838100419100419100
<1 M10525.995627.724924.26388.762411.06146.4514317.068019.096315.04
1 to 3 M21352.7210451.4910953.9612027.656027.656027.6533339.7416439.1416940.33
3 to 5 M5313.122512.382813.8612629.036128.116529.9517921.368620.539322.20
5–8 M225.45104.95125.949120.974621.204520.7411313.485613.375713.60
>8 M112.7273.4741.985913.592611.983315.21708.35337.88378.83
Total404100202100202100434100217100217100838100419100419100
Source. Research estimations.
Table 3. The fuzzification and defuzzification key measures.
Linguistic ValueCrisp ValuestuCoG Mean   ( μ i ) Std .   Dev .   ( σ i )
Totally Disagree10.0000.0000.2500.0420.0210.021
Disagree20.0000.2500.5000.2500.1460.104
Indifferent30.2500.5000.7500.5000.3750.125
Agree40.5000.7501.0000.7500.6250.125
Totally Agree50.7501.0001.0000.9580.9790.021
Source. Research estimates based on Chen and Hsieh (2000) [20].
Table 4. The factors, constructs, unit of measurement, means, and standard deviation.
FactorConstructMeanStd. Dev.MinMax
Brand Awareness (BA)BA10.56380.36800.00011.0392
BA20.61250.36720.00031.0392
BA30.64450.36210.00021.0390
BA40.59860.36010.00151.0405
Perceived Quality (PQ)PQ10.61850.31890.00091.0271
PQ20.56510.31420.00021.0343
PQ30.60090.31570.00141.0325
PQ40.61570.32540.00011.0448
Perceived prestige value (PV)PV10.58120.36600.00001.0372
PV20.59040.36470.00161.0425
PV30.55600.37000.00071.0218
Price Premium (PP)PP10.50130.33690.00101.0292
PP20.43130.31030.00001.0304
PP30.44760.32140.00051.0354
Brand Preferences (BP)BP10.48140.32430.00041.0495
BP20.45920.31690.00011.0239
BP30.47970.32410.00051.0348
Purchase Intention (PI)PI10.45210.35710.00021.0368
PI20.47200.36010.00051.0447
PI30.48390.35280.00011.0347
Source. Research estimations based on data extracted from distributed questionnaire.
Table 5. Test of composite reliability and convergent validity.
CountryProductKMOBartlettp-Value CRAVEOmitted Constructs
Taiwan 0.9256042.0980.000BA0.8830.655
PQ0.8360.561
PV0.8450.645
PP0.8330.625
BP0.8860.721
PI0.8580.668
iPhone0.7771759.1440.001BA0.8520.592
PQ0.8470.582
PV0.8160.598
PP0.8300.622
BP0.8780.706
PI0.8870.724
HTC0.8902780.4990.000BA0.8750.640
PQ0.8010.503
PV0.8570.669
PP0.7120.452
BP0.8530.495
PI0.8620.676
Indonesia 0.9679502.2550.000BA0.8630.612BP2
PQ0.7760.465
PV0.7950.564
PP0.7910.562
BP0.7410.364
PI0.8110.590
iPhone0.9243085.6810.000BA0.5870.416BA3, BA4, PV1, PV2, PV3, BP2
PQ0.6660.333
PV--
PP0.8560.665
BP0.8820.605
PI0.7040.442
HTC0.8892286.2690.000BA0.8490.587PP1, PP3
PQ0.8280.548
PV0.7890.557
PP0.9080.908
BP0.8210.437
PI0.7400.498
Total 0.94813,440.850.000BA0.8780.642
PQ0.6680.335
PV0.8570.666
PP0.7060.445
BP0.7200.461
PI0.7960.566
iPhone0.7771759.1440.001BA0.8520.592
PQ0.8470.582
PV0.8160.598
PP0.8300.622
BP0.8780.706
PI0.8870.724
HTC0.9085117.4950.000BA0.8970.686
PQ0.7840.476
PV0.8310.622
PP0.5330.276
BP0.8430.476
PI0.8200.606
Source. Research estimations based on data extracted from distributed questionnaire.
Table 6. Cronbach’s alpha reliability analysis.
Taiwan IndonesiaTotal
BothiPhoneHTCBothiPhoneHTCBoth iPhoneHTC
BA83.73%78.16%83.48%92.15%78.34%80.40%89.80%77.83%87.60%
PQ90.45%80.40%84.37%91.60%84.13%80.05%91.09%82.47%82.73%
PV91.99%70.39%78.81%93.36%70.43%81.44%92.68%69.96%80.23%
PP85.04%79.73%80.80%81.01%86.44%65.74%82.40%83.40%73.34%
BP89.39%85.96%87.86%92.16%87.16%85.89%91.10%87.95%88.40%
PI93.63%89.19%90.13%91.11%91.52%77.30%92.38%90.35%83.54%
Total94.31%81.57%90.75%96.81%93.21%90.79%95.88%90.65%90.94%
Source. Research estimations based on data extracted from distributed questionnaire.
Table 7. Goodness of fit for confirmatory factor analysis (CFA).
Taiwan Indonesia Total
BothiPhoneHTCBothiPhoneHTCBoth iPhoneHTC
Chi-Squared331.506230.361266.404393.141232.872261.682529.127230.361380.949
df155155155155155155155155155
p-Value0.0000.0000.0000.0000.0000.0000.0000.0000.000
GFI0.9270.9040.8900.9160.9070.8920.9420.9040.916
CFI0.9700.9540.9440.9690.9630.9370.9720.9540.941
TLI0.9640.9440.9320.9620.9550.9230.9660.9440.928
RMSEA0.0530.0490.0600.0600.0480.0560.0540.0490.059
Source. Research estimations based on data extracted from distributed questionnaire.
Table 8. Goodness of fit for the SEM estimates.
Taiwan Indonesia Total
BothiPhoneHTCBothiPhoneHTCBoth iPhoneHTC
Chi-Squ338.903230.792487.661791.151382.326408.711559.702230.792631.376
df156156216216216216156156216
p-Value0.0000.0000.0000.0000.0000.0000.0000.0000.000
GFI0.9260.9040.8210.8430.8690.8560.9380.9040.881
CFI0.9690.9540.8970.9390.9440.9090.9700.9540.916
TLI0.9630.9440.8800.9290.9340.8940.9630.9440.902
RMSEA0.0540.0490.0790.0780.0600.0640.0560.0490.068
Source. Research estimations based on data extracted from distributed questionnaire.
Table 9. Hypotheses results.
HypothesesExplanatory
Variable
MediatorTaiwanIndonesiaTotal
BothiPhoneHTCBothiPhoneHTCBothiPhoneHTC
H1BAPP−0.009−0.005−0.0540.115 ***0.330 ***0.213 ***0.0250.337 ***−0.062 **
H2 BP−0.007−0.013−0.0170.198 ***0.256 ***0.178 *0.110 ***0.096 *0.104 ***
H3PQPP0.375 ***0.255 **0.527 ***0.249 ***0.304 **0.809 ***0.353 ***0.323 **0.330 ***
H4 BP0.209 ***0.249 **0.505 ***0.274 ***0.352 ***0.239 **0.317 ***0.286 **0.354 ***
H5PVPP0.171 ***0.230 *0.095−0.025 −0.0490.047 *−0.0480.095 *
H6 BP0.0150.0000.1230.115 ** 0.464 ***0.107 ***−0.0040.256 ***
Source. Research estimations based on data extracted from distributed questionnaire. Note: *** 99%, ** 95%, * 90%; Dependent variable PI.
Disclaimer/Publisher’s Note: The statements, opinions and data contained in all publications are solely those of the individual author(s) and contributor(s) and not of MDPI and/or the editor(s). MDPI and/or the editor(s) disclaim responsibility for any injury to people or property resulting from any ideas, methods, instructions or products referred to in the content.

