Article

A Methodological Framework to Assess Road Infrastructure Safety and Performance Efficiency in the Transition toward Cooperative Driving

by
Maria Luisa Tumminello
1,
Elżbieta Macioszek
2,
Anna Granà
1,* and
Tullio Giuffrè
3
1
Department of Engineering, University of Palermo, Viale delle Scienze ed 8, 90128 Palermo, Italy
2
Department of Transport Systems, Traffic Engineering and Logistics, Faculty of Transport and Aviation Engineering, Silesian University of Technology, Krasińskiego 8 Street, 40-019 Katowice, Poland
3
Faculty of Engineering and Architecture, University of Enna Kore, Viale della Cooperazione, 94100 Enna, Italy
*
Author to whom correspondence should be addressed.
Sustainability 2023, 15(12), 9345; https://doi.org/10.3390/su15129345
Submission received: 20 April 2023 / Revised: 21 May 2023 / Accepted: 5 June 2023 / Published: 9 June 2023

Abstract

:
There is increasing interest in connected and automated vehicles (CAVs), since their implementation will transform the nature of transportation and promote social and economic change. Transition toward cooperative driving still requires the understanding of some key questions to assess the performances of CAVs and human-driven vehicles on roundabouts and to properly balance road safety and traffic efficiency requirements. In this view, this paper proposes a simulation-based methodological framework aiming to assess the presence of increasing proportions of CAVs on roundabouts operating at a high-capacity utilization level. A roundabout was identified in Palermo City, Italy, and built in Aimsun (version 20) to describe the stepwise methodology. The CAV-based curves of capacity by entry mechanism were developed and then used as target capacities. To calibrate the model parameters, the capacity curves were compared with the capacity data simulated by Aimsun. The impact on the safety and performance efficiency of a lane dedicated to CAVs was also examined using surrogate measures of safety. The paper ends with highlighting a general improvement with CAVs on roundabouts, and with providing some insights to assess the advantages of the automated and connected driving technologies in transitioning to smarter mobility.

1. Introduction

The technological breakthroughs in transportation systems are an integral part of the transformations of cities [1]. To get increasingly smart cities, intelligent transportation Systems and big data applications have been increasingly targeted over time to design road traffic services truly geared toward increased road users’ safety, congestion reduction, energy saving, and driving comfort. Furthermore, the potential of these technologies is that vehicles, system users, and road infrastructures can be integrated to properly improve mobility [2]. The technological development of transportation has also been directed toward the vehicle’s automation and connectivity between the vehicles and road infrastructures [3]. There are six levels of vehicular autonomy from fully manual to fully autonomous driving which describe the human–machine shared interaction on roads [4]. Connectivity forges an inspiring environment for vehicle-to-infrastructure (V2I), vehicle-to-pedestrian (V2P), vehicle-to-vehicle (V2V), vehicle-to-device (V2D), and vehicle-to-network (V2N) communications [5]. Connected and automated vehicles (CAVs) are expected to perform the driving tasks by using the cooperative adaptive cruise control (CACC) system based on vehicle-to-vehicle and infrastructure-to-vehicle communications, which facilitates the exchange of information between vehicles and enhances connectivity [5,6,7]. In this regard, Wang et al. [7] proposed a method to estimate the motion state of preceding vehicles and surrounding vehicles to improve the safety control of intelligent connected vehicles; simulation and real vehicle tests confirmed that the prediction approach properly balanced the communication among vehicles and their performances. Despite the advantages of cooperative driving, however, there are still many and not easy challenges to tackle [8]. In this view, a novel practical application concerned the development of a machine-to-machine (M2M)-based cooperative driving protocol, specifically focused on V2I communication and tested on a real-world merging crossroad [9]. According to the results, there is the potential to expand the application on different types of roads to make autonomous driving experience safer.
Transition toward cooperative driving systems still requires understanding of the key issues involved in adapting the geometry of road infrastructures to the kinematics of CAVs in order to achieve the proper balance between road safety and traffic efficiency [10]. Although cooperative driving is expected to improve operating performances of road infrastructures, it is not yet clear how connectivity may affect the car’s ability to move through intersections and roundabouts in which users experience curvilinear trajectories while entering, crossing the intersection area, and exiting [11]. To this day, CAVs are not yet available to all users, and all levels of automation are not yet available on the market, where their entry is expected to happen gradually also in relation to the physiological rate of replacement of old cars with new ones [5].
In a responsible society perspective, which directs the road design choices toward the use of materials and constructive ways sustainable, road engineers should know, in advance, the response to the expected performance requirements of a given road infrastructure, where heterogenous fleets made of human-driven vehicles (HDVs) and CAVs are simultaneously mixed in traffic [6,12,13]. In this regard, microscopic traffic simulation models are already configured as valuable tools to model operational performances at a single node or corridor level and to assess the expected benefits of increasingly high market penetration rates of CAVs [14,15]. Although roundabouts are renowned among the road infrastructures for their potential in making road traffic safer and in reducing delays, fuel consumption, and construction and maintenance costs [16], microsimulation can be of great interest to evaluate to what extent the curvilinear design of roundabouts affects traffic patterns and operations in presence of high levels of automation and connectivity [16,17,18].
To fill the above gaps, the paper aims to propose a novel simulation-based methodological framework aiming to assess the interactions between CAVs and HDVs on roundabout systems operating at a high-capacity utilization rate, as well as their impacts on road safety and performance efficiency. In this regard, the adjustment factors for roundabout systems provided by [17] were applied to develop the CAV-based capacity curves in mixed traffic situation. It should be also noted that the beforementioned factors were developed by using microsimulation which considered all the high-reliability elements necessary to fully implement cooperation among vehicles [17].
The framework in this paper consists of the following main sequential steps: (1) conceptualizing the roundabout system; (2) identifying the mechanisms that regulate the entry of vehicles on the circulatory roadway where circulating traffic moves around the central island; (3) traffic data collection, processing, and mining to determine the capacity target values for every entry mechanism and CAV penetration rate; (4) building the roundabout network model and simulation from free-flowing traffic to capacity for calibration purposes; (5) assessing the impact of CAVs on traffic throughput; (6) assessing the CAVs impact on safety and performance efficiency for roundabouts with a dedicated lane to CAVs compared to the traffic situation with CAVs and HDVs sharing the lanes. With a view to providing an overview of the six sequential steps of the proposed methodological framework, a roundabout was identified in the road network of Palermo City, Italy, and then built in Aimsun Next (Aimsun from now on) [18] to model operations at capacity.
Due to the current lack of high levels of automation and connectivity in traffic, the CAV-based capacity curves corrected using the adjustment factors proposed by [17] for different market penetration rates of CAVs were employed as an alternative source of target capacity data [19]. To calibrate the model parameters, the CAV-based capacity curves were then compared with the data simulated by Aimsun. The safety and performance efficiency of roundabout dedicated lanes for CAVs were also compared to the mixed traffic situation with HDVs and CAVs. For the safety assessment, surrogate measures were used by combining Aimsun with the Surrogate Safety Assessment Model (SSAM) [20].
Results highlighted general improvements in roundabout performance with CAVs in traffic compared to the scenario made only by human driven vehicles; moreover, they provided some insights to assess the advantages of the CAVs to consider in the cities’ successful strategies aimed at improving mobility. The proposed stepwise approach can assist transportation engineers and decision makers in assessing the level-of-service of road infrastructures at the design or implementation phase, in the transition toward cooperative driving.
This research includes the following scientific and public contributions:
Scientific: It identifies some parameters of cooperative driving on a roundabout model that meets the geometry and traffic characteristics of a real-life counterpart in order to examine the effects of the changes in design and driving behavior from a safety and efficiency perspective in the transition to growing proportions of CAVs in traffic.
Public: It highlights a general performance improvement with CAVs on roundabouts compared to the base case with HDVs only, and it provides some insights to assess the expected safety and operational advantages of connected and automated driving to tackle the future challenges in mobility.
The organization of the paper includes a brief overview of the related research on the topic in Section 2; Section 3 presents the proposed framework, includes the materials and methods applied to a roundabout case study, and describes the reasons behind the assumptions and choices made; Section 4 and Section 5 present and discuss the results, respectively; the final section presents the conclusions of the research and some future developments.

2. Related Research

The risks of crash events and significant losses in the economic and social dimension have always been associated with increased road mobility. Since crash-related data show that driver behavior is one of the main factors influencing road crashes, analysts are currently questioning the entry of CAVs into full service in the near future and their impact on road safety and performance efficiency [5,21]. The participation of CAVs in road traffic will minimize or remove human factors during driving, since certain functions will be carried out with limited human participation or automatically [21]. However, fully autonomous driving will transfer the driving tasks to a computer system; as a consequence, the classifications provided by the literature denote that full automation does not yet exist, but currently requires specific human support [4].
The introduction of CAVs in traffic will change traffic conditions and transform safety standards for road design, maintenance and infrastructure administration, and traffic modeling and assessment tools for road management. In this view, Rahman and Abdel-Aty [22] evaluated vehicle platooning on expressways by employing surrogate measures of safety; the results provided useful information for different market penetration rates of connected and automated vehicles in traffic. In turn, Rahman et al. [23] used VISSIM [24] to simulate the implementation of V2V communication technologies and to assess the effectiveness of CAVs in adverse visibility conditions on a US interstate; specifically, they simulated both connected vehicles without platooning and connected vehicles with platooning, and then employed surrogate measures of safety to assess the reduction in the crash risk. Their results showed improved safety in fog conditions and improvements in average speed as the market penetration rates of CAVs increased. Another study used microsimulation to model a road network and to evaluate the contraflow evacuation operation in CAV environment [25]. The study found improvements in the system performance for contraflow operations with CAVs in the evacuation traffic; the results showed reduced delay and travel times for the evacuation route, as well as increased speeds with at least 30% of CAVs in traffic.
In the transition toward cooperative driving, there is a need to examine the main performance efficiency and safety issues with CAVs and HDVs simultaneously moving in road traffic (see, e.g., [26]). In this regard, the literature reports some studies that have examined how to improve the gap acceptance at roundabout entries [27,28]. Another key aspect is to take into account the kinematic and dynamic needs of CAVs on curved trajectories which can make the interpretation of the intentions of other vehicles difficult to anticipate [29,30].
Most of the studies in this field of investigation, however, predominantly focused on trajectory control optimization of CAVs to improve mobility in mixed traffic situations, and speed optimization to minimize the total delay time [31,32]. In this regard, Wu et al. [32] proposed a method to control vehicle cooperation and to generate collision-free trajectories for CAVs at isolated roundabouts. The results showed improved throughput and average speeds, as well as reduced total travel times. In turn, Jalil et al. [33] conceptualized a novel holistic coordination system for CAVs at T-shaped roundabouts in order to optimize the traffic states of each approaching vehicle and to minimize the total delay time; the authors highlighted improvements in the average speed, traffic density, idling, and fuel consumption of vehicles around the roundabout where speed optimization ensured smooth crossing.
There is the further issue concerning the CAV ability to receive information from the other vehicles, roadway infrastructure, and traffic control centers in order to anticipate the driving actions of the preceding vehicles. Thus, a control system for the aware-situation connected driving should take into account the specific features of path planning and navigation at roundabouts that include entries, merging, turning maneuvers, lane changing, and exits [11,34]. In this regard, another study emulated a driverless vehicle in a roundabout and tested a control lateral system in a 3D simulator [35]. Major conclusions concerned the need to better optimize the automatic geometry recognition in terms of entry radii and deviation from the reference circle; the authors found defects especially when the vehicle used the greatest possible ability to maneuver. Another study simulated CAVs negotiating a roundabout which is used as a controller to implement vehicle-to-infrastructure communication [29]. The authors tested different combinations of geometry and traffic patterns in order to assess the operational performance of CAVs; however, they stressed the need for further study to generalize the conclusions.
Referring to safety effects of CAVs on roundabouts, it is not yet known to what extent people will be ready to accept smaller gaps when negotiating a roundabout. In this regard, a study investigated the impacts of autonomous vehicles on roundabout safety using VISSIM [36]. The results showed a 32% reduction in total conflicts by modeling CAVs with defensive behavior on roundabouts, while the simulation of assertive behavior worsened their performance efficiency. Similar results were provided by [37] that revealed increased conflicts with automated vehicles in traffic.
Traffic microsimulation can be a useful approach to examine the performance response of a given road infrastructure on corridor or network in the transitioning to a fully CAV fleet; they can be useful tools both to evaluate changes in road safety and traffic operations with CAVs and HVDs coexisting in traffic, and to develop novel tools to assess and to manage road safety (see, e.g., [38]). In this view, the adjustment factors for CAVs on roundabouts provided by the Highway Capacity Manual 7th Edition were the starting point of the analysis we made [17].

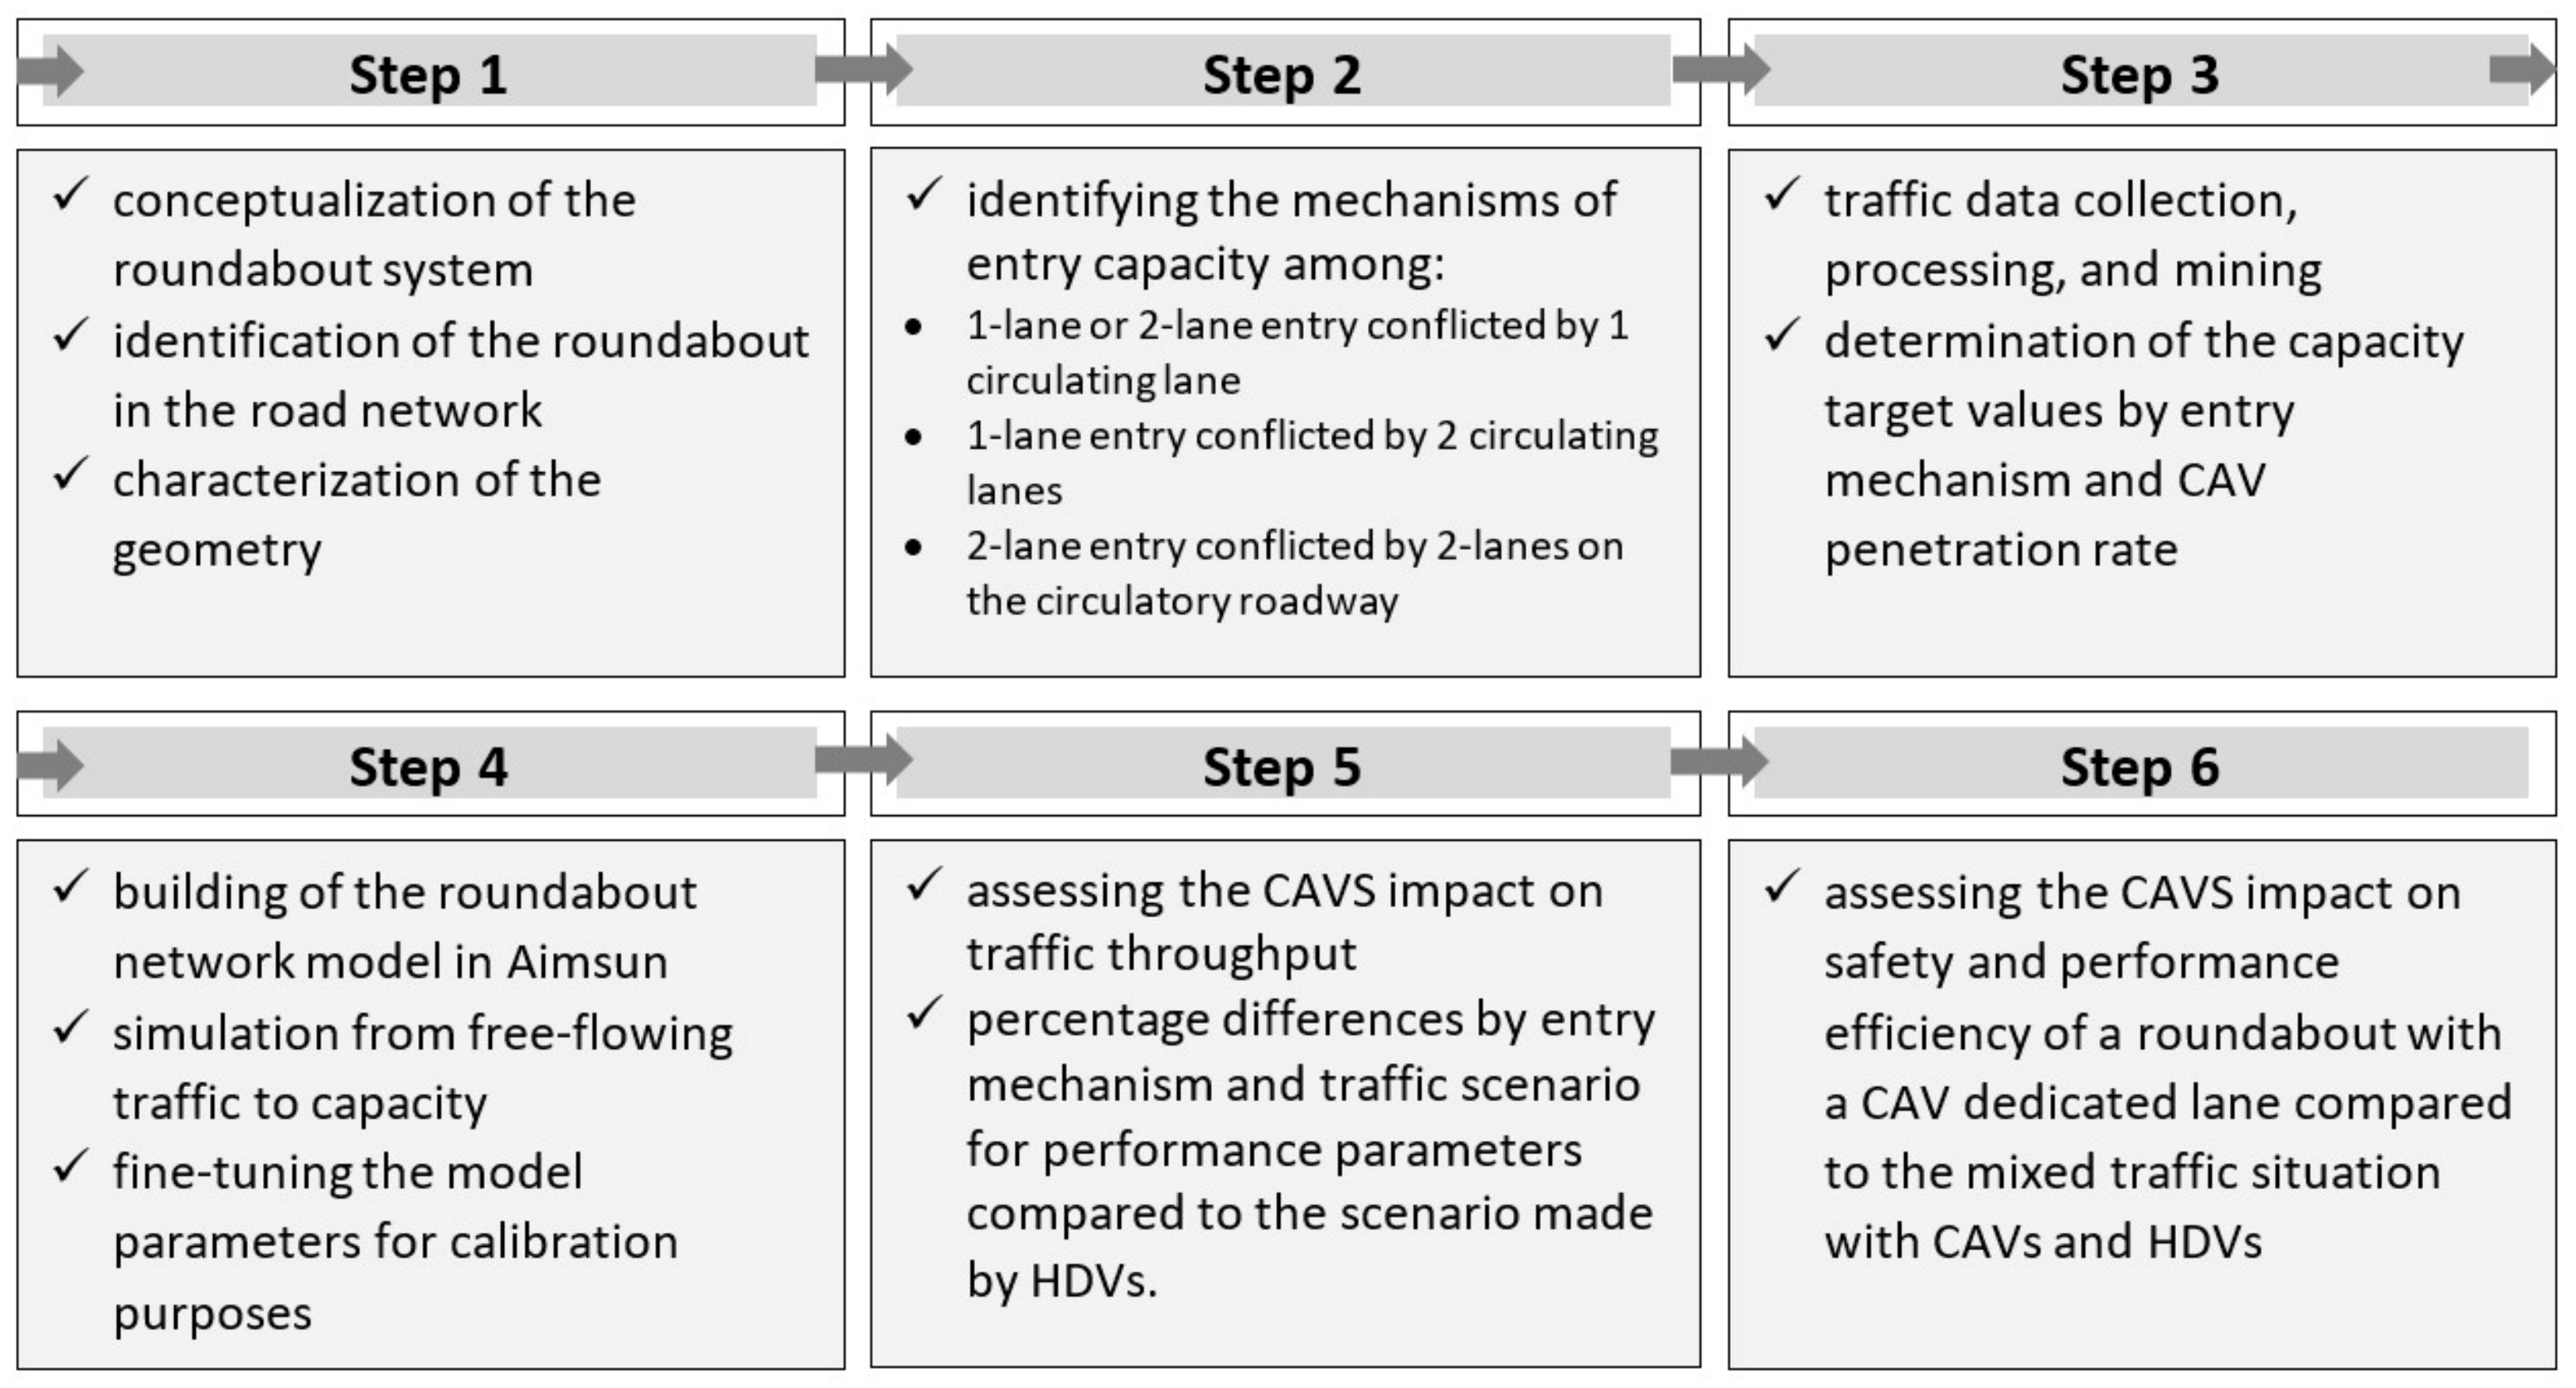
3. Materials and Methods

This section presents the microsimulation-based methodological framework designed for evaluating road infrastructure safety and performance efficiency with CAVs in traffic. With a view to assessing whether cooperative driving is compatible with roundabout navigation, the structure of the stepwise approach included subsequent steps for identifying a roundabout case study and the mechanisms of entry capacity, collecting traffic data and developing the CAV-based capacity curves, simulating traffic scenarios from free-flowing traffic to capacity for calibration purposes, and assessing the CAV impact on traffic performances. On the basis of the above steps, the safety and performance efficiency of a roundabout with a CAV dedicated lane has been evaluated compared to the mixed traffic situation with HDVs and CAVs in traffic. Figure 1 shows an overview of the proposed procedure applied to roundabouts.

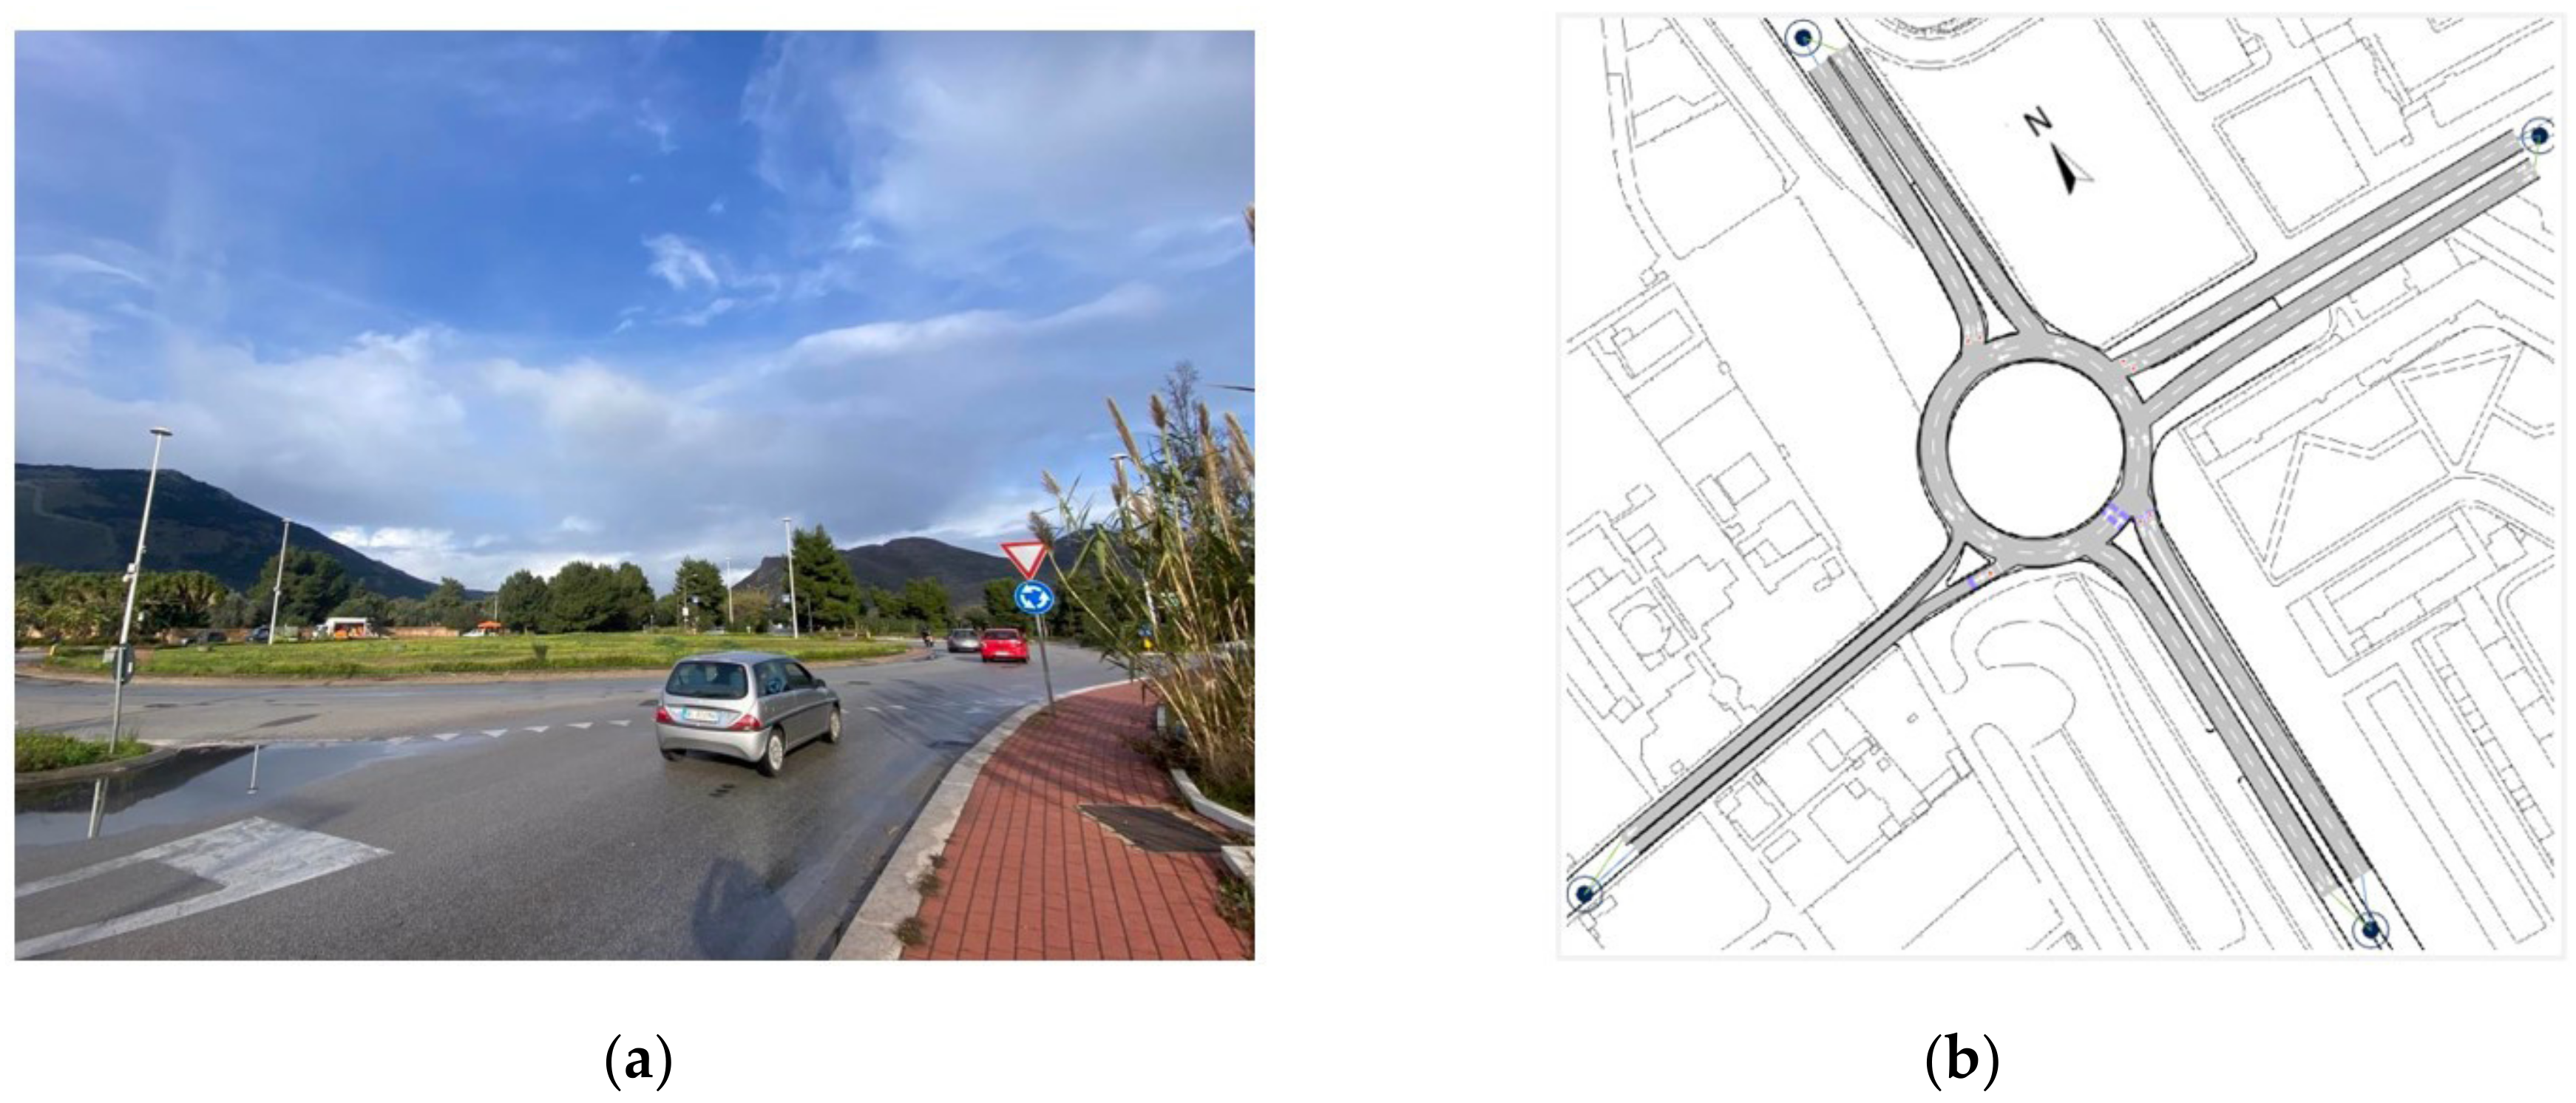
3.1. Step 1: Conceptualization of the Roundabout System, Identification of the Roundabout in the Road Network, and Characterization of Its Geometry

There was a need to identify a case study in the road network of Palermo City, Italy, in order to conceptualize a roundabout system and to feed the network model in Aimsun (see Section 3.4). A two-lane large diameter roundabout was selected to describe the proposed methodology. The roundabout case study is installed in the suburban area that connects the city center to the seaside town of Mondello at the intersection of F. Besta and L. Enaudi neighborhood streets in the east–west direction and G. Lanza di Scalea arterial road in the north–south direction (see Figure 2a for a view of the roundabout). The geometry of the roundabout is consistent with Italian standards for road intersections [39]; the roundabout has an inscribed circle radius of 35.50 m comprehending the non-traversable central island and 8.00 m wide circulatory roadway with two lanes, 4.00 m wide entry and exit lanes, and entry approaches with deflection angles greater than 43°. The roundabout size allowed designing an alternative configuration with a lane dedicated to CAVs in order to assess its safety and performance efficiency compared to the roundabout where the CAVs and HDVs share the entry and circulating lanes.

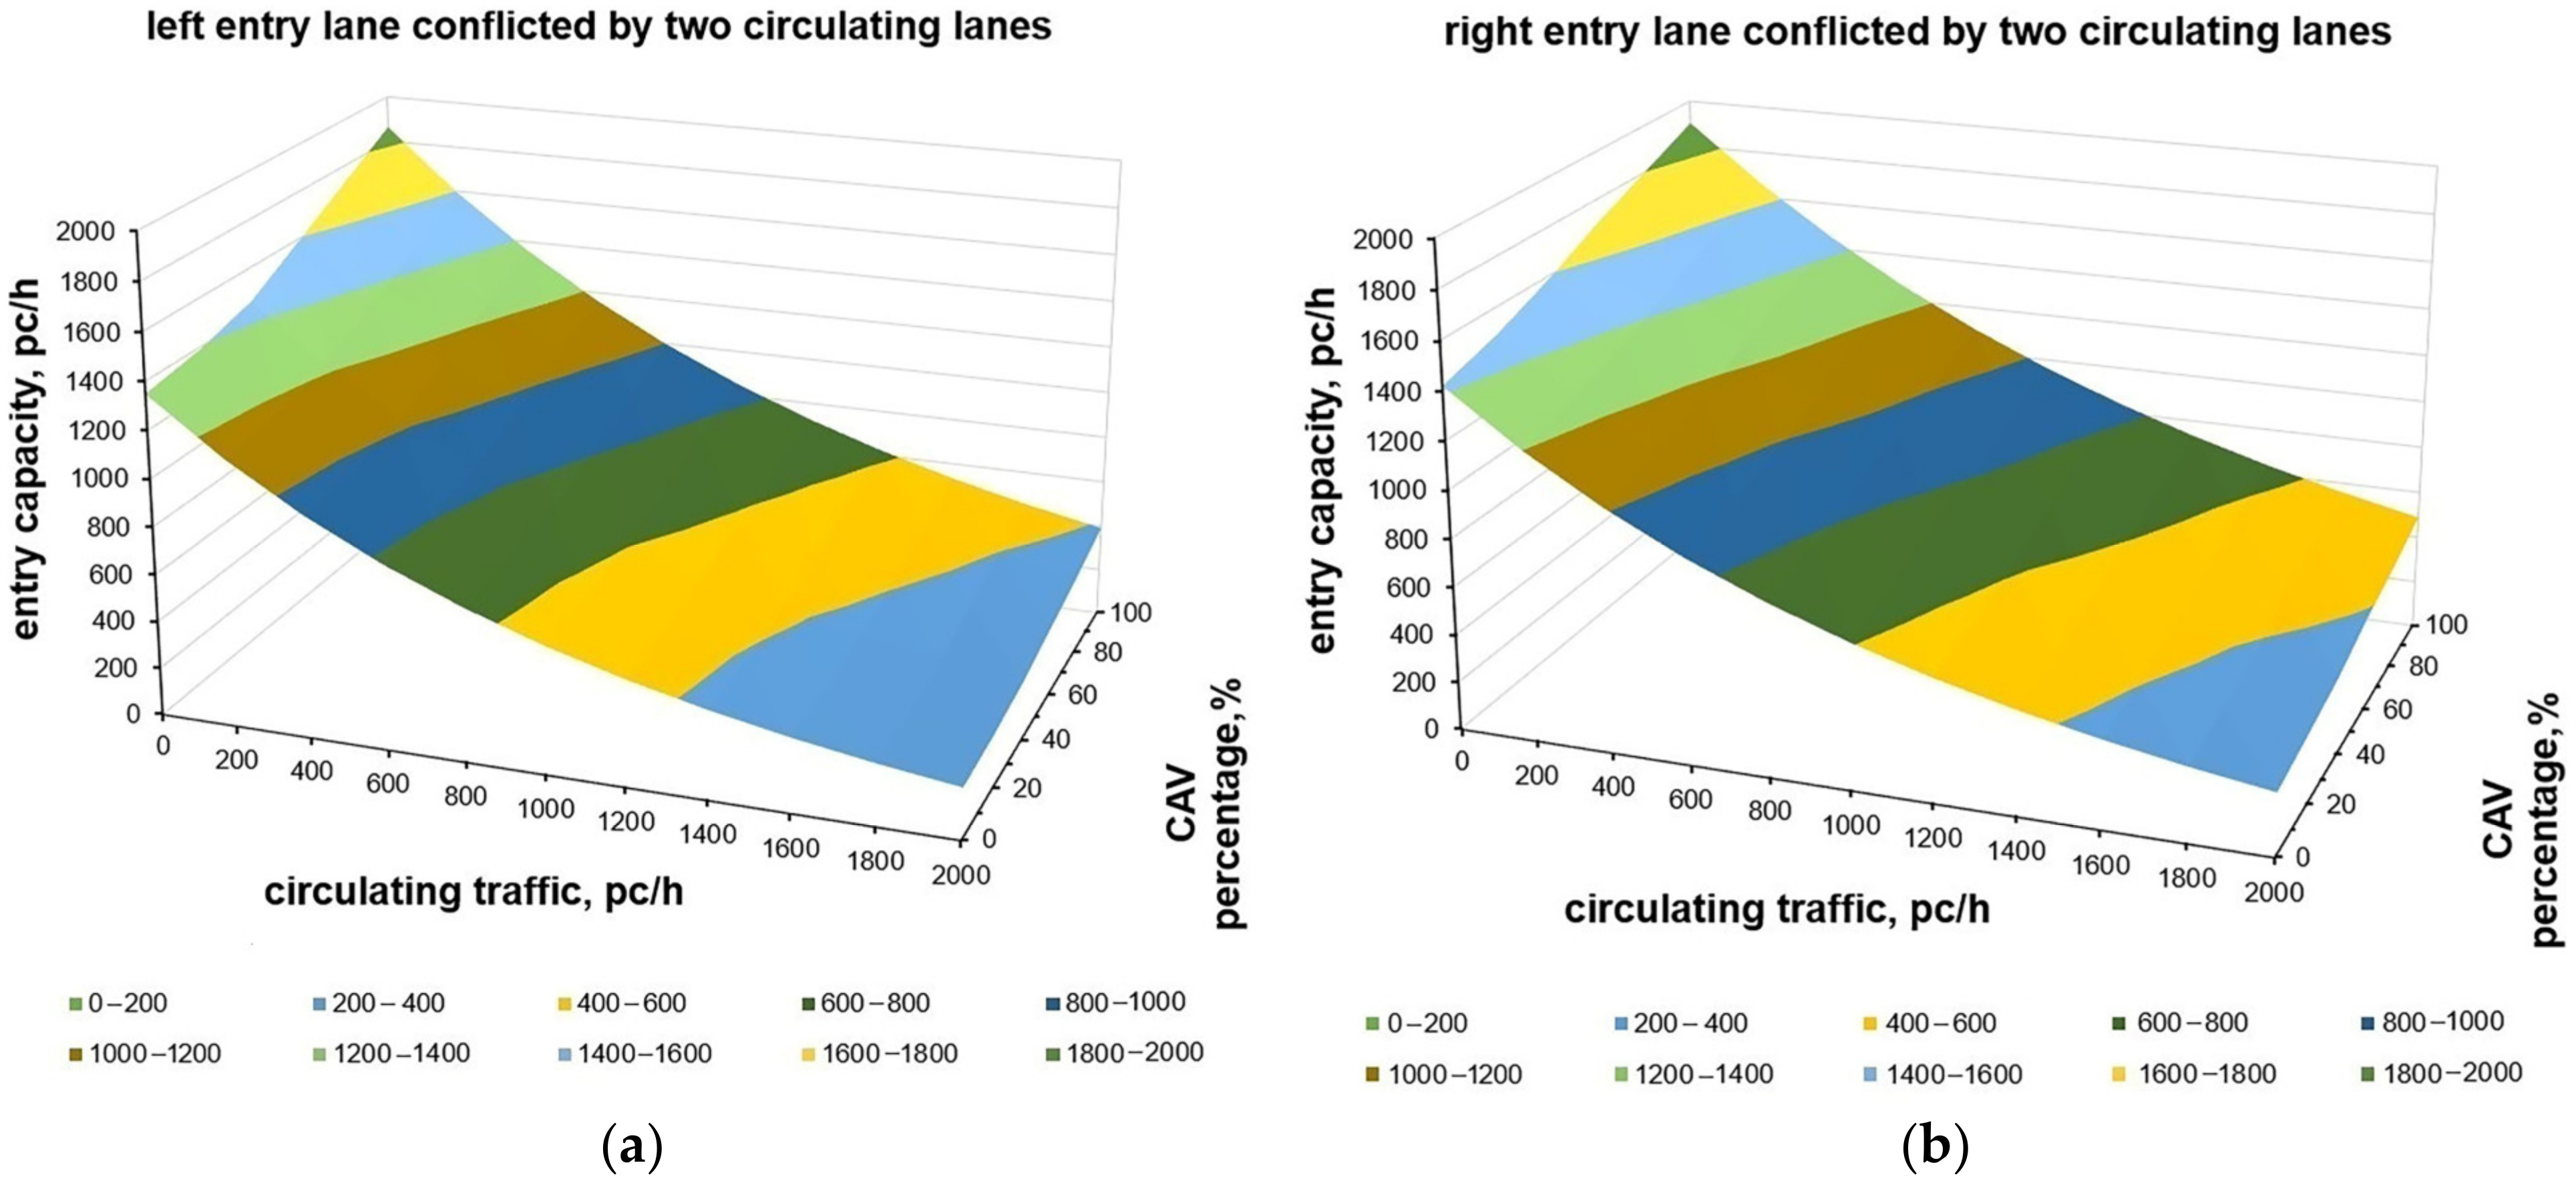
3.2. Step 2: Identification of the Mechanisms of Entry Capacity

Step 2 consisted of the identification of the mechanisms of entry capacity for each traffic flow entering the roundabout conflicted by the circulating traffic on the circulatory roadway. The roundabout driving rules apply to entering vehicles that must give way to circulating vehicles proceeding counterclockwise around the central island; furthermore, vehicles preselect the appropriate entry lane and enter the roundabout when a gap wide enough occurs between subsequent vehicles in the circulatory roadway [16]. In other words, the priority rules establish how to negotiate every point of potential conflict in which the entering vehicles merge with the circulating vehicles before reaching their desired exit. Since roundabouts work with yield conditions, the combination of the number of entry and circulating lanes affects the negotiation among interacting traffic streams and, thus, the gap acceptance behavior on which entry capacity depends [16,28]. Moreover, the driving behavior depends on the type of vehicle given that shorter gaps may occur only where the leader vehicle and the follower vehicle are both CAVs [5]. The roundabout case study is devoid of any raised lane divisors on the entry approaches and the circulatory roadway. On the basis of observations in the field at entries, two mechanisms of entry capacity were identified; thus, it was assumed that both the left lane and the right lane at entries were conflicted by two circulating lanes (i.e., the outer lane and inner lane of the circulatory roadway). The real-life roundabout was the starting point to build the theoretical layout that met the geometric and operating characteristics of the case study. For each mechanism of entry capacity (i.e., the left lane and the right lane at entries), a fleet made only by human driven vehicles was used to model the target curves of capacity in the base situation; in turn, the target curves with CAVs were built using market penetration rates equal to 20%, 40%, 60%, 80%, and 100% CAVs, and corrected using the factors proposed by [17]. The identified mechanisms of entry capacity were then used in the subsequent simulation with Aimsun to define the right-of-way among conflicting movements and to simulate the gap acceptance behavior (see Section 3.4).

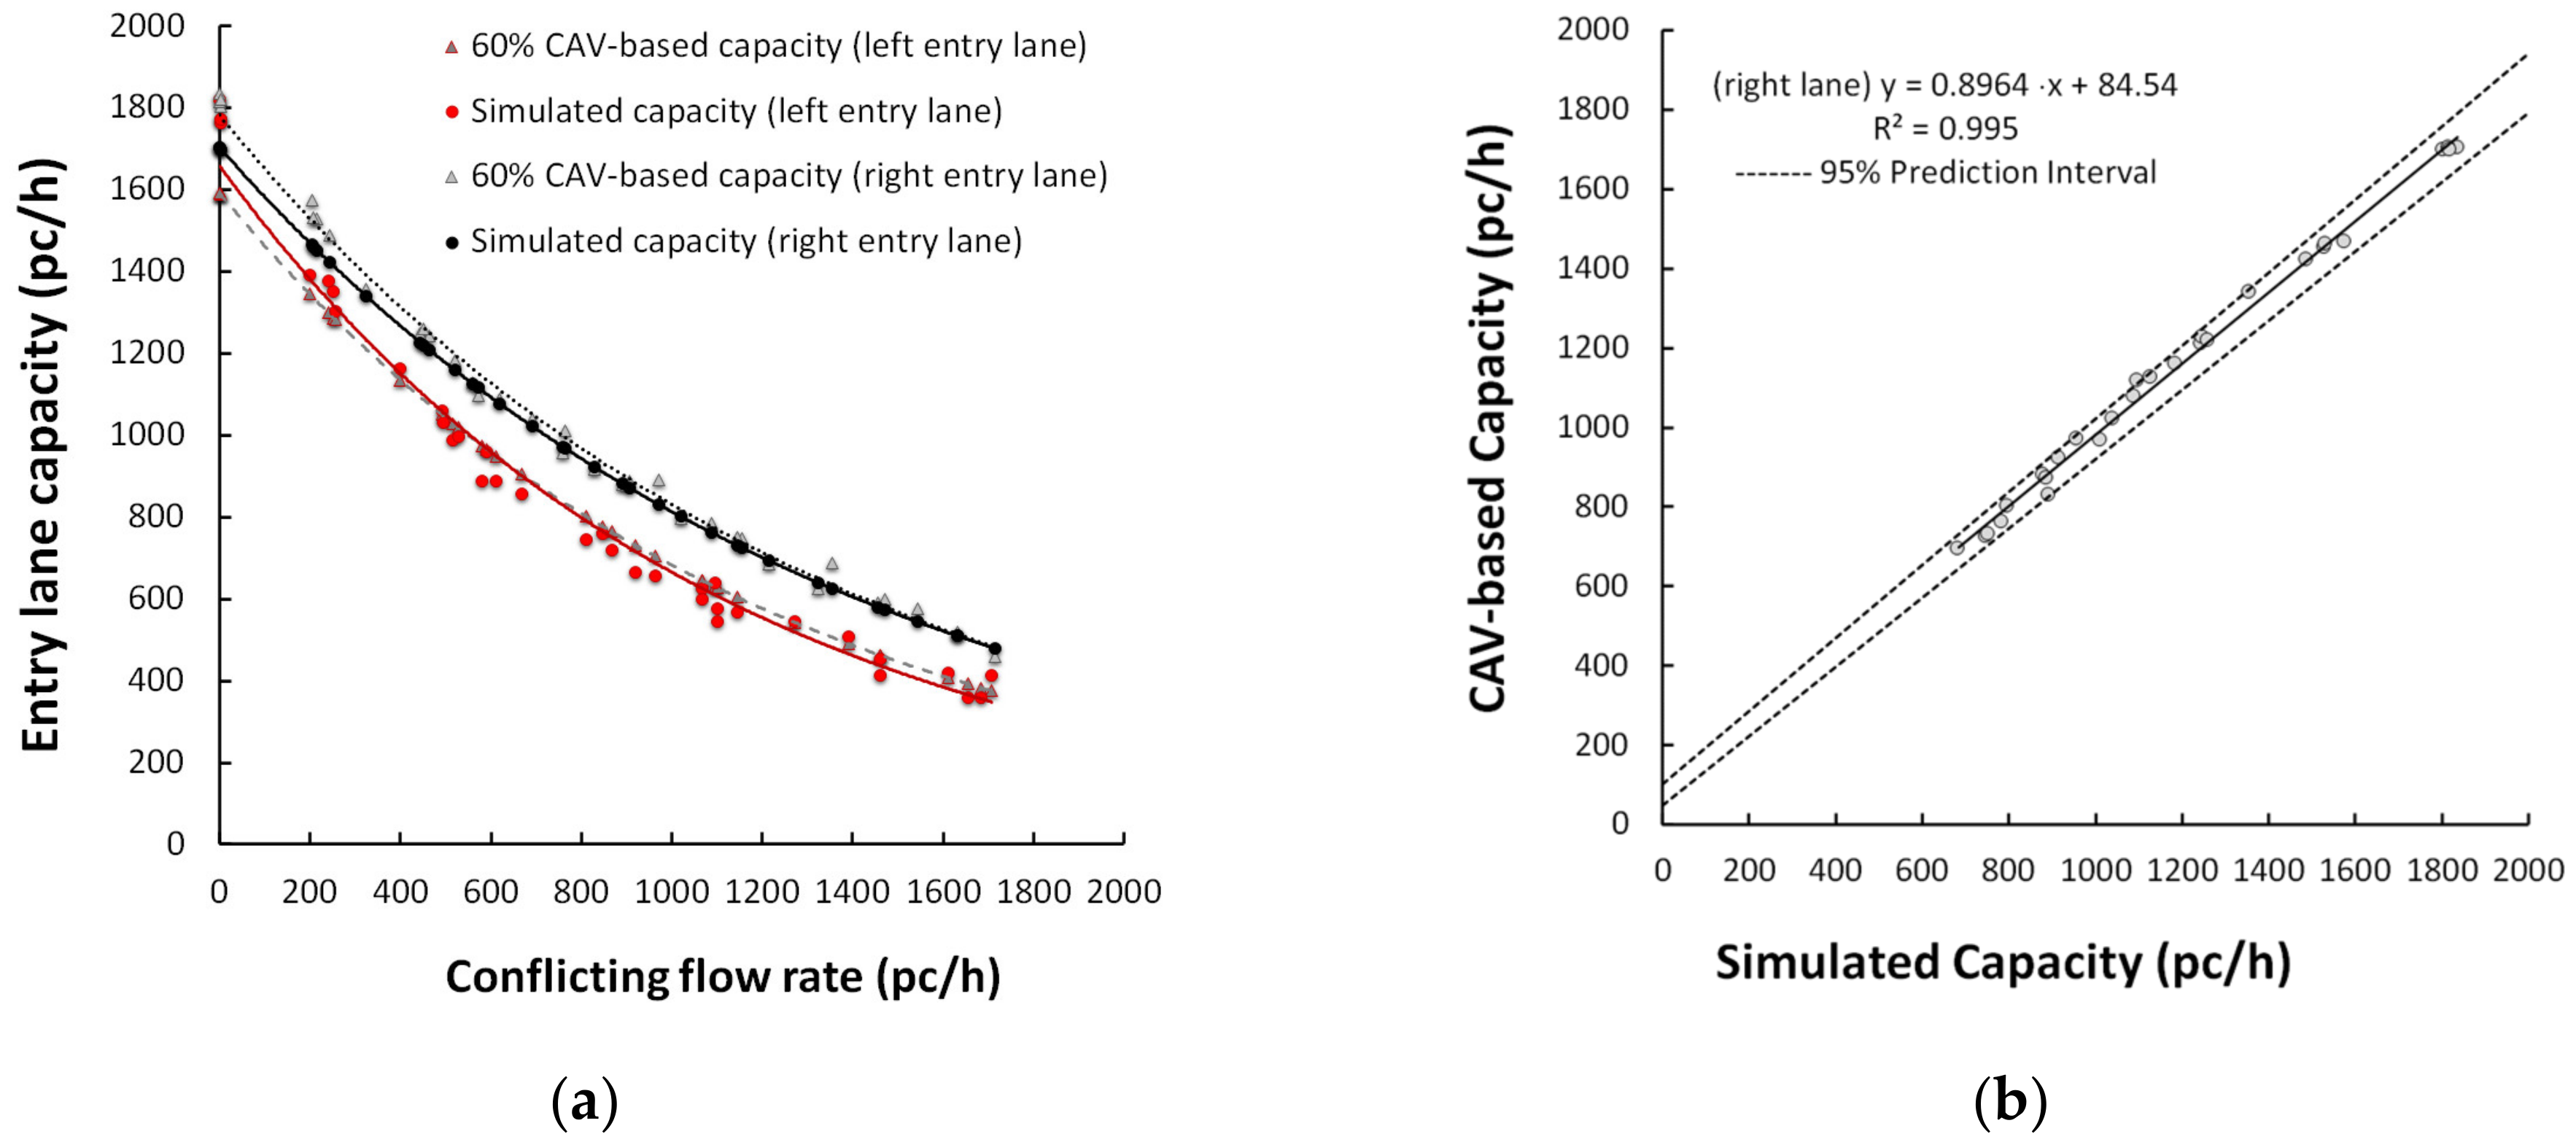
3.3. Step 3: Traffic Data Collection, Processing and Mining, and Determination of the Capacity Target Values for Every Entry Mechanism and CAV Penetration Rate

In Step 3, traffic surveys were carried out during 5 min time intervals in the peaks from 7:00 to 8:30 a.m. and from 6:30 to 8:00 p.m. on Tuesday to Thursday in November 2022. Survey data considered an entry traffic flow of 3422 vehicles per hour; 11% of trucks were collected in the field. Since the roundabout is installed in the suburban area, the pedestrian and bicycle traffic resulted irrelevant. There were balanced traffic flows from all the legs.
The general equation used to determine the CAV-based capacity curves reflecting the presence of different proportions of CAVs is as follows:
C e , C A V s = f a · a · e f b · b · Q c ,
where Ce,CAVs is the CAV-based capacity curve by entry lane, adjusted also for heavy vehicles (pc/h), a and b define the intercept and slope parameters, respectively, and fa and fb are the planning-level adjustment factors of the parameters a and b, respectively. The CAV-based capacity curves were corrected with the adjustment factors given by [17] for different market penetration rates of CAVs and adapted to the case study in Figure 2b; in the absence of high levels of automation and connectivity in traffic, they were employed as an alternative source of target capacity values [19]. Figure 3 shows the surface functions for each interaction mechanism at entries for the roundabout in Figure 2b. A fleet made only by human driven vehicles was considered to develop the capacity function for the base traffic situation; the curves for CAVs were developed using percentages of CAVs (0%, 20%, 40%, 60%, 80%, and 100% with increments of 20%).
It is well known that roundabout capacity depends on the yielding process at entries, the distribution of gaps in the circulating traffic streams, the driver’s decision to enter whether enough space occurs to complete the entry maneuvers, and the follow-up times required by drivers in a queue [16]. Moreover, the CAV behavior specifies the gap-acceptance process at entries. A CAV activates the CACC system where the conflicting vehicle is a CAV in order to have information on the kinematics (i.e., position and speed) of the conflicting CAV. Furthermore, a CAV may activate the adaptive cruise control (ACC) to enter whether a human driven vehicle is the conflicting vehicle [17]. In this view, CAVs are expected to provide greater increases in capacity because they have the potential to accept smaller gaps safely than HDVs [17,26]. The lane change maneuvers and the differences in driving skills among vehicles may make the negotiation of two-lane roundabouts more complicated than the single-lane counterparts [16]. According to [17], the surface functions in Figure 3 show improved capacity as the percentages of CAVs increase; thus, more vehicles can accept smaller gaps safely. From this, it would follow that the benefits of cooperative driving may be reached more easily.
Figure 3. Surface functions of entry capacity under different proportion of CAVs in traffic for the case study in Figure 2b: (a) left lane; (b) right lane.
Sustainability 15 09345 g003

3.4. Step 4: Building the Roundabout Network Model and Simulation from Free-Flowing Traffic to Capacity for Calibration Purposes

In Step 4, the roundabout network model was built in Aimsun (see Figure 2b) to simulate operating conditions from free-flowing traffic to capacity for the two mechanisms of entry capacity (i.e., the right entry lane or the left entry lane) identified in Section 3.2. Different market penetration rates of CAVs were set to simulate the traffic scenarios (i.e., from base to 5); each mixed traffic situation included a percentage x of CAVs varying from 0% to 100% and the corresponding (1 − x) percentage of HDVs; percentage increases of 20% were applied. In each traffic scenario, we also assumed that 100% of CAVs were equipped with the CACC system and only 30% of HDVs were equipped with the adaptive cruise control (ACC) system. However, there was the awareness that ACC systems provide minimum gap times that are similar to, or longer than, the gaps used by human drivers, thus contributing to decreased entry capacity when in use [17,18]. Moreover, the required vehicle-to-vehicle communication abilities were considered to be in operation at a high degree of system reliability. Before simulations ran, the coded roundabout network model and traffic demand data were reviewed using the matrices derived from traffic counts. Ten simulations, each of them lasting 60 min, were performed and included the time to load traffic and to reach steady state for initializing the roundabout network model. This phase was necessary for avoiding potential coding errors before calibration. The results confirmed the capability of Aimsun to reproduce the traffic observed in throughout 5 min sampling intervals in peak hours; the GEH index was found to be less than five (about more than 95% of the cases) in each simulation [19]. There was a need to split demand data into two O/D matrices, each with x percentage of CAVs and (1 − x) percentage of HDVs according to the abovementioned scenarios. To simulate saturated traffic conditions and the reaching of capacity, nine subsequent O/D matrices were derived and assigned to the subject entry lane so that it reached the saturated condition, while the circulating traffic was increasing (i.e., 0 to 1800 veh/h with an increase of 200). The simulation from free-flowing traffic to capacity ran so that the number of vehicles reasonably expected to enter the roundabout reflected the entry capacity values as returned by detectors on the roundabout network model. For calibration purposes, the model parameters were manually fine-tuned to improve the match between the simulated data with the target capacity curves for each entry mechanism and each proportion of CAVs. A global calibration was first performed, followed by link-tuning of the network model [19]. According to [19,40], few model parameters were identified, individually examining them and adjusting them in Aimsun in order to obtain simulation output close to the CAV-based curves (see the results in Table 1).
Calibration of HDVs included the speed limit acceptance and the time gap. The speed limit acceptance is the degree of acceptance of the speed limit by the drivers [18]. Typically, if the speed limit acceptance is higher than one, the maximum speed on a road link can be higher than the speed limit, otherwise, when setting the speed limit acceptance lower than one, the maximum speed can be lower than the speed limit. Furthermore, the time gap measured from the rear to the front bumper of subsequent vehicles is calibrated to override the time headway between the front bumpers of subsequent vehicles. The default value of this car-following parameter of 0 s means that the time headway can be used instead of the gap, whereas other values can cause wider headways and can affect the follower vehicle’s deceleration in relation to the leader vehicle’s kinematics [18].
The calibration also regarded the reaction time that drivers use to adapt their speed to the speed variation of the next vehicle (see also [41]). A higher capacity may result with lower reaction time since the driver can be able to find and to accept smaller gaps safely before entering the roundabout. It should be noted that this car-following parameter of Aimsun can be set to the same value for all vehicles and is equal to the timestep of Aimsun. However, the reaction times of CAVs are shorter than HDVs; thus, the reaction time value under mixed traffic was set equal to a weighted average of the values of each vehicle class in relation to their percentage by scenario.
Table 1. Results of the fine-tuning parameter process by entry mechanism.
Parameters Default ValuesFine-Tuned Values
Entry MechanismPenetration Rate of CAVs (%)
020406080100
Left entry laneSpeed acceptance 11.100.970.970.970.970.970.97
Time gap 10.001.331.331.331.331.331.33
Reaction time 20.800.950.890.840.780.730.67
Max acceleration 3 [m/s2]3.004.004.004.004.004.004.00
Safety margin factor 31.000.500.500.500.500.500.50
Sensitivity factor 3 1.000.500.500.500.500.500.50
GEH58.33 490.6310010097.2294.4491.67
Right entry laneSpeed acceptance 11.100.950.950.950.950.950.95
Time gap 10.001.001.001.001.001.001.00
Reaction time 20.800.940.780.760.740.720.70
Max acceleration 3 [m/s2]3.003.503.503.503.503.503.50
Safety margin factor 31.000.400.400.400.400.400.40
Sensitivity factor 31.000.500.500.500.500.500.50
GEH60.40 4100100100100100100
1 The model parameter was calibrated only for HDVs; 2 the reaction time under mixed traffic was given by a weighted average of the reaction time value for each vehicle class, where the weights were the percentage of CAVs and HDVs by scenario; 3 the model parameter was calibrated only for CAVs; 4 the GEH index was employed as a criterion for accepting the model.
According to the sensitivity analysis and manual calibration, the maximum acceleration that a vehicle can reach in any circumstance, the safety margin factor, and the sensitivity factor were fine-tuned only for CAVs. Higher values of the maximum acceleration compared to the default ones returned improved vehicle performances [42]. The safety margin factor, in turn, explains whether the vehicles can negotiate an intersection; values higher than the default ones correspond to larger headways that are usually performed by cautious drivers, while values lower than the default ones correspond to a more assertive driving behavior. The fine-tuned values of the safety margin in Table 1 resulted consistent with what Aimsun recommends to reflect the effect of a given geometry on the maneuvers to be performed [18]. At last, the sensitivity factor concerns the follower behavior when the deceleration of the leader should be estimated. According to [18], a sensitivity factor below one matches assertive behavior, while a sensitivity factor greater than one matches cautious behavior during driving. Further parameters, such as the longitudinal and lateral spacing between two vehicles, tested in the simulations, turned out to be quite insignificant since all the simulated vehicles were similarly sized.
It should be noted that the vehicle cooperation to create a gap was activated in order to allow lane changes on the two-lane circulatory roadway and entries; this parameter ranges from level 0.00 to 1.00 (where 1.00 means high aggressiveness); the value of 0.50 was set to implement the speed limit of 50 km/h on the case study. According to [26], other model parameters were excluded, not proving further benefits in the calibration process. At last, the fine-tuned parameters in Table 1 supported the aim to provide a realistic tradeoff among the different attributes of the cooperative driving on roundabouts in order to avoid too large (or short) headways which could cause an unlikely reduction (or increase) of entry capacity. Moreover, the table shows the GEH results by varying the CAV penetration rates in traffic. According to [19], the fine-tuned model could be accepted since the deviation between the CAV-based capacity curves used as target values and simulated data were smaller than 5 in (at least) 85% of the cases. The two-sample t-test tested the null hypothesis, or the equality of the means of two groups of CAV-based curves and simulated capacity data for each entry mechanism; it also ensured that there was no statistical difference between them (at the significance level α = 0.05) and, therefore, was likely due to chance. The F-test statistic was also calculated to test the equality of the sample variances. As an example, Table 2 shows the results for the right lane. There is evidence to conclude that both the t-value and the F-value should be larger than their respective critical values to reject the null hypothesis at the significance level of 0.05. The table also shows the values of the root-mean-square normalized error used to quantify the overall error of the microsimulator, and the mean percentage error used to explain under- or over-prediction in Aimsun [19]. In turn, Figure 4 shows the comparison of the CAV-based capacity curves with the simulated data for the left and right entry lanes in the mixed traffic with 60% CAVs and 40% HDVs; one can observe the decrease in the entry capacity as the circulating flow increased. The same figure shows the scattergram analysis for the mechanism of right-lane entry capacity; similar results were also returned for the left entry lane but are not reported here for reasons of synthesis.

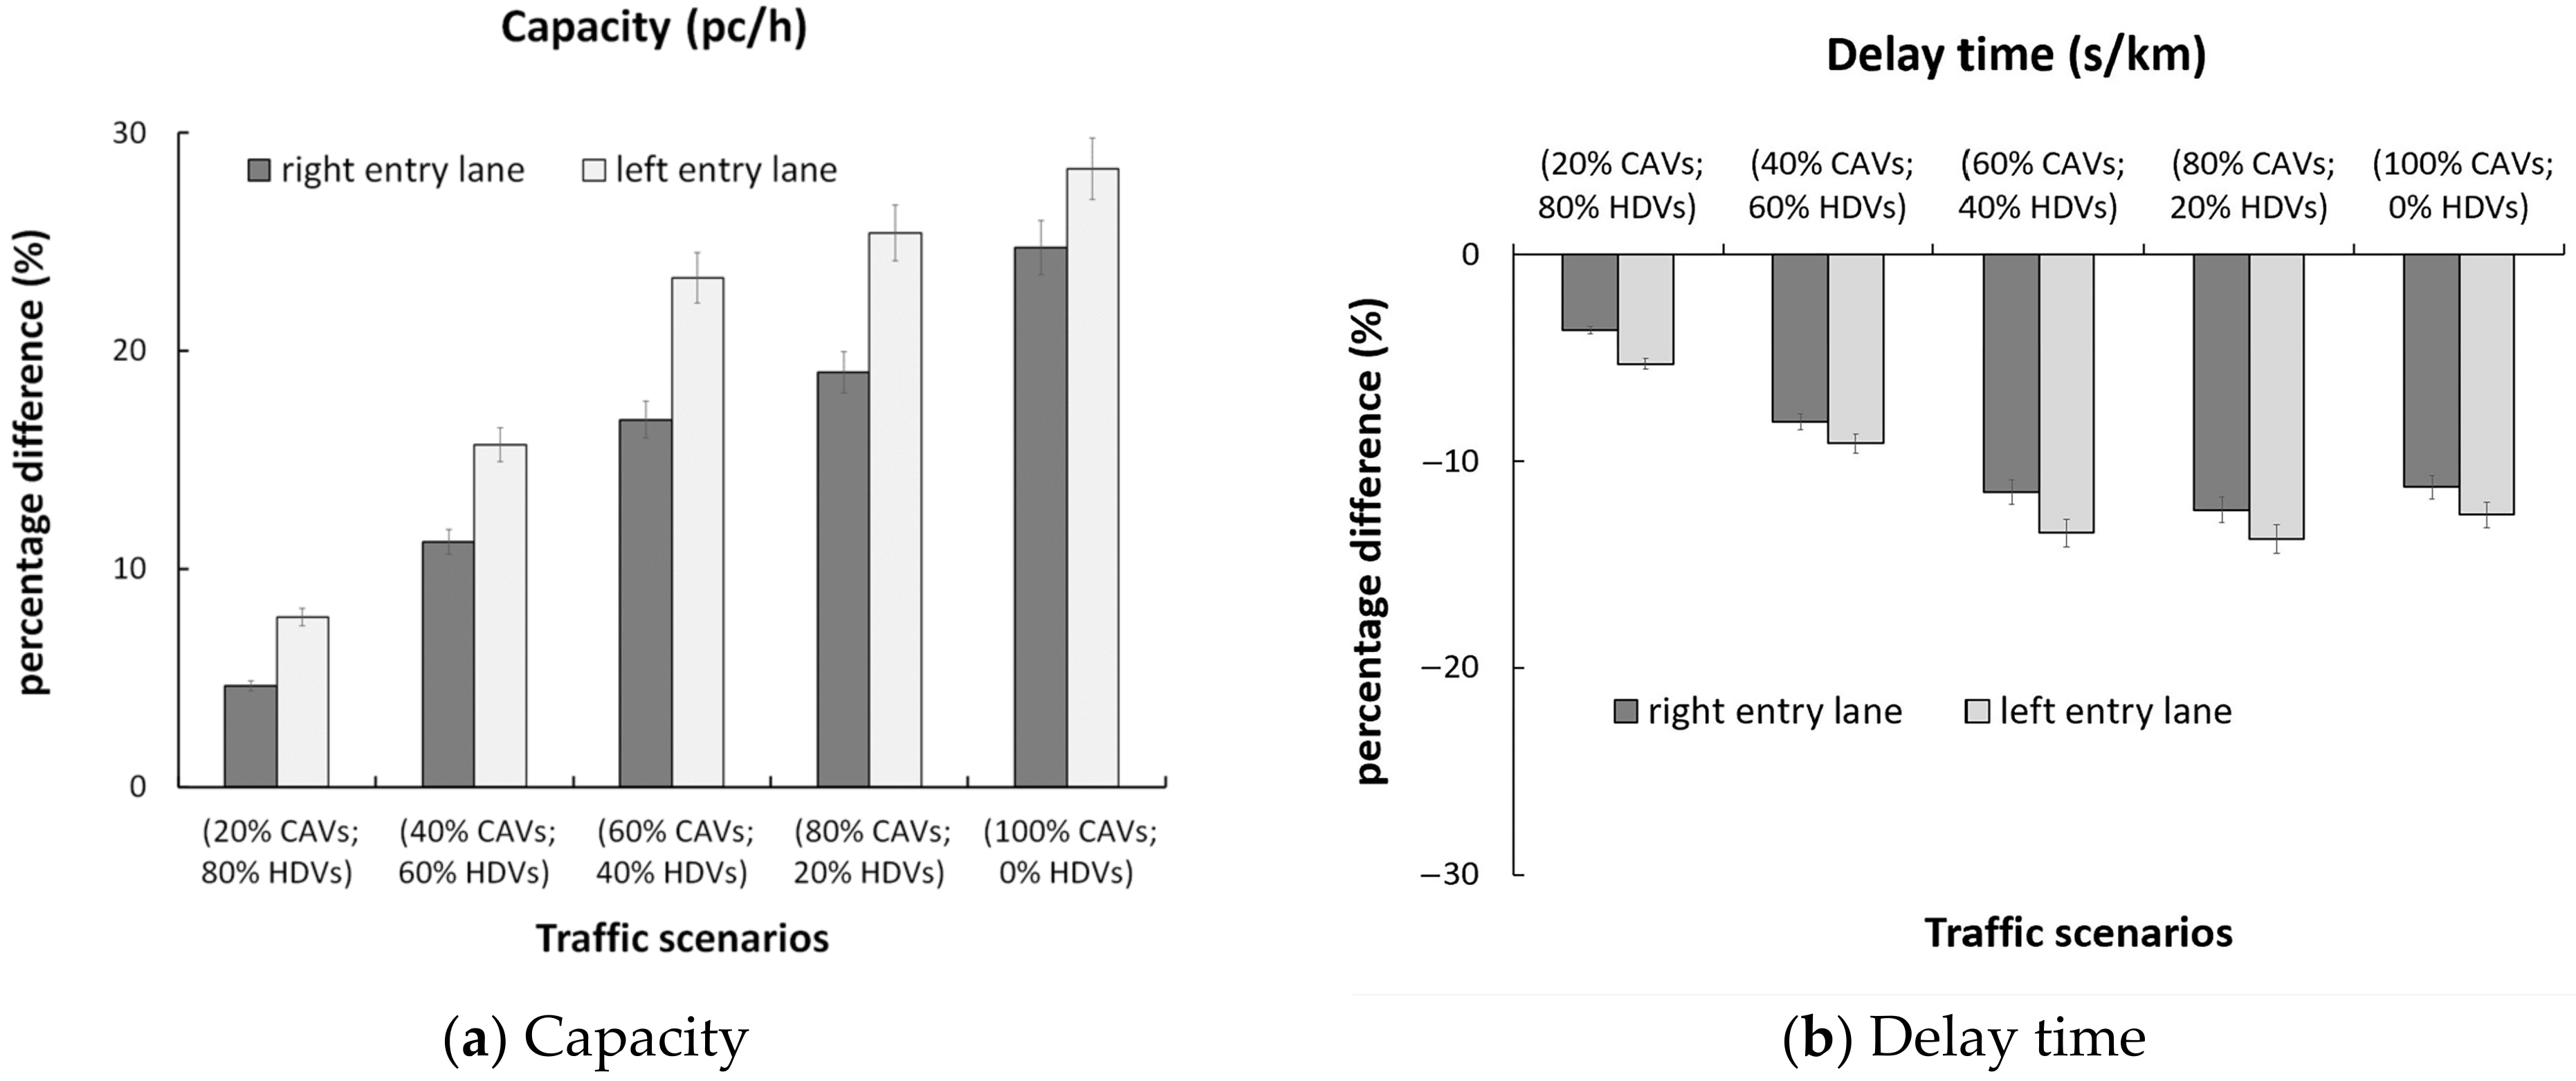
3.5. Step 5: Assessing the CAV Impact on Traffic Throughput

To investigate the performance efficiency of the large diameter roundabout modeled in Aimsun in the transitioning toward a fully CAV fleet, the CAV impact on traffic throughput was assessed compared to the base scenario made of 100% HDVs. Since the expectation of implementing CAVs in traffic is to achieve a larger throughput by creating incentives to operate the entry mechanisms among vehicles at high levels of utilization, operations at capacity were simulated (see previous section).
It should be noted that utilization can be expressed by the throughput (i.e., the vehicles entering the roundabout) compared to capacity (i.e., the maximum flow of vehicles processed by lane) [16]. Furthermore, the delay time values (s/km) were also computed since they represent the time lost by all the vehicles that the roundabout system can process compared with free-flowing traffic without the intersection installed along their path.
Thus, to explain the entry mechanisms of vehicles coming from the entry lanes, reference is made to the southbound entry in Figure 2b. On the basis of the fine-tuning process of the model parameters, the percentage differences for the entry capacity values (pc/h) and delay time values (s/km) were calculated compared to the scenario made only by HDVs as the CAV penetration rates increased (see Figure 5).
There were similar results for both lanes compared to the 100% HDVs case, since high penetration rates of CAVs improved their ability to accept smaller gaps, thus improving entry capacity and reducing delay times. Given that the assumptions related to CAVs were based on simulation and could not be calibrated to real operating conditions on the roundabout under examination, we recommend to the reader that the results presented in Figure 5 can be taken as a projection of future situations with CAVs widespread on the road network. In order to assess benefits of cooperative driving (see next step), another roundabout layout was designed by dedicating a lane to CAVs: CAVs coming from the right lane entered the roundabout, used the outer lane of the ring, and exited the right lane, thus moving on a lane reserved for them. To ensure the above behavior, the CAV dedicated lane was physically separated from the inner lane for mixed traffic with interruptions that corresponded to the entries and exits. As in the roundabout where CAVs and HDVs shared the lanes, different market penetration rates of CAVs were simulated for the situation with a lane dedicated to CAVs.
Figure 5. Traffic scenarios vs. the case made only by human driven vehicles: (a) capacity for left and right entry lanes; (b) delay time for left and right entry lanes.
Sustainability 15 09345 g005

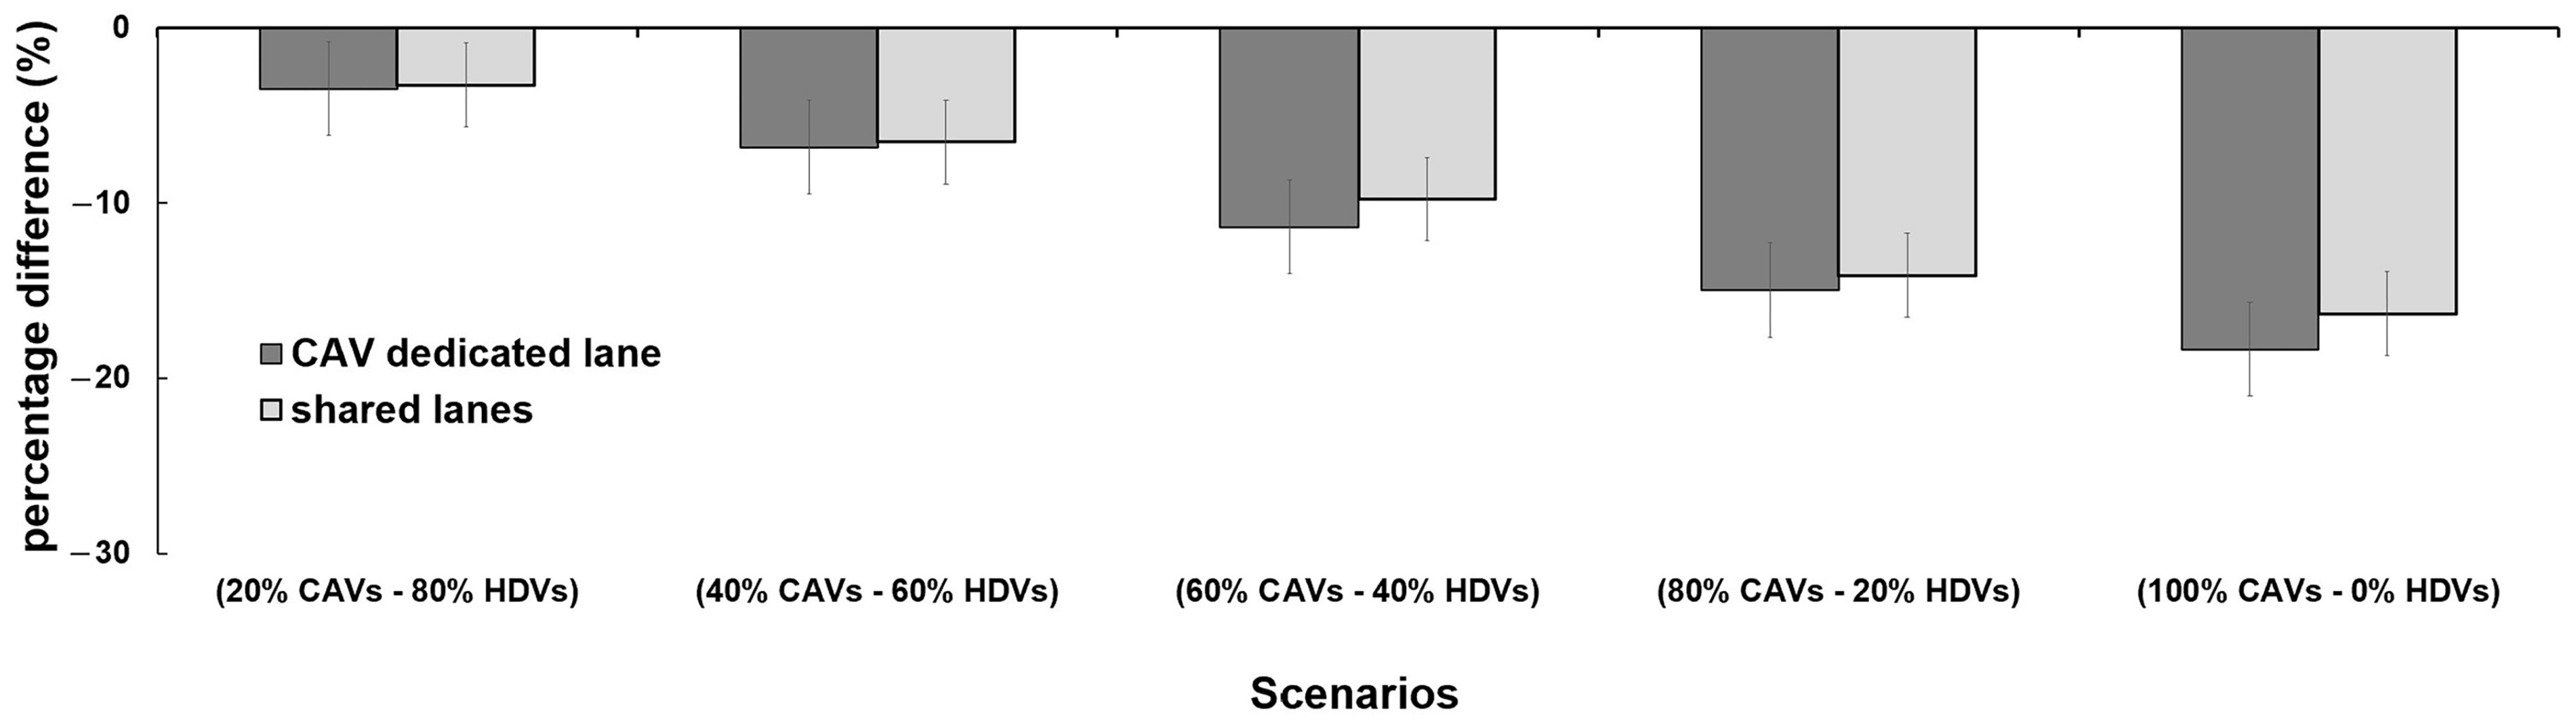
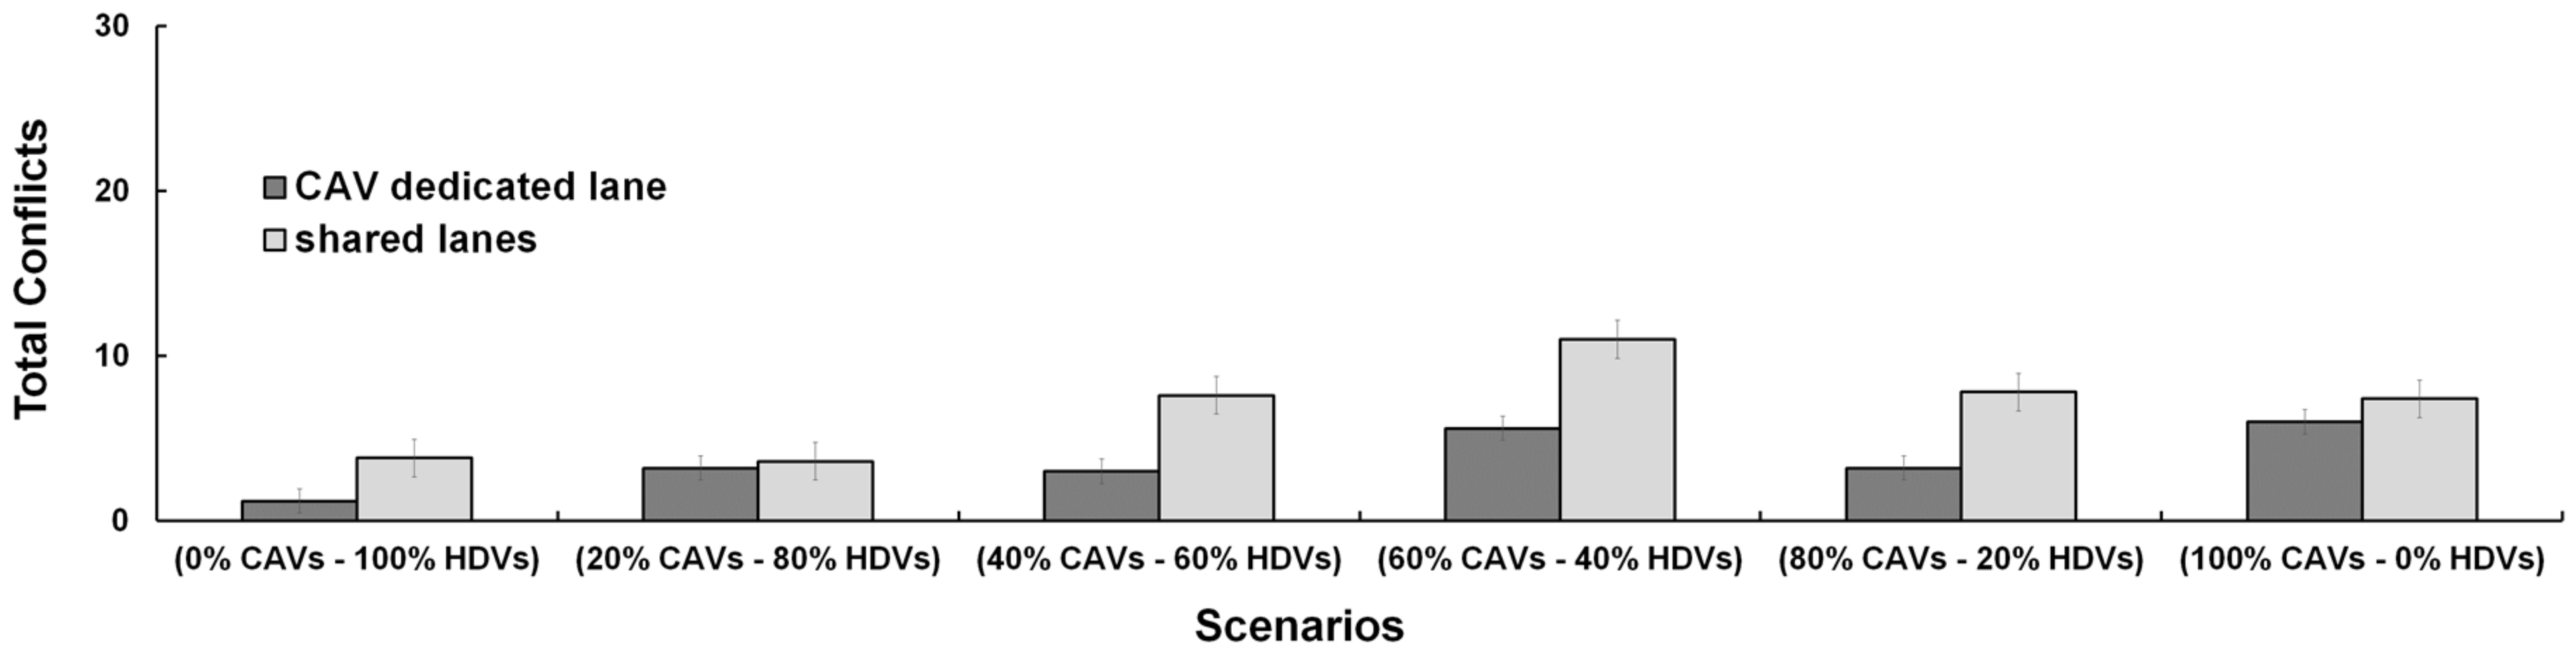
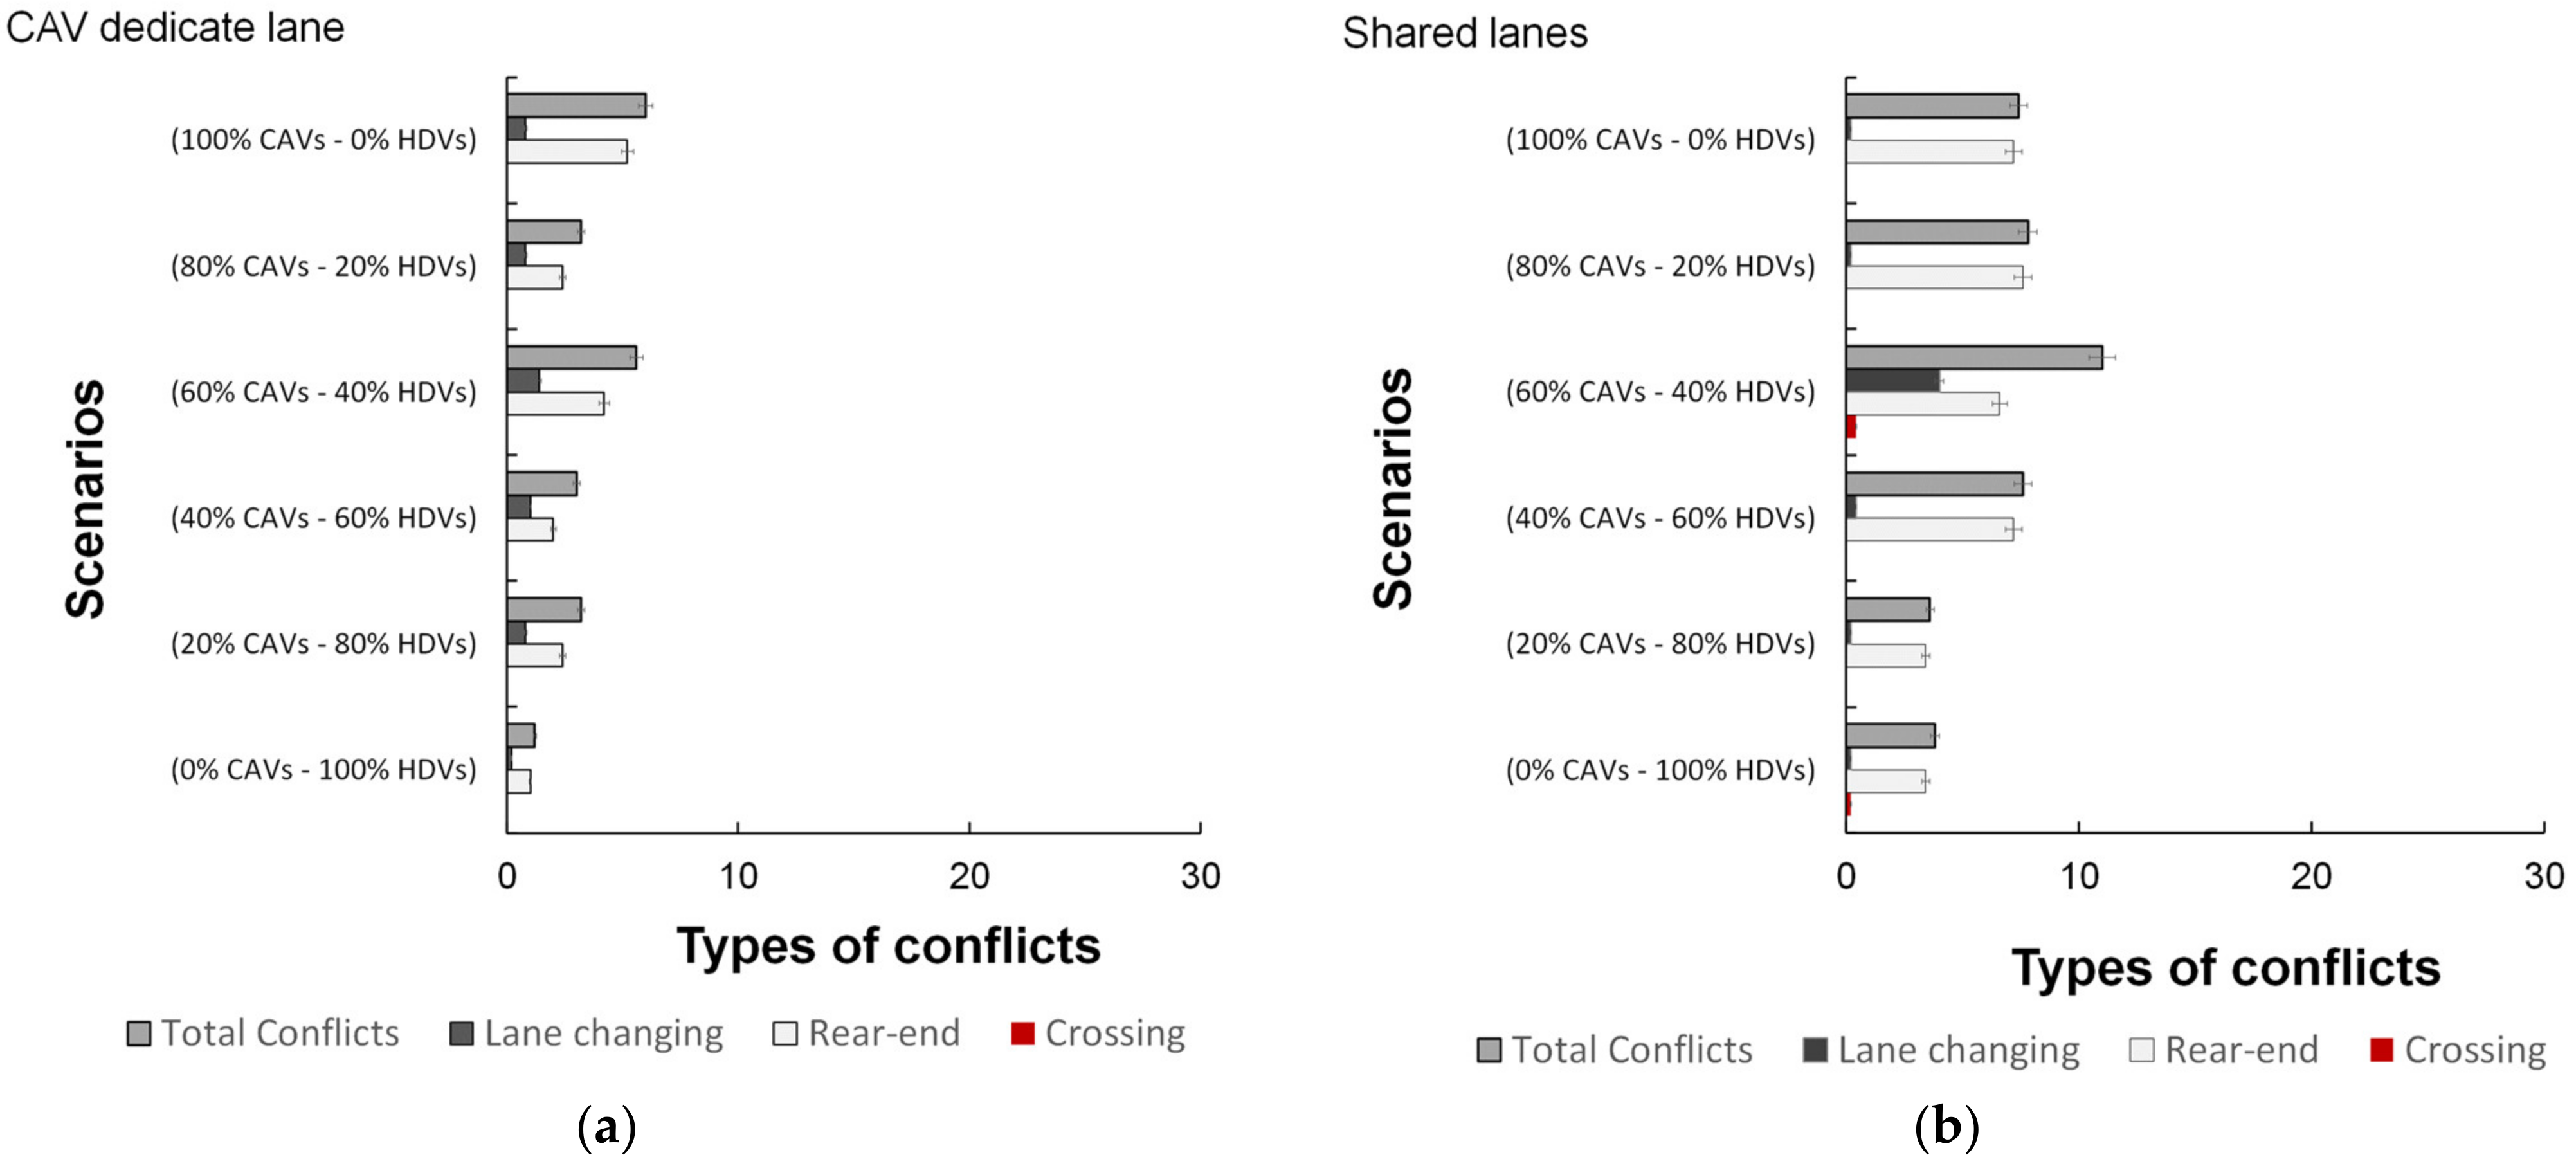
3.6. Step 6: Assessing the CAV Impact on Traffic Throughput and Safety for the Roundabout with a CAV Dedicated Lane Compared to the Mixed Traffic Situation

Step 6 consisted of assessing the impact of the cooperative driving on the safety and performance efficiency of the roundabout with a lane dedicated to CAVs compared to the mixed traffic situation, as already investigated for turbo roundabouts in previous research [43]. It should be noted that, for the roundabout where a dedicated lane was designed, the parameters fine-tuned for the right lane were applied to the right-dedicated-lane, whereas the model parameters fine-tuned for the left lane were set for the left lane with HDVs only (see Table 1). The mean values of the parameters fine-tuned for HDVs and CAVs in Table 1 were selected for the roundabout layout with the shared lanes. Balanced flow patterns were assigned as described in Section 3.4. To analyze the safety performance, the Surrogate Safety Assessment Model (SSAM) [20] was combined with Aimsun.
It is well known that the surrogate measures of safety explain the safety performances of the road facilities also using vehicle trajectories provided by traffic microsimulators [20,44,45]. Thus, the SSAM reads the trajectory files generated by Aimsun and, through surrogate measures of safety (e.g., time to collision or post encroachment time), can assess the probability of occurrence of a conflict. According to the SSAM logic, all conflict events (i.e., conflicting vehicle pairs) are listed step by step, but including all the conflicts from the previous step. Ten trajectory files for each layout (i.e., the roundabout with shared lanes and the roundabout with a dedicated lane for CAVs) were extracted from Aimsun and processed by the SSAM; the number of conflicts was then drawn from the SSAM for each roundabout. In line with [46], the filters were set to process each conflicting event and to provide output data as much as possible independent from the micro-simulators. Consistent with [45], a filter was applied to consider conflicts within 30 m of the entries as happened at the roundabout in order to avoid recording of conflicts far from the line of entry.
According to a sensitive analysis, the parameters with the greatest influence on the potential conflicts between the vehicular trajectories included the time-to-collision (TTC) and the post-encroachment time (PET) [47]. In this regard, smaller values of the TTC and PET are more likely to cause a conflict, while a TTC equal to zero represents a collision; however, the TTC should be shorter than the PET [20]. The maximum threshold of the TTC was set at the value of 1.5 s, or equal to the default value of the TTC, since other threshold values reduced from the value of 1.5 s provided less overlap for the vehicle pair in the projection timeline and returned a new maximum threshold of the TTC [46]. It should be noted that the SSAM updates the TTC values of each pair of vehicles as long as the projection timeline is without overlaps. However, a crash occurs when the projection reaches zero but the vehicles overlap. The conflict can be considered after the TTC value exceeds the threshold value again [20].
In turn, the threshold value of the PET, or the time gap between one vehicle leaving and another vehicle entering the conflict area, was set to 2.50 s, whereas the default value is 5.00 s [20]. A PET is associated with a timestep by conflict; once a conflict has ended, the final PET value can be recorded, but the TTC value can be less than its threshold value. The minimum values of TTC and PET were set to 0.10 s since zero values were processing errors to be deleted [47]. The SSAM also recorded the maximum speed of the vehicles throughout the conflict; the trajectory files returned similar values of the surrogate safety measure, however, consistent with the urban speed limit of 50 km/h. The angle (i.e., the conflict angle) of hypothetical collision between the conflicting vehicles returned values ranging from 0° (indicating a direct rear approach of the second vehicle) to around −135° (indicating an approach of the second vehicle from the left). The conflict type parameter allowed classifying the conflicts: a rear-end conflict happened when the absolute value of the conflict angle was less than 30°; a crossing conflict happened when the absolute value of the conflict angle was wider than 85°; otherwise, a lane-changing conflict occurred. It should be said that a rear-end conflict involves two vehicles in the same lane at the same time, while lane changing involves two vehicles which have changed lane. In the cases in which the vehicles enter or exit the roundabout during a conflict event, the SSAM logic considered a rear-end or lane-changing conflict according to the conflict angle values and the underlying roundabout configuration with a lane dedicated to CAVs or shared lanes. Other surrogate safety measures concerning driving behavior remained at the default values to avoid unrealistic maneuvers.
Figure 6 shows the percentage difference in travel time (s/km) compared to the scenario with HDVs only, while Figure 7 shows the number of conflicts on the roundabout where CAVs and HDVs share the same lanes or CAVs used a dedicated lane. Figure 8 shows the number of conflicts by type. It should be noted that the number of total conflicts and conflicts by type were in both cases the average number of conflicts recorded by 10 trajectory files elaborated by the SSAM.
It should be noted that the analysis carried out in this study necessarily reflects the assumptions underlying the conceptualization of the roundabout network model operating as an isolated node of the road network. In this regard, how accurately the simulated traffic conflicts are consistent with measurable on-the-field conflicts relates to matters outside the objectives of this research activity; among other things, this is still an open field of research (see, e.g., [48]).
Figure 6. Travel time percentage differences in the roundabout layout with a dedicated lane for CAVs compared to the roundabout layout with shared lanes.
Sustainability 15 09345 g006
Figure 7. Total conflicts in the roundabout with a lane dedicated to CAVs compared to the layout with shared lanes.
Sustainability 15 09345 g007
Figure 8. Types of conflicts at the examined roundabouts: (a) case with a CAV dedicated lane; (b) case with shared lanes.
Sustainability 15 09345 g008

4. Results

Operational and safety performances improved by dedicating an exclusive lane to CAVs compared to the roundabout where vehicles share the lanes and lane-changing may occur (see Figure 6 and Figure 7). The lane dedicated to CAVs separates the two classes of vehicles here considered, thus ensuring platooning, and effectively drives the travel time and number of total conflicts down [34,49]. Figure 6 shows a slightly higher reduction in the travel times (i.e., the total possible routes of vehicles recorded by the control detectors) on the roundabout with a lane dedicated to CAVs than the roundabout with the shared lanes. The benefit of the lane dedicated to CAVs is evident in the scenario with 100% CAVs, where the percentage reduction in travel time is equal to about 18% compared to the case of all human-driven vehicles; the percentage reduction in travel time is equal to about 16% where CAVs and HDVs share the lanes compared to the case of all human-driven vehicles.
Concerning the total conflicts, the percentage reduction is evident where the dedicated lane is designed than the layout where the entry and circulating lanes are shared by the two classes of vehicles (see Figure 7). Despite the decreasing trend, the expected safety benefits of the cooperative driving than traditional driving systems tend to decrease in the scenario with 100% CAVs. It should be noted that the assumptions of assertive driving behavior used in the simulation runs (see Table 1) may have reduced the safety margin among the vehicles, thus affecting the negotiation among CAVs at roundabouts. According to [34], high traffic volumes made of 100% CAVs may compromise the safety benefits since shorter headways between subsequent vehicles contribute to increasing rear-end conflicts (see Figure 8). In this regard, the SSAM returned a percentage of about 85% rear-end conflicts where a lane dedicated to CAVs is designed compared to the percentage of 95% where the shared lanes are operating. In this regard, the SSAM considers the entry and exit maneuvers as lane-changing events, whose number may depend on the behavioral assumptions of the underlying simulation model and the assumed threshold values. Although the SSAM filters were set in line with [46], where two microsimulators were used to avoid the setting of software-dependent parameters, a comparison with other microsimulators may be necessary to test further aspects of CAV driving on roundabouts. Together with the hypotheses of assertive behavior used to simulate CAVs, the lane separation may also force the trajectories of entry or exit performed by them and then increase the percentage of lane-changing conflicts returned by the SSAM (see Figure 8). This type of conflict is, however, expected in the mixed traffic situation, and it is more evident where the two classes of vehicles are almost balanced (see the scenario with 60% CAVs and 40% HDVs in Figure 8b). Thus, the different distribution by type of conflict can be also due to the different way to select the driving lane up to the desired exit in the roundabout layouts here examined. At last, although the results point to the promising effects of growing penetration rates of CAVs, it should be noted that they show only a projection of what might happen if the cooperative driving systems were fully widespread on the road network.

5. Discussion

The novel opportunities of cooperative driving can further increase road safety and efficiency since vehicles can move in a coordinated manner also with harmonizing effect on mixed traffic situations at different levels and scales of complexity [5,50]. Connectivity will help road users to better anticipate upcoming events (e.g., the horizontal and vertical alignment of the road routes, the traffic states, and neighboring vehicle movements), future events, and situations that may be perceived as potentially hazardous during driving; in turn, automation will allow vehicles to adjust their movements more precisely to anticipate imminent events. However, the implementation of CAVs in real traffic where they have to interact with nearby human-driven vehicles is still in development and far from the full experimental validation [51]. While many studies have shown a myriad of prominent applications on vehicle design requirements, V2V or V2I communications, jam dynamics, CAV platooning, and reduced infrastructure footprint on highways (e.g., [7,9,52,53,54]), only a few studies have been undertaken to determine how CAVs can negotiate intersections and roundabouts, a fact which also clearly influences land-use and urban planning (e.g., [30,55,56]).
Assumptions have to be made to model the gap-acceptance behavior of CAVs entering a roundabout; the types of conflicting vehicles, together with the entry mechanism and the way in which the priority is negotiated, determine the critical and follow-up headways on which the capacity depends [5,17]. Among the factors that affects the CAV ability to improve capacity, a higher proportion of CAVs can realize the competitive advantages of connectivity.
The simulation of free-flowing traffic to capacity allowed exploring the entire range of operations for the entry mechanisms here examined (i.e., the right lane and the left lane). In this regard, the CACC feature enabled by V2V communication allowed CAVs to accept shorter gaps safely than traditional vehicles. Thus, Figure 4a shows the decrease in the entry capacity as the circulating flow increased. The comparison of the CAV-based capacity curves with the simulated data in the same figure for the scenario with 60% of CAVs and 40% of HDVs confirmed the ability of Aimsun to capture variations in driving behavior for the vehicle classes within the dataset, and to return simulated data of capacity fitting well with the corresponding target values (see Table 1). According to [34], the accuracy of the results depended mainly on the accuracy of the calibration. The versatility of Aimsun was also confirmed by the statistical tests (see Table 2 and Figure 4b).
The throughput of the roundabout improved with the presence of enough CAVs in the network (see also [57]). The CACC systems when in use allowed the simulated vehicles to accept shorter time gaps than human drivers and to increase the roadway capacity (see Figure 5a). Slightly higher percentage differences for the left lane than the right lane depended on a greater readiness to enter required to vehicles coming from the left lane; they mainly needed to turn left or travel through the roundabout and, once entered, had to move forward more quickly than vehicles coming from the right lane. It can be observed that, in the highest CAV penetration rate, the percentage increase in starting capacity was 25% for the right lane; an additional percentage increase of 3% occurred for the left lane compared to the case of human driven vehicles. Similar results were also shown in the literature regarding the impact of automated driving on roundabout capacity [58] and mixed traffic situations [59]. In turn, the delay time values tended to significantly reduce up to the scenario made of 60% CAVs and 40% HDVs with percentage differences of about 11% for the right lane and 13% for the left lane; the percentage reductions tended to stabilize for higher penetration rates of CAVs (see Figure 5b).
The size of selected roundabout allowed designing a lane dedicated to CAVs, while the suburban character of its context of installation made the traffic situation easily managed by CAVs. Aimsun was employed to calibrate the model parameters and then coupled with the SSAM to perform the safety analysis.
The results show that the travel times decreased in the roundabout designs under examination as the CAV penetration rate increased. In the condition of low penetration rate of CAVs (i.e., 20% CAVs and 80% HDVs), the percentage reduction in travel times was about 3% compared to the case of all-human driven vehicles in both roundabout layouts (see Figure 6); the benefits of the dedicated lane were evident at high penetration rates of CAVs (i.e., from 60% to 100% CAVs). By way of example for the mixed traffic situation with 60% CAVs and 40% HDVs, Figure 6 shows percentage differences of 11.40% and 9.80% in the travel times on the roundabout with a lane dedicated to CAVs and the roundabout with shared lanes, respectively. There was a percentage reduction of 18.40% in travel times in the scenario 100% CAVs compared to the case made only by human drivers for the roundabout with a dedicated lane because of better driving performance of a fully CAV fleet than the case of all-human driven vehicles; the percentage reduction was about 16% in the roundabout without a lane dedicated to CAVs when the comparison was performed at the edges of the range (i.e., 100% CAVs vs. 100% HDVs).
In turn, Figure 7 and Figure 8 show the efforts to assess the safety performance of the roundabouts under examination. According to [43,44,60,61], the configuration with a dedicated lane separated the CAVs and HDVs, thus relegating the lane changing mainly to the approach areas to perform entry and exit maneuvers, but depending on the availability of acceptable gaps where vehicles could advance side by side.
The dedicated lane for CAVs halved the number of total conflicts compared to the initial counterpart with shared lanes; the redesign of the large roundabout into a layout with a CAV dedicated lane returned a percentage reduction of total conflicts on average just over 50% (see scenarios from 40% to 80% CAVs) compared to the shared traffic situation (see Figure 7). The percentage difference decreased in the scenario with a fully CAV fleet due to the concomitant increase in rear-end conflicts; there were percentages of rear-end conflicts of about 85% and 95% in the design option with the CAV dedicated lane and in the counterpart without it, respectively (see Figure 8). This was also confirmed by the simulations of the vehicles turning left (or traveling through the roundabout) which tended to preselect the left lane before entering, and the vehicles turning right which tended to preselect the right lane to enter regardless of the presence of the raised lane divisors, thus modifying the assumed conflict patterns [17].
In conclusion, the methodological framework to assess road infrastructure safety and performance efficiency in the transition to cooperative driving yielded some fruitful results. In this view, the paper presents the research efforts aimed at better understanding the performance of CAVs where the curvilinear design may lead to misinterpretation of driving intentions or simply complicate the negotiation of the system.
However, it may be useful to address some further issues.
(1)
This research was primarily focused on the comparison in terms of safety and operational performances at the single road entity level. Moreover, the roundabout network model simulated in Aimsun meets the geometry and traffic characteristics of a real-life large roundabout chosen as case study where vehicular traffic flows were balanced along the major and minor directions of driving. Future developments should also be conducted at road corridor or network level, varying not only the roundabout geometry but also the traffic demand matrices to investigate the effects of different geometric shapes (i.e., outer diameter size, number of entry, exit and circulating lanes, etc.), spacing, and traffic patterns on the performance efficiency and speed management on roundabouts.
(2)
Despite the observed effects on traffic safety and efficiency due to the design of dedicated lanes (with mandatory or optional use) to separate CAVs from HDVs on roundabouts, nothing can be said about conflicts attributable only to CAVs in mixed traffic situations and their severity. Thus, future research actions should be directed toward addressing the methodological limitations in the analysis of shared situations where CAVs and HDVs interact, in order to better incorporate the abovementioned conflict characteristics into decision support tools.
(3)
The research results were given in the terms of an evaluation framework of the model’s practical application and simulation verification, but they showed only a projection of what might happen if CAVs were fully widespread on the road network. This perspective also highlights the need for efficient methods to assess the potential of CAVs and to enhance their throughput through an intelligent road management in view of future mobility strategies. It is appropriate to deepen issues on smart roundabout design to make the road network in operation suitable for the progressive transition toward the full implementation of CAV technologies. There is also a need to hypothesize how a control area performs in order to implement communications among CAVs with the road infrastructure manager system (see [62] for the turbo roundabout case).

6. Conclusions

There is increasing interest in CAVs, since their full implementation will transform road transportation and promote social and economic change. Transition toward cooperative driving systems still requires understanding of the key issues involved in adapting the geometry of road infrastructures to the kinematics of CAVs in order to achieve the proper balance between road safety and traffic efficiency. Despite the clear benefits of CAVs, several limitations will need to be addressed before their widespread implementation becomes possible. There is a need to manage HDVs and CAVs mixed in traffic, especially at roundabouts where the curvilinear feature of geometric design may complicate the mutual interpretation of the driving intentions among vehicles.
On the basis of the above, this paper proposed a simulation-based methodological framework to assess the impacts of CAVs on operational and safety performances at roundabouts. The size of the selected roundabout allowed installing a lane dedicated to CAVs, while the suburban character of its context made the traffic situation easily managed by CAVs. Microscopic simulation from free-flowing traffic to capacity on the roundabout designed in Aimsun, consistent with the geometry and traffic characteristics of the real counterpart, allowed identifying some behavioral parameters of cooperative driving suitable to simulate road situations with growing proportions of CAVs. Aimsun was used to calibrate the model parameters and was coupled with the SSAM to perform the safety performance analysis. Despite the effects on traffic throughput and safety with CAVs, the advantage of a dedicated lane is to separate HDVs from CAVs, thus reducing human error and potential conflicts among vehicles.
The benefit of the lane dedicated to CAVs was evident in the traffic made only by CAVs where the percentage reduction in travel time was equal to about 18% compared to the traffic made only by human drivers; the percentage reduction in travel time was equal to about 16% where CAVs and HDVs share the lanes compared to the case with 100% human-driven vehicles. Concerning the total conflicts, the percentage reduction was more evident where the dedicated lane was designed than the situation where the entry and circulating lanes were shared by CAVs and HDVs. However, the expected safety benefits of cooperative driving compared to traditional driving systems tended to decrease in the scenario made only by CAVs. The assumptions of assertive driving behavior used in simulation may have reduced the safety margin among CAVs, thus affecting their negotiation and contributing to increasing rear-end conflicts. However, nothing can be said about conflicts due only to CAVs in mixed traffic situations and conflict severity based on the analysis tools available to date.
Thus, further research actions should be directed toward addressing the methodological limitations in the analysis with CAVs to better incorporate the conflict characteristics into decision support tools. Moreover, many more intersections and traffic conditions should be studied to have a more comprehensive and detailed vision of CAVs at corridor or road network levels and to assess the potential benefits of these technologies in the face of growing demands for smart mobility. Since the roads of the future need high levels of adaptation, automation, and resilience, guidance to select the intersection types suitable to maintain stable operation against natural disruptions or manmade events should also be provided. Thus, which intersection geometry or type of control mode (i.e., stop signs, roundabouts, or traffic signals) may affect the efficiency, safety and resilience at intersections and roundabouts before and after a disruption will be a research question to answer in future developments of the research. Lastly, future developments should also include a comprehensive sustainability assessment of the energy and emission impacts of the full lifecycle of CAVs from an operational perspective, to better understand the broader direct and indirect effects at the mobility system level.

Author Contributions

Conceptualization, M.L.T., E.M., A.G. and T.G.; methodology, M.L.T., E.M., A.G. and T.G.; software, M.L.T., E.M., A.G. and T.G.; validation, M.L.T., E.M., A.G. and T.G.; formal analysis, M.L.T., E.M., A.G. and T.G.; investigation, M.L.T., E.M., A.G. and T.G.; resources, M.L.T., E.M., A.G. and T.G.; data curation, M.L.T., E.M., A.G. and T.G.; writing—original draft preparation, M.L.T., E.M., A.G. and T.G.; writing—review and editing, M.L.T., E.M., A.G. and T.G.; visualization, M.L.T., E.M., A.G. and T.G.; supervision, E.M., A.G. and T.G.; project administration, M.L.T., E.M., A.G. and T.G.; funding acquisition, M.L.T., E.M., A.G. and T.G. All authors have read and agreed to the published version of the manuscript.

Funding

This research received no external funding.

Institutional Review Board Statement

Not applicable.

Informed Consent Statement

Not applicable.

Data Availability Statement

Data can be provided upon kind request to the corresponding authors.

Acknowledgments

The authors would like to thank the reviewers for their comments which improved the paper.

Conflicts of Interest

The authors declare no conflict of interest.

References

  1. Javed, A.R.; Shahzad, F.; Rehman, S.U.; Zikria, Y.B.; Razzak, I.; Zunera, J.; Xu, G. Future smart cities: Requirements, emerging technologies, applications, challenges, and future aspects. Cities 2022, 129, 103794. [Google Scholar] [CrossRef]
  2. Lv, Z.; Shang, W. Impact of Intelligent transportation systems on energy conservation and emission reduction of transport systems: A comprehensive review. Green Technol. Sustain. 2023, 1, 100002. [Google Scholar] [CrossRef]
  3. Rana, M.M.; Hossain, K. Connected and Autonomous Vehicles and Infrastructures: A Literature Review. Int. J. Pavement Res. Technol. 2021, 14, 1–21. [Google Scholar] [CrossRef]
  4. SAE International. Taxonomy and Definitions for Terms Related to Driving Automation Systems for On-Road Motor Vehicles; SAE International: Warrendale, PA, USA, 2018. [Google Scholar]
  5. Brost, M.; Deniz, Ö.; Österle, I.; Ulrich, C.; Senzeybek, M.; Hahn, R.; Schmid, S. Energy Consumption of Connected and Automated Vehicles. In Electric, Hybrid, and Fuel Cell Vehicles, Encyclopedia of Sustainability Science and Technology, 2nd ed.; Elgowainy, A., Ed.; Springer: New York, NY, USA, 2021; pp. 216–224. [Google Scholar]
  6. Karbasi, A.H.; Mehrabani, B.B.; Cools, M.; Sgambi, L.; Saffarzadeh, M. Comparison of Speed-Density Models in the Age of Connected and Automated Vehicles. Transp. Res. Record 2022, 2677, 849–865. [Google Scholar] [CrossRef]
  7. Wang, Y.; Yan, Y.; Shen, T.; Bai, S.; Hu, J.; Xu, L.; Yin, G. An Event-Triggered Scheme for State Estimation of Preceding Vehicles Under Connected Vehicle Environment. IEEE Trans. Intell. Veh. 2023, 8, 583–593. [Google Scholar] [CrossRef]
  8. Duggal, A.S.; Singh, R.; Gehlot, A.; Gupta, L.R.; Akram, S.V.; Prakash, C.; Singh, S.; Kumar, R. Infrastructure, mobility and safety 4.0: Modernization in road transportation. Technol. Soc. 2021, 67, 101791. [Google Scholar] [CrossRef]
  9. Jang, J.; Baek, J.; Lim, K.; Ro, Y.; Yoon, S.; Jang, S. A Study on V2I based Cooperative Autonomous Driving. In Proceedings of the 2023 International Conference on Electronics, Information, and Communication (ICEIC), Singapore, 5–8 February 2023; pp. 1–3. [Google Scholar] [CrossRef]
  10. Liu, Y.; Tight, M.; Sun, Q.; Kang, R. A systematic review: Road infrastructure requirement for Connected and Autonomous Vehicles (CAVs). J. Phys. Conf. Ser. 2019, 1187, 042073. [Google Scholar] [CrossRef]
  11. Martin-Gasulla, M.; Elefteriadou, L. Traffic management with autonomous and connected vehicles at single-lane roundabouts. Transp. Res. Part C Emerg. Technol. 2021, 125, 102964. [Google Scholar] [CrossRef]
  12. Guo, Q.; Ban, X.B.; Abdul Aziz, H.M. Mixed traffic flow of human driven vehicles and automated vehicles on dynamic transportation networks. Transp. Res. Part C Emerg. Technol. 2021, 128, 103159. [Google Scholar] [CrossRef]
  13. Gong, B.; Wang, F.; Lin, C.; Wu, D. Modeling HDV and CAV Mixed Traffic Flow on a Foggy Two-Lane Highway with Cellular Automata and Game Theory Model. Sustainability 2022, 14, 5899. [Google Scholar] [CrossRef]
  14. Ivanjko, E.; Kušic, K.; Greguric, M. Simulational analysis of two controllers for variable speed limit control. Proc. Inst. Civ. Eng.—Transp. 2022, 175, 413–425. [Google Scholar] [CrossRef] [Green Version]
  15. Raju, N.; Farah, H. Evolution of Traffic Microsimulation and Its Use for Modeling Connected and Automated Vehicles. J. Adv. Transp. 2021, 2021, 2444363. [Google Scholar] [CrossRef]
  16. National Academies of Sciences, Engineering, and Medicine. Roundabouts: An Informational Guide, 2nd ed.; The National Academies Press: Washington, DC, USA, 2010. [CrossRef]
  17. National Academies of Sciences, Engineering, and Medicine. Highway Capacity Manual 7th Edition: A Guide for Multimodal Mobility Analysis; The National Academies Press: Washington, DC, USA, 2022. [CrossRef]
  18. Aimsun Next, Version 20. Dynamic Simulator User Manual. TSS-Transport Simulation Systems: Barcelona, Spain, 2020.
  19. Barceló, J. Fundamentals of Traffic Simulation; Springer: London, UK, 2010. [Google Scholar]
  20. Gettman, D.; Pu, L.; Sayed, T.; Shelby, S.G. Surrogate Safety Assessment Model and Validation: Final Report; Georgetown Pike (US) Report FHWA HRT 08–051; Federal Highway Administration: Washington, DC, USA, 2008.
  21. Michałowska, M.; Ogłoziński, M. Autonomous Vehicles and Road Safety. In Smart Solutions in Today’s Transport: 17th International Conference on Transport Systems Telematics, TST 2017, Katowice–Ustroń, Poland, 5–8 April 2017, Selected Papers 17; Springer International Publishing: Cham, Switzerland, 2017; Volume 715, pp. 191–202. [Google Scholar] [CrossRef]
  22. Rahman, M.S.; Abdel-Aty, M. Longitudinal safety evaluation of connected vehicles’ platooning on expressways. Accid. Anal. Prev. 2018, 117, 381–391. [Google Scholar] [CrossRef] [PubMed]
  23. Rahman, M.S.; Abdel-Aty, M.; Wang, L.; Lee, J. Understanding the Highway Safety Benefits of Different Approaches of Connected Vehicles in Reduced Visibility Conditions. Transp. Res. Rec. J. Transp. Res. Board 2018, 2672, 91–101. [Google Scholar] [CrossRef]
  24. VISSIM, Version 5.30. User Manual PTV Planug Transport Verkehr AG. Manufacture: Karlsruhe, Germany, 2011.
  25. Ekram, A.; Rahman, M.S. Effects of Connected and Autonomous Vehicles on Contraflow Operations for Emergency Evacuation: A Microsimulation Study. In Proceedings of the Transportation Research Board 97th Annual Meeting, Washington, DC, USA, 7–11 January 2018. [Google Scholar]
  26. Tumminello, M.L.; Macioszek, E.; Granà, A.; Giuffrè, T. Simulation-Based Analysis of “What-If” Scenarios with Connected and Automated Vehicles Navigating Roundabouts. Sensors 2022, 22, 6670. [Google Scholar] [CrossRef] [PubMed]
  27. Qiao, J.; Zhang, D.; de Jonge, D. Virtual Roundabout Protocol for Autonomous Vehicles. In Advances in Artificial Intelligence. AI 2018; Mitrovic, T., Xue, B., Li, X., Eds.; Lecture Notes in Computer Science; Springer: Cham, Switzerland, 2018; Volume 11320, pp. 773–782. [Google Scholar]
  28. Mauro, R. Calculation of Roundabouts. Capacity, Waiting Phenomena and Reliability; Springer: Berlin/Heidelberg, Germany, 2010. [Google Scholar] [CrossRef]
  29. Martin-Gasulla, M.; Elefteriadou, L. Single-Lane Roundabout Manager under Fully Automated Vehicle Environment. Transp. Res. Rec. J. Transp. Res. Board 2019, 2673, 439–449. [Google Scholar] [CrossRef]
  30. Wu, Y.; Zhu, F. Junction management for connected and automated vehicles: Intersection or roundabout? Sustainability 2021, 13, 9482. [Google Scholar] [CrossRef]
  31. Mohebifard, R.; Hajbabaie, A. Trajectory control in roundabouts with a mixed fleet of automated and human-driven vehicles. Comput. -Aided Civ. Infrastruct. Eng. 2022, 37, 1959–1977. [Google Scholar] [CrossRef]
  32. Wu, R.; Jia, H.; Yang, L.; Miao, H.; Lin, Y.; Zhang, Y. A distributed trajectory control strategy for the connected automated vehicle in an isolated roundabout. IET Intell. Transp. Syst. 2022, 16, 232–251. [Google Scholar] [CrossRef]
  33. Jalil, K.; Xia, Y.; Zahid, M.N.; Manzoor, T. A Speed Optimization Strategy for Smooth Merging of Connected and Automated Vehicles at T-Shape Roundabout. IEEE Access 2022, 10, 76953–76965. [Google Scholar] [CrossRef]
  34. Anagnostopoulos, A.; Kehagia, F. CAVs and roundabouts: Research on traffic impacts and design elements. Transp. Res. Procedia 2020, 49, 83–94. [Google Scholar] [CrossRef]
  35. Pérez, J.; Milanés, V.; de Pedro, T.; Vlacic, L. Autonomous driving manoeuvres in urban road traffic environment: A study on roundabouts. IFAC Proc. 2011, 44, 13795–13800. [Google Scholar] [CrossRef] [Green Version]
  36. Morando, M.; Truong, L.; Vu, H. Investigating safety impacts of autonomous vehicles using traffic micro-simulation. In Proceedings of the Australasian Transport Research Forum, Auckland, New Zealand, 27–29 November 2017. [Google Scholar]
  37. Tibljas, D.; Giuffre, T.; Surdonja, S.; Trubia, S. Introduction of Autonomous Vehicles: Roundabouts Design and Safety Performance Evaluation. Sustainability 2018, 10, 1060. [Google Scholar] [CrossRef] [Green Version]
  38. Gora, P.; Katrakazas, C.; Drabicki, A.; Islam, F.; Ostaszewski, P. Microscopic traffic simulation models for connected and automated vehicles (CAVs)—State-of-the-art. Procedia Comput. Sci. 2020, 170, 474–481. [Google Scholar] [CrossRef]
  39. Italian Ministry of Infrastructure and Transport. Functional and Geometric Standards for Road Intersections; Italian Ministry of Infrastructure and Transport: Rome, Italy, 2006.
  40. Hollander, Y.; Liu, R. The principles of calibrating traffic microsimulation models. Transportation 2008, 35, 347–362. [Google Scholar] [CrossRef]
  41. Giuffrè, O.; Granà, A.; Tumminello, M.L.; Sferlazza, A. Capacity-based calculation of passenger car equivalents using traffic simulation at double-lane roundabouts. Simul. Model. Pract. Theory 2018, 81, 11–30. [Google Scholar] [CrossRef]
  42. Gipps, P.G. A Behavioural Car-Following Model for Computer Simulation. Transp. Res. Part B 1981, 15, 105–111. [Google Scholar] [CrossRef]
  43. Giuffrè, T.; Granà, A.; Trubia, S. Safety evaluation of turbo-roundabouts with and without internal traffic separations considering autonomous vehicles operation. Sustainability 2021, 13, 8810. [Google Scholar] [CrossRef]
  44. Han, I.; Pham, D.T. Safety analysis of roundabouts and avoidance of conflicts for intersection-advanced driver assistance systems. Cogent Eng. 2022, 9, 2112813. [Google Scholar] [CrossRef]
  45. Giuffrè, T.; Trubia, S.; Canale, A.; Persaud, B. Using microsimulation to evaluate safety and operational implications of newer roundabout layouts for European road networks. Sustainability 2017, 9, 2084. [Google Scholar] [CrossRef] [Green Version]
  46. Giuffrè, O.; Granà, A.; Tumminello, M.L.; Giuffrè, T.; Trubia, S. Surrogate Measures of Safety at Roundabouts in AIMSUN and VISSIM Environment. In Roundabouts as Safe and Modern Solutions in Transport Networks and Systems; Macioszek, E., Akçelik, R., Sierpiński, G., Eds.; TSTP 2018. Lecture Notes in Networks and Systems; Springer: Cham, Switzerland, 2019; Volume 52. [Google Scholar] [CrossRef]
  47. Saleem, T.; Persaud, B.; Shalaby, A.; Ariza, A. Can Microsimulation be used to Estimate Intersection Safety? Transp. Res. Rec. 2018, 2432, 142–148. [Google Scholar] [CrossRef]
  48. Bulla-Cruz, L.A.; Laureshyn, A.; Lyons, L. Event-based road safety assessment: A novel approach towards risk microsimulation in roundabouts. Measurement 2020, 165, 108192. [Google Scholar] [CrossRef]
  49. Lo Cigno, R.; Segata, M. Cooperative driving: A comprehensive perspective, the role of communications, and its potential development. Comput. Commun. 2022, 193, 82–93. [Google Scholar] [CrossRef]
  50. Taiebat, M.; Brown, A.L.; Safford, H.R.; Qu, S.; Xu, M. A Review on Energy, Environmental, and Sustainability Implications of Connected and Automated Vehicles. Environ. Sci. Technol. 2018, 52, 11449–11465. [Google Scholar] [CrossRef] [PubMed]
  51. Ge, J.I.; Avedisov, S.S.; He, C.R.; Qin, W.B.; Sadeghpour, M.; Orosz, G. Experimental validation of connected automated vehicle design among human-driven vehicles. Transp. Res. Part C Emerg. Technol. 2018, 91, 335–352. [Google Scholar] [CrossRef]
  52. Stange, V.; Kühn, M.; Vollrath, M. Manual drivers’ experience and driving behaviour in repeated interactions with automated Level 3 vehicles in mixed traffic on the highway. Transp. Res. Part F Traffic Psychol. Behav. 2022, 87, 426–443. [Google Scholar] [CrossRef]
  53. Kim, B.; Heaslip, K.P. Identifying suitable car-following models to simulate automated vehicles on highways. Int. J. Transp. Sci. Technol. 2023, 12, 652–664. [Google Scholar] [CrossRef]
  54. Xie, Y.; Gartner, N.H.; Chowdhury, M. Editors’ notes: Special issue on connected and autonomous vehicles. Transp. Res. Part C: Emerg. Technol. 2017, 78, 34–36. [Google Scholar] [CrossRef]
  55. Vitale, F.; Roncoli, C. Distributed Formation Control for Managing CAV Overtaking and Intersection Maneuvers. IFAC-PapersOnLine 2022, 55, 198–203. [Google Scholar] [CrossRef]
  56. Long, K.; Gao, Z.; Jiang, Z.; Ma, C.; Hu, J.; Yang, X. Optimization based trajectory planner for multilane roundabouts with connected automation. J. Intell. Transp. Syst. 2022, 27, 411–422. [Google Scholar] [CrossRef]
  57. Suh, W.; Kim, J.I.; Kim, H.; Ko, J.; Lee, Y.-J. Mathematical Analysis for Roundabout Capacity. Math. Probl. Eng. 2018, 2018, 1–8. [Google Scholar] [CrossRef] [Green Version]
  58. Boualam, O.; Borsos, A.; Koren, C.; Nagy, V. Impact of autonomous vehicles on roundabout capacity. Sustainability 2022, 14, 2203. [Google Scholar] [CrossRef]
  59. Ard, T.; Austin Dollar, R.; Vahidi, A.; Zhang, Y.; Karbowski, D. Microsimulation of energy and flow effects from optimal automated driving in mixed traffic. Transp. Res. Part C Emerg. Technol. 2020, 120, 102806. [Google Scholar] [CrossRef]
  60. Mauro, R.; Cattani, M.; Guerrieri, M. Evaluation of the safety performance of turbo roundabouts by means of a potential accident rate model. Balt. J. Road Bridge Eng. 2015, 10, 28–38. [Google Scholar] [CrossRef] [Green Version]
  61. Tollazzi, T.; Rencelj, M. Comparative Analyse of The Two New Alternative Types of Roundabouts—Turbo and Flower Roundabout. Balt. J. Road Bridge Eng. 2014, 9, 164–170. [Google Scholar] [CrossRef]
  62. Guerrieri, M. A theoretical model for evaluating the impact of Connected and Autonomous Vehicles on the operational performance of turbo roundabouts. Int. J. Transp. Sci. Technol. 2023. [Google Scholar] [CrossRef]
Figure 1. Overview of the use of the methodological procedure applied to roundabouts.
Sustainability 15 09345 g001
Figure 2. The roundabout case study: (a) the south entry view (latitude 38.177443 and longitude 13.309095 in decimal degrees); (b) the roundabout network model built in Aimsun and visualization of the centroids used as the origin and destination of the trips in the case study.
Sustainability 15 09345 g002
Figure 4. The roundabout model built in Aimsun: (a) the comparisons between the CAV-based and simulated capacities for the scenario with 60% CAVs and 40% HVDs; (b) scattergram analysis for the mixed traffic with 60% CAVs and 40% HDVs (right lane).
Sustainability 15 09345 g004
Table 2. Statistics for right entry lane capacity target values and simulated data.
CAV Penetration Rate (%)
Entry Capacity (pc/h)020406080100
μ1 1 (s.e.) 2832.55 (65.62)869.22 (67.20)988.88 (66.88)1055.11 (68.43)1089.33(71.09)1149.00 (75.51)
μ2 1 (s.e.) 2787.13 (56.07)847.1 (57.63)922.10 (60.95)1020.18 (63.49)1084.92 (66.95) 1161.48 (68.62)
95% c.i. 3(−126.7; 217.6)(−154.4; 198.7)(−113.7; 247.3)(−151.3; 221.1)(−190.4; 199.2)(−216.0; 191.0)
t-value 40.530.250.730.370.05−0.12
t-critical value 51.9951.9951.9941.6661.9941.995
p(α)-value 60.600.800.500.710.960.90
F-value 71.371.361.201.161.131.21
F-critical value 81.7571.7571.7571.7571.7571.757
F-prob 90.360.350.590.660.720.57
R M S N E = N · n = 1 N Y n s i m Y n o b s 2 n = 1 N Y n o b s 0.090.070.080.050.0330.047
M P E = 1 N · n = 1 N Y n s i m Y n o b s Y n o b s 0.0340.0020.070.03−0.002−0.023
1 μ1 and μ2 are the mean values of the two groups here compared; 2 s.e. is the standard error; 3 c.i. is the confidence interval; 4 t-value is the t-test statistic; 5 t-critical value is the critical value of the distribution; 6 p(α) is the probability of obtaining test statistics values equal to or greater than the target ones (in absolute value) at significance level α of 0.05; 7 F-value is the F-test statistic; 8 F-critical value is the value found in the F-distribution; 9 F-prob is the probability that the samples have equal variances; RMSNE denotes the normalized root-mean-square error and MPE denotes the mean percentage error, where N is the number of observations, while Y n o b s   a n d   Y n s i m are the target capacity values and the corresponding simulated values.
Disclaimer/Publisher’s Note: The statements, opinions and data contained in all publications are solely those of the individual author(s) and contributor(s) and not of MDPI and/or the editor(s). MDPI and/or the editor(s) disclaim responsibility for any injury to people or property resulting from any ideas, methods, instructions or products referred to in the content.

