Article

Apricot Stone Classification Using Image Analysis and Machine Learning

1
Fruit and Vegetable Storage and Processing Department, The National Institute of Horticultural Research, Konstytucji 3 Maja 1/3, 96-100 Skierniewice, Poland
2
Food, Water, Waste Research Group, Faculty of Engineering, University of Nottingham, Nottingham NG7 2RD, UK
3
Food Quality and Sensory Science, Teagasc Food Research Centre, Ashtown, D15 KN3K Dublin, Ireland
*
Author to whom correspondence should be addressed.
Sustainability 2023, 15(12), 9259; https://doi.org/10.3390/su15129259
Submission received: 14 February 2023 / Revised: 27 April 2023 / Accepted: 5 June 2023 / Published: 8 June 2023
(This article belongs to the Special Issue Sustainable Food Processing Safety and Public Health)

Abstract

:
Apricot stones have high commercial value and can be used for manufacturing functional foods, cosmetic products, active carbon, and biodiesel. The optimal processing of the stones is dependent on the cultivar and there is a need for methods to sort among different cultivars (which are often mixed in processing facilities). This study investigates the effectiveness of two low-cost colour imaging systems coupled with supervised learning to develop classification models to determine the cultivar of different stones. Apricot stones of the cultivars ‘Bella’, ‘Early Orange’, ‘Harcot’, ‘Skierniewicka Słodka’, and ‘Taja’ were used. The RGB images were acquired using a flatbed scanner or a digital camera; and 2172 image texture features were extracted within the R, G, B; L, a, b; X, Y, Z; U, and V colour coordinates. The most influential features were determined and resulted in 103 and 89 selected features for the digital camera and the flatbed scanner, respectively. Linear and nonlinear classifiers were applied including Linear Discriminant Analysis (LDA), Decision Trees (DT), k-Nearest Neighbour (kNN), Support Vector Machines (SVM), and Naive Bayes (NB). The models resulting from the flatbed scanner and using selected features achieved an accuracy of 100% via either quadratic diagonal LDA or kNN classifiers. The models developed using images from the digital camera and all or selected features had an accuracy of up to 96.77% using the SVM classifier. This study presents novel and simple-to-implement at-line (flatbed scanner) and online (digital camera) methodologies for apricot stone sorting. The developed procedure combining colour imaging and machine learning may be used for the authentication of apricot stone cultivars and quality evaluation of apricot from sustainable production.

1. Introduction

Apricot (Prunus armeniaca L.) is a stone fruit that is produced widely around the world. The world production of apricot in 2019 was 3,719,974 tonnes [1]. In 2020, the majority of apricot was produced in Asia (65.22%), Europe (20.59%), and Africa (12.16%) with approximately 55.31% produced in Turkey, Uzbekistan, Iran, Algeria, and Italy [1]. Apricots can be consumed fresh or can be processed into dried fruits, jam, marmalades, or fruit bars [2,3]. During fruit processing, apricot stones (i.e., kernels) are removed and utilised in the food, cosmetic, and biodiesel industries for a range of applications including active carbon, traditional medicine, and antimicrobial film fabrication [4,5].
While apricot fruits are characterised by their nutritional value in fresh or processed forms [3], apricot stones are also sources of diverse and beneficial compounds [6]. Apricot stones contain phytonutrients such as unsaturated fatty acids [7]. There are ten fatty acids found in apricot stones, comprising oleic acid, linoleic acid, palmitic acid, and stearic acid [7]. Apricot stones contain compounds that have pharmaceutical usage, such as anti-parasitic, anti-cancer, anti-aging, anti-atherosclerosis, anti-anginal, cardioprotective, hepatoprotective, and renoprotective compounds [8]. The kernels of some apricot cultivars are relatively bitter due to the presence of amygdalin [9]. While amygdalin can develop toxic effects in human bodies after hydrolysis [9], it can be processed to extract pharmaceutical compounds that have anti-inflammatory, anti-fibrotic, immunomodulatory, and anti-atherosclerosis effects [6]. Kernels of sweet apricot can be consumed either raw or used in food products [10]. The derivation of antioxidant dietary supplements was possible due to the protein hydrolysates characteristic present in sweet apricot kernels helps reduce the risk of cardiovascular diseases, cancer, and Alzheimer’s [11,12]. Flavonoids are valuable compounds extracted from apricot stones and can be utilised in the development of various pharmaceutical formulae against cardiovascular disease, colorectal cancer, aging, and diabetes [6].
The composition of apricots and consequently their stones can vary with climate, which can lead to difficulties in differentiating among different cultivars. Apricot cultivars can be classified, based on their geographical region, into four main groups: Central Asian, Irano-Caucasian, European, and Dzhungar-Zailij [3]. There are large weather variations among these regions, including low temperatures (−35 °C) in India to warm temperatures in Southern European countries, which inevitably affect the yield and quality of the apricot fruit and the properties of the stones [3,13]. Therefore, cultivars grown in each region are distinguishable because of their adaptability to the environmental condition of each region. In Poland, the apricot breeding program started in 1952 to obtain cultivars that can grow in low temperatures [14]. Additionally, some foreign apricot cultivars are produced in Poland as they sustain relatively cold weather during winter. These cultivars include ‘Early Orange’, ‘Harcot’, ‘Bella’, ‘Goldrich’, and ‘Hargrand’ [15]. In a study conducted by Farag et al. [16], it was shown that the content of sugars, fatty acids, and organic acids in apricot stones varied among cultivars. Consequently, the classification of the stones of different cultivars is necessary to identify the most appropriate use.
RGB colour sensors have shown effective performance as rapid, cost-effective, and easy-to-operate non-invasive devices for quality evaluation in the agricultural and food domains in the last four decades [17,18]. Among such sensors, Charge-Coupled Device (CCD) cameras and flatbed scanners are cost-effective technologies capable of detecting morphological features of materials with the former being more common for in-line applications [19]. CCD cameras provide a high number of frames per second (fps), which is ideal for monitoring various external attributes in industrial environments. Flatbed scanners generate still images that are suitable for developing models for off-line quality evaluation of food products [19]. Numerous studies have investigated the possibility of identifying plants’ cultivars or species based on morphological characteristics using colour-based imaging. Visible colours are absorbed based on the electromagnetic spectrum ranging from 400 nm (blue) to 700 nm (red) [19]. Colour imaging is suitable for detecting morphological or external features of an object [20] with high accuracy, especially with modern colour sensors, and image processing algorithms. Colour vision sensors have been used for food quality evaluation including fresh produce, and processed foods [18,21]. Jayas, Paliwal [22] utilised RGB imaging, hyperspectral imaging, X-ray, and thermal imaging for wheat grain quality evaluation. Colour sensors were successfully implemented to extract morphological, colour, and texture features to classify barley, oats, rye, red spring wheat, and amber durum wheat and the classification accuracies using neural networks were 66.8–98.2% [23]. Sabanci et al. [24] used colour imaging to differentiate between bread and durum wheat kernels using Artificial Neural Network (ANN) and morphological and texture features yielding a mean absolute error as low as 9.8 × 10⁻⁶ for the test set. Detecting mould in unhulled paddy rice was performed by developing classifiers based on Support Vector Machines (SVM), ANN, Convolutional Neural Network (CNN), and Deep Belief Network (DBN) methods from grey and RGB images [25]. The highest classification accuracy was achieved using SVM (88.3–92.4%) and CNN (88.0–92.6%). Further examples of other applications of colour sensors in the food domain include recognizing canola cultivars based on histogram and texture features coupled with ANN [26], assessing olive lot ripeness degree using k-Nearest Neighbour (kNN) unsupervised learning, and more generally the evaluation of the quality of rice grains [27], and maize [28]. To the best of the authors’ knowledge, there are no previous studies investigating the classification of apricot stones using RGB colour sensors.
This study aimed to investigate the use of two low-cost colour imaging systems (RGB digital camera and a flatbed scanner) and machine learning to differentiate among apricot stones of different cultivars. The images were used to train a range of different supervised classification machine learning models and the most influential image features for the classification were identified.

2. Materials and Methods
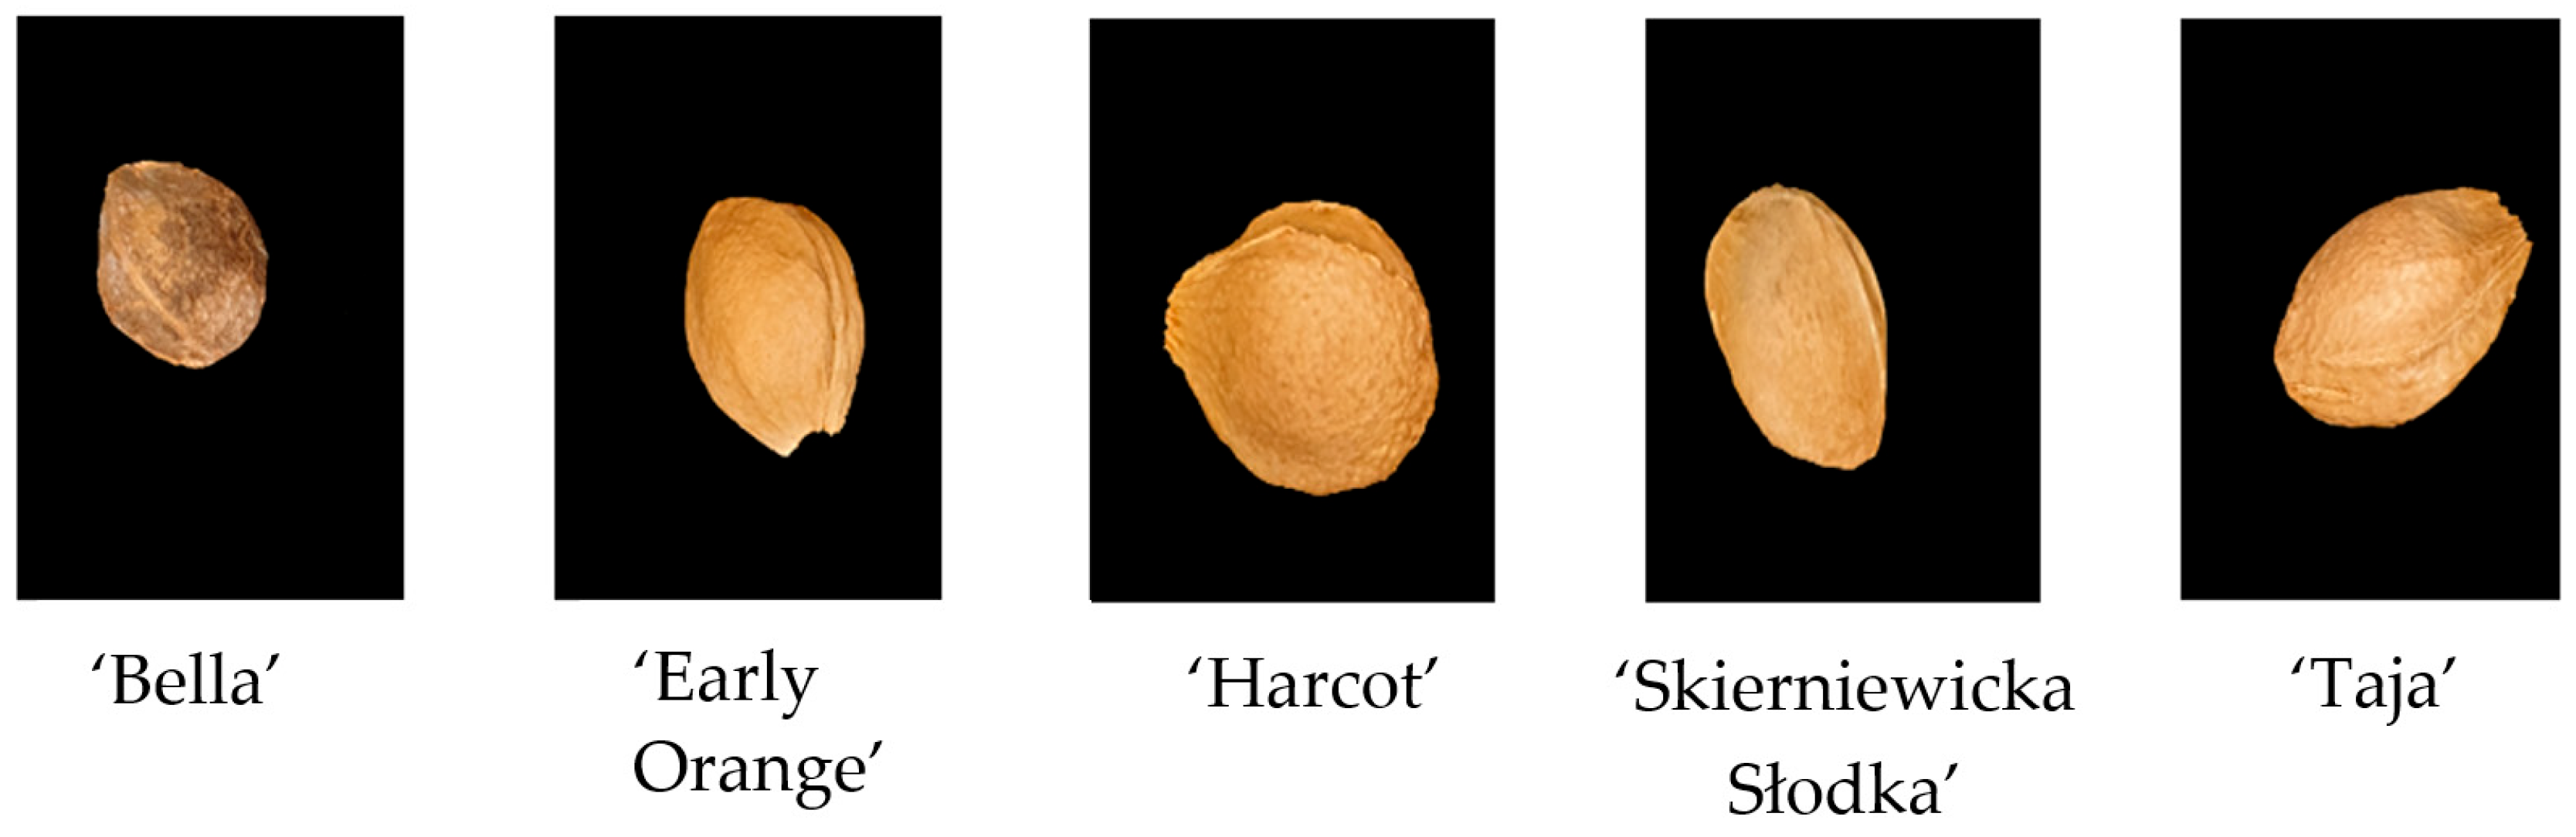
2.1. Materials

The stones of apricot cultivars ‘Bella’, ‘Early Orange’, ‘Harcot’, ‘Skierniewicka Słodka’, and ‘Taja’ were used in the experiments. In the case of each cultivar, apricots were collected from the Experimental Orchard of the National Institute of Horticultural Research in Dąbrowice near Skierniewice (Poland). Each fruit was cut in half and the stone was extracted manually. Then, the stones were washed to remove all flesh. For each cultivar, twenty-five stones were scanned. Figure 1 shows examples of the apricot stones’ images used in the study.

2.2. Imaging Systems

Two different low-cost imaging systems were used in this study. The first system consisted of a digital camera (Canon Inc., Tokyo, Japan), a computer (HP Inc., Palo Alto, CA, USA) with Microsoft’s Windows operating system, USB cables for uploading the images to the computer, and LED (Light Emitting Diodes) illumination. The digital camera included Optical Image Stabilization, Auto White Balance, and F 2.4, 8× digital zoom. The LED illumination was characterised as follows: light source—24 LED; related input voltage—AC110-240, V/50–60 Hz; related input current—0.07 A; and related output power—2.2 W. The second imaging system was an Epson Perfection flatbed scanner (Epson, Suwa, Nagano, Japan) with the following parameters: light source—white LED; scanning resolution—4800 dpi (main scan) and 4800 dpi (sub-scan); effective pixels—40,800 × 56,160 pixels at 4800 dpi; photoelectric device—CIS (Contact Image Sensors), 24 bits per pixel per colour external, 48 per pixel per colour internal; maximum scan size—216 × 297 mm [29]. The axis of the camera lens was perpendicularly directed onto the surface the samples were placed on. Figure 2a,b show schematic diagrams of the two imaging systems comprising the digital camera, Figure 2a, and the flatbed scanner, Figure 2b. It is important to state that while both systems provide a fairly cost-effective method for image acquisition, the digital camera can be used either in-line or off-line. Whereas the flatbed scanner can only be used off-line or at-line.

2.3. Image Processing

Both imaging devices were used to acquire images of the same stones for each apricot cultivar. For the flatbed scanner, the images were acquired at a resolution of 800 dpi in TIFF file format. In the case of the digital camera, the apricot stones were imaged against a black background. All colour images were converted to BMP format before performing the image processing. Following this, the images were converted to colour channels R, G, B, L, a, b, X, Y, Z, U, and V and were processed using the MaZda application (Łódź University of Technology, Institute of Electronics, Łódź, Poland) [30]. Image segmentation was performed based on brightness regions, whereby the lighter stones (relative to the background) were each considered as an individual region of interest (ROI). For each stone, approximately 2172 textures from the groups of gradient-map-based features, histogram-based textural features, co-occurrence matrix-based features, textures based on Haar wavelet transform and autoregressive model, and run-length matrix-based features were computed using the MaZda software [30]. Figure 3 shows an example of the steps followed for processing the image acquired using either the digital camera or the flatbed scanner.

2.4. Statistical Analysis

2.4.1. Classification of Apricot Stones Based on Cultivar

In this study, five machine learning algorithms were used to develop classification models for apricot stone cultivar prediction. These algorithms were Linear Discriminant Analysis (LDA), Decision Trees (DT), k-Nearest Neighbour (kNN), Support Vector Machines (SVM), and Naive Bayes (NB). For the LDA classifier with more than 2 classes, a linear function was calculated for each sample and class, then different binary comparisons are performed to assign the sample to the class with the higher discriminant function value [31]. The LDA classifier hyperparameters (i.e., regularization, and threshold) were optimised using Bayesian optimization. The DT classifier mainly depends on dividing the features into different subsets and then classifying the samples using each subset (node) sequentially. The splitting level depends on the data complexity, the number of classes, and the size of features [32]. kNN is a non-parametric classifier (i.e., no prior information is needed about data distribution) and the training data along with their labels are used to assign the labels for the unknown samples by calculating the distance between each data point (sample) and the points in the training data. The samples are then assigned to the class with the shortest distance based on a majority voting base [33]. The Euclidean distance was used along with several neighbours equal to 1. SVM is another non-parametric, kernel-based classification technique, where decision functions are calculated using the training data before the new sample is assigned a class [34]. In this study, one vs. one or pairwise SVM classification was used, where at each training session, only the data belonging to two classes are used for comparison [32]. The sample is assigned to the class that has the highest posterior probability. The data set was assumed to have a multinomial distribution, and the classifier kernel was chosen as Gaussian. For model development, the data were divided into training (66.7%) and testing (33.3%), and 10-fold cross-validation was applied to the training data to obtain the optimal model. The classification models were built based on a whole set of data, and feature selection was implemented using the Best First with the CFS (Correlation-based Feature Selection) subset evaluator. Best First allowed searching the space of attribute subsets using greedy hill climbing and backtracking facility. The CFS algorithm assessed the predictive value of the attribute and the redundancy degree among the attributes. The sets of features with the highest correlation were preferred [35].

2.4.2. Evaluation of Classification Models

The obtained classification models were evaluated based on accuracy, precision, recall, F1-score, Mathew’s Correlation Coefficient (MCC), Cohen’s Kappa coefficient, and the Area Under the Receiver Operating Characteristic curve (AUROC) (Equations (1)–(6)) [36,37,38]. TP, TN, FP, and FN denote the true positive, true negative, false positive, and false negative values, respectively, resulting from the classifier. To make the statistical analysis more realistic, all previous metrics, except accuracy and Kappa, were calculated for each cultivar against each of the others, i.e., TP and TN were for the target cultivar, while FP and FN were for the remaining cultivars. Therefore, these predictions can be considered to be binary classifications. However, the accuracy and Kappa values were calculated for all cultivars at once.
A c c u r a c y = ( T P + T N ) T P + T N + F N + F P
R e c a l l = T P T P + F N
P r e c i s i o n = T P T P + F P
F 1 s c o r e = 2 P r e c s i o n R e c a l l ( P r e c i s i o n + R e c a l l )
M C C = T P T N F P F N T P + F P T P + F N T N + F P T N + F N
K a p p a = T P + F P T P + F N T P + F P T P + F N T N + F P T N + F N + T N + F P T N + F N T P + F P T P + F N T N + F P T N + F N T P + F P T P + F N T N + F P T N + F N
where TP: true positive; TN: true negative; FP: false positive; FN: false negative.

3. Results

Apricot stones belonging to ‘Bella’, ‘Early Orange’, ‘Harcot’, ‘Skierniewicka Słodka’, and ‘Taja’ cultivars were classified based on cultivar using all or selected features from the images converted to colour channels R, G, B, L, a, b, X, Y, Z, U, and V.

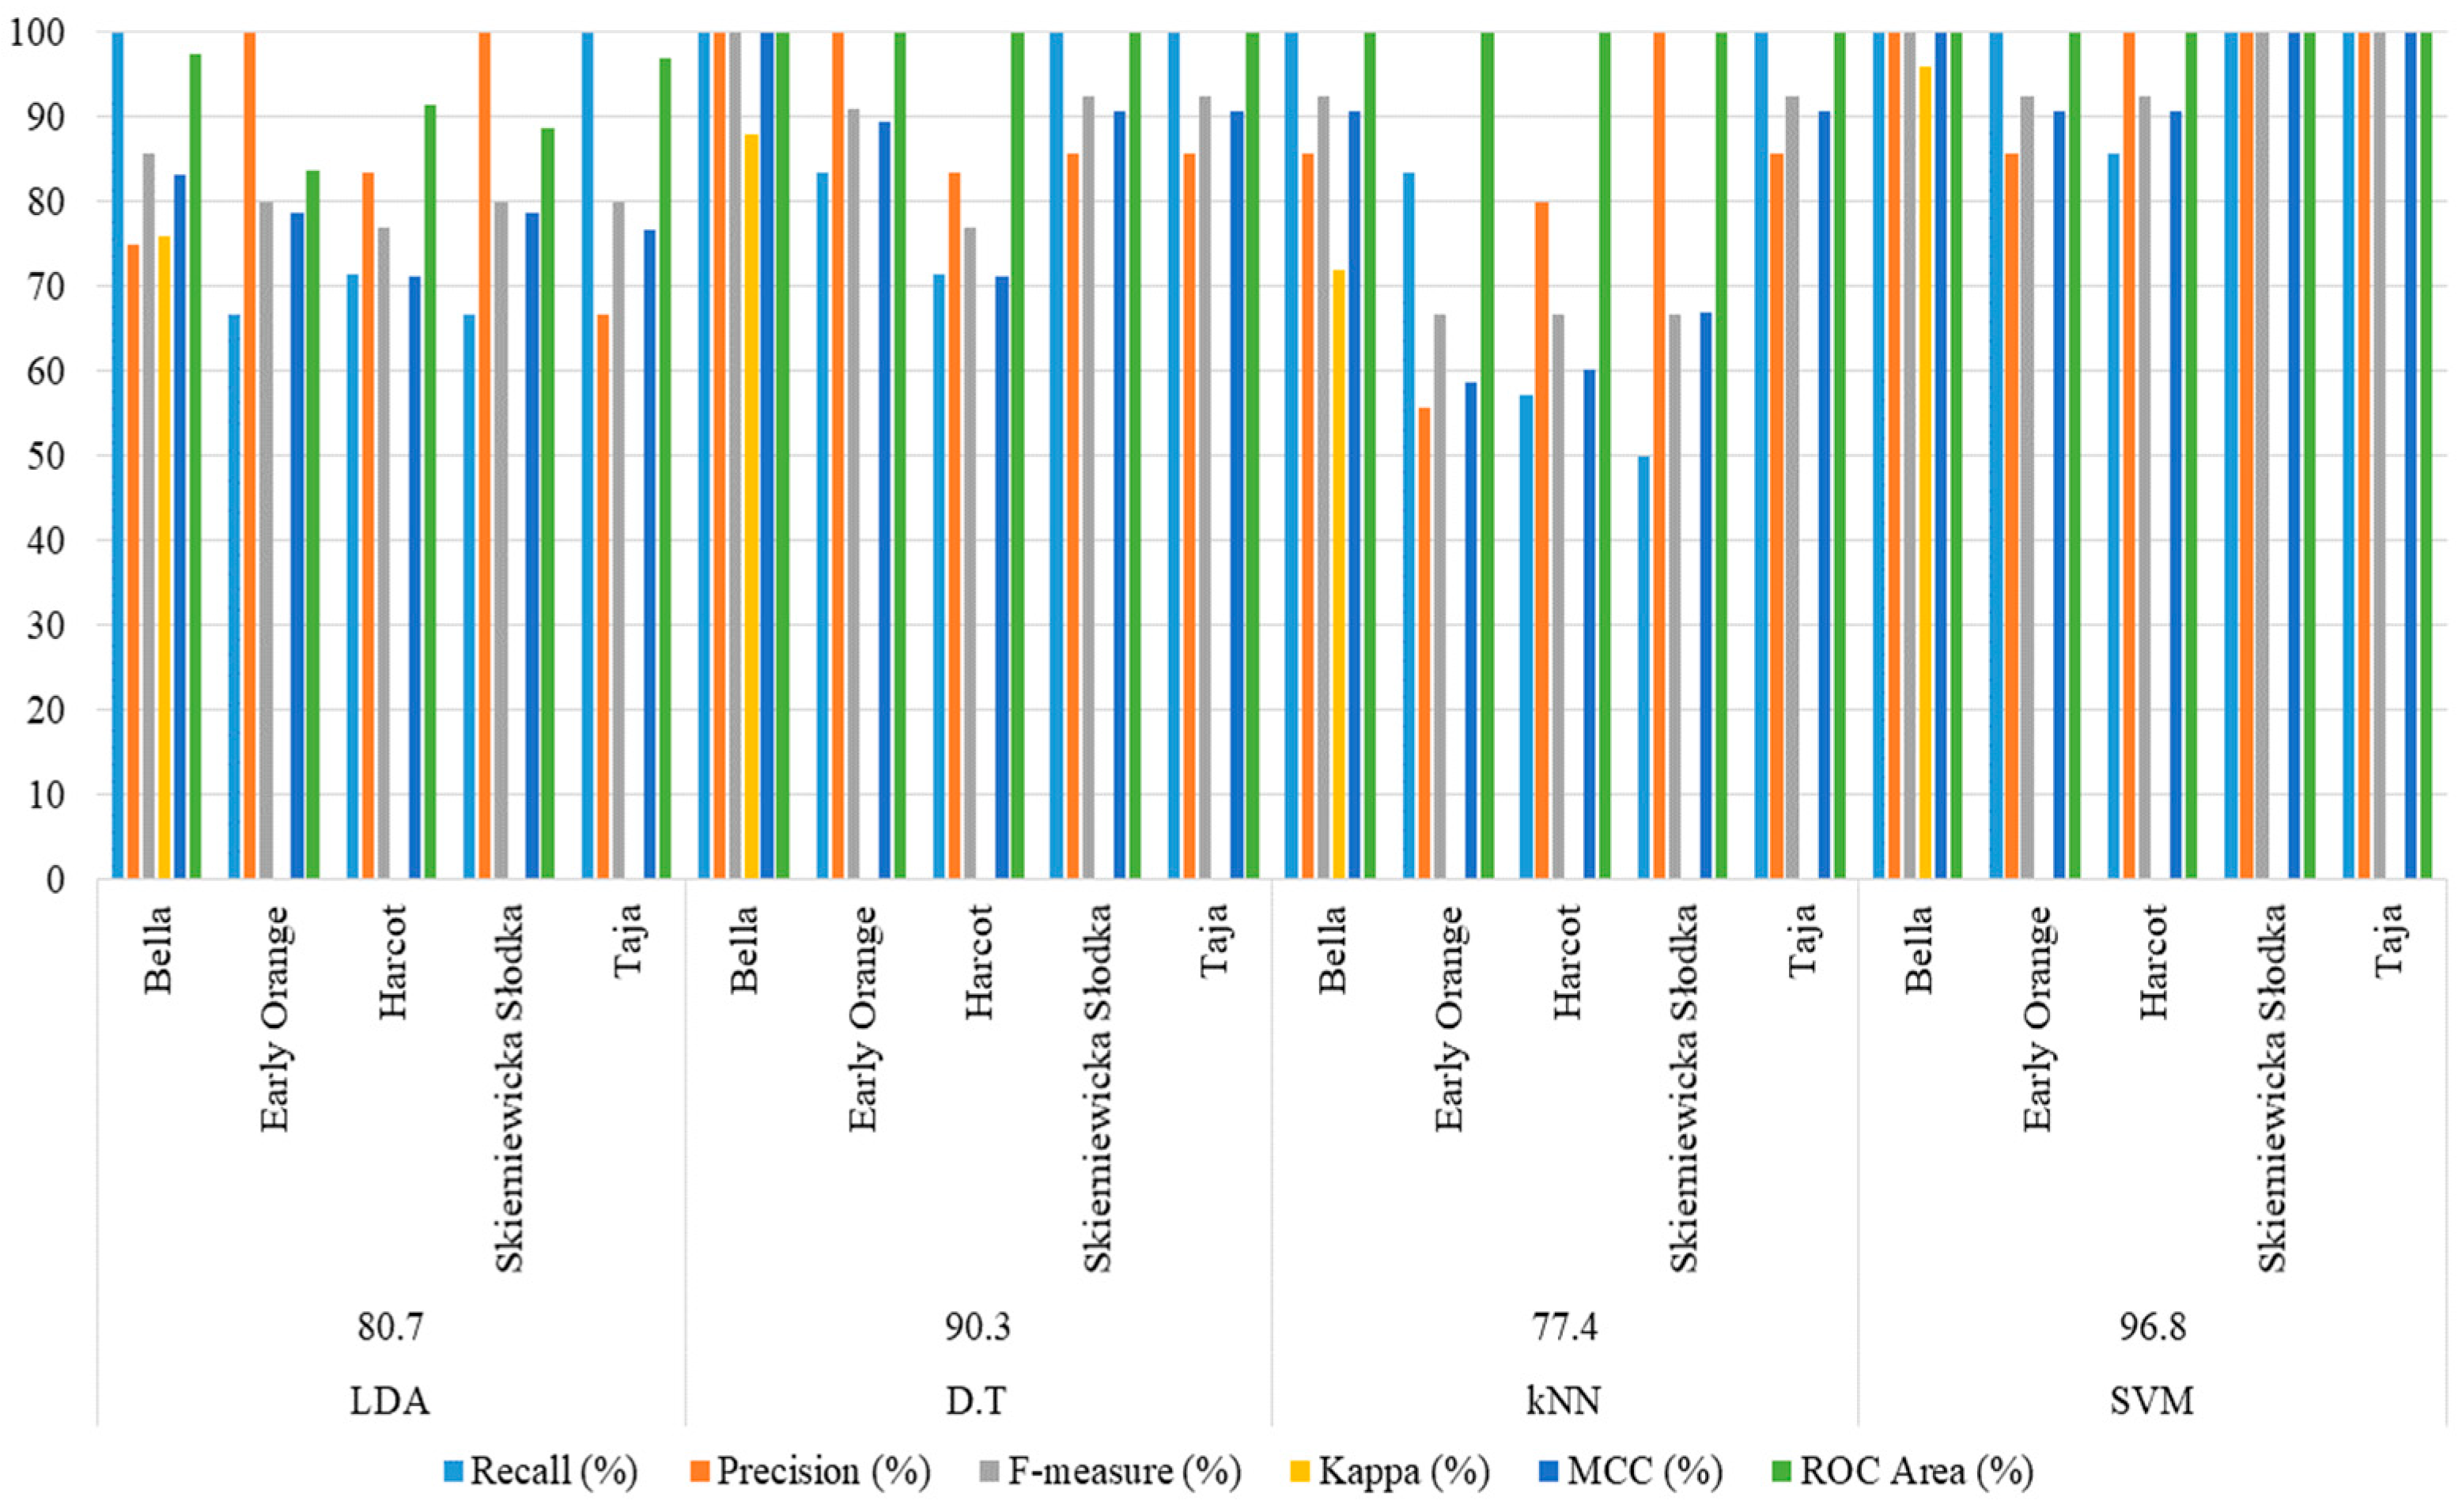
3.1. Classification Results Based on Features from All Colour Channels

The classification was performed for all 2172 image textures computed from colour channels R, G, B, L, a, b, X, Y, Z, U, and V, and 52 selected textures for images acquired using the digital camera, and 50 texture parameters for images acquired from the flatbed scanner. For the images acquired using the digital camera, the highest accuracy for the test set was 96.77% using the SVM classifier for either the models built based on all features or the selected features (Table 1). For training sets, the accuracy of classification reached 97.85% (LDA-Linear, kNN, SVM) when considering all features and 98.92% (LDA-Diagonal, Decision Trees, kNN) for models developed based on selected features.
For models built based on images obtained using the flatbed scanner, the highest classification accuracy for the test set was 93.55%, obtained using SVM and all features, whereas the accuracy increased to 100% for selected features and kNN and quadratic LDA (Table 2). Additionally, the complete correct classifications (100% accuracy) were found for training sets for SVM models developed based on all features as well as selected features (kNN, SVM). In the case of classification performed for all features, the accuracy for the test set reached 93.55% for the SVM algorithm.

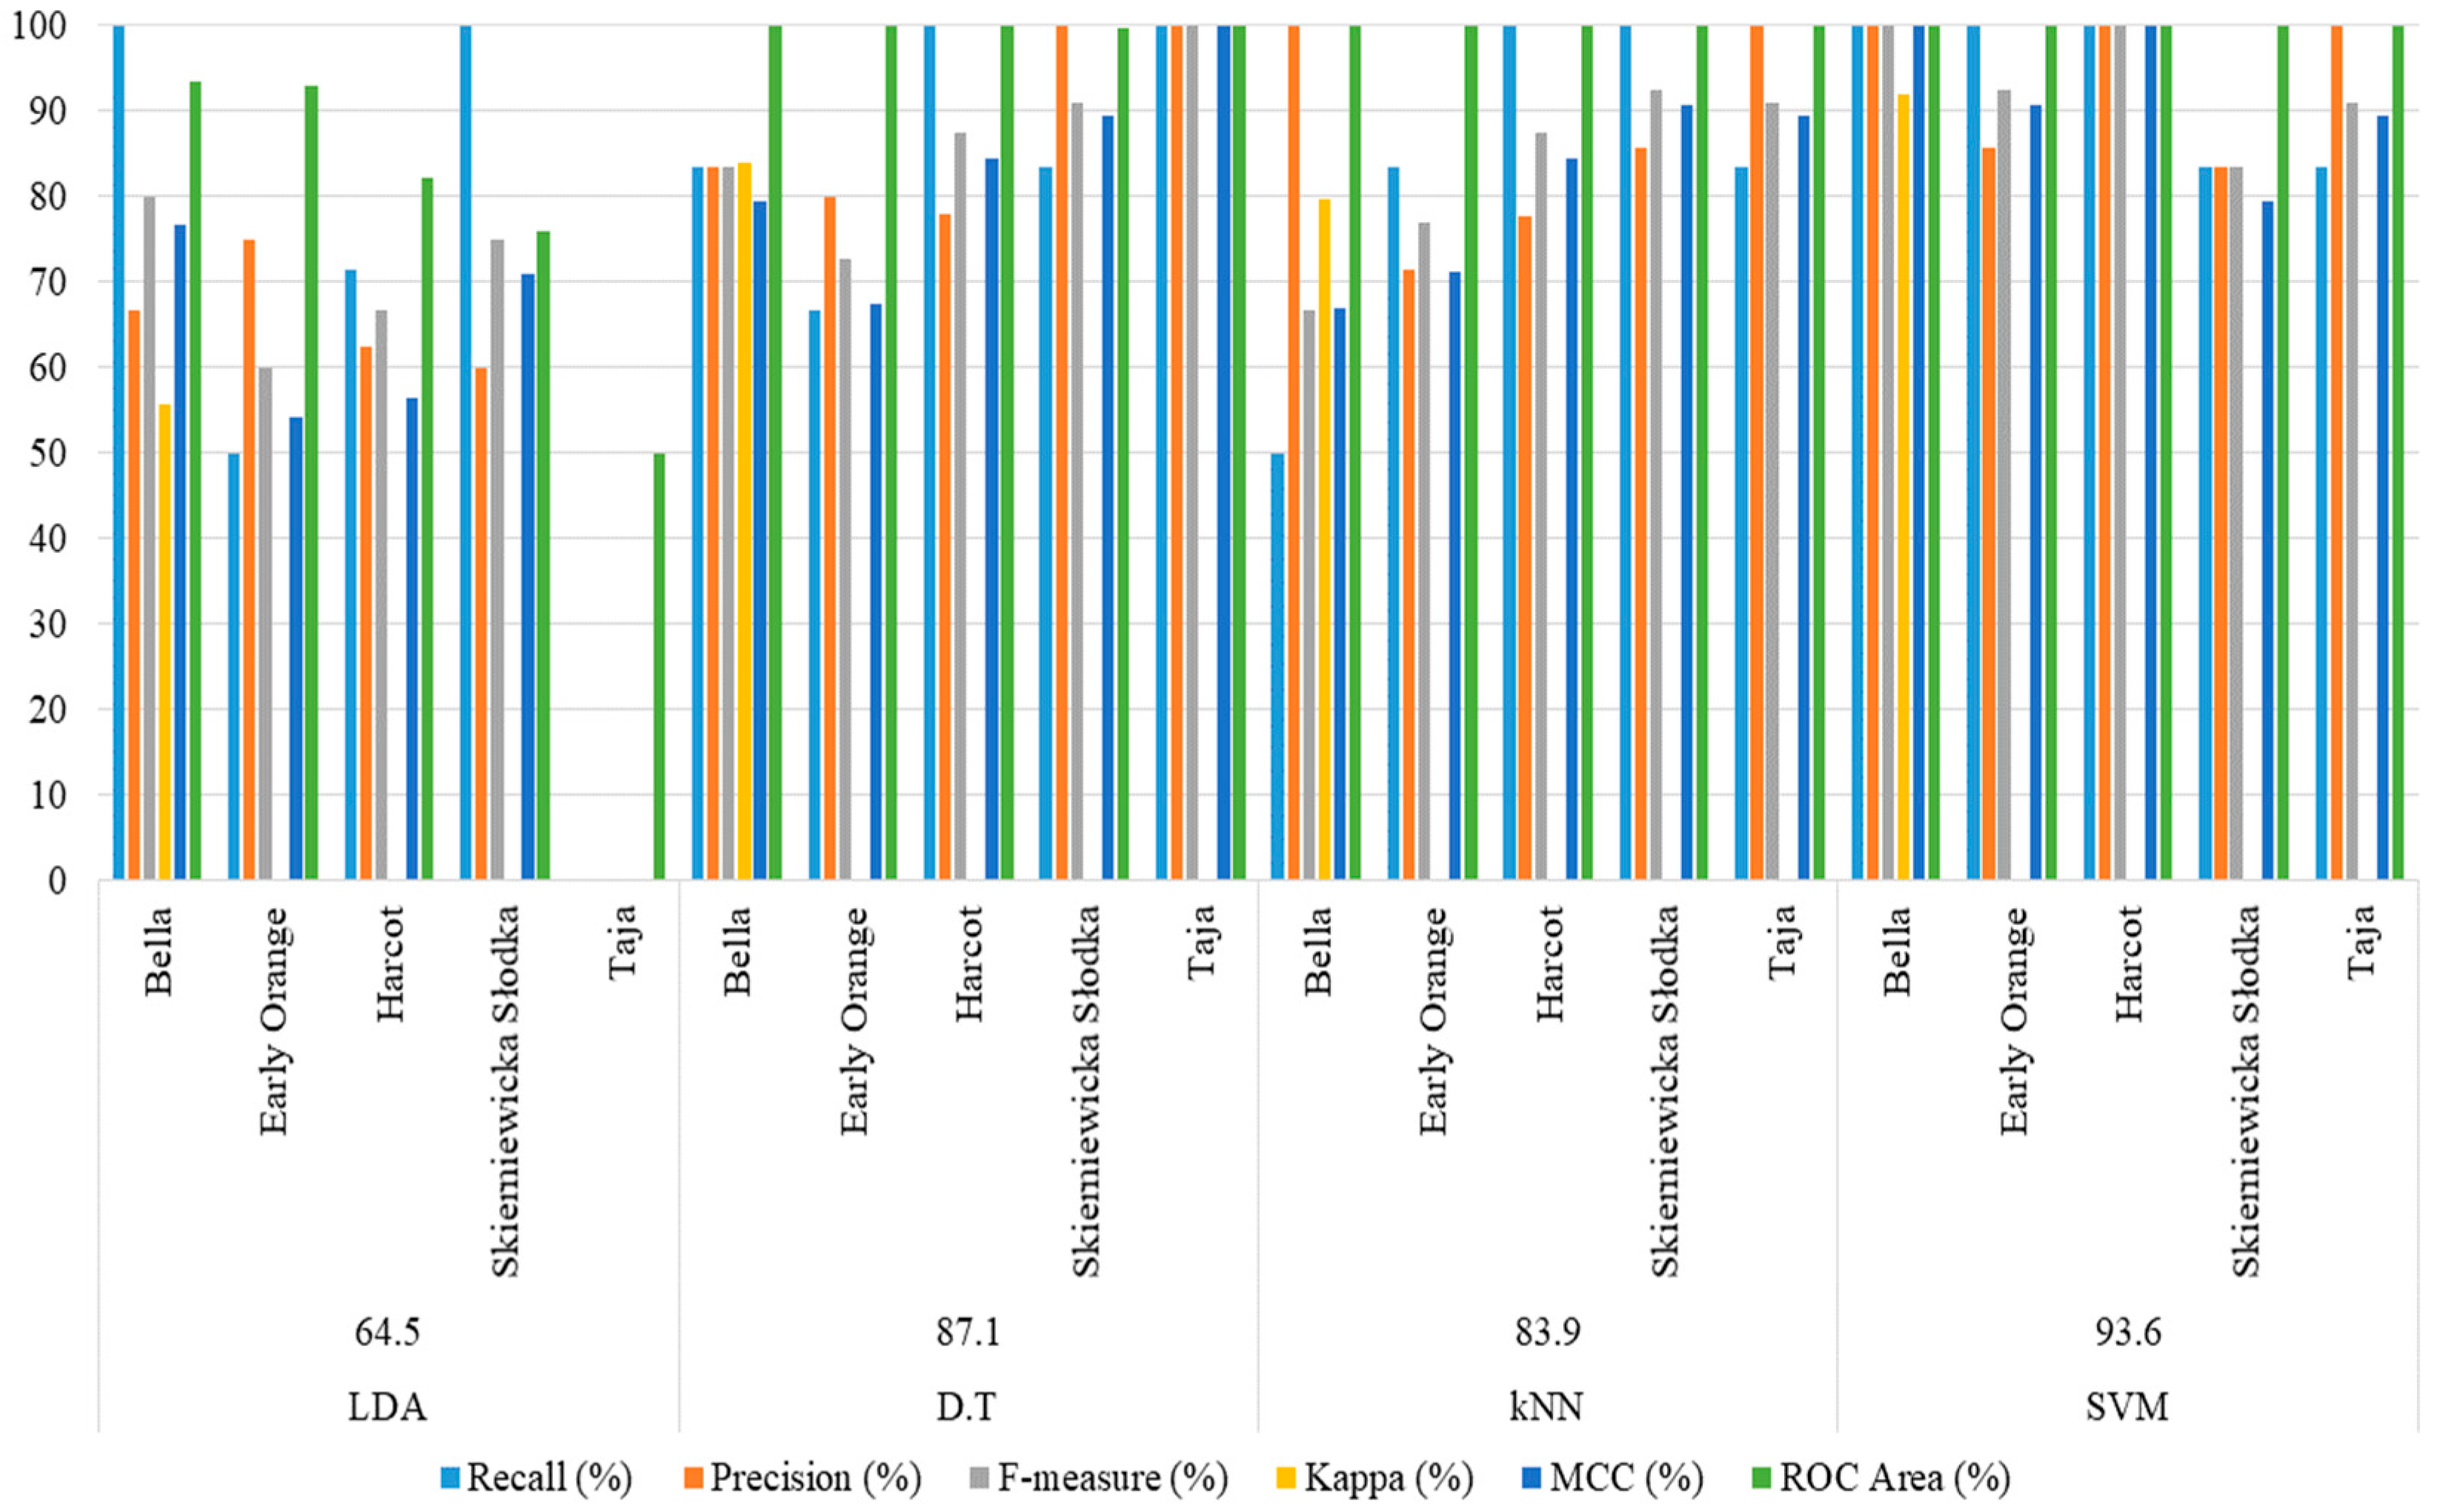
3.2. Classification Results Based on Features from Individual Colour Channels

In the next step of the analysis, the ‘Bella’, ‘Early Orange’, ‘Harcot’, ‘Skierniewicka Słodka’, and ‘Taja’ apricot stones were discriminated using models built based on textures selected separately for each colour channel. It was found that the textures from colour channels L, a, and b provided the most satisfactory results. The selected texture parameters for images acquired using the digital camera are shown in Table 3. In the case of colour channels L, a, and b, 13, 23, and 15 textures were selected, respectively.
The textures selected from apricot stone images obtained from the flatbed scanner are presented in Table 4. Performing texture selection allowed choosing 10 parameters for images converted to colour channel L, 18 for colour channel a, and 11 for colour channel b for building the cultivar classification models.
The results for channels L, a, and b yielded the most satisfactory accuracies and are presented in Table 5 for the digital camera and Table 6 for the flatbed scanner. For images acquired using the RGB camera (Table 5), the highest accuracies for the test sets were 87.10% for features selected from colour channel b using DT and SVM, 83.87% for features selected from colour channel a and the LDA linear, diagonal and quadratic diagonal algorithms, and 80.65% for features selected from colour channel L and the SVM classifier. In the case of the training sets, the highest accuracies observed were 96.77% for channel a and SVM, 93.55% for channel b and kNN and SVM, and 92.47% for channel L and kNN.
Models built based on selected texture parameters from the flatbed scanner from colour channels L, a, and b (Table 6) provided an accuracy of 90.32% for testing (channel a, quadratic diagonal) and 100% for training (channel a, kNN). For features from colour channel L, accuracies of up to 87.10% for the test set (LDA diagonal, quadratic diagonal) and 97.85% for a training set (kNN) were obtained. Meanwhile, the apricot stone cultivars were correctly distinguished in 80.65% (LDA diagonal, quadratic diagonal) and 95.70% (kNN) in the case of models including selected image textures from colour channel b.
The results shown in Figure 4, Figure 5, Figure 6 and Figure 7 depict the Recall, Precision, F-measure, Kappa, MCC, and ROC Area computed for all or selected features extracted from images for either the digital camera or the flatbed scanner. It was clear that these metrics followed the same trend as the accuracy values shown previously in Table 1, Table 2, Table 5 and Table 6. Considering the results in Figure 4, Figure 5, Figure 6 and Figure 7, it was observed that values depended on the cultivar, imaging device, algorithm, and set of textures. The most satisfactory results were obtained for models built based on selected features extracted from the apricot stone images acquired using the flatbed scanner (Figure 7). For the LDA and kNN machine learning algorithms, the values of Recall, Precision, F-measure, and MCC reached 100% for each of the apricot stone cultivars ‘Bella’, ‘Early Orange’, ‘Harcot’, ‘Skierniewicka Słodka’, and ‘Taja’. ROC Area was equal to 100% for each cultivar in the case of kNN. Additionally, the Kappa of 100% was determined for the LDA and kNN algorithms. In the case of other sets of textures (Figure 4, Figure 5 and Figure 6), the most satisfactory results were found for models developed using the SVM algorithm. For classification based on all features from the images obtained using the digital camera, Kappa reached 95.97%. Values equal to 100% for ROC Area were obtained for all cultivars, Recall for ‘Bella’, ‘Early Orange’, ‘Skierniewicka Słodka’, and ‘Taja’, Precision for ‘Bella’, ‘Harcot’, ‘Skierniewicka Słodka’, and ‘Taja’, and F-measure and MCC for ‘Bella’, ‘Skierniewicka Słodka’, and ‘Taja’ (Figure 4). The classification results based on models including selected features extracted from the images acquired using the digital camera and built using SVM provided the highest results, with Recall (100%) for ‘Bella’, ‘Harcot’, ‘Skierniewicka Słodka’, and ‘Taja’, Precision (100%) for ‘Bella’, ‘Early Orange’, ‘Skierniewicka Słodka’, and ‘Taja’, F-measure (100%) and MCC (100%) for ‘Bella’, ‘Skierniewicka Słodka’, and ‘Taja’, ROC Area (100%) for ‘Bella’, and Kappa of 95.96% (Figure 5). Models developed using SVM based on all features extracted for apricot stone images acquired using the flatbed scanner reached 100% for Recall for ‘Bella’, ‘Early Orange’, and ‘Harcot’, Precision for ‘Bella’, ‘Harcot’, and ‘Taja’, F-measure and MCC for ‘Bella’ and ‘Harcot’, and ROC Area for ‘Bella’, ‘Early Orange’, ‘Harcot’, ‘Skierniewicka Słodka’, and ‘Taja’. Additionally, Kappa reaching 91.93% was obtained (Figure 6).

4. Discussion

The high classification results obtained in this study demonstrate the effectiveness of the models built based on image features using machine learning algorithms to distinguish cultivars of apricot stones. The possibility of assessing the cultivar diversity of fruit endocarp (stones and pits) and stones (kernels) using image analysis and machine learning has been confirmed in previous studies with similar results to the current work. The geometric and texture features of the images allowed models to be built that provided high discrimination accuracies. In the case of plum stones, models built based on selected image textures distinguished the ‘Emper’, ‘Kalipso’, and ‘Polinka’ cultivars with an average accuracy reaching 96.67% for the model including combined textures selected from images converted to colour channels R, G, B, L, a, b, X, Y, Z built using the kNN, i.e., IBK in Weka Software [39]. Besides plum stones, plum kernels of the ‘Emper’, ‘Kalipso’, and ‘Polinka’ cultivars were correctly distinguished using an approach combining image analysis and machine learning. Models built using the KStar algorithm (group of Lazy) ensured the highest average discrimination accuracies, reaching 98% for a set of textures selected from the Lab colour space and 95% for the combined textures selected from images from all analysed channels L, a, b, R, G, B, U, V, S, X, Y, Z, or the channel b [40]. The relatively high classification of cultivars and species of plum endocarp was determined by Sarigu et al. [41] with an accuracy of 99.3% for distinguishing P. domestica and P. spinosa and 86.1% in the case of different cultivars of P. domestica based on models including the image features selected from sets of morpho-colorimetric characteristics (size, shape, and surface colour) and textures of endocarp developed using the stepwise LDA algorithm. The size and shape features were used by Depypere et al. [42], for taxonomic analysis of Prunus endocarps (P. insititia, P. domestica, P. x fruticans, P. cerasifera, P. spinosa). The texture, size, and shape parameters extracted from the images were applied by Frigau et al. [43] for the distinguishing of stones belonging to different species of the genus Prunus, namely P. salicina, P. domestica, P. cerasifera with an accuracy of 90.7% using Random Forest (RF) classifier for a set combining textures, size and shape features. For the models built based only on textures, size, or shape, the accuracies reached 77.3% using SVM, 57.3% using SVM, and 43.9% using RF, respectively [43]. Models based on textures extracted from images have been developed to distinguish cultivars of apricot stones (‘Taja’, ‘Early Orange’, ‘Harcot’, and ‘Bella’) [44]. The most useful machine learning algorithms were found to be IBk from Lazy, Multilayer Perceptron from Functions, and Random Forest from Trees. The average accuracy of discrimination reached 99% for the model built using the Multilayer Perceptron algorithm based on image textures from the Lab colour space [44]. In the case of stones and stones classification, the ‘Royal Glory’ and ‘Redhaven’ peach cultivars were discriminated with an accuracy of up to 100% with models including a set of selected textures of images from the following channel R, G, B, L, a, b, X, Y, Z built for stones using the Bayes Net algorithm, and for stones, Bayes Net, Logistic, Sequential Minimal Optimization (SMO), and multi-class classifier. In the case of seed images, peach cultivars were correctly distinguished, yielding 100% classification for models built separately for textures selected from RGB using Bayes Net, Lab using logistic regression, and XYZ using logistic regression [45]. The results illustrated that the flatbed scanner outperformed the RGB camera. While the flatbed scanner is not a valid option for in-line application, the former system provides better image resolution, more controlled and uniform lightening with no effect resulting from the ambient light, and wider dynamic range than digital cameras [46]. However, the utilization of the digital camera is more versatile than the scanner, and it can operate in-line as a process analytical technology tool [47]. The approach combining colour imaging and machine learning may be used for the authentication of apricot stone cultivars from sustainable production. This could help with the quality assessment of apricot in a non-destructive manner. Sustainable agriculture produces abundant food and does not pollute the environment or deplete the earth’s resources. Sustainable agriculture integrates environmental health, social and economic equity, and economic profitability. The sustainability in the apricot farms involved some sustainability indicators, such as socio-economic and environmental [48]. Apricot samples from sustainable production may be very important. The enhancement of the productivity and efficiency of agricultural commodities can enable increased competitiveness in the global markets. Growers rely on input dealers for seed [49]. The selection of the desired apricot genotypes, due to their different properties, can be crucial in breeding programs and sustainable food industries. Furthermore, some genotypes can be free of disease and pest traits, which is important for sustainable apricot production [50]. Additionally, chemical compounds contained in apricot kernels can be a sustainable source of nutrition. The emphasis on sustainability of the production of apricot stones with kernels as nutritional resources is important [51]. Therefore, distinguishing sustainably produced apricot stone cultivars with different characteristics can be of practical use.

5. Conclusions

The effectiveness of the approach involving colour imaging systems (digital camera and a flatbed scanner), image processing to extract texture parameters, and the development of classification models using machine learning algorithms for distinguishing different cultivars of apricot stones was demonstrated. The accuracy of discrimination of apricot stones belonging to cultivars ‘Bella’, ‘Early Orange’, ‘Harcot’, ‘Skierniewicka Słodka’, and ‘Taja’ for test sets reached 100% for models including textures from images obtained using a flatbed scanner, built using the quadratic diagonal and kNN (k-Nearest Neighbour) algorithms and 96.77% for the models built based on textures from images acquired using a digital camera in the case of the SVM (Support Vector Machine) algorithm. The results indicated the possibility of distinguishing apricot stone cultivars with high accuracy. Further research should consider larger data sets, as well as a greater diversity of cultivars, which would increase the feasibility of applying advanced machine learning techniques, especially deep learning, and improve the likelihood of transfer learning between different cultivars.

Author Contributions

Conceptualization, E.R., A.M.R. and N.J.W.; methodology, E.R. and A.M.R.; software, E.R. and A.M.R.; validation, E.R.; formal analysis, E.R. and A.M.R.; investigation, E.R. and A.M.R.; resources, E.R.; data curation, E.R. and A.M.R.; writing—original draft preparation, E.R. and A.M.R.; writing—review and editing, E.R. and N.J.W.; visualization, E.R.; supervision, E.R. All authors have read and agreed to the published version of the manuscript.

Funding

This research received no external funding.

Institutional Review Board Statement

Not applicable.

Informed Consent Statement

Not applicable.

Data Availability Statement

The data presented in this study are available on request from the corresponding author.

Conflicts of Interest

The authors declare no conflict of interest.

References

  1. FAOSTAT. Crop and Livestock Product: Apricot. Available online: https://www.fao.org/faostat/en/#data/QCL (accessed on 17 January 2022).
  2. Featherstone, S. Canning of fruit. In A Complete Course in Canning and Related Processes: Processing Procedures for Canned Food Products; Featherstone, S., Ed.; Woodhead Publishing: Sawston, UK, 2015; Volume 3, pp. 85–134. [Google Scholar]
  3. Moustafa, K.; Cross, J. Production, pomological and nutraceutical properties of apricot. J. Food Sci. Technol. 2019, 56, 12–23. [Google Scholar] [CrossRef]
  4. González-García, E.; Marina, M.L.; García, M.C. Apricot. In Valorization of Fruit Processing By-Products; Galanakis, C.M., Ed.; Academic Press: Cambridge, MA, USA, 2019; pp. 43–65. [Google Scholar]
  5. Özarslan, S.; Atelge, M.R.; Kaya, M.; Ünalan, S. A Novel Tea factory waste metal-free catalyst as promising supercapacitor electrode for hydrogen production and energy storage: A dual functional material. Fuel 2021, 305, 121578. [Google Scholar] [CrossRef]
  6. Akhone, M.A.; Bains, A.; Tosif, M.M.; Chawla, P.; Fogarasi, M.; Fogarasi, S. Apricot Kernel: Bioactivity, Characterization, Applications, and Health Attributes. Foods 2022, 11, 2184. [Google Scholar] [CrossRef]
  7. Xi, W.; Lei, Y. Apricot. In Nutritional Composition and Antioxidant Properties of Fruits and Vegetables; Jaiswal, A.K., Ed.; Academic Press: Cambridge, MA, USA, 2020; pp. 613–629. [Google Scholar]
  8. Gupta, S.; Chhajed, M.; Arora, S.; Thakur, G.; Gupta, R. Medicinal value of apricot: A review. Indian J. Pharm. Sci. 2018, 80, 790–794. [Google Scholar] [CrossRef]
  9. Karsavuran, N.; Charehsaz, M.; Celik, H.; Asma, B.M.; Yakıncı, C.; Aydın, A. Amygdalin in bitter and sweet seeds of apricots. Toxicol. Environ. Chem. 2014, 96, 1564–1570. [Google Scholar] [CrossRef]
  10. Ghorab, H.; Lammi, C.; Arnoldi, A.; Kabouche, Z.; Aiello, G. Proteomic analysis of sweet Algerian apricot kernels (Prunus armeniaca L.) by combinatorial peptide ligand libraries and LC–MS/MS. Food Chem. 2018, 239, 935–945. [Google Scholar] [CrossRef]
  11. Huang, C.; Tang, X.; Liu, Z.; Huang, W.; Ye, Y. Enzymes-dependent antioxidant activity of sweet apricot kernel protein hydrolysates. LWT 2022, 154, 112825. [Google Scholar] [CrossRef]
  12. de Souza, T.S.; Dias, F.F.; Oliveira, J.P.S.; de Moura Bell, J.M.; Koblitz, M.G.B. Biological properties of almond proteins produced by aqueous and enzyme-assisted aqueous extraction processes from almond cake. Sci. Rep. 2020, 10, 10873. [Google Scholar] [CrossRef] [PubMed]
  13. Akin, E.B.; Karabulut, I.; Topcu, A. Some compositional properties of main Malatya apricot (Prunus armeniaca L.) varieties. Food Chem. 2008, 107, 939–948. [Google Scholar] [CrossRef]
  14. Jakubowski, T.; Zdyb, H. Apricot breeding and research in Poland. Acta Hortic. 1995, 384, 251–254. [Google Scholar] [CrossRef]
  15. Licznar-Malanczuk, M.; Sosna, I. Evaluation of several apricot cultivars and clones in the Lower Silesia climatic condition. Part II: Vigor, health and mortality. J. Fruit Ornam. Plant Res. 2005, 13, 49–57. [Google Scholar]
  16. Farag, M.A.; Ramadan, N.S.; Shorbagi, M.; Farag, N.; Gad, H.A. Profiling of Primary Metabolites and Volatiles in Apricot (Prunus armeniaca L.) Seed Kernels and Fruits in the Context of Its Different Cultivars and Soil Type as Analyzed Using Chemometric Tools. Foods 2022, 11, 1339. [Google Scholar] [CrossRef] [PubMed]
  17. Pinder, A.C.; Godfrey, G. Food Process Monitoring Systems; Springer Science & Business Media: Berlin/Heidelberg, Germany, 2012. [Google Scholar]
  18. Sun, D.-W. Computer Vision Technology for Food Quality Evaluation; Academic Press: Cambridge, MA, USA, 2016. [Google Scholar]
  19. Abdullah, M.Z. Image acquisition systems. In Computer Vision Technology for Food Quality Evaluation; Elsevier: Amsterdam, The Netherlands, 2016; pp. 3–43. [Google Scholar]
  20. Zou, X.; Zhao, J. Nondestructive Measurement in Food and Agro-Products; Springer: Dordrecht, The Netherlands, 2015. [Google Scholar]
  21. Patrício, D.I.; Rieder, R. Computer vision and artificial intelligence in precision agriculture for grain crops: A systematic review. Comput. Electron. Agric. 2018, 153, 69–81. [Google Scholar] [CrossRef] [Green Version]
  22. Jayas, D.; Paliwal, J.; Erkinbaev, C.; Ghosh, P.; Karunakaran, C. Wheat quality evaluation. In Computer Vision Technology for Food Quality Evaluation; Elsevier: Amsterdam, The Netherlands, 2016; pp. 385–412. [Google Scholar]
  23. Visen, N.; Paliwal, J.; Jayas, D.; White, N. Ae—Automation and emerging technologies: Specialist neural networks for cereal grain classification. Biosyst. Eng. 2002, 82, 151–159. [Google Scholar] [CrossRef]
  24. Sabanci, K.; Kayabasi, A.; Toktas, A. Computer vision-based method for classification of wheat grains using artificial neural network. J. Sci. Food Agric. 2017, 97, 2588–2593. [Google Scholar] [CrossRef]
  25. Sun, K.; Wang, Z.; Tu, K.; Wang, S.; Pan, L. Recognition of mould colony on unhulled paddy based on computer vision using conventional machine-learning and deep learning techniques. Sci. Rep. 2016, 6, 37994. [Google Scholar] [CrossRef] [Green Version]
  26. Qadri, S.; Furqan Qadri, S.; Razzaq, A.; Ul Rehman, M.; Ahmad, N.; Nawaz, S.A.; Saher, N.; Akhtar, N.; Khan, D.M. Classification of canola seed varieties based on multi-feature analysis using computer vision approach. Int. J. Food Prop. 2021, 24, 493–504. [Google Scholar] [CrossRef]
  27. Ogawa, Y. Quality evaluation of rice. In Computer Vision Technology for Food Quality Evaluation; Elsevier: Amsterdam, The Netherlands, 2016; pp. 413–437. [Google Scholar]
  28. Symons, S.J.; Shahin, M.A.; Xiong, Z.; Dai, Q.; Sun, D.-W. Quality evaluation of corn/maize. In Computer Vision Technology for Food Quality Evaluation; Elsevier: Amsterdam, The Netherlands, 2016; pp. 439–462. [Google Scholar]
  29. Ropelewska, E.; Mieszczakowska-Frąc, M.; Kruczyńska, D. The evaluation of the usefulness of textures from cross-section images obtained using a digital camera and a flatbed scanner for cultivar discrimination of quince (Cydonia oblonga Mill.). Food Control 2022, 131, 108447. [Google Scholar] [CrossRef]
  30. Szczypiński, P.M.; Strzelecki, M.; Materka, A.; Klepaczko, A. MaZda—A software package for image texture analysis. Comput. Methods Programs Biomed. 2009, 94, 66–76. [Google Scholar] [CrossRef] [PubMed]
  31. Bishop, C.M.; Nasrabadi, N.M. Pattern Recognition and Machine Learning; Springer: Berlin/Heidelberg, Germany, 2006; Volume 4. [Google Scholar]
  32. Duda, R.O.; Hart, P.E. Pattern Classification; John Wiley & Sons: Hoboken, NJ, USA, 2006. [Google Scholar]
  33. Brereton, R.G. Chemometrics: Data Analysis for the Laboratory and Chemical Plant; John Wiley & Sons: Hoboken, NJ, USA, 2003. [Google Scholar]
  34. Abe, S. Support Vector Machines for Pattern Classification; Springer: Berlin/Heidelberg, Germany, 2005; Volume 2. [Google Scholar]
  35. Witten, I.H.; Frank, E.; Hall, M.A.; Pal, C.J. Practical machine learning tools and techniques. In Data Mining: Practical Machine Learning Tools and Techniques, 3rd ed.; Morgan Kaufmann/Elsevier: Burlington, NJ, USA, 2011. [Google Scholar]
  36. Ropelewska, E.; Piecko, J. Discrimination of tomato seeds belonging to different cultivars using machine learning. Eur. Food Res. Technol. 2022, 248, 685–705. [Google Scholar] [CrossRef]
  37. Ropelewska, E.; Szwejda-Grzybowska, J. A comparative analysis of the discrimination of pepper (Capsicum annuum L.) based on the cross-section and seed textures determined using image processing. J. Food Process Eng. 2021, 44, e13694. [Google Scholar] [CrossRef]
  38. Saito, T.; Rehmsmeier, M. The precision-recall plot is more informative than the ROC plot when evaluating binary classifiers on imbalanced datasets. PLoS ONE 2015, 10, e0118432. [Google Scholar] [CrossRef] [Green Version]
  39. Ropelewska, E. Diversity of plum stones based on image texture parameters and machine learning algorithms. Agronomy 2022, 12, 762. [Google Scholar] [CrossRef]
  40. Ropelewska, E.; Cai, X.; Zhang, Z.; Sabanci, K.; Aslan, M.F. Benchmarking Machine Learning Approaches to Evaluate the Cultivar Differentiation of Plum (Prunus domestica L.) Kernels. Agriculture 2022, 12, 285. [Google Scholar] [CrossRef]
  41. Sarigu, M.; Grillo, O.; Bianco, M.L.; Ucchesu, M.; d’Hallewin, G.; Loi, M.C.; Venora, G.; Bacchetta, G. Phenotypic identification of plum varieties (Prunus domestica L.) by endocarps morpho-colorimetric and textural descriptors. Comput. Electron. Agric. 2017, 136, 25–30. [Google Scholar] [CrossRef]
  42. Depypere, L.; Chaerle, P.; Mijnsbrugge, K.V.; Goetghebeur, P. Stony endocarp dimension and shape variation in Prunus section Prunus. Ann. Bot. 2007, 100, 1585–1597. [Google Scholar] [CrossRef] [PubMed] [Green Version]
  43. Frigau, L.; Antoch, J.; Bacchetta, G.; Sarigu, M.; Ucchesu, M.; Zaratin Alves, C.; Mola, F. A statistical approach to the morphological classification of Prunus sp. seeds. Plant Biosyst. Int. J. Deal. All Asp. Plant Biol. 2020, 154, 877–886. [Google Scholar] [CrossRef]
  44. Ropelewska, E.; Sabanci, K.; Aslan, M.F.; Azizi, A. A Novel Approach to the Authentication of Apricot Seed Cultivars Using Innovative Models Based on Image Texture Parameters. Horticulturae 2022, 8, 431. [Google Scholar] [CrossRef]
  45. Ropelewska, E.; Rutkowski, K.P. Differentiation of peach cultivars by image analysis based on the skin, flesh, stone and seed textures. Eur. Food Res. Technol. 2021, 247, 2371–2377. [Google Scholar] [CrossRef]
  46. Moretzsohn, F. Digital imaging: Flatbed scanners and digital cameras. In The Mollusks: A Guide to Their Study, Collection, and Preservation; Universal Publishers: Boca Raton, FL, USA, 2006; pp. 59–71. [Google Scholar]
  47. Blasco, J.; Garcia, E.M.; Sun, D.-W.; ZHENG, C. Vision Systems. In Optical Monitoring of Fresh and Processed Agricultural Crops; Zude, M., Ed.; CRC Press: Boca Raton, FL, USA, 2008; pp. 83–140. [Google Scholar]
  48. Gunduz, O.; Ceyhan, V.; Erol, E.; Ozkaraman, F. An Evaluation of farm Level Sustainability of Apricot Farms in Malatya Province of Turkey. J. Food Agric. Environ. 2011, 9, 700–705. [Google Scholar]
  49. Kousar, R.; Makhdum, M.S.A.; Abbas, A.; Nasir, J.; Naseer, M.A.u.R. Issues and Impacts of the Apricot Value Chain on the Upland Farmers in the Himalayan Range of Pakistan. Sustainability 2019, 11, 4482. [Google Scholar] [CrossRef] [Green Version]
  50. Karatas, N. Evaluation of Nutritional Content in Wild Apricot Fruits for Sustainable Apricot Production. Sustainability 2022, 14, 1063. [Google Scholar] [CrossRef]
  51. Rampáčková, E.; Göttingerová, M.; Gála, P.; Kiss, T.; Ercişli, S.; Nečas, T. Evaluation of Protein and Antioxidant Content in Apricot Kernels as a Sustainable Additional Source of Nutrition. Sustainability 2021, 13, 4742. [Google Scholar] [CrossRef]
Figure 1. Images of apricot stones belonging to different cultivars.
Sustainability 15 09259 g001
Figure 2. A schematic diagram of the imaging systems: (a) digital camera, and (b) flatbed scanner.
Sustainability 15 09259 g002
Figure 3. Image processing steps of images acquired using the digital camera or the flatbed scanner.
Sustainability 15 09259 g003
Figure 4. Classification results based on all features extracted from the images acquired using the RGB camera.
Sustainability 15 09259 g004
Figure 5. Classification results based on selected features extracted from the images acquired using the RGB camera.
Sustainability 15 09259 g005
Figure 6. Classification results based on all features extracted for images acquired using the flatbed scanner.
Sustainability 15 09259 g006
Figure 7. Classification results based on selected features extracted from the images acquired using the flatbed scanner.
Sustainability 15 09259 g007
Table 1. Classification accuracies for models based on features extracted from the images acquired using the RGB camera.
AlgorithmAll FeaturesSelected Features
Training (%)Testing (%)Training (%)Testing (%)
LDA-Linear97.8587.1097.8577.42
LDA-Diagonal87.1083.8798.9290.30
Quadratic Diagonal90.3280.6597.8593.55
Decision Trees96.7790.3298.9290.32
kNN97.8577.4298.9287.10
SVM97.8596.7797.8596.77
Table 2. Classification accuracies for models based on features extracted from the images acquired using the flatbed scanner.
AlgorithmAll FeaturesSelected Features
Training (%)Testing (%)Training (%)Testing (%)
LDA-Linear97.8587.1095.7093.55
LDA-Diagonal81.7267.7496.7796.77
Quadratic Diagonal69.8964.5298.92100
Decision Trees95.7090.3297.8587.10
kNN94.6287.10100100
SVM10093.5510096.77
Table 3. The selected textures of apricot stone images obtained using the RGB camera.
Colour Channel LColour Channel aColour Channel b
LHMean
LHPerc50
LHPerc90
LHPerc99
LHDomn01
LHDomn10
LS5SV3SumEntrp
LS5SV5SumOfSqs
LS5SZ5InvDfMom
LS5SZ5Entropy
LS5SN5AngScMom
LS5SN5InvDfMom
LS4RHRLNonUni
aHMean
aHSkewness
aHKurtosis
aHPerc01
aHPerc10
aHPerc90
aHDomn01
aHDomn10
aSGMean
aSGSkewness
aSGNonZeros
aS5SZ1SumOfSqs
aS5SV3SumEntrp
aS5SH5Contrast
aS5SH5InvDfMom
aS5SH5DifEntrp
aS5SZ5InvDfMom
aS5SN5AngScMom
aS5SN5InvDfMom
aS4RVGLevNonU
aS4RZGLevNonU
aATeta2
aASigma
bHMean
bHSkewness
bHPerc01
bHPerc10
bHPerc50
bHPerc90
bHDomn01
bHDomn10
bSGNonZeros
bSGPerc01
bS5SV1DifVarnc
bS5SZ3Entropy
bS5SH5InvDfMom
bS5SZ5Contrast
bS5SN5InvDfMom
Table 4. The selected texture parameters of apricot stone images acquired using the flatbed scanner.
Colour Channel LColour Channel aColour Channel b
LHMean
LHPerc10
LHPerc90
LHPerc99
LSGArea
LSGNonZeros
LS4RHShrtREmp
LATeta1
LATeta2
LATeta4
aHMean
aHSkewness
aHKurtosis
aHPerc01
aHPerc10
aHPerc50
aHDomn01
aHMaxm10
aHDomn10
aSGSkewness
aSGKurtosis
aS5SZ1Correlat
aS5SZ3DifEntrp
aS4RHGLevNonU
aS4RHLngREmph
aS4RVRLNonUni
aATeta2
aATeta4
bHMean
bHSkewness
bHPerc01
bHPerc10
bHPerc90
bHPerc99
bSGArea
bSGSkewness
bSGKurtosis
bATeta2
bATeta4
Table 5. Classification accuracies for models based on features extracted from L, a, and b colour channels for images acquired using the RGB camera.
AlgorithmSelected Features (L*)Selected Features (a*)Selected Features (b*)
Training (%)Testing (%)Training (%)Testing (%)Training (%)Testing (%)
LDA-Linear86.0280.0693.5583.8790.3280.65
LDA-Diagonal72.0467.7481.7283.8782.883.87
Quadratic diagonal74.1967.7484.9583.8783.9783.87
Decision Trees79.5764.5289.2567.7490.3287.10
kNN92.4767.7494.6271.9793.5583.87
SVM86.0280.6596.7780.6593.5587.10
Table 6. Classification accuracies for models based on features extracted from L, a, and b colour channels for images acquired using the flatbed scanner.
AlgorithmSelected Features (L*)Selected Features (a*)Selected Features (b*)
Training (%)Testing (%)Training (%)Testing (%)Training (%)Testing (%)
LDA-Linear92.4783.8796.7780.6589.2577.42
LDA-Diagonal86.0287.1086.0280.6582.8080.65
Quadratic diagonal88.1787.1091.4090.3284.9580.65
Decision Trees90.3274.1995.7074.1988.1767.74
kNN97.8583.8710083.8795.7070.97
SVM94.6283.8795.7083.8793.5567.74
Disclaimer/Publisher’s Note: The statements, opinions and data contained in all publications are solely those of the individual author(s) and contributor(s) and not of MDPI and/or the editor(s). MDPI and/or the editor(s) disclaim responsibility for any injury to people or property resulting from any ideas, methods, instructions or products referred to in the content.

