Article

Spatio-Temporal Evolution and Driving Factors of “Non-Grain Production” in Hubei Province Based on a Non-Grain Index

School of Public Administration, Huazhong Agriculture University, Wuhan 430072, China
*
Author to whom correspondence should be addressed.
Sustainability 2023, 15(11), 9042; https://doi.org/10.3390/su15119042
Submission received: 16 March 2023 / Revised: 10 May 2023 / Accepted: 11 May 2023 / Published: 2 June 2023
(This article belongs to the Special Issue Urban Sprawl and Sustainable Land Use Planning)

Abstract

:
Non-grain production (NGP) on cultivated land has become a common phenomenon due to the prosperity of the rural economy and the optimisation of the agricultural structure. However, the excessive use of cultivating land for NGP has threatened food production and the sustainable use of cultivated land. To halt this trend and to ensure food security, the authors of this paper applied a novel non-grain index to measure NGP, which could reflect multiple NGP activities; designated Hubei Province as its object of research; and revealed NGP’s spatio-temporal patterns of the past 30 years. We then assessed the characteristics of NGP based on spatial autocorrelation analysis, the Theil index, and geographically weighted regression. The results showed that the value of the non-grain index grew from 0.497 to 1.113 as NGP increased significantly in Hubei Province. The number of high-NGP counties increased, spatial agglomeration became obvious, and the eastern and western sides of Hubei Province witnessed an observable growth in NGP. As a result, the NGP in the eastern and western regions overtook production in the central region. Despite a series of historical subsidy policies and agricultural modernisation initiatives that promoted the planting of grain crops, the policy of “grain on valuable cultivated land” could be better implemented. We conclude by making some suggestions for reducing NGP and protecting cultivated land.

1. Introduction

The COVID-19 pandemic and global climate change have exacerbated the pressure on global food security [1]. The United States, India, and Brazil are among the top four grain-producing countries with the highest number of COVID-19 cases and deaths, affecting grain planting, and countries have restricted food exports to cope with the shortage of food during the epidemic [2]. Global warming has also led to a lack of crops in many areas. From 1983 to 2019, 75% of wheat-growing regions, 82% of corn-growing regions, and 62% of rice-growing regions around the world had reduced yields due to drought [3]. Additionally, cultivated land is the principal carrier for grain production [4], but urbanisation and industrialisation have transformed cultivated land [5]. For example, a lot of cultivated land has been diverted to construction areas [6]. Some studies have suggested that grain crop production can only fulfil the demand for less than one-third of the population [7]. The report “2022 World Grain Safety and Nutrition Status” estimates that 828 million people worldwide are hungry [8,9].
As a country with scarce land per capita, food safety and cultivated land protection have always been the focus of the Chinese government’s attention. The Chinese government has established a relatively comprehensive policy system for cultivated land protection in recent decades, which has helped reduce large-scale farmland loss due to urbanisation [10,11]. In addition to the dominant loss of cultivated land, the recessive loss of grain production capacity has become increasingly difficult to ignore [12]. Due to low grain crop planting income and the optimisation of agricultural structures, part of the cultivated land used to plant grain crops and cash crops has been turned into plant cash crops, and some farmers have moved out of crop production altogether, causing the phenomenon of NGP [12]. NGP refers to various reasons, such as economic interests, to change the use of cultivated land, including Planting NGP (e.g., planting cash crops) and Production NGP (breeding, forestry, fruit farming, land abandonment, and leisure and tourism) [13,14,15]. Although the growth of NGP has brought more income to farmers, it has also reduced food security and ecological protection [16], and the cultivation of cash crops occupies cultivated land and affects the production of grain crops. Production NGP activities such as breeding, forestry, and fruit farming have not only reduced the areas of sown grain, they have also reduced the food production capacity of cultivated land. It was determined that the pond farming of fish and the cultivation of eucalyptus have adversely affected the soil tillage layer [17]. Therefore, future cultivation will be difficult. Excessive NGP would accelerate soil erosion [16], threaten local biodiversity [17], aggravate non-point source pollution [18,19], and increase carbon dioxide emissions [20], destroying the ecological environment and threatening the sustainable use of cultivated land. One study showed that the NGP rate in China is approximately 32.9% [21]. As a result, the sown-grain area in China decreased by 9.7 × 10⁵ hm2 in 2019. A total of 874,000 hectares of maise plantations were lost, rice plantings decreased by 495,000 hectares, and wheat plantings declined by 538,000 hectares [22]. Therefore, NGP has become an important issue in terms of food security. In 2020, China’s General Office of the State Council issued “Opinions on Preventing Non-Grain Activities and Stabilizing Grain Production of Cultivated Land”. This pointed out that NGP is an urgent problem to be resolved in China. In addition, while cultivated land is widely disseminated across China, the types and degrees of NGP are different in each region. Therefore, analysing how NGP develops in China and exploring its potential mechanisms and influencing factors is important for controlling NGP according to regional conditions.
Some studies analysed the evolution and spatial characteristics of NGP, noting that NGP mainly showed an upward trend across China. NGP growth accelerated across the country after 2017 [21,23]. Some studies suggested that NGP has declined in traditional agricultural areas [12]. However, there have been some contrary viewpoints [21], as some studies showed that NGP obviously increased on the Kuan-Chung Plain. Other studies were performed on a small scale [13,24,25,26]. One such study found that pond farming was a major form of NGP in some areas, and the acreage used for it continued to grow during the study period [24]. Overall, according to previous research, there are primarily two ways to measure NGP. One is based on statistical data [12,21,24,27,28,29,30,31], and it has mostly focused on the national or provincial level. Some studies measured Planting NGP with grain ratio, and other studies constructed a formula containing the multiple-crop index to reflect multiple NGP activities. However, the multiple-crop index cannot express the recurrence of crops (the index assumes that all cultivated land is used for crops, which it is not). As a result, these measurements can only express the ratio of grain crops to cash crops, ignoring the influence of the Production NGP activities of NGP. The other way to measure NGP has been a visual interpretation according to remote sensing images and field surveys [13,24,25,26]. This method has mostly been used to assess the NGP of county-level units based on high-precision remote sensing images. However, while the measurement of photographic interpretations and field surveys does indeed increase the accuracy of recognising the type and degree of NGP, research can only be carried out within county-level units because of the high resolution that is required to identify crop species. At the same time, it is sometimes difficult to obtain high-resolution images before 2005, and this method is limited in both time scale and space scale [32,33]. For large-scale studies, such as province-level unit assessments, the above-mentioned methods cannot measure NGP accurately.
Other studies focused on the factors influencing NGP [21,29,34]. They were mainly carried out through three lenses: farmers, economics, resource endowment, and government management. From the perspective of farmers, production risk and income are the most influential factors on cultivated land-use behaviour [35]. The change in the cultivated land-use model is the process of comparing grain-crop income and non-grain income. Moreover, cultivated land is widely distributed, with large differences in socioeconomic and resource endowment; some studies suggest that these factors have had different effects on the NGP in each region [13,21], leading to the spatial heterogeneity of NGP. Related agricultural policy has had the most rapid impact on NGP [30,31]. Factors such as grain subsidies and the optimisation of agricultural structures have driven the change in NGP in the short term. However, the research on factors influencing NGP is mainly based on the measurement of the grain ratio on a large scale, whereas the factors that affect Production NGP are often ignored. Despite a large number of studies, some limitations of the previous research are worth noting.
Owing to differences in the type and degree of the NGP in each region [27,28,36], it is necessary to reveal the internal mechanisms of NGP development and the spatio-temporal evolution of NGP. To measure NGP from multiple activities and provide policy suggestions for controlling NGP according to local conditions, we constructed a non-grain index based on the cultivated land areas versus the sown-grain areas, which is suitable for larger studies. In this study, we chose Hubei Province as our research object and revealed the regulation of the spatio-temporal dynamics of NGP from 1991 to 2019, and explored its tipping point. We applied the Theil index, autocorrelation analysis, and the geographically weighted regression model to explore the potential mechanisms of the spatio-temporal dynamics of NGP. Finally, we put forward suggestions for reducing non-grain activities and protecting the sustainability of cultivated land.

2. Materials and Methods

2.1. Study Area

Hubei Province is located in the centre of China and has various landforms: the highest altitude in western Shennongjia is 3105 m; the central Jianghan Plain is 35 m above sea level with flat terrain and fertile soil. Hubei Province is located in a subtropical zone, with an average temperature of 15 °C–17 °C and an average annual precipitation of 800–1600 mm (http://www.hubei.gov.cn). It receives plenty of light and precipitation. The water network is vertical and horizontal, with abundant water resources and excellent agricultural production conditions. Hubei Province’s cultivated land area is 4.77 × 10⁶ hm2, accounting for 3.73% of the total area of the country. It is an important producing and exporting grain region [37], and it plays a pivotal role in China’s grain production. However, in recent years, NGP has become a salient issue in terms of food security, and there are different types and degrees of NGP in each area. For example, the type of NGP of Yichun County in 2020 was mainly planted non-grain crops. Among them, the planting area of medicinal material exceeded 2 × 10⁴ hm2, accounting for 29.8% of the cultivated land area of Yichun County. Abandoned land is the main reason for the NGP of Xiangrong Village in Honghu City, with a wasteland area of 46.7 hm2, accounting for more than 40% of the cultivated land in the village. In Jianli, Qianjiang, and Honghu, the conversion from double- to single-season rice cropping systems (referred to as the rice “double-to-single” phenomenon) increased the risk of NGP. The rise in NGP in Hubei Province has seriously impacted the production of grain. According to the statistics in the China Statistical Yearbook and the Hubei Rural Statistical Yearbook, from 1991 to 2019, Hubei Province’s grain production decreased from 5.16% to 4.10%. The annual output of food in Hubei Province decreased by 1.873 million tons, and the status of major grain production areas has continued to decline.

2.2. Data Collection and Processing

The data gathered in this study include socioeconomic statistics, land-use facts, and other online data. The data on the cultivated land area, sown-grain area, sown area of cash crops, irrigated area of cultivated land, population degree, agricultural employment, total power of agricultural machinery, and GDP are obtained from the China Statistical Yearbook (1992–2020) and the China Land and Hubei Rural Statistical Yearbook (1992–2020), which are available on the China National Knowledge Infrastructure Platform (https://www.cnki.net/). Administrative boundary data were sourced from the 3rd National Land Resource Survey on Hubei Province. Hubei Province’s slope data and road data are derived from the Resource and Environment Science and Data Center of the Chinese Academy of Sciences (https://www.resdc.cn/), and the average annual precipitation data are derived from the monitoring data of the Hubei Meteorological Service (http://hb.cma.gov.cn/). In terms of data processing, to avoid outliers in the NGP measurements, we consolidated small municipal districts, such as merging Wuhan’s seven principal urban areas. At the same time, in order to facilitate the compilation of statistics, we merged counties with changing administrative divisions. For example, the Duodao District of Jingmen City was divided into Dongbao District in 2001, and its statistics before 2001 are missing, so we merged them into Jingmen municipal district in this study. As a result, we obtained 83 subjects in 103 county-level divisions of Hubei Province, which we divided into four zones built on geographic location (Figure 1).

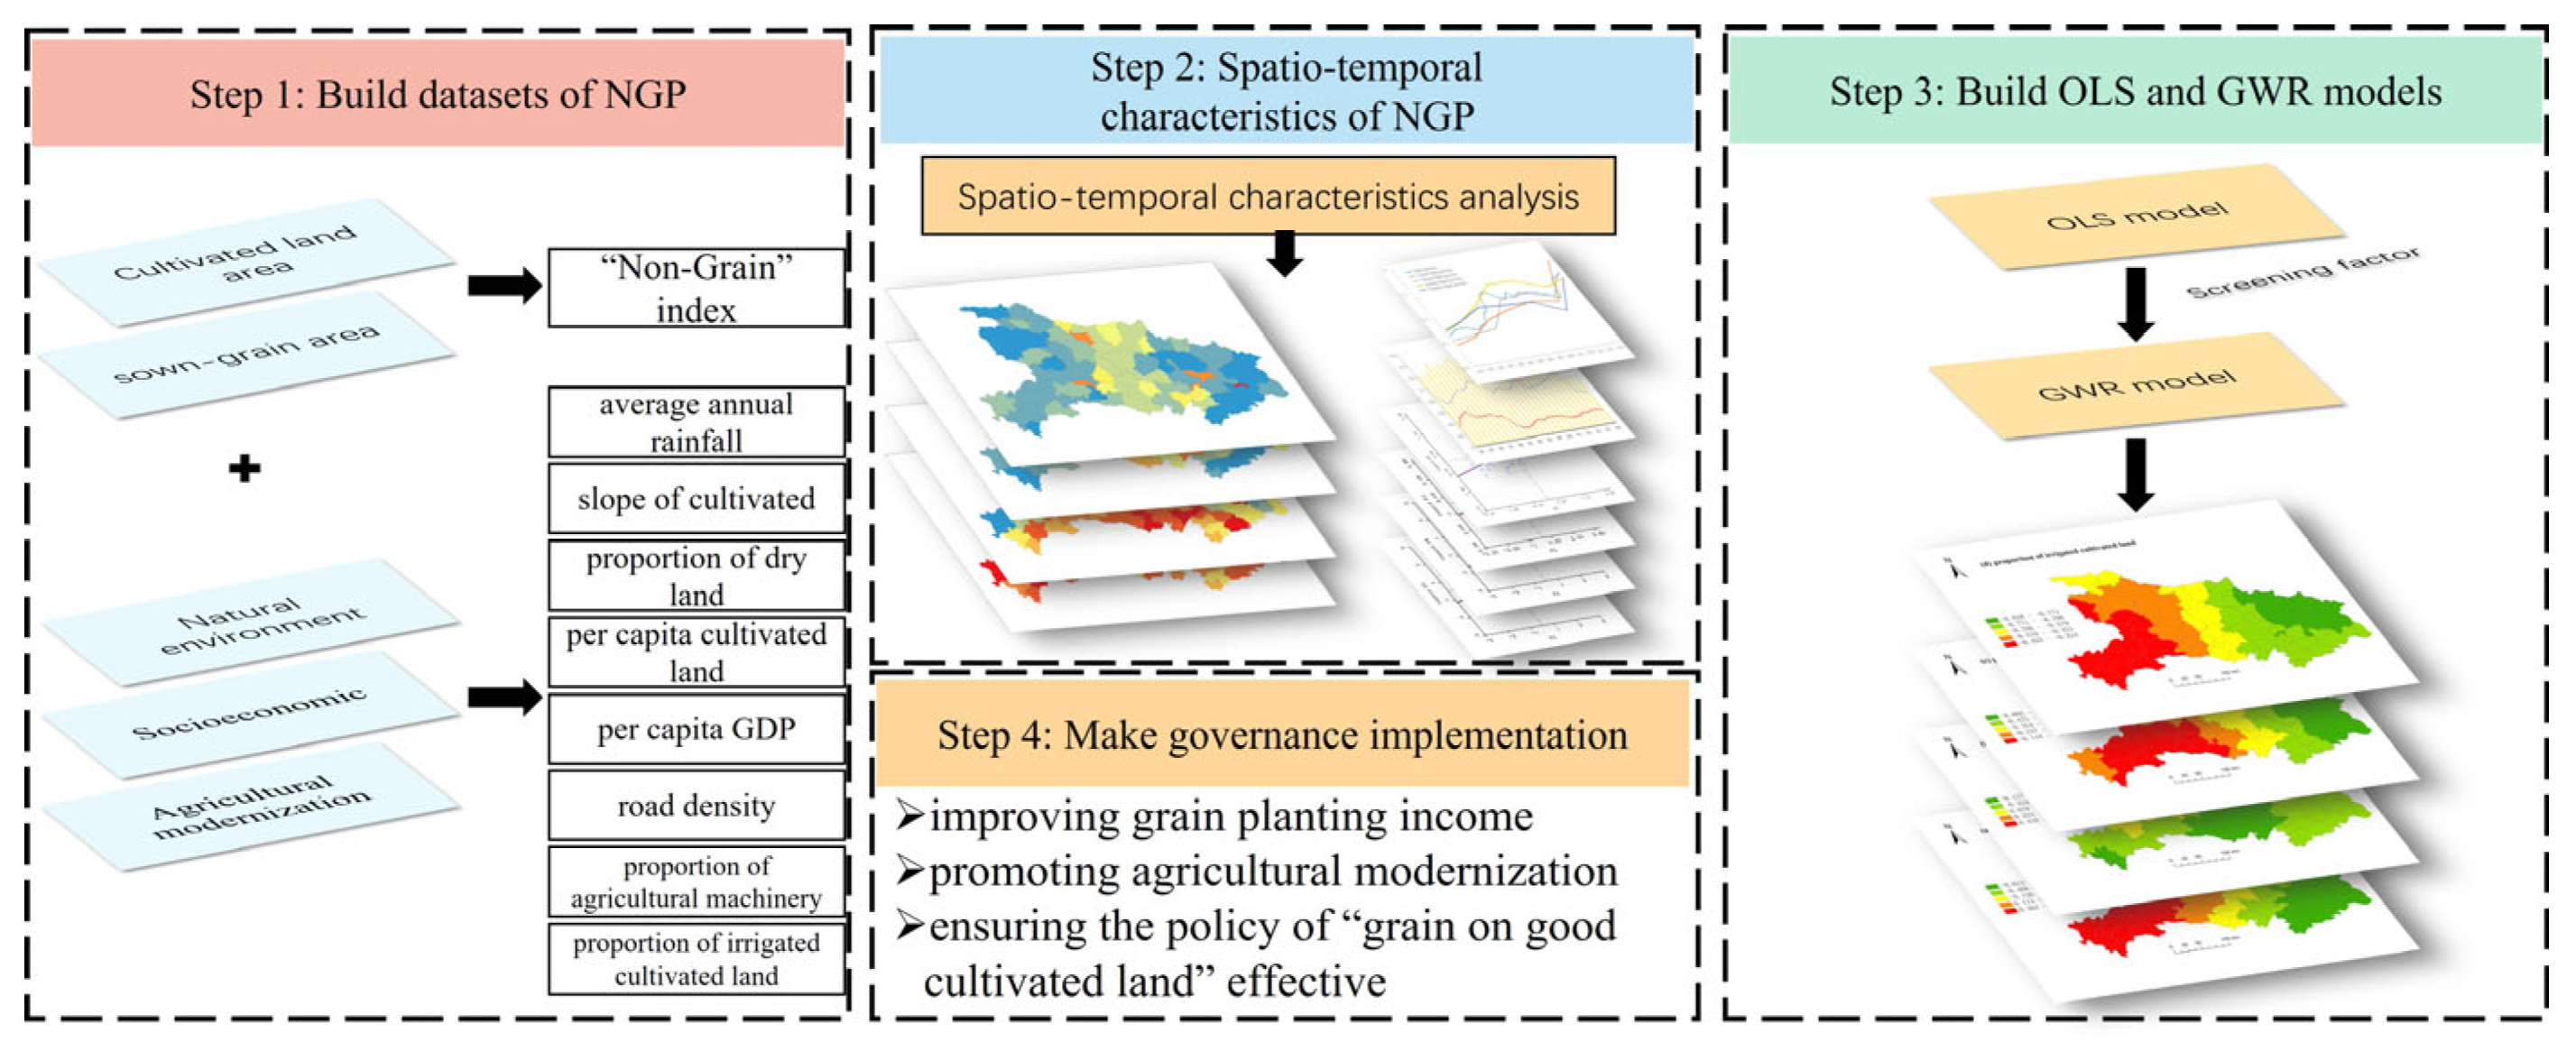
2.3. Framework and Methods

2.3.1. Framework

In order to reveal the characteristics of the spatio-temporal evolution of NGP and to explore its mechanisms and influencing factors, we constructed a framework as follows (Figure 2). Step 1: Build datasets of NGP and construct our non-grain index based on the area of cultivated land and sown-grain area. Step 2: Analyse the spatio-temporal evolution characteristics of NGP with spatial autocorrelation and the Theil index. Step 3: Identify the main influencing factors with an ordinary least squares (OLS) model; moreover, analyse the spatial heterogeneity of factors using a geographically weighted regression (GWR) model. Step 4: Put forward policy suggestions to control NGP.

2.3.2. Non-Grain Index

NGP refers to changes in the use of cultivated land. The ratio of NGP is the proportion of cultivated land used for NGP to the total cultivated land of a region [12], and the formula is:
k = S n S f = S f S G S f
where k is the ratio of NGP; S f is the area of cultivated land; S n is the area of cultivated land for NGP; and S G is the area of cultivated land for grain.
Planting NGP (planting cash crops) and Production NGP (e.g., breeding, forestry, fruit farming, land abandonment, and leisure and tourism) results in an increase in the ratio of NGP. However, it is very difficult to obtain statistics for the “area of cultivated land for grain”; some studies use grain ratio (Formulas (2) and (3)) to measure Planting NGP (see Table 1), and some studies replace it with “sown-grain area/multiple-crop index” (Formulas (4) and (5)). Formally, the latter seems to be a good way to measure NGP, but it is not. The multiple-crop index is calculated by the ratio of the sown-grain area to the crop-sown area, ignoring the Production NGP. However, some cultivated land is used for breeding, forestry, and fruit farming instead of planting crops [38,39,40]. Thus, the multiple-crop index cannot express the recurrence of crops. Further, we transform Formula (5) and find that it is exactly the same as the grain ratio (Formula (6)). Meanwhile, previous measurements can only express the ratio of grain crops to cash crops, which are Planting NGP.
Table 1. NGP measurements in previous studies.
FormulaDescriptionReferenceNumber
K = S g S c × 100 % S g is the sown-grain area, and S c is the crop-sown area. Expresses the ratio of grain to crops.[41](2)
K = 1 S g S c × 100 % Expresses the ratio of cash crops to crops.[35,42,43](3)
ρ = S c S f × 100 % ρ is the multiple-crop index, but it cannot measure the recurrence of crops.[38,39,40](4)
K = 1 S g S f × ρ × 100 % The measurement result is the same as that of formula 3.[12,21,44](5)
K = 1 S g S f × S c S f × 100 % = 1 S g S c × 100 % = K
For example, the actual level of NGP was unchanged when the cultivated land was converted from Planting NGP to Production NGP, which are both NGP activities. However, due to the decrease in crop-sowing area, the grain ratio falsely indicates that NGP is reduced. Similarly, the actual level of NGP rises when the cultivated land is converted from crops (both grain and cash crops) to Production NGP, but the trend of grain ratio is related to the ratio of the sowing area of two crops, with possible increases or decreases or no changes. That is, when cultivated land is used for Production NGP, such as breeding, forestry, fruit farming, land abandonment, and leisure and tourism, there is a discrepancy between the estimate of grain ratio and the actual situation. In order to cover all types of NGP, we applied a so-called non-grain index (Formula (7)). The recurrence of crops is similar due to the natural environment in Hubei Province [38]. As the “area of cultivated land for grain” increases or decreases, the “sown-grain area” changes accordingly. Therefore, we replace “area of cultivated land for grain” with “sown-grain area” to reveal the evolution of NGP. As the “sown-grain area” may be larger than the cultivated area due to the recurrence of crops, to ensure a positive value of K (≥0), we add the constant term “a”. According to the repeated cropping of crops in Hubei Province, “a” is set to 1, a high value for K indicates a high level for NGP, and the formula is:
K = a + S f S g S f × 100 %
From the perspective of the non-grain index, when cultivated land used to plant grain crops turns into NGP, whether it is Planting NGP or Production NGP, the sown-grain area is reduced, S f S g increases, and the non-grain index also increases, which indicates the growth of NGP. On the contrary, when S f S g decreases, the non-grain index also decreases, indicating that NGP is shrinking. At the same time, when the recurrence of crops decreases, such as the rice “double-to-single” phenomenon, the decrease in the sown-grain area leads to an increase in S f S g , and the index indicates the growth of NGP. The current approaches to NGP are complex, including planting cash crops, poultry breeding, tree planting, and abandoning cultivated land due to lack of a labour force, for example. In addition, the rice “double-to-single” phenomenon also increases the risk of NGP, but previous research paid less attention to it. Therefore, compared with the previous formulas that can only measure NGP for planting, a novel non-grain index utilised to measure NGP, which could reflect multiple NGP activities, has great significance for revealing how NGP develops in Hubei Province.

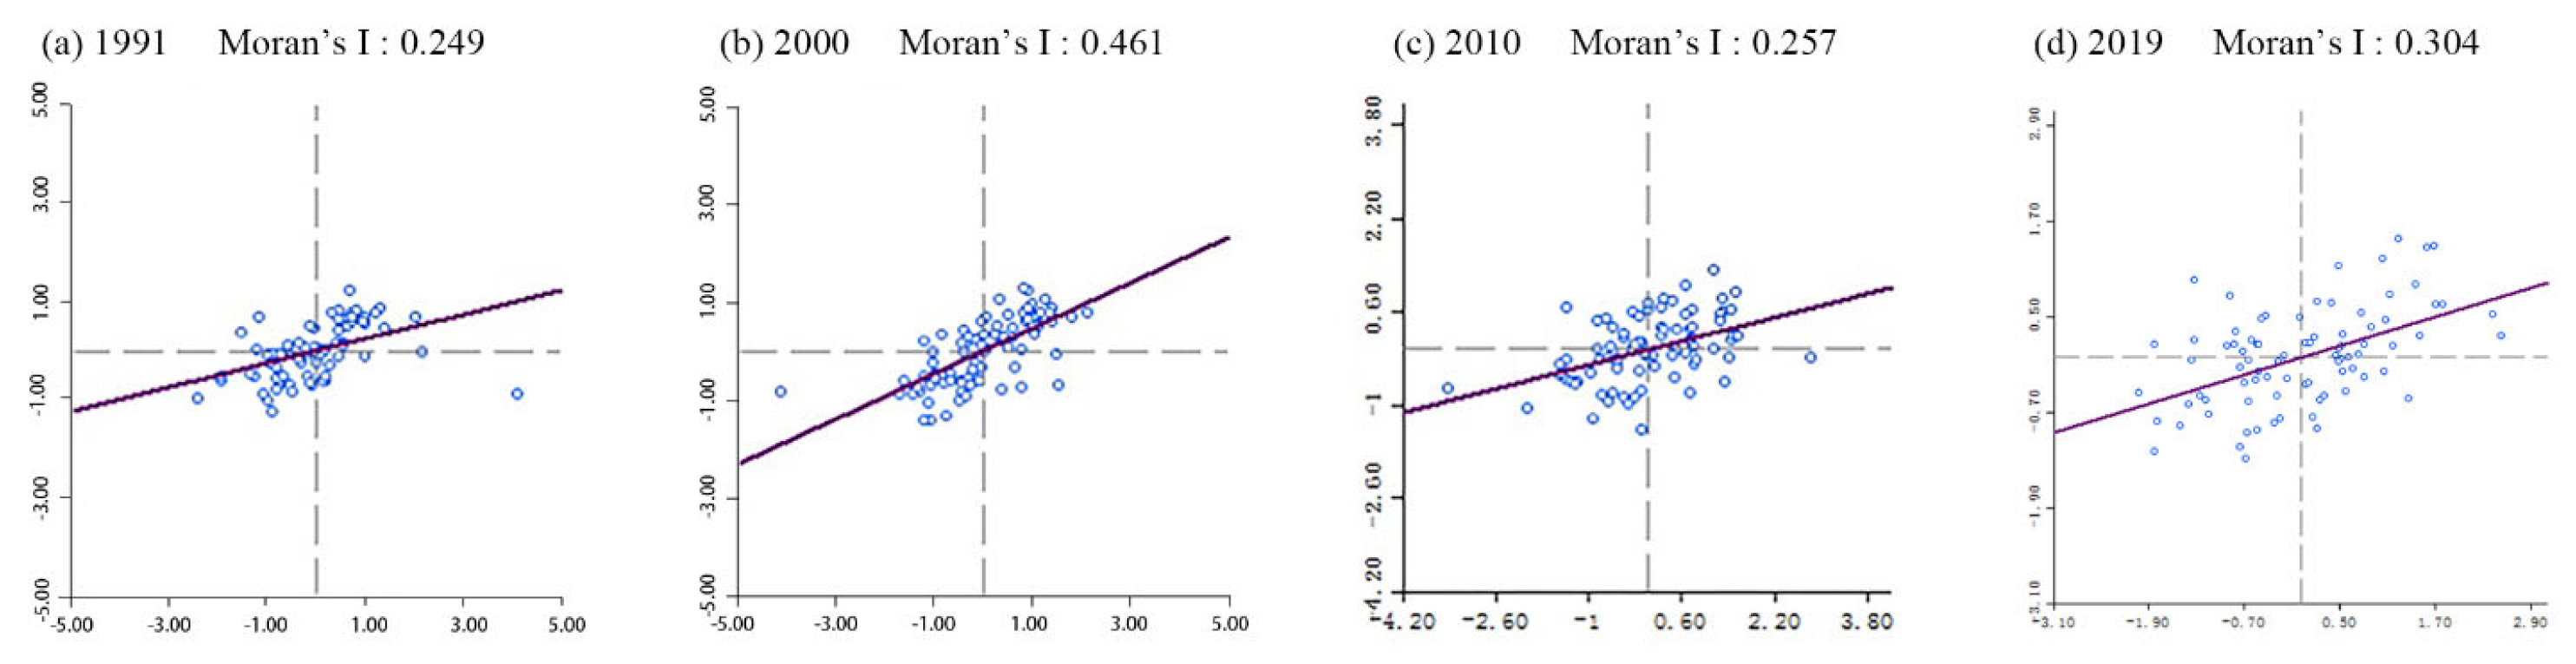
2.3.3. Spatial Autocorrelation Analysis

Spatial autocorrelations include global autocorrelations and local autocorrelations, which test whether observations are correlated between units. This study used the global Moran’s I index to reveal the overall distribution of NGP in Hubei Province. A Moran’s I value represents a range between −1 and 1. An increase in spatial correlation is observed when the absolute index value approaches 1. Positive values indicate positive spatial correlation, whereas negative values indicate negative spatial correlation. If Moran’s I is equivalent to 0, there is no spatial correlation, and only randomness exists [22]. The formula is:
I = n i = 1 n j = 1 n w i j ( y i y ¯ ) ( y j y ¯ ) ( i = 1 n j = 1 n w i j ) i = 1 n ( y i y ¯ ) 2
where n is the number of counties in Hubei Province; y i and y j are the non-grain index values of counties i and j , respectively; y ¯ is the mean of y i and y j ; and the spatial weight matrix w i j indicates the strength of the relationship between counties i and j .

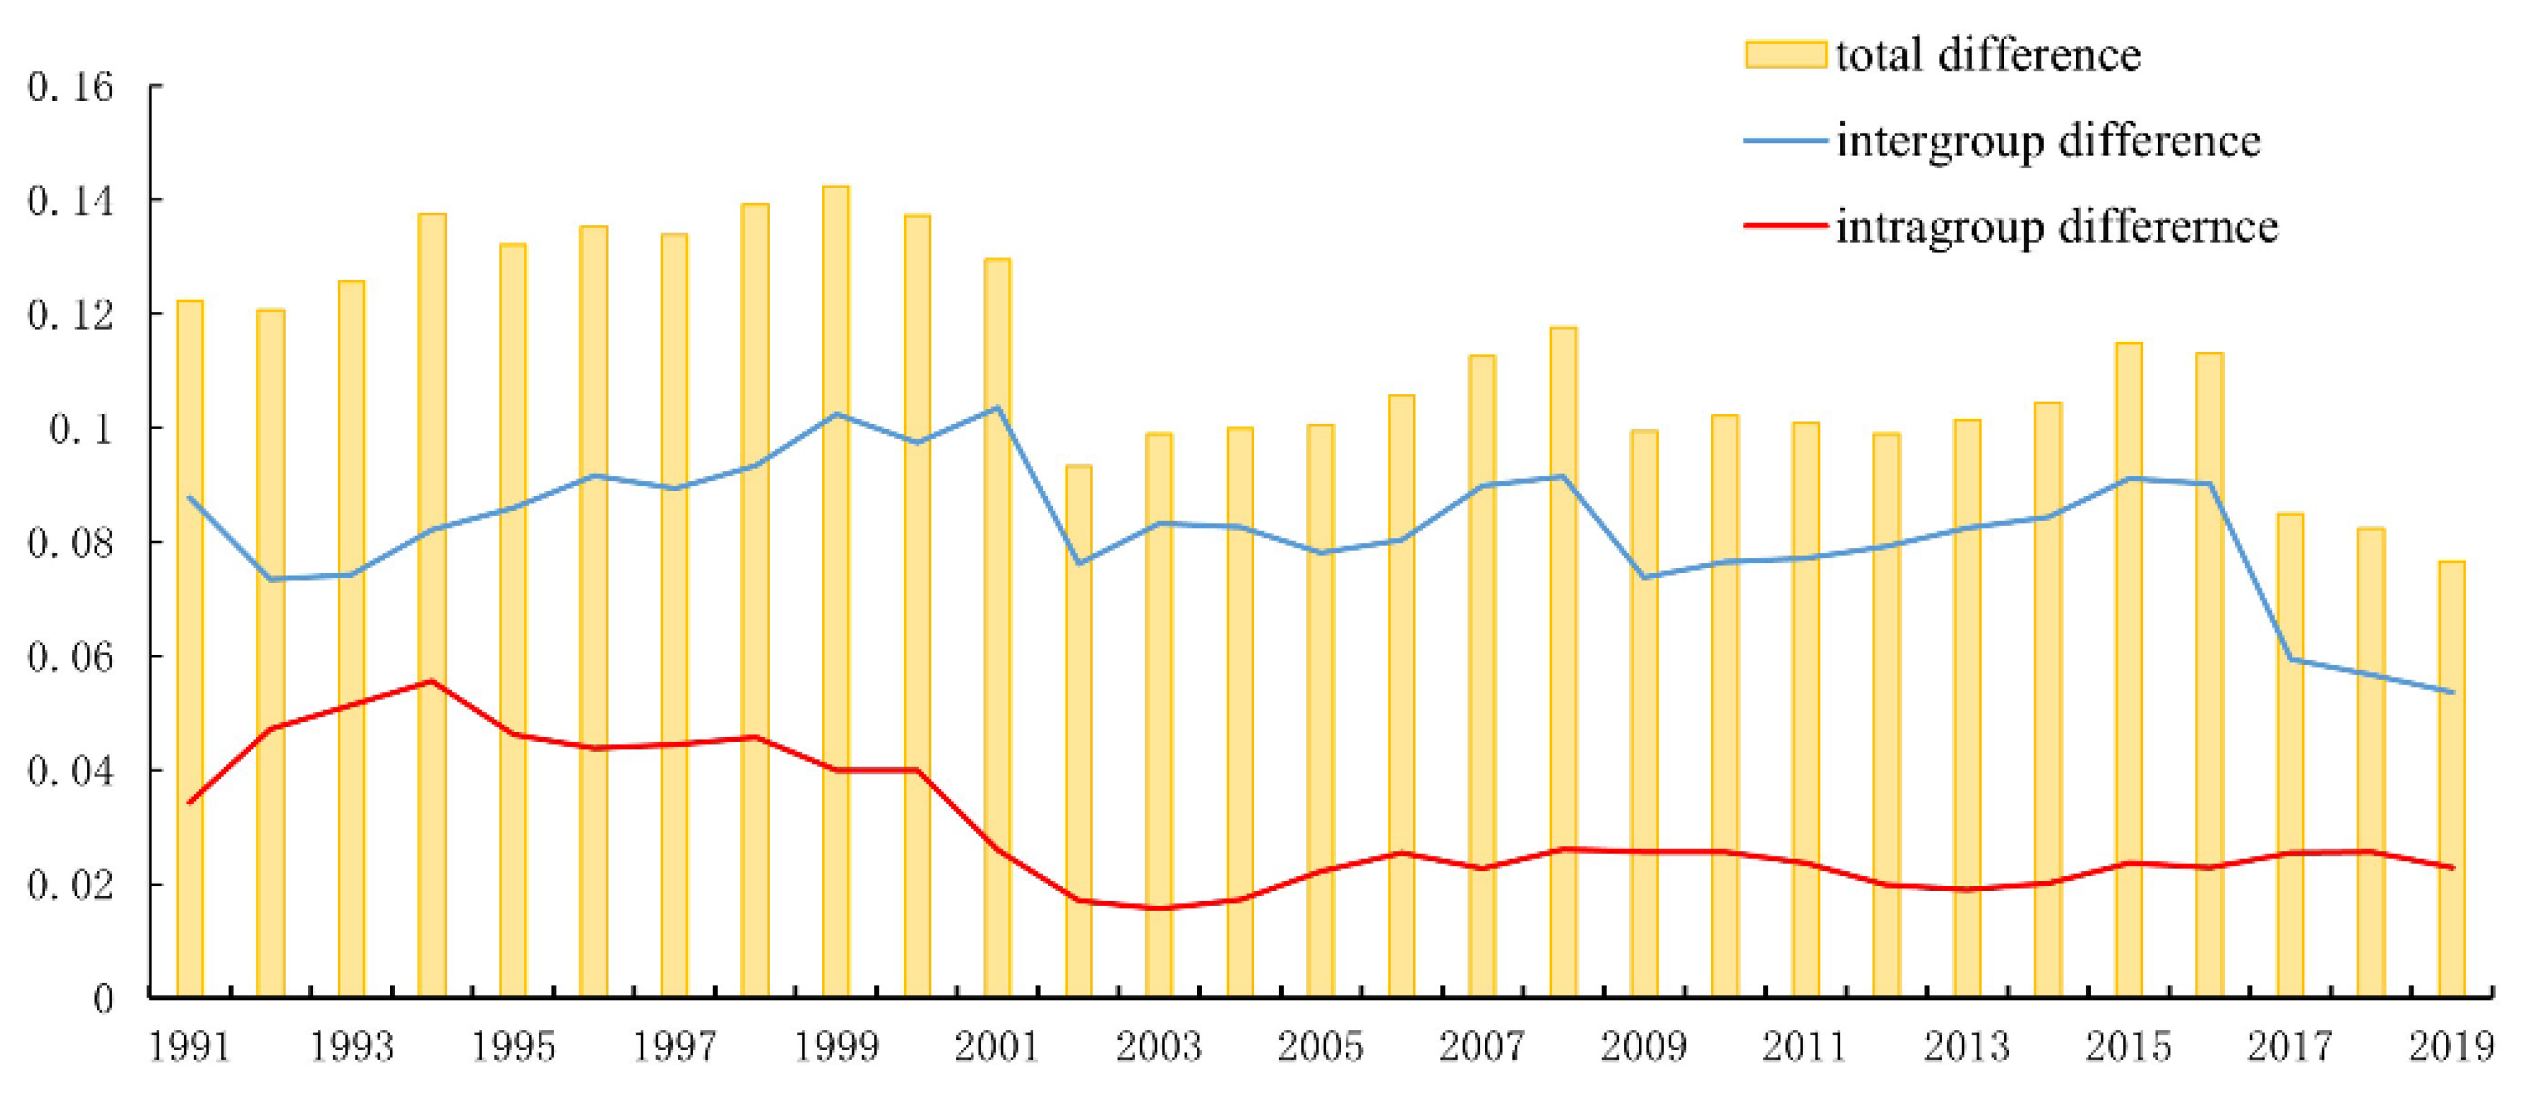
2.3.4. Theil Index Model

The Theil index is derived from a generalised entropy measure [45]. The Theil index can illustrate the characteristics of additive decomposition. The overall difference relates to intra- and inter-regional differences. It is possible to measure how much both contribute to the overall difference [46,47]. The formula is:
T = p = 1 n 1 n × y p u y × l n y p u y
where n is the number of counties in Hubei Province, y p is the non-grain index value of county p , and u y is the non-grain index value of the province.
The value for a Theil index is between 0 and ln n . If the non-grain index of each county is the same, the value of the Theil index is 0, illustrating that there is no difference between counties. If a county has a small area of cultivated land and a large sown-grain area, the value of the Theil index is ln n . The relationship between the intra-regional differences ( T w r ) and inter-regional differences ( T b r ) is:
T = T b r + T w r
The formula for inter-regional differences ( T b r ) is:
T b r = i = 1 n p i P × y i μ × l n y i μ
where n is the number of city-level units in Hubei Province; p i is the number of county-level units of one city; p is the number of counties in Hubei Province; y i is the non-grain index value of city i ; and μ is the non-grain index value of the province.

2.3.5. GWR Mode

The GWR model represents a development of the OLS test. GWR can reflect changes in the relationship between independent variables and dependent variables with different geographical locations [48,49]. We examined the spatial heterogeneity of the influence of factors on NGP by embedding the non-grain index and factor data into regression models according to spatial location [17,50]. The formula for this calculation is:
y i = β 0 u i , v i + m β m u i , v i x i m + ε i
where y i is the non-grain index value of the county-level unit; u i , v i is the geographic coordinate of county i ; β 0 is the regression constant in county i ; x i m is the value of the interpretation variable x m in county i ; the function β m u , v has the value β m u i , v i in county i ; m is the number of variables affecting the non-grain index; and ε i is the error term.
Before GWR modelling, factor data were normalised to eliminate dimensional differences among independent variables. The data processing formula is:
X i u i , v i = X i u i , X i m i n / ( X i m a x X i m i n )
where X i m a x and X i m i n are the maximum and minimum values of interpretation variable x i , respectively. If the regression coefficient is positive, it means that the explanatory variable has a positive impact on the non-grain index, and if the regression coefficient is negative, it means that the explanatory variable has a negative impact on the non-grain index.

2.3.6. Indicators Selection

Numerous factors affect NGP. Via cultivated land operators, the use of cultivated land is affected by factors such as the production capacity of cultivated land and the efficiency of crop planting. This study refers to previous research results (see Table 2), and, taking into account the availability and classicality of factor data, we identified the principal selection factors of NGP. These factors can better explain the impetus driving NGP from different viewpoints, including the natural environment, socioeconomic development, and agricultural modernisation perspectives [51].
Resource endowment is an important factor that affects the use of cultivated land. Rice needs to grow in an environment with sufficient water and a suitable temperature [58]. Crops are difficult to grow on sloping cropland because of the lack of water and soil. Dry land is not conducive to the growth of crops, resulting in a decline in production [59]. This study selected the average annual rainfall, the slope of cultivated land, and the proportion of dry land as the natural condition indicators.
Socioeconomic development pertains to the economic benefits of agriculture [1], and the relatively low monetary benefit of grain growing is an important factor that leads to NGP. Normally, there is a huge gap between grain income and average income in economically developed areas. Farmers prefer to grow commercial crops with higher investment income. Complete transportation facilities can reduce the costs of transportation of agricultural products [60], and the area of cultivated land per capita also affects a farmer’s income, which influences the land-use decision of cultivated land operators [61]. This study selected per capita cultivated land area, per capita GDP, and road density as the socioeconomic indicators.
Agricultural modernisation is an important consideration affecting the efficiency of agricultural production, and mechanisation of agriculture has led to a shift in production methods, which can effectively replace family labour [42]. Irrigation technology provides crops with water and maintains the production of crops. Agricultural modernisation can increase a farmer’s income and enlarge their asset investment, thus changing incomes and affecting the costs and choices of land operators. This study selected machinery power and the proportion of irrigated cultivated land as indicators to measure the level of agricultural modernisation.

3. Results

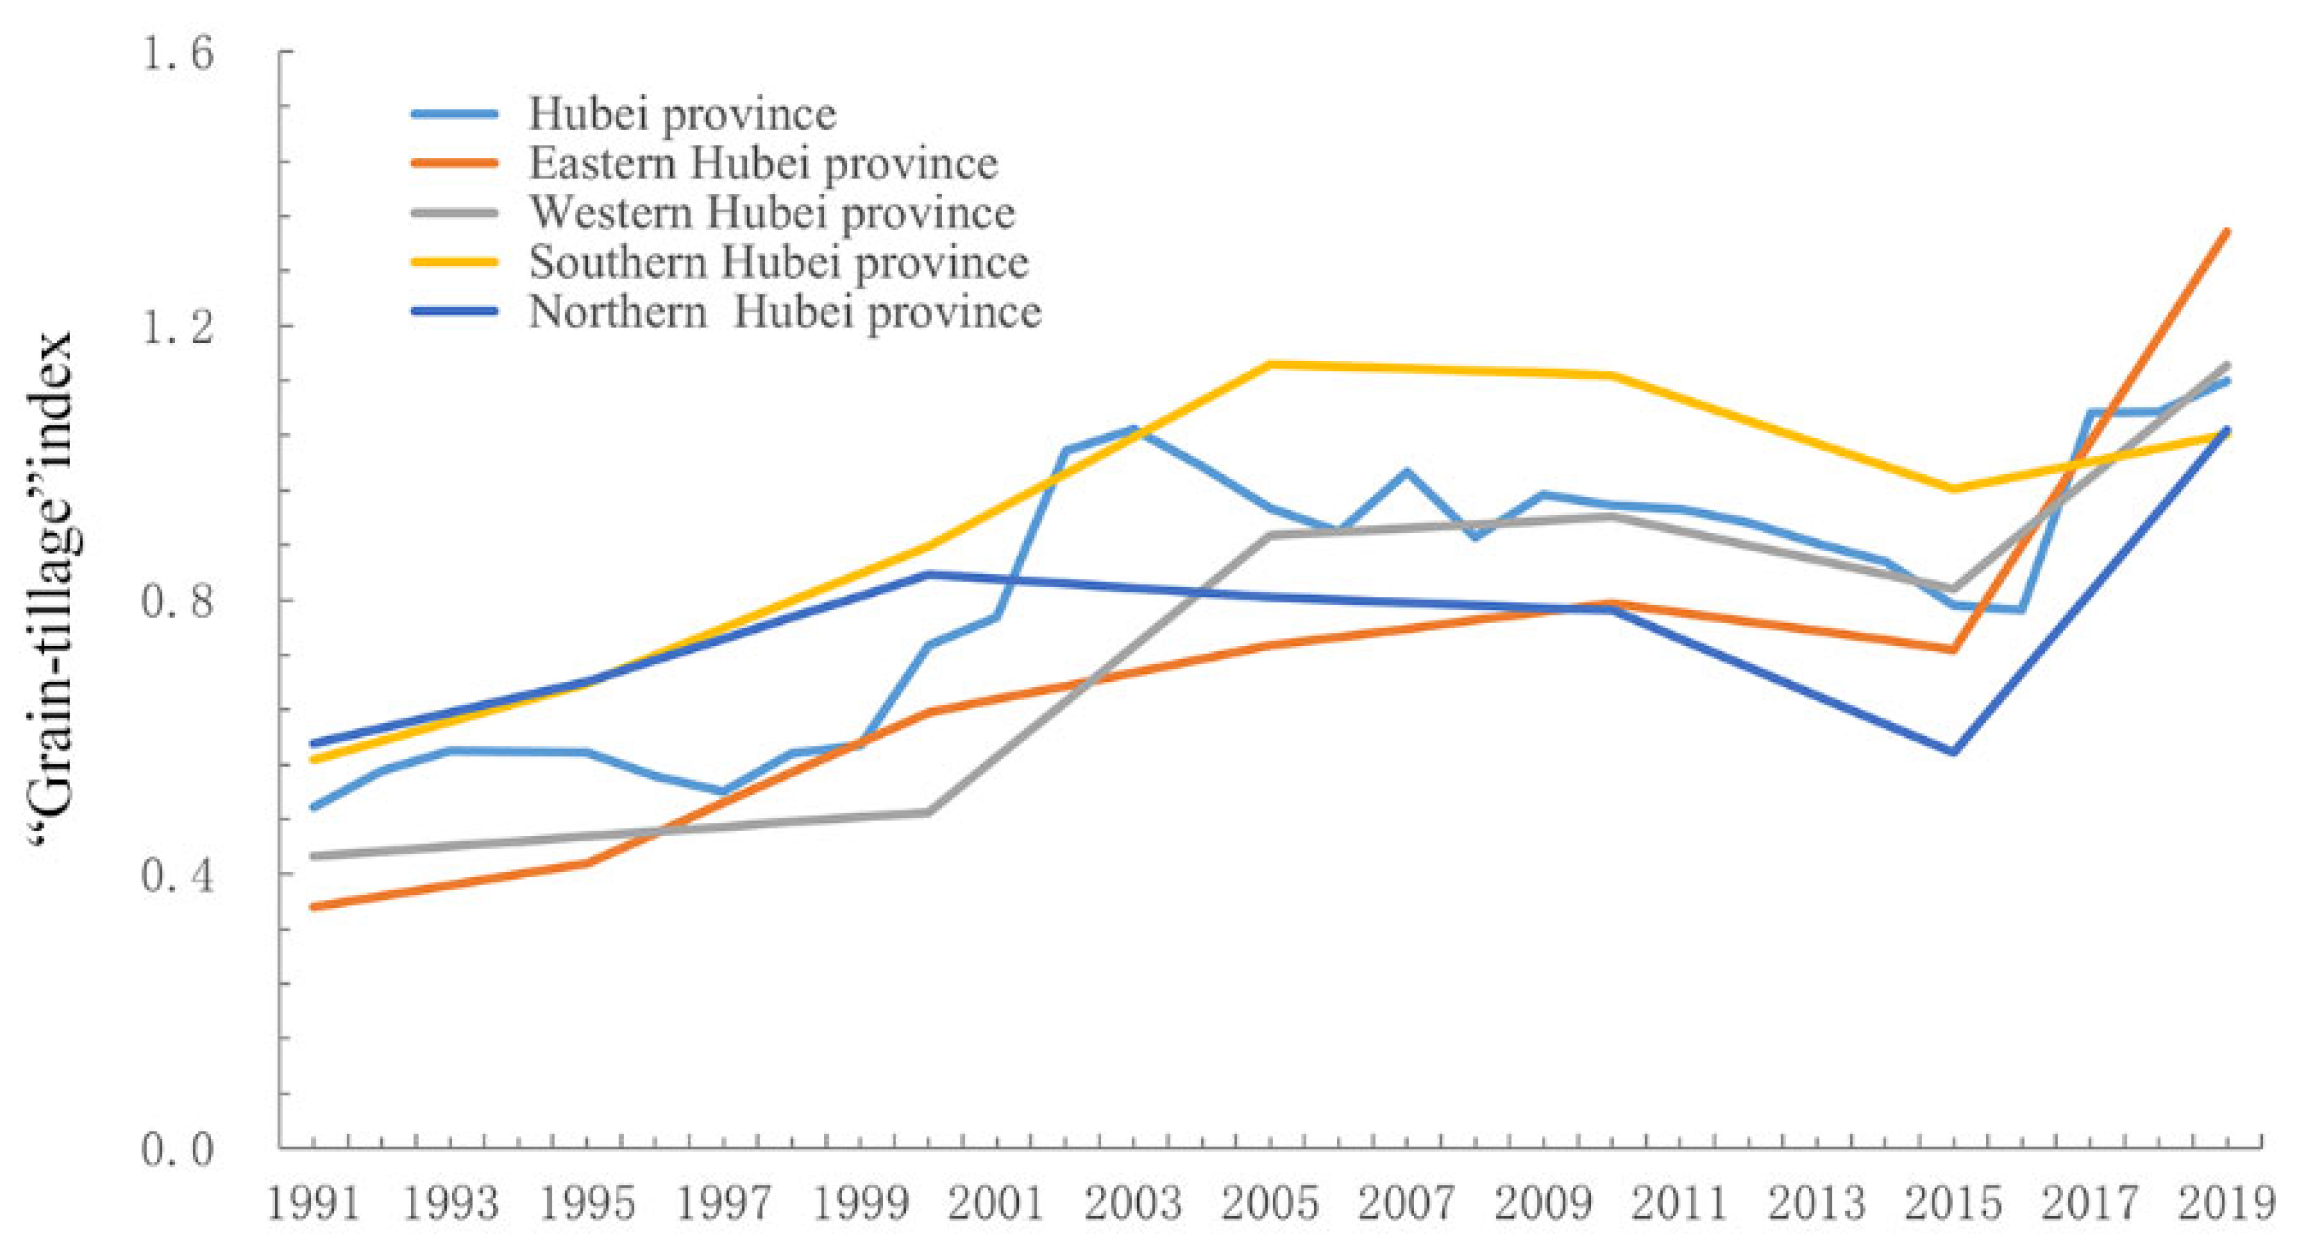
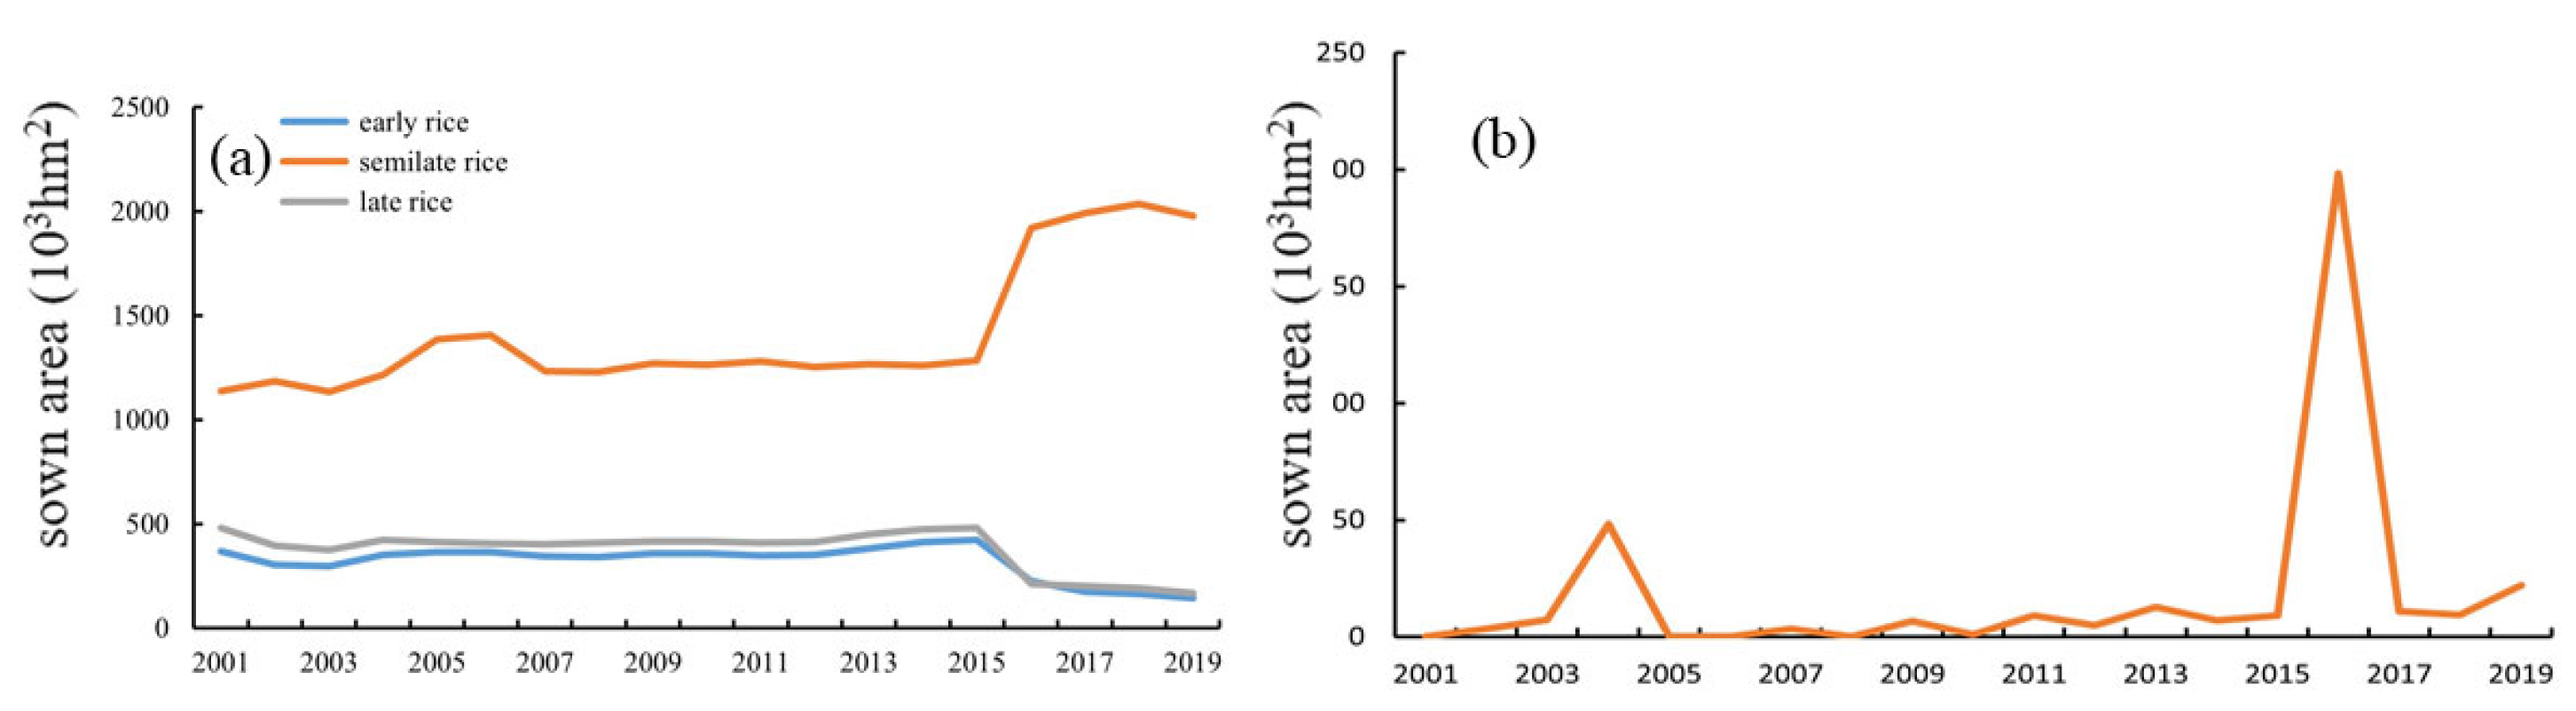
3.1. Temporal Dynamics Changes in NGP

The value of the non-grain index grew from 0.497 to 1.113 from 1991 to 2019, while NGP showed noticeable growth in Hubei Province (Figure 3). From 1991 to 2003, the value of the non-grain index increased from 0.497 to 1.050, showing an average annual increase of 0.046. From 2003 to 2016, the value of the non-grain index fell to 0.786, showing a decrease of 0.264 in 13 years. From 2016 to 2019, the non-grain index rose rapidly, with an average yearly increase of 0.118, while NGP showed a trend of first rising, then falling and rising again in Hubei Province. Further observing the changes in NGP from the partitions of Hubei Province, from 1991 to 2005—except for northern Hubei Province—the non-grain index continued to rise, and the NGP remained the highest in southern Hubei Province during this period. From 2005 to 2019, the non-grain index of the four regions decreased first and then increased; NGP decreased the most in the southern and northern regions, whereas it increased the most in the eastern and western regions. The value of the non-grain index in the eastern and western regions increased by 0.716 and 0.985, respectively. Whereas the NGP in the northern and southern regions mainly increased at low rates, the value of the non-grain index of the two regions increased by 0.457 and 0.475, respectively.
To reveal the origin of the differences in the NGP of Hubei Province, the non-grain index was decomposed by using the Theil index to describe the differences within (intragroup) and between (intergroup) prefecture-level cities. The results are provided in Figure 4. It is evident that NGP differs across Hubei Province. The Theil index decreased from 0.123 to 0.077, and the total difference in the non-grain index among counties decreased gradually. From the perspective of the composition of the Theil index, the NGP’s aggregate function is mainly due to the differences between prefecture-level cities, which have average, maximum, and minimum contribution rates of 73.4%, 88.7%, and 64.9%, respectively. The differences between prefecture-level cities are the main source of the total difference observed. In 2001, the NGP difference between Wuhan and Huangshi was the largest, with the difference between the value of their non-grain indexes being 0.676. The difference within prefecture-level cities for the levels of NGP first increased and then decreased before finally stabilising at a low level. After 2001, it stabilised at about 0.22, while its contribution to the total difference fluctuated between 20.05% and 40.9% due to changes in the differences between prefecture-level cities. This indicated that the variation in the total difference of NGP was mainly due to the variation in the difference between prefecture-level cities. The total difference reached its minimum in 2019, indicating that the NGP of each county was close.

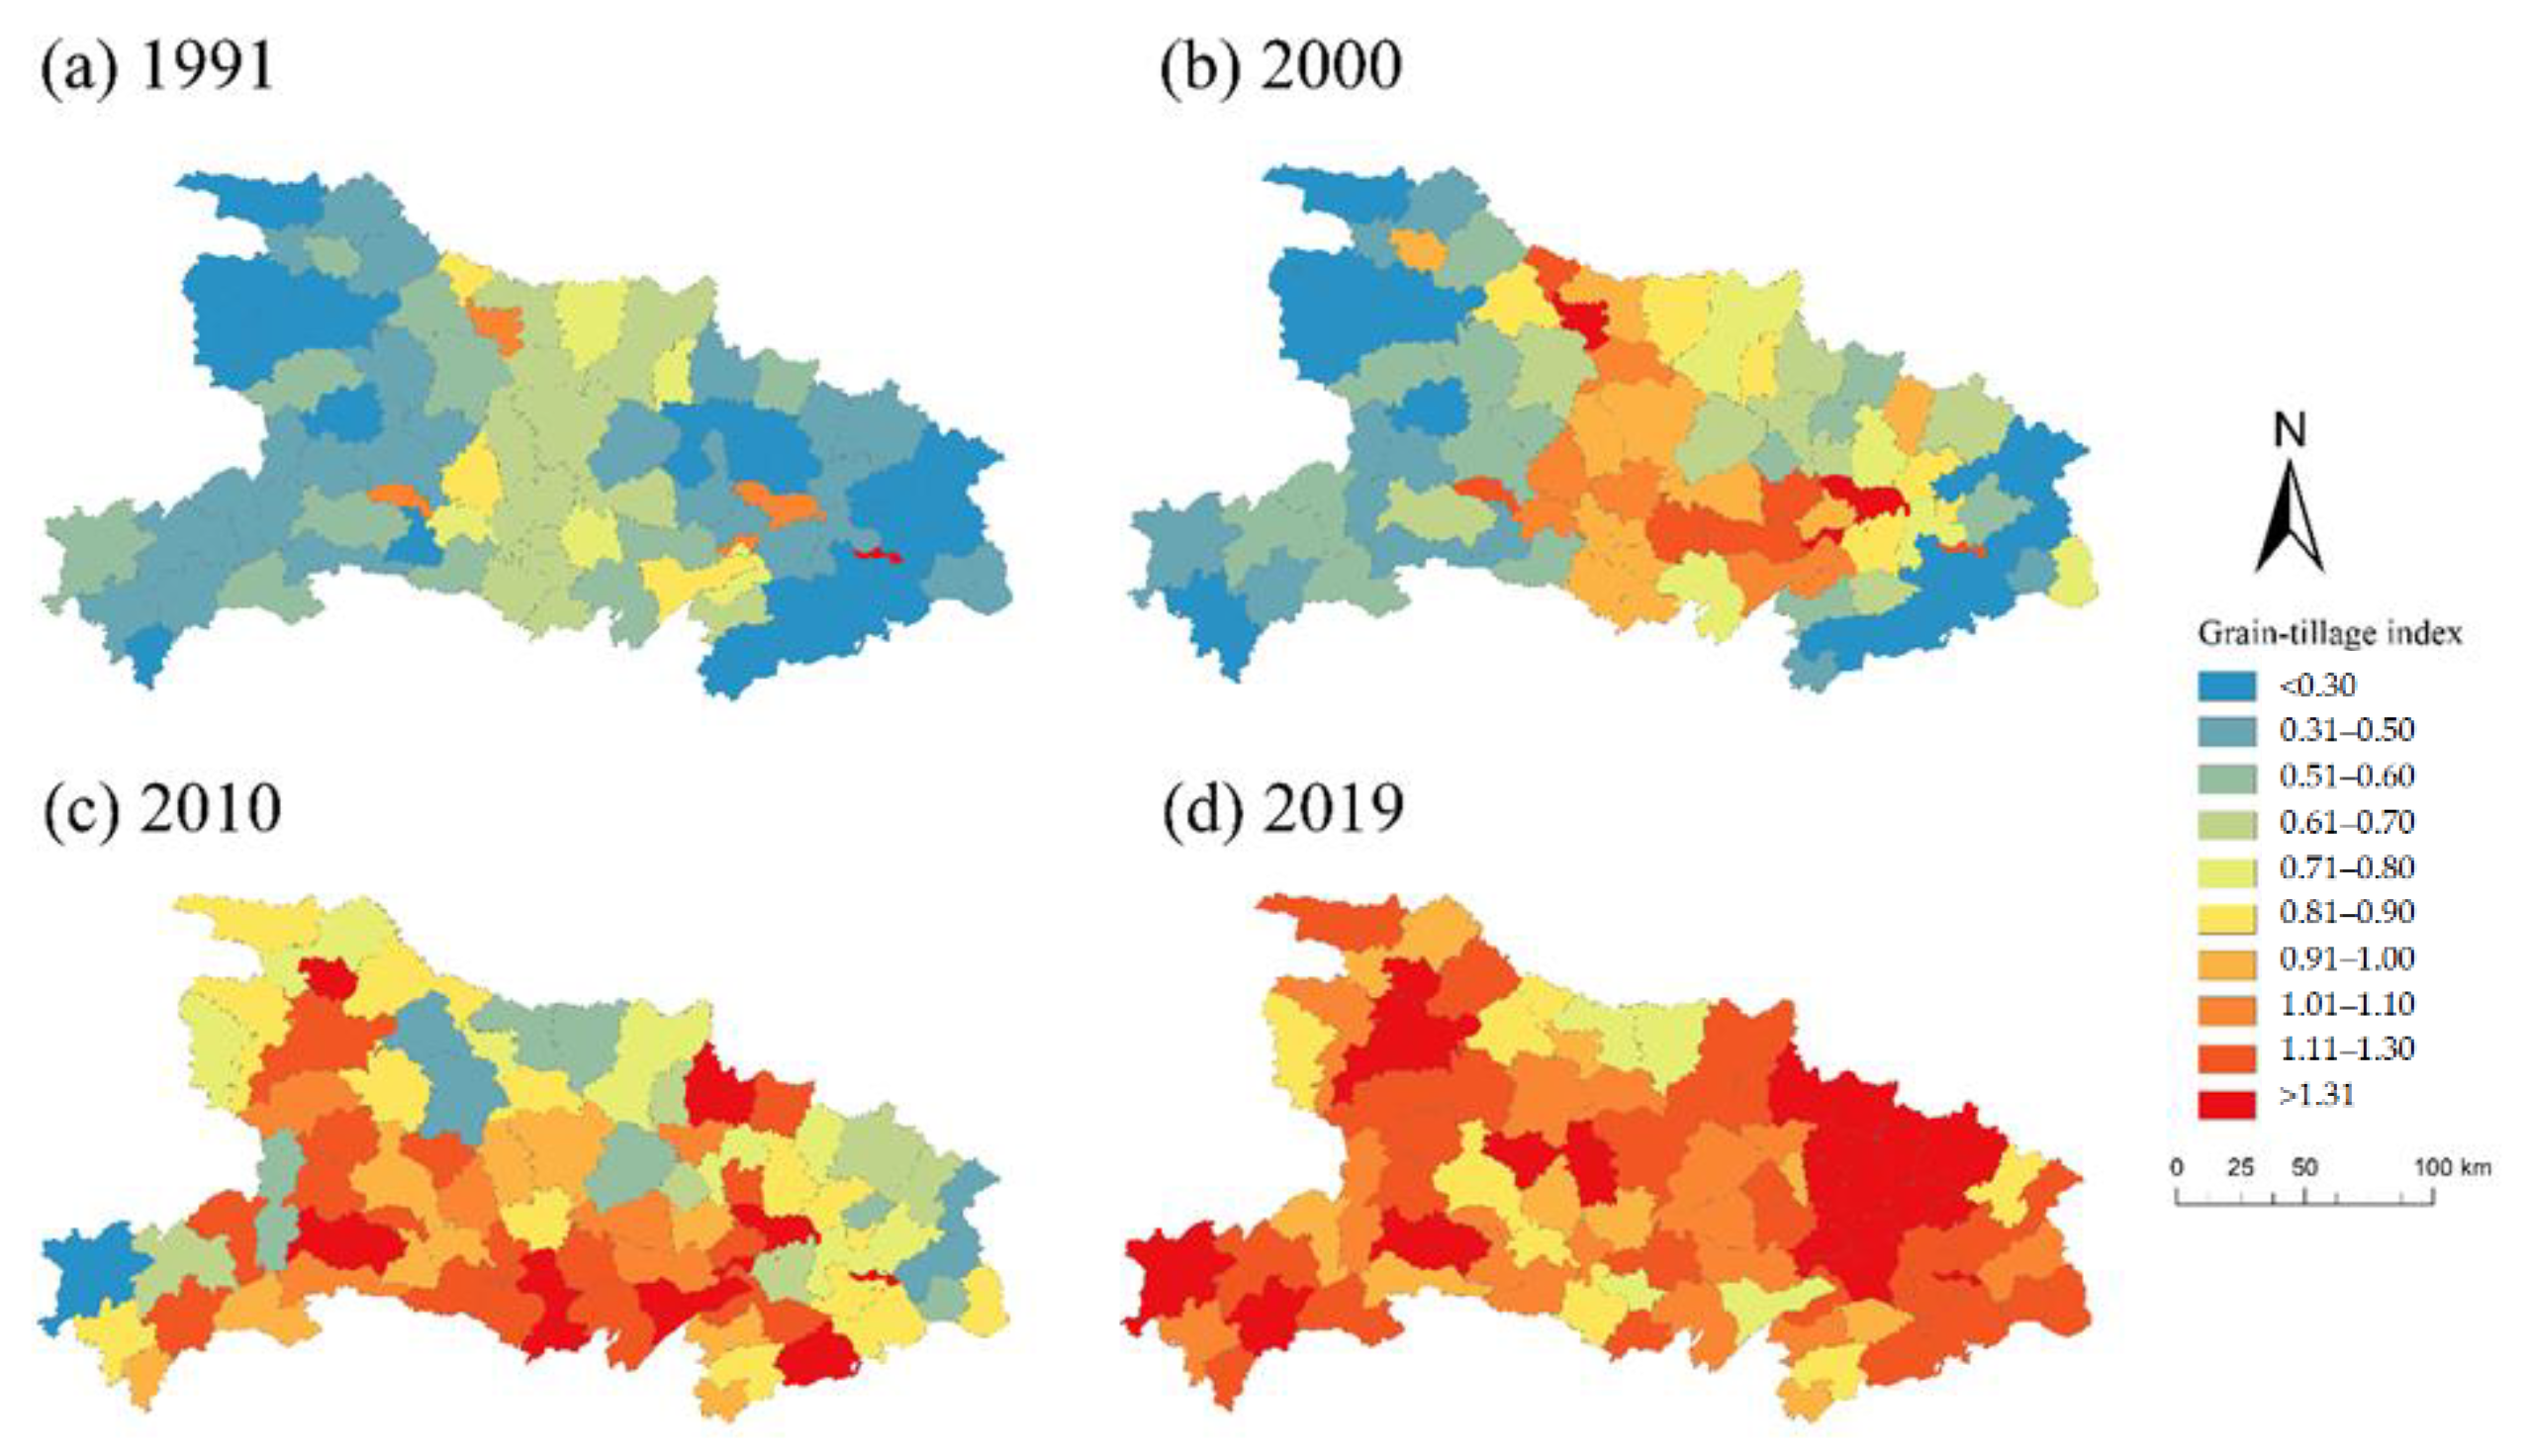
3.2. Spatial Dynamics Changes in NGP

From the perspective of spatial patterns, the number of high-NGP counties (non-grain index > 1) in Hubei Province increased from 4 to 62, demonstrating the expansion technique of infilling (see Figure 5). The high-NGP area moved from the middle to the south and then to the east, finally forming a spatial pattern of concentration in the east and a multi-core distribution pattern in the west. In 1991, there were four counties that could be classified as high-NGP counties, which were relatively concentrated in the inner part of Hubei Province: Huangshi Municipal District (1.618), Yichang Municipal District (1.077), Wuhan Municipal District (1.072), and Xiangyang City District (1.039). In 2000, the NGP in central Hubei Province increased significantly; 14 counties could be classified as high-NGP counties, which were relatively concentrated in the flat areas in central Hubei Province: Xiangyang City District, Wuhan City District, Huangshi City, Yichang City, Hanchuan City, Qianjiang City, Laohekou City, Xiantao City, Yicheng, Jiayu County, Dangyang City, Zhijiang City, Shayang County, and Honghu County. In 2010, 32 counties could be considered high-NGP counties, which were relatively concentrated on the Jianghan Plain in southern Hubei Province. The low-rate expansion of NGP units was still observed in the northeast at this time, while NGP was high in the south and low in the north, including areas in Huangpi District, Fang County, Changyang County, Xuan‘en County, and other counties. In addition, four counties could be considered to be low-NGP counties: Zaoyang City (0.754), Xiangzhou District (0.745), Honghu City (0.744), and Jiangling County (0.701). In the past 30 years, the eastern and western parts of Hubei Province witnessed an obvious growth of NGP; as a result, the NGP in the eastern and western regions overtook the NGP of the central region.
As shown in Figure 6, from 1991 to 2019, NGP showed a significant spatial correlation, and the Moran’s I value was greater than 0 in all periods. In 2010, the Moran’s I value was 0.461, which indicated that the spatial agglomeration effect of NGP was the most pronounced.
Generally, the spatial agglomeration types of the NGP in Hubei Province are mainly high–high clustering (H–H) and low–low clustering (L–L), indicating that the NGP had a tough radiation effect (Figure 7). The distribution of H–H changed from multi-core to single-core and moved eastward during the past 30 years, moving south and then east. In 1991, H–H was assigned to central Hubei Province, including Shayang County, Honghu City, Jianli City, and six other counties. In 2000, H–H included 19 counties, which were still mainly located in central Hubei Province, indicating an expansion trend. In 2000, H–H was mostly concentrated on the Jianghan Plain in southern Hubei Province, in 10 counties. In 2019, H–H moved to the eastern part of Hubei Province, and the clustering was relatively concentrated in the surrounding areas of Caidian District, Xinzhou District, and Ezhou City. The Jianghan Plain gradually changed from H–H to L–L clustering, with the radiation effect in traditional agricultural areas shifting from NGP to growing grain.

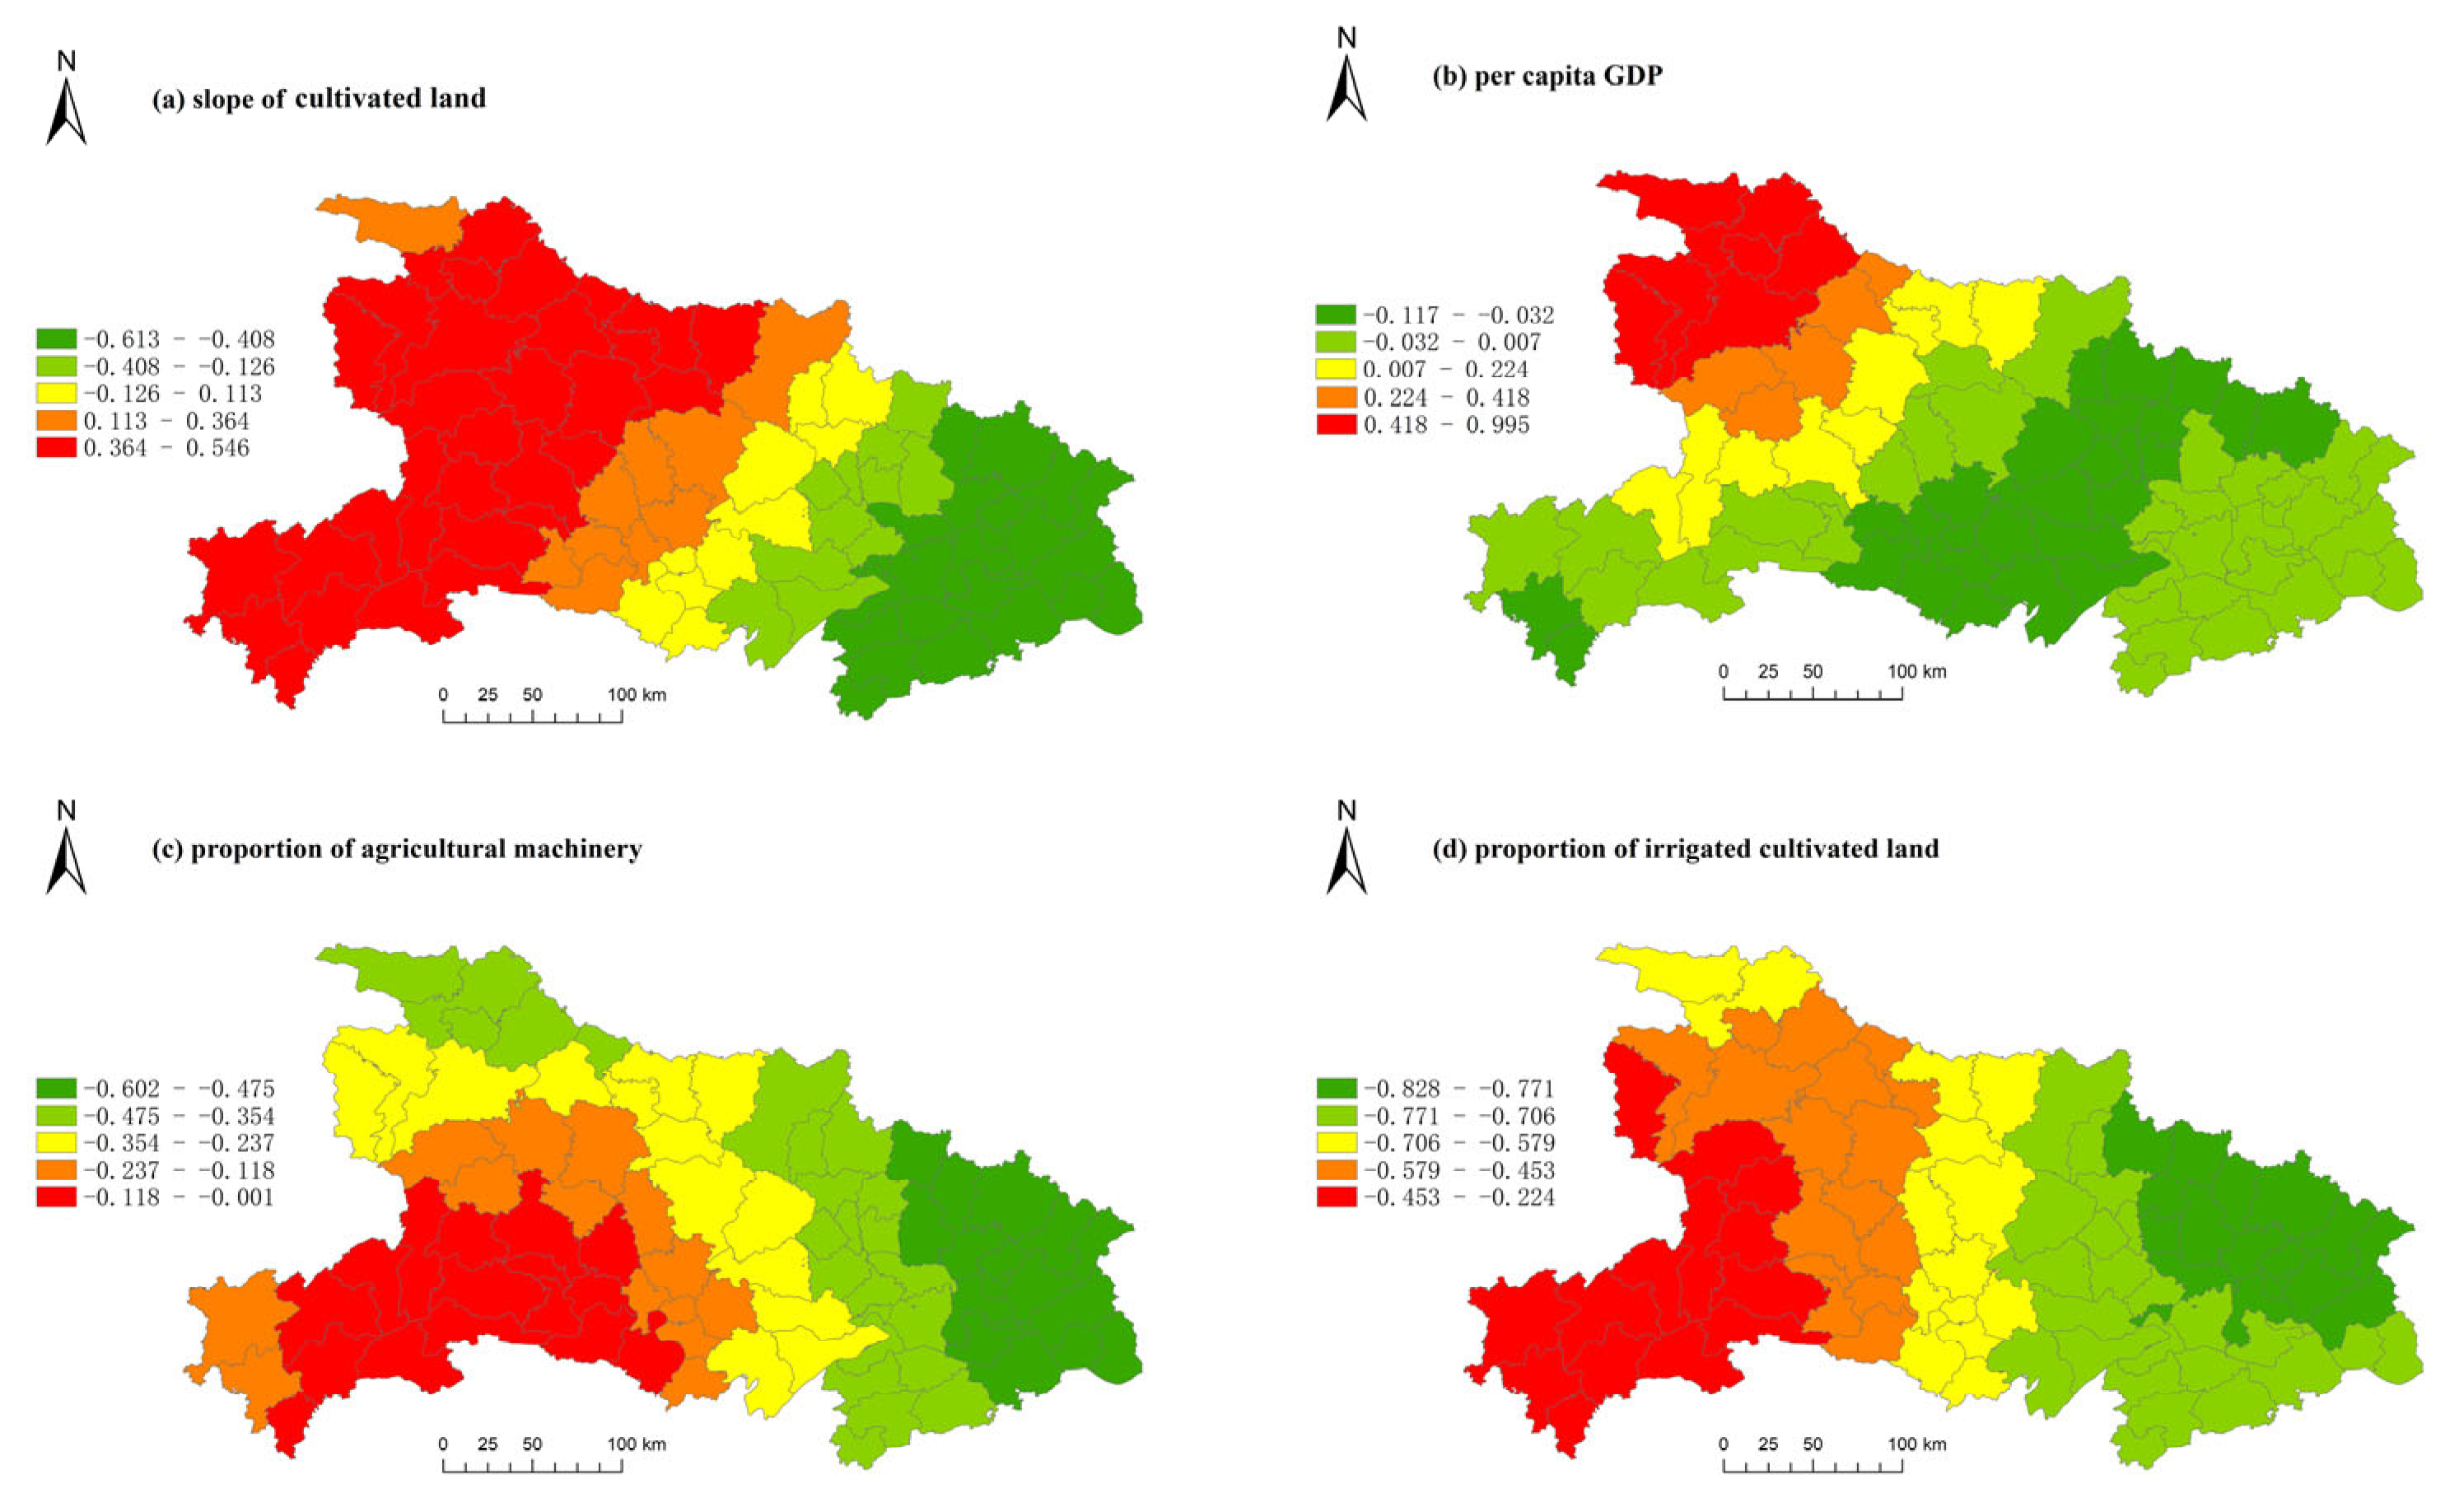
3.3. Results of the GWR

In order to test the multi-collinearity of various factors, a large number of factors were selected as preliminaries. After calculating the variance inflation factors (VIFs) for the various driving factors using OLS, the significant collinearity factors with a VIF > 7.5 were eliminated, as were the invalid and dominant factors. The VIF values of the various driving factors were all below 5.0, suggesting that there were no redundant variables in the model and no multi-collinearity among certain factors. Various factors were at a high significance level, and the values of X2, X5, and X8 passed the significance test at the 0.05 level, while the value of X7 passed the significance test at a level of 0.01 (see Table 3). Therefore, we added the above four indicators into our GWR model to analyse their spatial effect on the influencing factors.
According to Table 4, the R2 and adjusted R2 values of the GWR model are higher than the OLS model’s finding, and the Akaike information criterion (AIC) value of the GWR model is much smaller than that of the OLS model. These results indicate that the GWR model has a better goodness of fit, as it produced a better spatial coefficient regression than the OLS model did. The factors with a significant correlation in the regression of 83 counties and the related effects on the spatial heterogeneity of NGP were analysed and then visualised with the natural breaking point method (see Figure 7).
As shown in Figure 8a, the influence of the natural environment on NGP was spatially heterogeneous. The regression coefficient of the factor of NGP increased gradually from east to west. The slope of cultivated land exhibited a positive correlation with NGP in 37 counties; it showed a negative correlation in 46 counties. The former is mostly located in the counties of western Hubei, where the altitude is high, the temperature difference between day and night is considerable, and the increase in cultivated land slope improved the NGP. In Zhushan County and Gucheng County, with the highest regression coefficient, planting cash crops is the main type of NGP, and walnut planting is the native characteristic agriculture. The latter was mainly located in the flat eastern parts of Hubei, which have higher slopes to grow more grain. NGP increased in the flat cultivated land areas, which was particularly significant in Ezhou City, where the annual output of vegetables exceeded 1 million tons.
As shown in Figure 8b, the influence of GDP on NGP gradually increased from east to west in Hubei Province. In most areas of central and eastern Hubei Province, the correlation coefficient between the economic development level and NGP was around 0, suggesting that economic progress had no obvious impact on NGP. The regions with a significant positive correlation between GDP and NGP were concentrated in northwest Hubei Province, where agricultural income accounts for a large proportion of GDP. The rural revitalisation strategy has promoted local development as well as NGP.
As shown in Figure 8c,d, agricultural modernisation exhibited a negative correlation with NGP. The impact of two indicators on NGP, including the average amount of agricultural machinery and the proportion of irrigated land, increased from west to east in Hubei Province, while agricultural modernisation has gradually promoted the cultivation of grain. This demonstrated that the operating entity was more inclined to plant grain crops on cultivated land with a high level of irrigation and mechanisation. The eastern part of Hubei Province has a higher level of agricultural modernisation. In addition, Yunmeng County, Dongxihu District, Qianjiang City, and Jianli City are agricultural modernisation demonstration zones where the increase in NGP was effectively controlled.

4. Discussion

4.1. Spatio-Temporal Characteristics of NGP and Effects

In the past 30 years, the value of the non-grain index has shown an upward trend in Hubei Province, indicating that the NGP has been continuously increasing in Hubei Province, although it is a major grain-producing area. However, some studies suggested that the NGP in major grain-producing areas declined in recent years [12]. The main reason is that the grain ratio formula used in other studies can only indicate that the proportion of grain sown in crops in Hubei Province has increased [35,41,42,43], neglecting the increase in NGP caused by breeding on cultivated land. NGP growth accelerated after 2016, and high-NGP counties spread across the province. Other studies reached the same conclusion [23]. This was mainly affected by the adjustment policy of the agricultural structure in 2015, where a transformation of agricultural structures and interventions in industrial sectors resulted in an increase in NGP [42]. From the perspective of the decline in the national proportion of grain, NGP has become a salient issue in Hubei Province.
To be specific, the NGP of the central region was less than that of the eastern and western parts of Hubei Province in 1991. The growth of the non-grain index in the eastern and western regions exceeded that in the other regions in the past 30 years. As a result, the NGP of the eastern and western regions eventually surpassed that of the focal region. The observed low-rate expansion of the NGP in northern and southern Hubei Province was primarily due to the flat terrain, fertile soil, and abundant water resources in this region, which are conducive to crop growth. Including the Jianghan Plain, the central and southern parts of Hubei Province are important agricultural production areas. The Chinese government’s policy of “grain on valuable cultivated land” promoted farmers’ enthusiasm to plant grain [62]. The differences in resource endowment are the main reason for the rise of NGP in western Hubei Province [63], where the climate is dry, and the high altitude is not suitable for growing grain. Counties in Enshi Prefecture grow organic vegetables and Chinese herbs due to the advantageous towering mountains, which have deep valleys and large temperature differences between day and night. Related analyses showed that the NGP of Hubei Province presents obvious spatial agglomeration results. The H–H clustering of NGP occurred in Wuhan, Xiaogan, and Ezhou City in the east of Hubei Province, which might result from the development of the Wuhan Metropolitan Area [64], promoting the surrounding population to gather in that central urban area. A loss of labour may lead to NGP or even the abandonment of cultivated land. At the same time, the Wuhan Metropolitan Area has attracted a large number of enterprises that are involved in cultivated land management. The profit-seeking behaviour of enterprises has led to the rise of NGP in eastern Hubei Province, and, along with promoting rural revitalisation, a large amount of cultivated land formerly used to plant grain was converted to cash crops, breeding, forestry, and fruit farming [21]. The Theil index analysis showed that the NGP differences between counties decreased, and an intergroup difference was the main component of the total difference, suggesting that the geographical differences of natural, economic, and social factors are important reasons for the spatial differences in NGP.
The increase in the NGP level in Hubei Province has a direct impact on grain production. From 1991 to 2019, the proportion of grain production in China decreased by 1.06% from 5.16% to 4.1% (see Figure 9), and the growth rate of grain production in Hubei has continued to decline. Since 2012, Hubei’s per capita share of grain has reached the tipping point of food security (per capita share of grain reached 400 kg [65]), but it has recently declined by more than 33 kg from the peak in 2015. Excessive NGP may pass the tipping point for food security, but the threat is obscured by the stabilisation of total food production.

4.2. Mechanism of Factors Affecting NGP

According to previous research, in addition to the relatively low income from grain planting, the low economic efficiency of grain planting [18], the intervention of enterprise and commercial capital [66], the resource endowment [67,68,69] of cultivated land, and related policies all led to NGP in China [12]. Using a GWR model, this study explored the effects of social, economic, and natural factors on NGP, and it showed the effects of various factors on NGP in different counties.
Overall, our research showed that the influence of resource endowment on NGP correlates with obvious spatial differences [70], similar to a prior conclusion [42]. The positive correlation between cultivated land slope and NGP is mainly located in western Hubei [71], which is mountainous and located at a high altitude. Baokang is a famous mountainous county with more than 3100 hilltops, so it is more suitable for forestry and fruit farming since the singular topography promotes the development of NGP. The central and eastern parts of Hubei Province are abundant in rainfall and heat, which help the growth of crops [72]. Jianghan Plain, which has a large number of agricultural exports, has fertile soil and an extensive water network. However, depending on the results of our GWR model, cultivated land slope was negatively correlated with NGP. This indicates that cultivated land operators tend to choose NGP with superior returns on cultivated land that has a gentle slope and good natural quality. The policy of “grain on valuable cultivated land” has controlled the increase in NGP on the Jianghan Plain [62], but this policy still has room to grow in terms of its further implementation in the southern and eastern parts of Hubei Province.
The regions with a significant positive correlation between GDP and NGP are concentrated in the northwest of Hubei Province, indicating that an increase in GDP promotes NGP. The GDP of Zhuxi County in 2019 was RMB 8.45 billion, and the income of the primary industry accounted for more than 27% of the total. Sending industrial and commercial capital to the countryside promoted the development of local economies, while profit-seeking enterprises converted to cash crops [73,74]. In other areas of Hubei Province, the correlation coefficient between economic progress and NGP was not significant. There are two different groups of studies on this: some suggest that economically developed regions have higher prices of seeds, pesticides, fertilisers, and higher rents for cultivated land [12]. However, grain purchase prices remain relatively stable, which reduces farmers’ enthusiasm to grow grain. At the same time, the secondary and tertiary industries in this region developed rapidly, so agricultural production is no longer part of a feeding option for cultivated land operators [41]. Other studies found that economic development had a completely opposite effect on food cultivation in Zhejiang and Jiangsu Provinces [75]. The rise in labour costs instead promoted the cultivation of rice. Combined with our research results, we suggest that the influence of economic progress on NGP is complicated and does not always produce one result [42].
There was a negative correlation between agricultural modernisation and NGP in Hubei Province. The influence of the proportion of agricultural machinery and irrigated cultivated land in NGP increased gradually from west to east in Hubei Province, showing that agricultural modernisation had an obvious control effect on NGP. The reason is that agricultural modernisation has increased the efficiency of crop production and encouraged farmers to grow grain. Since 2003, local governments, including Hanchuan City, have provided subsidies to farmers to purchase farm machinery, thus reducing their financial burden [62]. Agricultural modernisation has had the most obvious effect on NGP in the central and eastern regions, where the degree of agricultural modernisation is high. Yunmeng County, Dongxihu District, Qianjiang City, and Jianli City were identified in this region as agrarian modernisation demonstration zones. This shows that the higher the level of agricultural modernisation is, the more obvious the control effect on NGP is. However, some studies came to a different conclusion: agricultural modernisation significantly improves NGP [42,43,63]. Utilising agricultural machinery has increased agricultural costs, making farmers more inclined to plant cash crops with higher returns [13]. This result is different because previous studies used the grain ratio to measure NGP and ignored the variation of Production NGP [42,43]. Improvements in crop efficiency have resulted in the conversion of land from ponds and wastelands to crops. The grain ratio declines indicate that the proportion of newly sown food crops has decreased. Nevertheless, from the result of the non-grain index, the area of cultivated land for grain is increasing, and agricultural modernisation promotes the planting of grain crops.
Moreover, multiple cropping of grain crops will be captured by the non-grain index; we conducted further data validation to identify this effect. The sown area of rice tends to be stable before 2016 (see Figure 10a), and the average area of ”double-to-single” was 6.9 × 10³ hm2 (see Figure 10b), accounting for 2.14% of the average grain sowing area change, which had no obvious influence on the index. In 2016, ”double-to-single” covered an area of 1.98 × 10⁵ hm2, accounting for 70.7% of the average grain sowing area change. As a result, the measurement of the non-grain index is higher than the actual NGP level in 2016.
From the actual situation, the “double-to-single” phenomenon in Hubei Province is caused by the conversion of double-season rice to rice–crayfish farming and is most obvious in Jianli, Qianjiang, and Honghu. Because of the lack of relevant regulations, some farmers are digging pits to expand the breeding space on cultivated land. The destruction of the arable layer leads to a decline in rice yield and affects the sustainable utilisation of cultivated land [76].

5. Conclusions

In the past 30 years, grain production in Hubei Province has declined, and NGP has threatened food security. This study introduces a non-grain index based on the cultivated land area and sown-grain area with Hubei Province as the research object and reveals the spatio-temporal patterns of the past 30 years. We then assessed the characteristics of NGP based on the Theil index and a spatial autocorrelation analysis and explored the effects of different factors on NGP through the application of a GWR model.
Conclusions: (1) For nearly 30 years, while the value of the non-grain index grew from 0.497 to 1.113, NGP has not reached the tipping point for food security in Hubei Province, but its threat is growing. (2) High-NGP counties are increasing in number, and their spatial agglomeration is obvious. The east and west of Hubei Province witnessed an observable growth of NGP. As a result, the NGP in the eastern and western regions overtook the central region’s NGP. (3) The factors with the greatest impact on the spatial differentiation of NGP were the slope of cultivated land, per capita GDP, average agricultural machinery used, and proportion of irrigated land. Generally, although a series of subsidy policies and agricultural modernisation promoted the planting of grain crops, NGP is still increasing in Hubei Province. The policy of “grain on valuable cultivated land” still has room for implementation, while Hubei Province’s status as a major grain-producing region continues to decline. Given the prevalence of NGP activities in China, therefore, the following suggestions are put forward for reducing NGP and achieving the sustainable use of cultivated land.
First, the government should give more subsidies to grain growers and guide farmers and enterprises to plant grain crops. The important factor affecting the decision of a cultivated land operator is economic benefit. Increasing grain-planting subsidies and the purchase price of grain crops could enhance farmers’ enthusiasm for growing grain. Moreover, guiding enterprises to plant grain crops by limiting the use of cultivated land and specifying penalties for violations could also be beneficial.
Second, the results of this study suggest that agricultural modernisation can guide breeding and other Production NGP to be converted to grain crops. On the one hand, this can be accomplished by reducing the costs of agricultural modernisation and promoting irrigation facility subsidies and agricultural machinery purchase subsidies. On the other hand, fixing finely fragmented land facilitates the application of heavy agricultural machinery, thereby promoting the appropriate scale and modernisation of grain farming. This conclusion has important implications for Production NGP areas such as Xinjiang, Qinghai, and other places.
Finally, we suggest determining cultivated land use according to local natural environments, for example, by implementing clear regulations for rice–crayfish farming in JianLi, Qianjiang, and Honghu. This can be accomplished by ensuring that grain is grown on valuable cultivated land, which limits the use of cultivated land with high production efficiency according to law, and strictly controlling NGP to protect domestic food security. At the same time, the restrictions on the use of cultivated land with poor irrigation conditions and high altitude can be relaxed, such as in western Hubei Province. This would reduce inefficient labour productivity and increase capital investment.
The limitation of the non-grain index is that its measurements overestimate the NGP when “double-to-single” is evident. At the same time, the specific impact of rice–crayfish farming on food security remains unclear, and it lacks relevant regulations. Therefore, it is recommended to focus future research activities on countermeasures and threats to “double-to-single”.

Author Contributions

Conceptualisation, Y.S. and J.H.; methodology, J.H. and Y.S.; software, J.H. and H.W.; validation, J.H. and Y.S.; formal analysis, J.H. and H.W.; investigation, J.H. resources, H.W. and J.H.; data curation, J.H.; writing—original draft preparation, J.H.; writing—review and editing, Y.S. and J.H.; visualisation, J.H.; supervision, Y.S. and J.H.; project administration, H.W.; funding acquisition, Y.S. All authors have read and agreed to the published version of the manuscript.

Funding

This work was supported by National Science Fund for Distinguished Young Scholars, grant no. 7220041371 and the Natural resources Science and Technology project of Hubei Province (ZRZY2023KJ04).

Institutional Review Board Statement

Not applicable.

Informed Consent Statement

Not applicable.

Data Availability Statement

Not applicable.

Conflicts of Interest

The authors declare no conflict of interest.

References

  1. Yang, Q.; Zhang, D. The Influence of Agricultural Industrial Policy on Non-Grain Production of Cultivated Land: A Case Study of the “One Village, One Product” Strategy Implemented in Guanzhong Plain of China. Land Use Policy 2021, 108, 105579. [Google Scholar] [CrossRef]
  2. Zhai, L.; Yuan, S.; Feng, Y. The Economic Effects of Export Restrictions Imposed by Major Grain Producers. Agric. Econ. 2022, 68, 11–19. [Google Scholar] [CrossRef]
  3. Kim, W.; Iizumi, T.; Nishimori, M. Global Patterns of Crop Production Losses Associated with Droughts from 1983 to 2009. J. Appl. Meteorol. Climatol. 2019, 58, 1233–1244. [Google Scholar] [CrossRef]
  4. Yu, D.; Hu, S.; Tong, L.; Xia, C. Spatiotemporal Dynamics of Cultivated Land and Its Influences on Grain Production Potential in Hunan Province, China. Land 2020, 9, 510. [Google Scholar] [CrossRef]
  5. D’Amour, C.B.; Reitsma, F.; Baiocchi, G.; Barthel, S.; Güneralp, B.; Erb, K.H.; Haberl, H.; Creutzig, F.; Seto, K.C. Future Urban Land Expansion and Implications for Global Croplands. Proc. Natl. Acad. Sci. USA 2017, 114, 8939–8944. [Google Scholar] [CrossRef] [Green Version]
  6. Chen, W.; Zeng, J.; Li, N. Change in Land-Use Structure Due to Urbanisation in China. J. Clean. Prod. 2021, 321, 128986. [Google Scholar] [CrossRef]
  7. Kinnunen, P.; Guillaume, J.H.A.; Taka, M.; D’Odorico, P.; Siebert, S.; Puma, M.J.; Jalava, M.; Kummu, M. Local Food Crop Production Can Fulfil Demand for Less than One-Third of the Population. Nat. Food 2020, 1, 229–237. [Google Scholar] [CrossRef]
  8. Jalilov, S.M.; Rahman, W.; Palash, S.; Jahan, H.; Mainuddin, M.; Ward, F.A. Exploring Strategies to Control the Cost of Food Security: Evidence from Bangladesh. Agric. Syst. 2022, 196, 103351. [Google Scholar] [CrossRef]
  9. Goncharova, N.A.; Merzlyakova, N.V. Food Shortages and Hunger as a Global Problem. Food Sci. Technol. 2021, 42, 70621. [Google Scholar] [CrossRef]
  10. Liu, X.; Zhao, C.; Song, W. Review of the Evolution of Cultivated Land Protection Policies in the Period Following China’s Reform and Liberalization. Land Use Policy 2017, 67, 660–669. [Google Scholar] [CrossRef]
  11. Zhou, B.B.; Aggarwal, R.; Wu, J.; Lv, L. Urbanization-Associated Farmland Loss: A Macro-Micro Comparative Study in China. Land Use Policy 2021, 101, 105228. [Google Scholar] [CrossRef]
  12. Wang, J.; Dai, C. Identifying the Spatial-Temporal Pattern of Cropland’s Non-Grain Production and Its Effects on Food Security in China. Foods 2022, 11, 3494. [Google Scholar] [CrossRef] [PubMed]
  13. Li, Y.; Zhao, B.; Huang, A.; Xiong, B.; Song, C. Characteristics and Driving Forces of Non-Grain Production of Cultivated Land from the Perspective of Food Security. Sustainability 2021, 13, 14047. [Google Scholar] [CrossRef]
  14. Wang, H.; Qiu, F.; Ruan, X. Loss or Gain: A Spatial Regression Analysis of Switching Land Conversions between Agriculture and Natural Land. Agric. Ecosyst. Environ. 2016, 221, 222–234. [Google Scholar] [CrossRef]
  15. Su, B.; Li, Y.; Li, L.; Wang, Y. How Does Nonfarm Employment Stability Influence Farmers’ Farmland Transfer Decisions? Implications for China’s Land Use Policy. Land Use Policy 2018, 74, 66–72. [Google Scholar] [CrossRef]
  16. El Kateb, H.; Zhang, H.; Zhang, P.; Mosandl, R. Soil Erosion and Surface Runoff on Different Vegetation Covers and Slope Gradients: A Field Experiment in Southern Shaanxi Province, China. Catena 2013, 105, 1–10. [Google Scholar] [CrossRef]
  17. Ziegler, A.D.; Fox, J.M.; Xu, J. The Rubber Juggernaut. Science 2009, 324, 1024–1025. [Google Scholar] [CrossRef]
  18. Zhang, L.X.; Song, B.; Chen, B. Emergy-Based Analysis of Four Farming Systems: Insight into Agricultural Diversification in Rural China. J. Clean. Prod. 2012, 28, 33–44. [Google Scholar] [CrossRef]
  19. Chatvijitkul, S.; Boyd, C.E.; Davis, D.A.; McNevin, A.A. Pollution Potential Indicators for Feed-Based Fish and Shrimp Culture. Aquaculture 2017, 477, 43–49. [Google Scholar] [CrossRef]
  20. Chen, Y.; Dong, S.; Wang, F.; Gao, Q.; Tian, X. Carbon Dioxide and Methane Fluxes from Feeding and No-Feeding Mariculture Ponds. Environ. Pollut. 2016, 212, 489–497. [Google Scholar] [CrossRef]
  21. Sun, Y.; Chang, Y.; Liu, J.; Ge, X.; Liu, G.J.; Chen, F. Spatial Differentiation of Non-Grain Production on Cultivated Land and Its Driving Factors in Coastal China. Sustainability 2021, 13, 13064. [Google Scholar] [CrossRef]
  22. Pan, J.; Chen, Y.; Zhang, Y.; Chen, M.; Shailaja, F.; Luan, B.; Wang, F.; Meng, D.; Liu, Y.; Jiao, L.; et al. Spatial-Temporal Dynamics of Grain Yield and the Potential Driving Factors at the County Level in China. J. Clean. Prod. 2020, 255, 120312. [Google Scholar] [CrossRef]
  23. Feng, Y.; Ke, M.; Zhou, T. Spatio-Temporal Dynamics of Non-Grain Production of Cultivated Land in China. Sustainability 2022, 14, 14286. [Google Scholar] [CrossRef]
  24. Su, Y.; Li, C.; Wang, K.; Deng, J.; Shahtahmassebi, A.R.; Zhang, L.; Ao, W.; Guan, T.; Pan, Y.; Gan, M. Quantifying the Spatiotemporal Dynamics and Multi-Aspect Performance of Non-Grain Production during 2000–2015 at a Fine Scale. Ecol. Indic. 2019, 101, 410–419. [Google Scholar] [CrossRef]
  25. Su, Y.; Su, C.; Xie, Y.; Li, T.; Li, Y.; Sun, Y. Controlling Non-Grain Production Based on Cultivated Land Multifunction Assessment. Int. J. Environ. Res. Public Health 2022, 19, 1027. [Google Scholar] [CrossRef]
  26. Cheng, X.; Tao, Y.; Huang, C.; Yi, J.; Yi, D.; Wang, F.; Tao, Q.; Xi, H.; Ou, W. Unraveling the Causal Mechanisms for Non-Grain Production of Cultivated Land: An Analysis Framework Applied in Liyang, China. Land 2022, 11, 1888. [Google Scholar] [CrossRef]
  27. Krusekopf, C.C. Diversity in Land-Tenure Arrangements under the Household Responsibility System in China. China Econ. Rev. 2002, 13, 297–312. [Google Scholar] [CrossRef]
  28. Zhao, X.; Zheng, Y.; Huang, X.; Kwan, M.P.; Zhao, Y. The Effect of Urbanization and Farmland Transfer on the Spatial Patterns of Non-Grain Farmland in China. Sustainability 2017, 9, 1438. [Google Scholar] [CrossRef] [Green Version]
  29. Su, Y.; Qian, K.; Lin, L.; Wang, K.; Guan, T.; Gan, M. Identifying the Driving Forces of Non-Grain Production Expansion in Rural China and Its Implications for Policies on Cultivated Land Protection. Land Use Policy 2020, 92, 104435. [Google Scholar] [CrossRef]
  30. Peng, L.; Zhou, X.; Tan, W.; Liu, J.; Wang, Y. Analysis of Dispersed Farmers’ Willingness to Grow Grain and Main Influential Factors Based on the Structural Equation Model. J. Rural Stud. 2022, 93, 375–385. [Google Scholar] [CrossRef]
  31. Bhandari, H.; Mishra, A.K. Impact of Demographic Transformation on Future Rice Farming in Asia. Outlook Agric. 2018, 47, 125–132. [Google Scholar] [CrossRef]
  32. Wang, Q.; Guan, Q.; Lin, J.; Luo, H.; Tan, Z.; Ma, Y. Simulating Land Use/Land Cover Change in an Arid Region with the Coupling Models. Ecol. Indic. 2021, 122, 107231. [Google Scholar] [CrossRef]
  33. Bekele, A.E.; Drabik, D.; Dries, L.; Heijman, W. Large-Scale Land Investments, Household Displacement, and the Effect on Land Degradation in Semiarid Agro-Pastoral Areas of Ethiopia. Land Degrad. Dev. 2021, 32, 777–791. [Google Scholar] [CrossRef]
  34. Leng, Z.; Wang, Y.; Hou, X. Structural and Efficiency Effects of Land Transfers on Food Planting: A Comparative Perspective on North and South of China. Sustainability 2021, 13, 3327. [Google Scholar] [CrossRef]
  35. Ran, D.; Zhang, Z.; Jing, Y. A Study on the Spatial-Temporal Evolution and Driving Factors of Non-Grain Production in China’s Major Grain-Producing Provinces. Int. J. Environ. Res. Public Health 2022, 19, 16630. [Google Scholar] [CrossRef] [PubMed]
  36. Yang, R.; Luo, X.; Xu, Q.; Zhang, X.; Wu, J. Measuring the Impact of the Multiple Cropping Index of Cultivated Land during Continuous and Rapid Rise of Urbanization in China: A Study from 2000 to 2015. Land 2021, 10, 491. [Google Scholar] [CrossRef]
  37. Chai, J.; Wang, Z.; Yang, J.; Zhang, L. Analysis for Spatial-Temporal Changes of Grain Production and Farmland Resource: Evidence from Hubei Province, Central China. J. Clean. Prod. 2019, 207, 474–482. [Google Scholar] [CrossRef]
  38. Xie, H.; Liu, G. Spatiotemporal Differences and Influencing Factors of Multiple Cropping Index in China during 1998–2012. J. Geogr. Sci. 2015, 25, 1283–1297. [Google Scholar] [CrossRef]
  39. Zuo, L.; Zhang, Z.; Dong, T.; Wang, X. Progress in the Research on the Multiple Cropping Index. J. Nat. Resour. 2009, 24, 553–560. [Google Scholar]
  40. Wu, W.B.; Yu, Q.Y.; Lu, M.; Xiang, M.T.; Xie, A.K.; Yang, P.; Tang, H.J. Key Research Priorities for Multiple Cropping Systems. Sci. Agric. Sin. 2018, 51, 1681–1694. [Google Scholar]
  41. Zhang, Y.; Feng, Y.; Wang, F.; Chen, Z.; Li, X. Spatiotemporal Differentiation and Driving Mechanism of Cultivated Land Non-Grain Conversion in Guangdong Province. Resour. Sci. 2022, 44, 480–493. [Google Scholar] [CrossRef]
  42. Meng, F.; Tan, Y.; Chen, H.; Xiong, W. Spatial-Temporal Evolution Patterns and Influencing Factors of Non-Grain Utilization of Cultivated Land in China. China Land Sci. 2022, 36, 97–106. [Google Scholar]
  43. Song, H.; Xin, L. Differentiation Characteristics and Influencing Factors of Cultivated Land Use Intensity in China. Nongye Gongcheng Xuebao/Trans. Chin. Soc. Agric. Eng. 2021, 37, 212–222. [Google Scholar]
  44. Zhu, Z.; Dai, Z.; Li, S.; Feng, Y. Spatiotemporal Evolution of Non-Grain Production of Cultivated Land and Its Underlying Factors in China. Int. J. Environ. Res. Public Health 2022, 19, 8210. [Google Scholar] [CrossRef]
  45. Malakar, K.; Mishra, T.; Patwardhan, A. Inequality in Water Supply in India: An Assessment Using the Gini and Theil Indices. Environ. Dev. Sustain. 2018, 20, 841–864. [Google Scholar] [CrossRef]
  46. Cowell, F.A. On the Structure of Additive Inequality Measures. Rev. Econ. Stud. 1980, 47, 521. [Google Scholar] [CrossRef]
  47. Shorrocks, A.F. The Class of Additively Decomposable Inequality Measures. Econometrica 1980, 48, 613. [Google Scholar] [CrossRef] [Green Version]
  48. Dadashpoor, H.; Azizi, P.; Moghadasi, M. Land Use Change, Urbanization, and Change in Landscape Pattern in a Metropolitan Area. Sci. Total Environ. 2019, 655, 707–719. [Google Scholar] [CrossRef]
  49. Tian-Wei, G.; Hai, C.; Hang, Z.; Qin-Qin, S.; Di, L. Spatiotemporal Evolution of Land Ecosystem Service Value and Its Influencing Factors in Shaanxi Province Based on GWR. J. Nat. Resour. 2020, 35, 1714. [Google Scholar] [CrossRef]
  50. Song, W.; Liu, M. Farmland Conversion Decreases Regional and National Land Quality in China. Land Degrad. Dev. 2017, 28, 459–471. [Google Scholar] [CrossRef]
  51. Liu, Y.; Feng, Y.; Zhao, Z.; Zhang, Q.; Su, S. Socioeconomic Drivers of Forest Loss and Fragmentation: A Comparison between Different Land Use Planning Schemes and Policy Implications. Land Use Policy 2016, 54, 58–68. [Google Scholar] [CrossRef]
  52. Camacho-Valdez, V.; Ruiz-Luna, A.; Ghermandi, A.; Nunes, P.A.L.D. Valuation of Ecosystem Services Provided by Coastal Wetlands in Northwest Mexico. Ocean Coast. Manag. 2013, 78, 1–11. [Google Scholar] [CrossRef]
  53. Guo, Y.; Wang, J. Identifying the Determinants of Nongrain Farming in China and Its Implications for Agricultural Development. Land 2021, 10, 902. [Google Scholar] [CrossRef]
  54. Yao, X.; Zeng, J.; Li, W. Spatial Correlation Characteristics of Urbanization and Land Ecosystem Service Value in Wuhan Urban Agglomeration. Nongye Gongcheng Xuebao/Trans. Chin. Soc. Agric. Eng. 2015, 31, 249–256. [Google Scholar]
  55. Anuja, A.R.; Kumar, A.; Saroj, S.; Singh, K.N. The Impact of Crop Diversification towards High-Value Crops on Economic Welfare of Agricultural Households in Eastern India. Curr. Sci. 2020, 118, 1575–1582. [Google Scholar] [CrossRef]
  56. Qiu, T.; Boris Choy, S.T.; Li, S.; He, Q.; Luo, B. Does Land Renting-in Reduce Grain Production? Evidence from Rural China. Land Use Policy 2020, 90, 104311. [Google Scholar] [CrossRef]
  57. Su, S.; Xiao, R.; Li, D.; Hu, Y. Impacts of Transportation Routes on Landscape Diversity: A Comparison of Different Route Types and Their Combined Effects. Environ. Manag. 2014, 53, 636–647. [Google Scholar] [CrossRef] [PubMed]
  58. Farooq, M.; Wahid, A.; Lee, D.J.; Ito, O.; Siddique, K.H.M. Advances in Drought Resistance of Rice. CRC Crit. Rev. Plant Sci. 2009. [Google Scholar] [CrossRef]
  59. Lu, C. Does Household Laborer Migration Promote Farmland Abandonment in China? Growth Change 2020, 51, 1804–1836. [Google Scholar] [CrossRef]
  60. Xiao, R.; Su, S.; Mai, G.; Zhang, Z.; Yang, C. Quantifying Determinants of Cash Crop Expansion and Their Relativeeffects Using Logistic Regression Modeling and Variance Partitioning. Int. J. Appl. Earth Obs. Geoinf. 2015, 34, 258–263. [Google Scholar] [CrossRef]
  61. Tan, M.; Li, X.; Lu, C. Urban Land Expansion and Arable Land Loss of the Major Cities in China in the 1990s. Sci. China Ser. D Earth Sci. 2005, 48, 1492–1500. [Google Scholar] [CrossRef]
  62. Huang, J.; Wang, X.; Rozelle, S. The Subsidization of Farming Households in China’s Agriculture. Food Policy 2013, 41, 124–132. [Google Scholar] [CrossRef]
  63. Chang, Y.; Liu, J.; Zhang, Q.; Yu, H.; Bian, Z.; Chen, F. Spatial Pattern Differentiation of Cultivated Land Non-Grain Conversion in Major Grain-Producing Areas. J. Agric. Resour. Environ. 2022, 39, 817–826. [Google Scholar] [CrossRef]
  64. Wang, T.; Li, H.; Huang, Y. The Complex Ecological Network’s Resilience of the Wuhan Metropolitan Area. Ecol. Indic. 2021, 130, 108101. [Google Scholar] [CrossRef]
  65. Wu, J.; Zhang, J.; Wang, S.; Kong, F. Assessment of Food Security in China: A New Perspective Based on Production-Consumption Coordination. Sustainability 2016, 8, 183. [Google Scholar] [CrossRef] [Green Version]
  66. Lewis, D.J.; Plantinga, A.J.; Wu, J.J. Targeting Incentives to Reduce Habitat Fragmentation. Am. J. Agric. Econ. 2009, 91, 1080–1096. [Google Scholar] [CrossRef] [Green Version]
  67. Xu, G.; Huang, X.; Zhong, T.; Chen, Y.; Wu, C.; Jin, Y. Assessment on the Effect of City Arable Land Protection under the Implementation of China’s National General Land Use Plan (2006–2020). Habitat Int. 2015, 49, 466–473. [Google Scholar] [CrossRef]
  68. Lyle, G.; Bryan, B.A.; Ostendorf, B. Identifying the Spatial and Temporal Variability of Economic Opportunity Costs to Promote the Adoption of Alternative Land Uses in Grain Growing Agricultural Areas: An Australian Example. J. Environ. Manag. 2015, 155, 123–135. [Google Scholar] [CrossRef]
  69. Wu, Y.; Zhang, X.; Skitmore, M.; Song, Y.; Hui, E.C.M. Industrial Land Price and Its Impact on Urban Growth: A Chinese Case Study. Land Use Policy 2014, 36, 199–209. [Google Scholar] [CrossRef] [Green Version]
  70. Tan, S.; Liu, Q.; Han, S. Spatial-Temporal Evolution of Coupling Relationship between Land Development Intensity and Resources Environment Carrying Capacity in China. J. Environ. Manag. 2022, 301, 113778. [Google Scholar] [CrossRef]
  71. Zhuang, Q.; Shao, Z.; Huang, X.; Zhang, Y.; Wu, W.; Feng, X.; Lv, X.; Ding, Q.; Cai, B.; Altan, O. Evolution of Soil Salinization under the Background of Landscape Patterns in the Irrigated Northern Slopes of Tianshan Mountains, Xinjiang, China. Catena 2021, 206, 105561. [Google Scholar] [CrossRef]
  72. Zhang, R.; Lu, J. Simulation of Land Use Pattern Evolution from a Multi-Scenario Perspective: A Case Study of Suzhou City in Anhui Province, China. Int. J. Environ. Res. Public Health 2021, 18, 921. [Google Scholar] [CrossRef] [PubMed]
  73. Zhang, M.; Chen, Q.; Zhang, K. Influence of the Variation in Rural Population on Farmland Preservation in the Rapid Urbanization Area of China. J. Geogr. Sci. 2021, 31, 1365–1380. [Google Scholar] [CrossRef]
  74. Cherono, K.; Workneh, T.S. Effect of Packing Units during Long Distance Transportation on the Quality and Shelf-Life of Tomatoes under Commercial Supply Conditions. Acta Hortic. 2020, 1292, 165–174. [Google Scholar] [CrossRef]
  75. Yi, F.; Liu, Y. The Paradox of Rice Planted Area Changes in Jiangsu and Zhejiang: An Interpretation Based on Elasticity of Substitution. Stat. Inf. Forum 2016, 31, 87–92. [Google Scholar]
  76. Sun, G.; Sun, M.; Du, L.; Zhang, Z.; Wang, Z.; Zhang, G.; Nie, S.; Xu, H.; Wang, H. Ecological Rice-Cropping Systems Mitigate Global Warming—A Meta-Analysis. Sci. Total Environ. 2021. [Google Scholar] [CrossRef]
Figure 1. (a) Location of Hubei Province; (b) four regions of Hubei Province.
Sustainability 15 09042 g001
Figure 2. Research framework.
Sustainability 15 09042 g002
Figure 3. The non-grain index of Hubei Province.
Sustainability 15 09042 g003
Figure 4. The Theil index of non-grain index.
Sustainability 15 09042 g004
Figure 5. Spatial distribution of NGP in Hubei Province: (a) 1991; (b) 2000; (c) 2010; (d) 2019.
Sustainability 15 09042 g005
Figure 6. Moran scatter plot of NGP in Hubei Province: (a) 1991; (b) 2000; (c) 2010; (d) 2019.
Sustainability 15 09042 g006
Figure 7. Local indicator of spatial association (LISA) cluster distribution map: (a) 1991; (b) 2000; (c) 2010; (d) 2019.
Sustainability 15 09042 g007
Figure 8. Spatial distributions of the regression coefficients on limiting factors: (a) slope of cultivated land; (b) per capita GDP; (c) proportion of agricultural machinery; (d) proportion of irrigated cultivated land.
Sustainability 15 09042 g008
Figure 9. Grain production in Hubei Province.
Sustainability 15 09042 g009
Figure 10. The sown area of rice in Hubei Province: (a) the sown area of rice; (b) the area of “double-to-single”.
Sustainability 15 09042 g010
Table 2. Preliminarily selected factors of NGP in this study.
VariableDescriptionReferencesCode
Natural environment factorsAverage annual rainfallAverage annual rainfall/county area (mL/hm2)[52]X1
Slope of cultivated landPercentage of area with a slope greater than 25° (%)[44,53]X2
Proportion of dry landDrought cultivated land area/total cultivated land area (%)[52]X3
Socioeconomic factorsPer capita cultivated landTotal area of cultivated land/rural population (hm2/per)[21,53]X4
Per capita GDPTotal county GDP/rural population (RMB/per)[21,44,53]X5
Road densityRoad area/rural area (%)[54,55]X6
Agricultural modernisation factorsProportion of agricultural machineryTotal machinery power/total area of cultivated land (kW/hm2)[29,56]X7
Proportion of irrigated cultivated landIrrigated cultivated land area/total cultivated land area (%)[57]X8
Table 3. OLS-based model fitting results.
VariableCoefficienttp ValueVIFRanking
X20.1280.8530.041 **3.9524
X50.1851.1710.020 **2.7203
X7−0.323−2.4930.001 ***2.2992
X8−0.531−3.1090.003 **2.7031
Note: *** and ** show significance at a level of 1% and 5%, respectively.
Table 4. Comparison between OLS-based and GWR-based models regarding fitting performance.
ModelAICR2Adjusted R2
OLS−27.090.370.29
GWR−55.670.670.54
Disclaimer/Publisher’s Note: The statements, opinions and data contained in all publications are solely those of the individual author(s) and contributor(s) and not of MDPI and/or the editor(s). MDPI and/or the editor(s) disclaim responsibility for any injury to people or property resulting from any ideas, methods, instructions or products referred to in the content.

