

Landslide Susceptibility Mapping in Guangdong Province, China, Using Random Forest Model and Considering Sample Type and Balance

Abstract
:1. Introduction
2. Materials and Methods
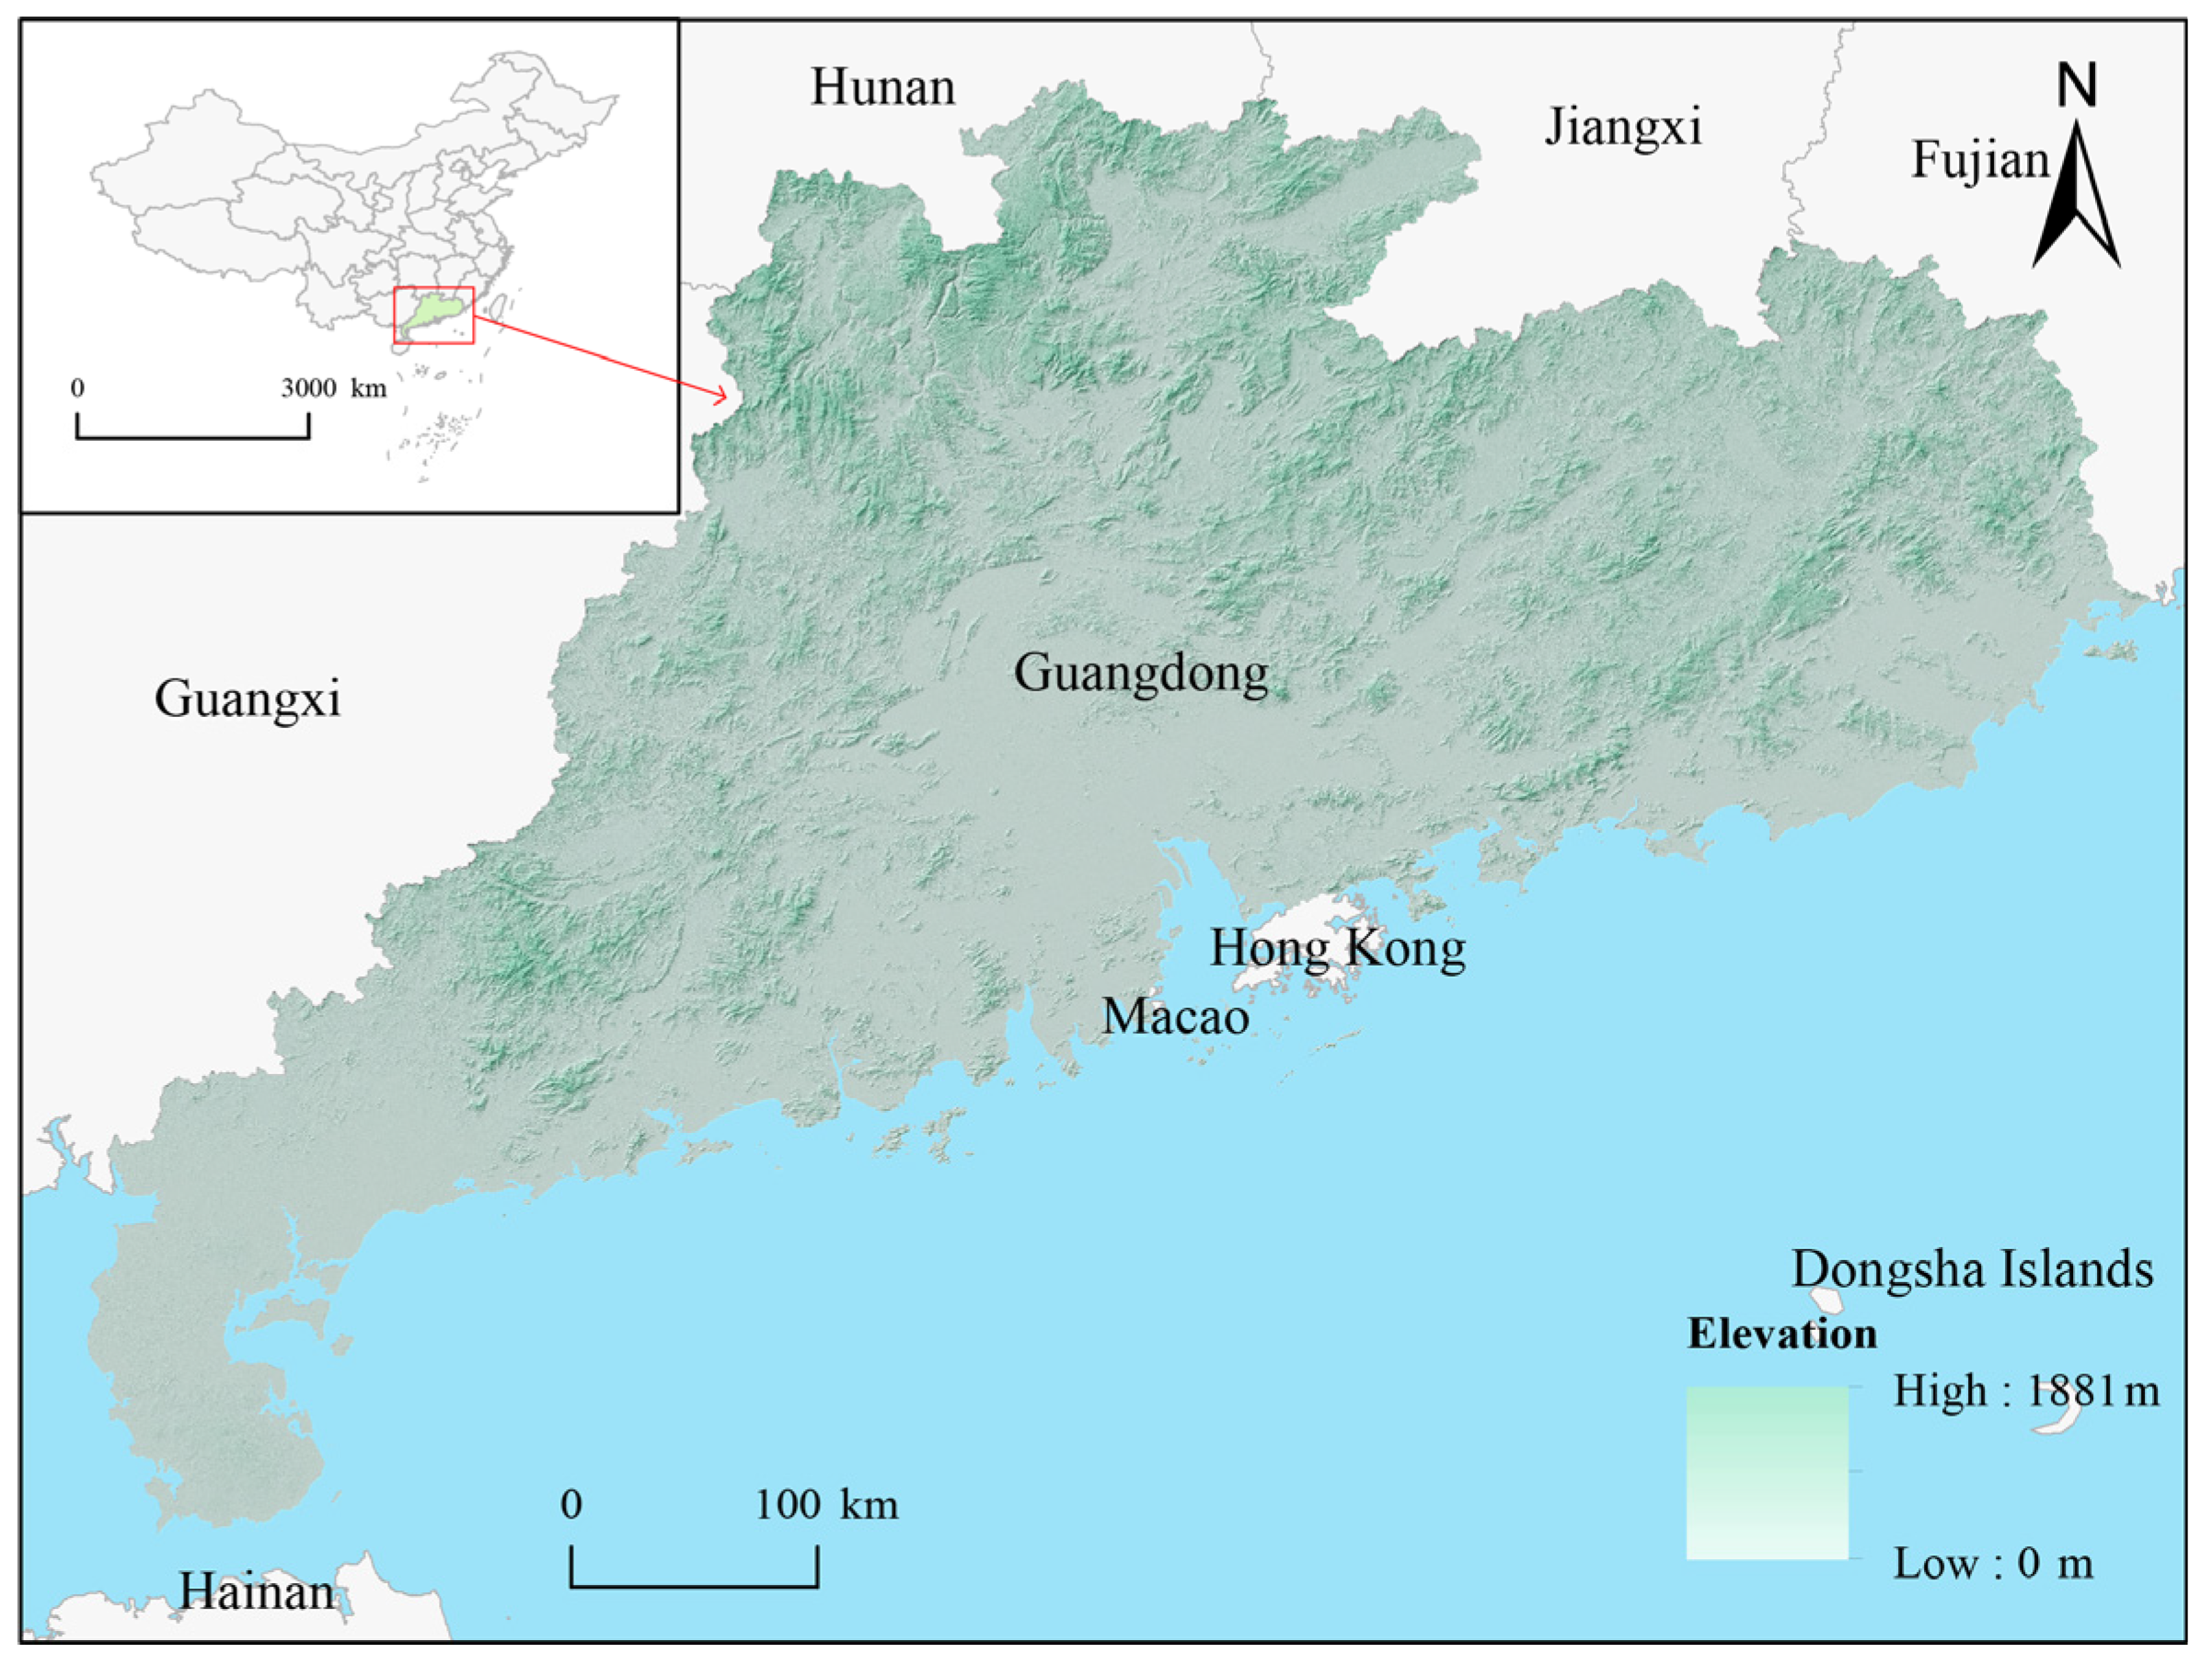
2.1. Study Area
2.2. Data
2.2.1. Landslide Inventory
2.2.2. Environmental Factors

| Category | Resolution | Factor | Data Type | Classes | Source |
|---|---|---|---|---|---|
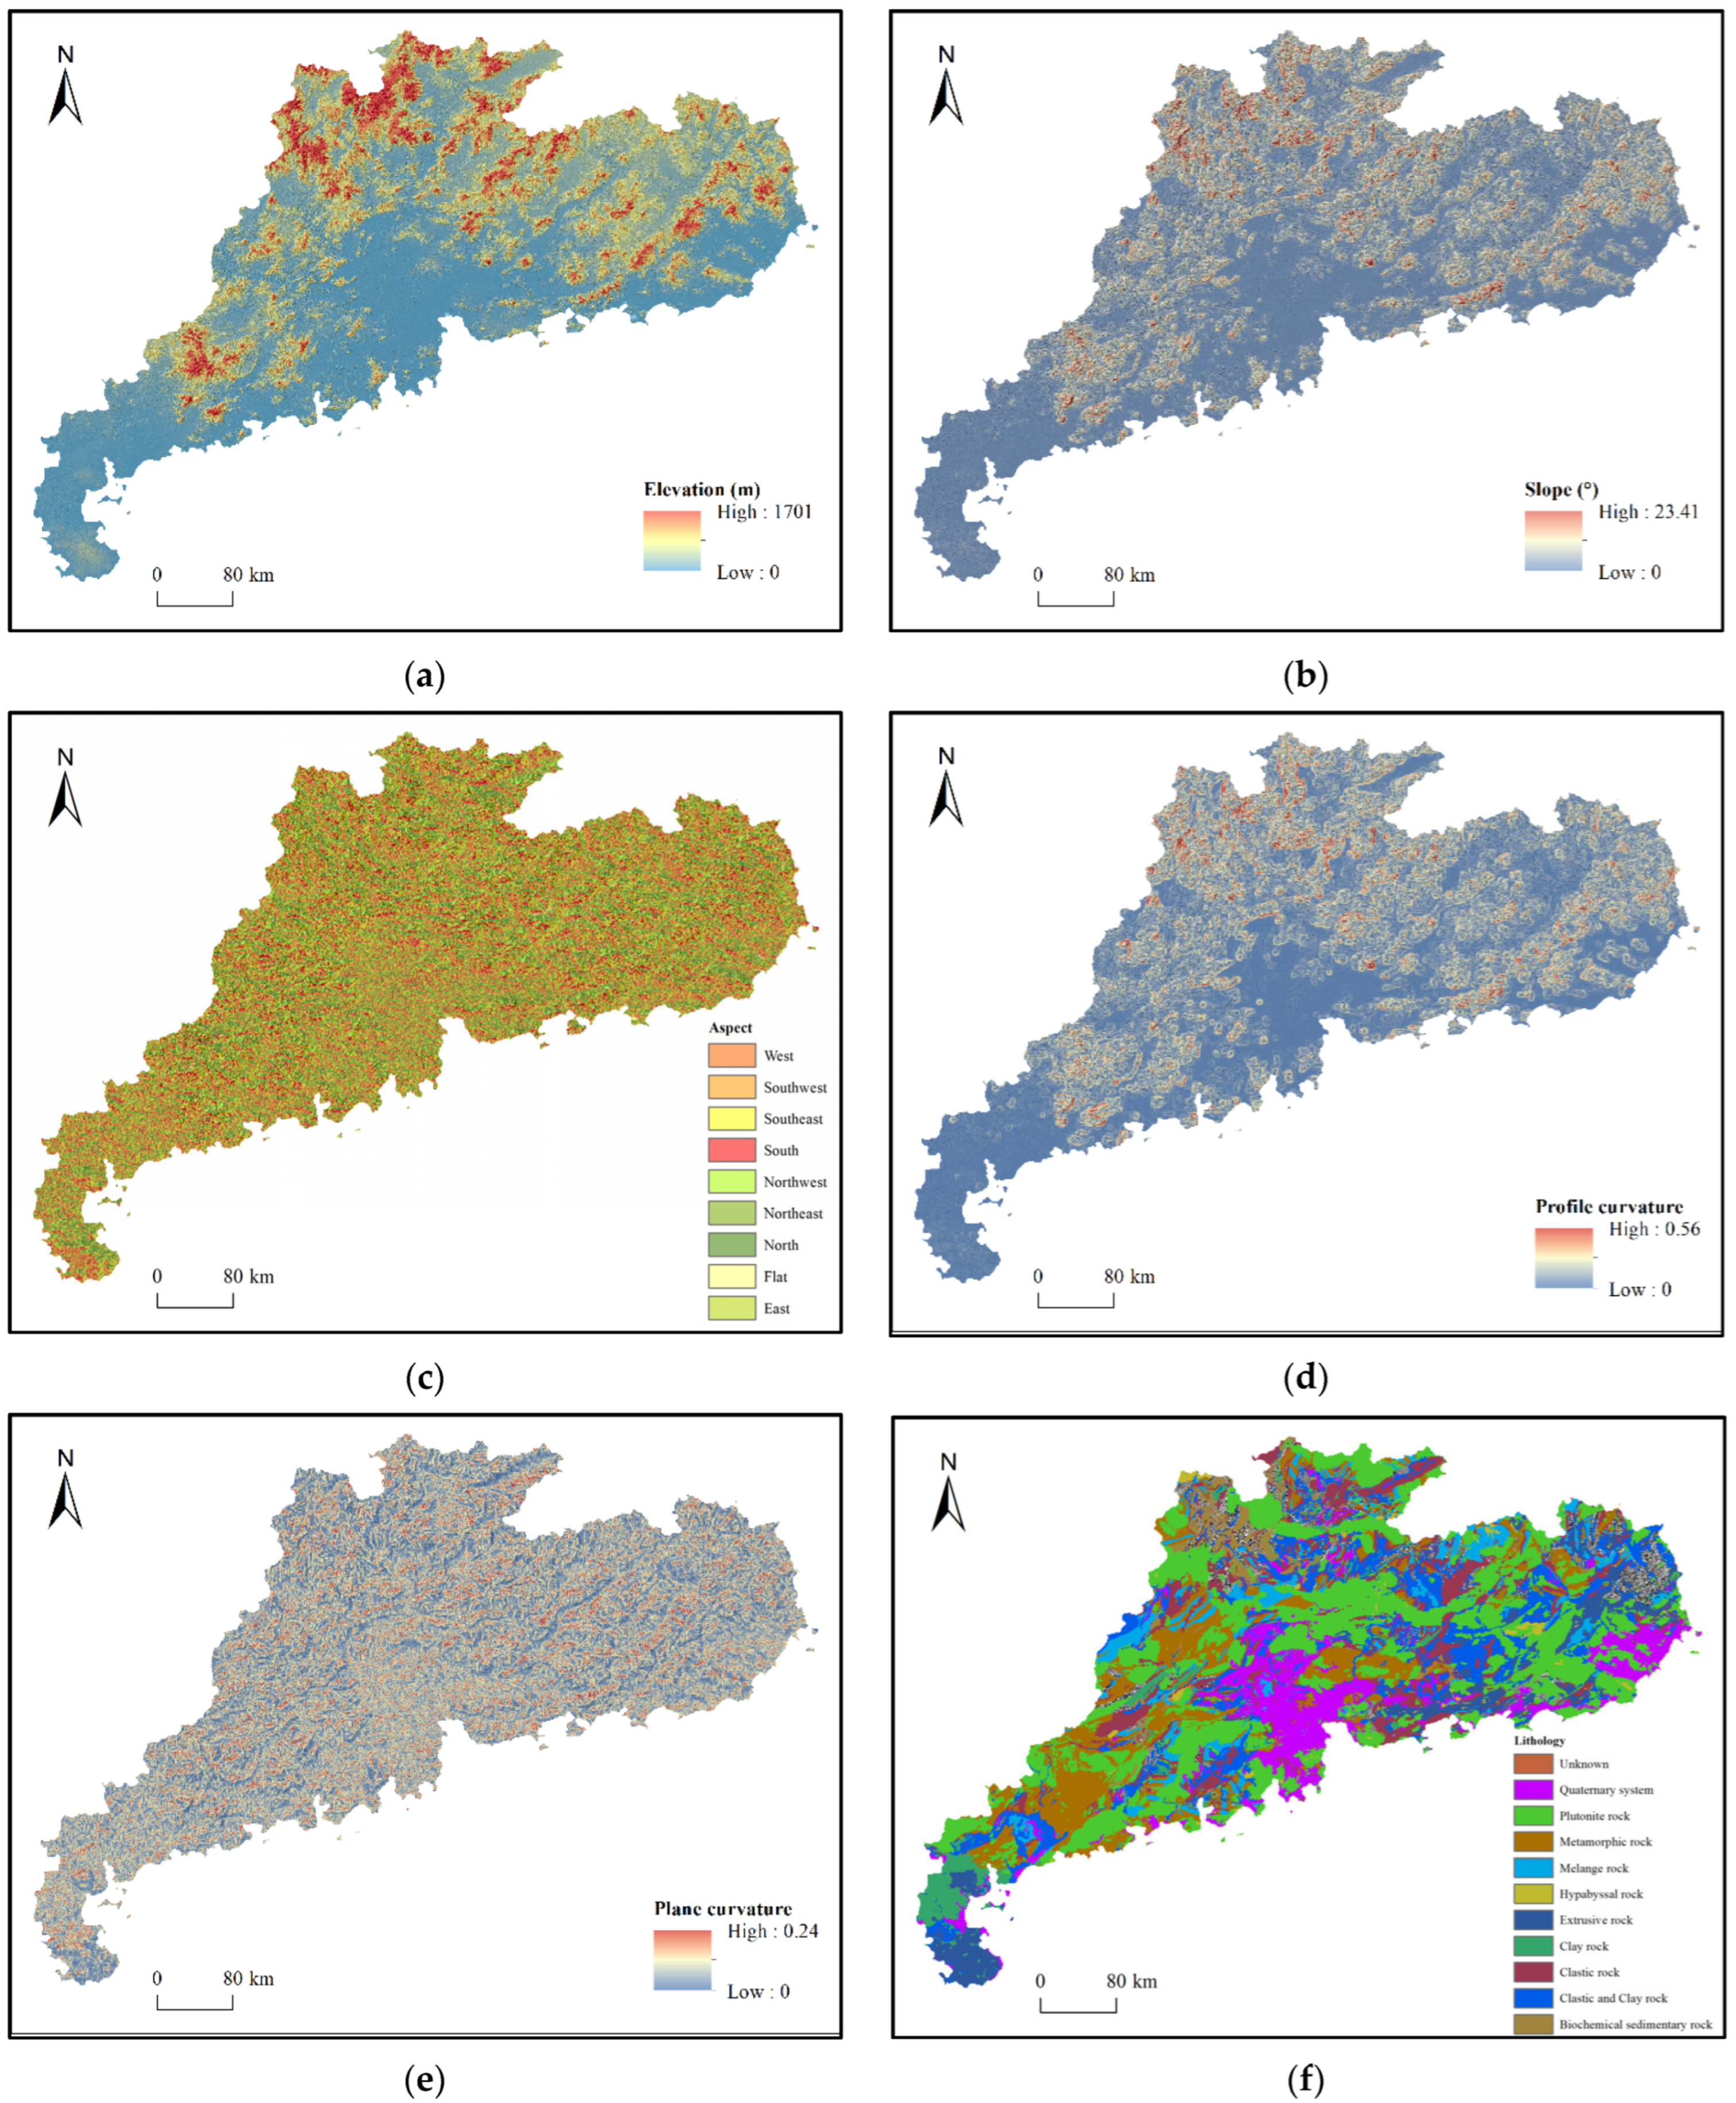
| Topographic | 30 m | Elevation (m) | Continuous | 0~1701 | ASTER GDEM V2 DEM (earthexplorer.usgs.gov, accessed on 15 November 2021) |
| Slope (°) | Continuous | 0~23.41 | |||
| Aspect | Categorical | 1: Flat, 2: North, 3: Northeast, 4: East, 5: Southeast, 6: South, 7: Southwest, 8: West, 9: Northwest | |||
| Profile curvature | Continuous | 0~0.56 | |||
| Plane curvature | Continuous | 0~0.24 | |||
| Geological | 1000 m | Lithology | Categorical | 0: Unknown, 1: Extrusive rock, 2: Hypabyssal rock, 3: Plutonite rock, 4: Clastic rock, 5: Clay rock, 6: Clastic and Clay rock, 7: Biochemical sedimentary rock, 8: Metamorphic rock, 9: Melange rock, 10: Quaternary system | National Geological Archive (www.ngac.cn, accessed on 17 November 2021) |
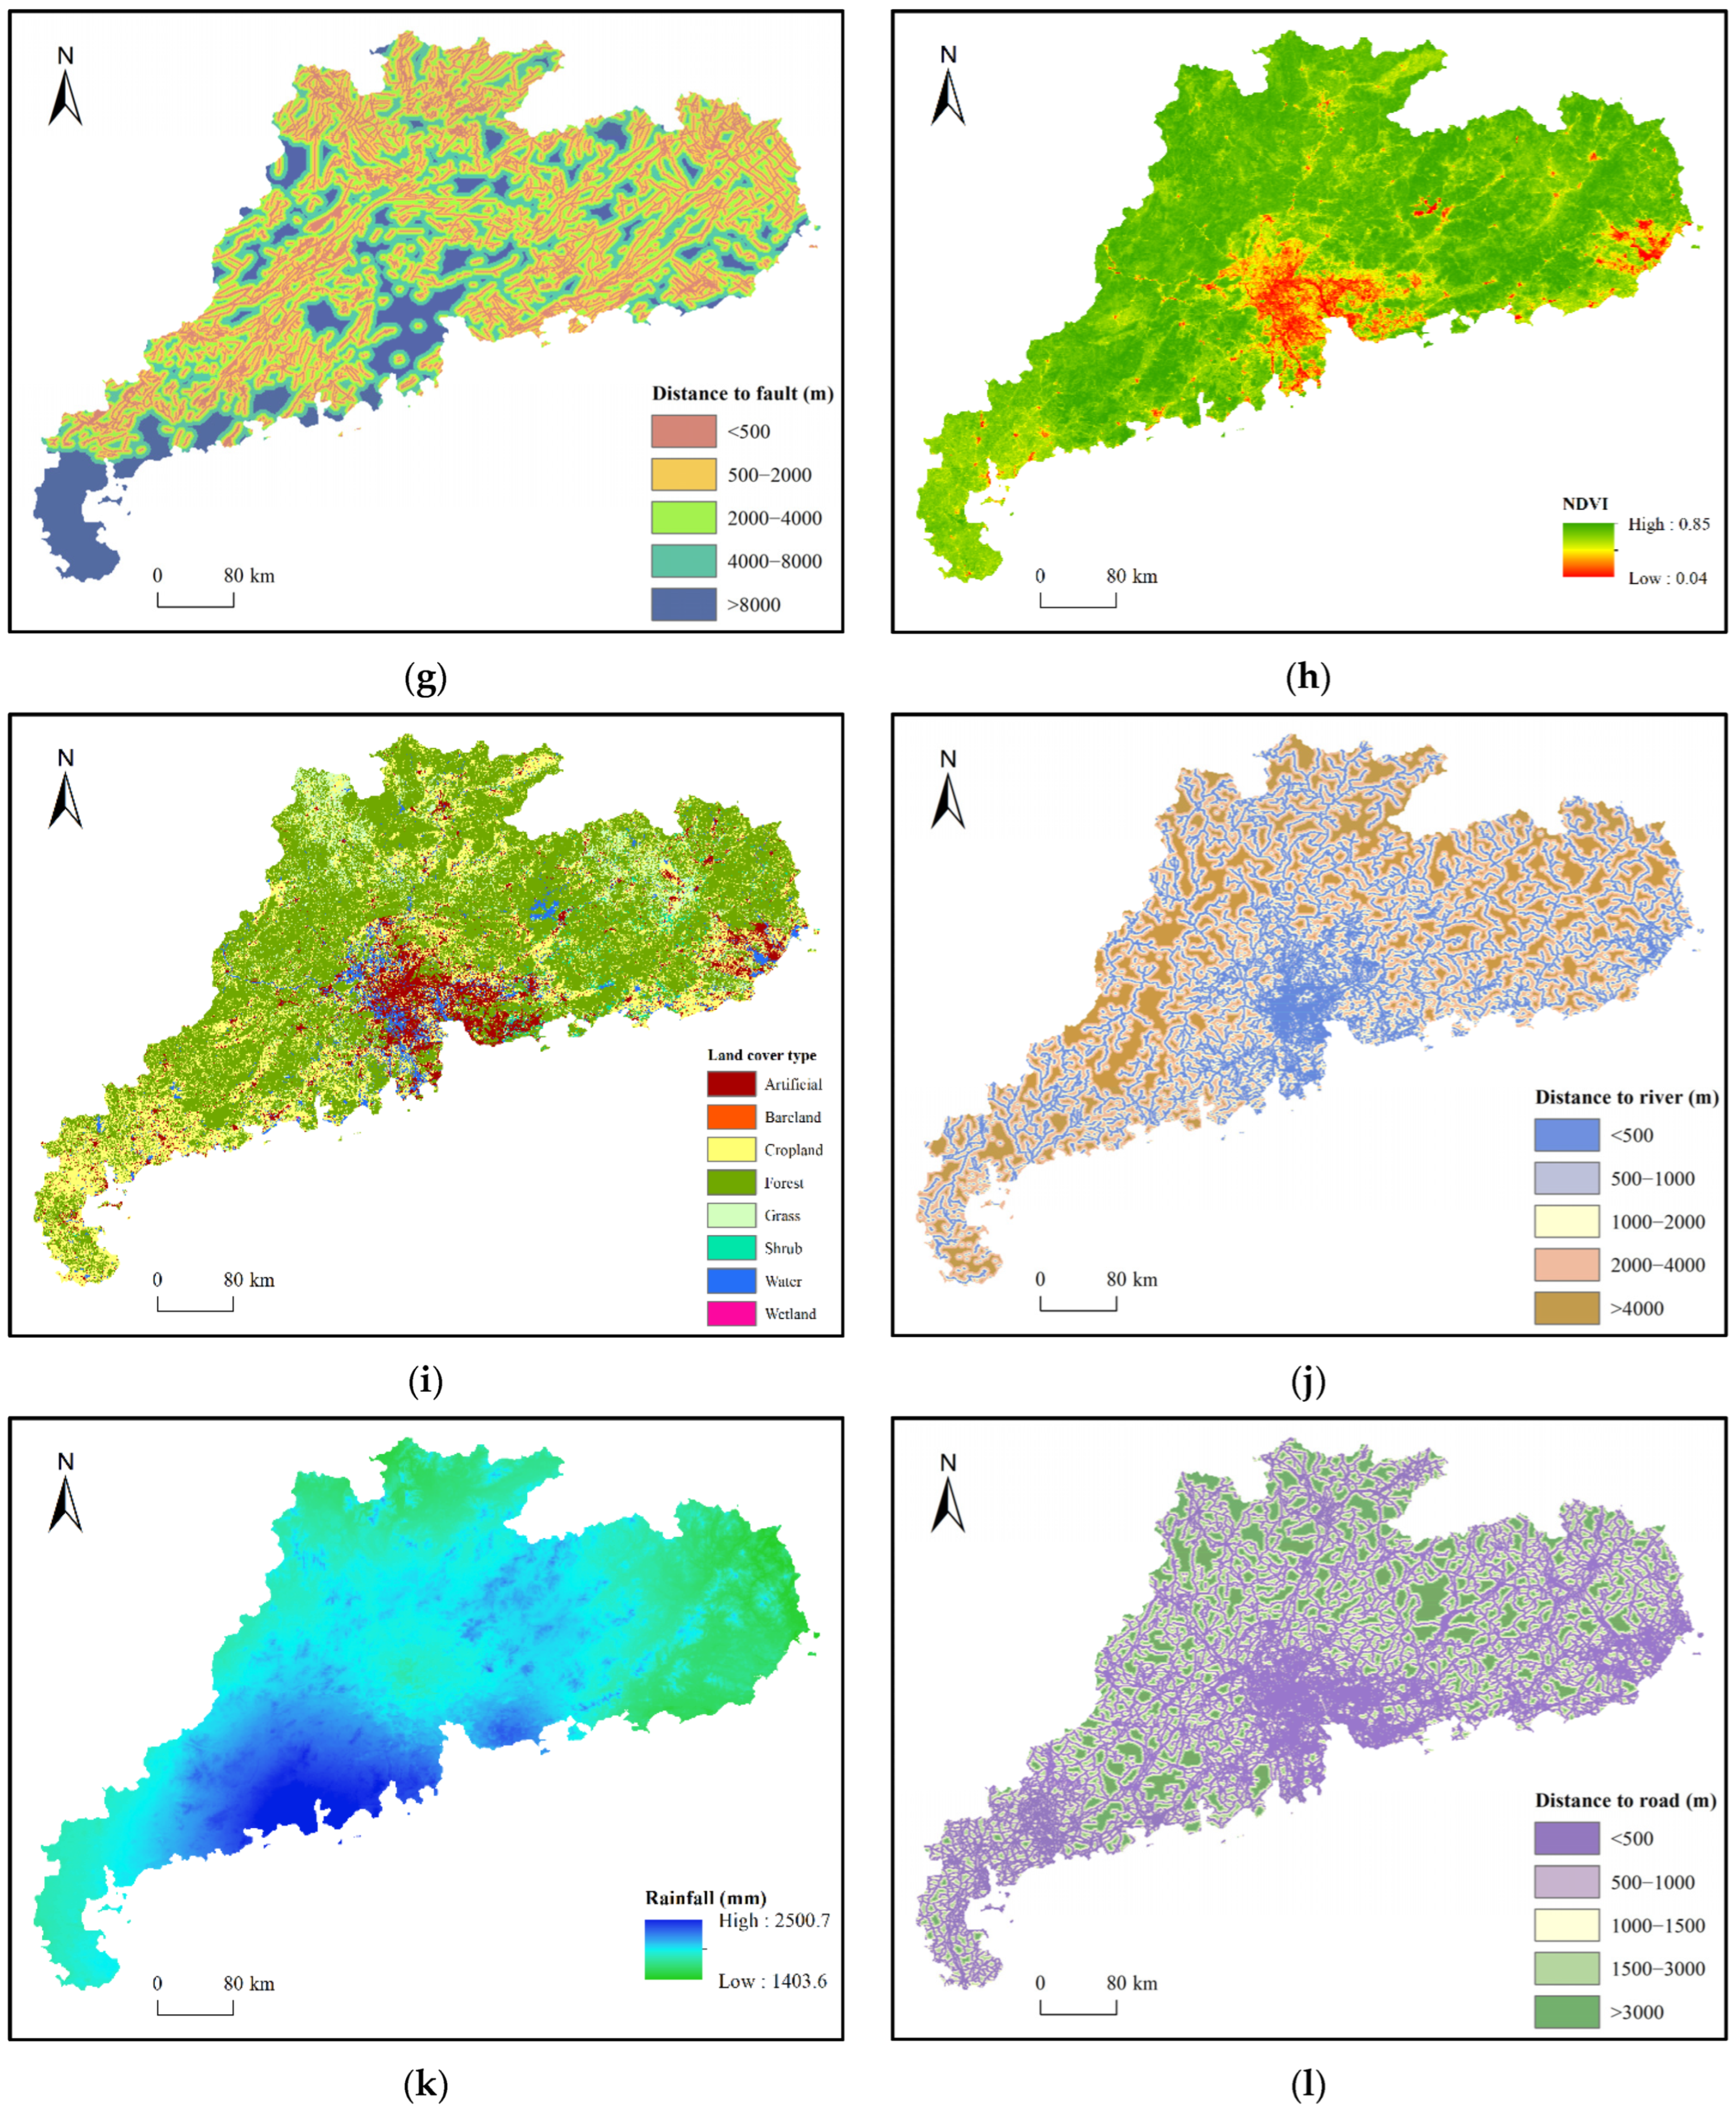
| Distance to fault (m) | Continuous | 0~133,212 | |||
| Land cover | 30 m | Normalized difference vegetation index (NDVI) | Continuous | 0.04~0.85 | Google Earth Engine (GEE) Landsat 8 Collection Tier 1 (earthengine.google.com, accessed on 16 November 2021) |
| Land cover type | Categorical | 10: Cropland, 20: Forest, 30: Grass, 40: Shrub, 50: Wetland, 60: Water, 80: Artificial, 90: Bareland | GlobeLand30 2020 (www.globallandcover.com, accessed on 2 December 2021) | ||
| Meteorological and hydrological | 1000 m | Distance to river (m) | Continuous | 0~13,347 | OpenStreetMap (www.openstreetmap.org, accessed on 2 December 2021) |
| Rainfall (mm) | Continuous | 1403.6~2500.7 | National Earth System Science Data Center (www.geodata.cn, accessed on 15 November 2021) [53] | ||
| Human activity | 1000 m | Distance to road (m) | Continuous | 0~13,642.6 | OpenStreetMap (www.openstreetmap.org, accessed on 2 December 2021) |
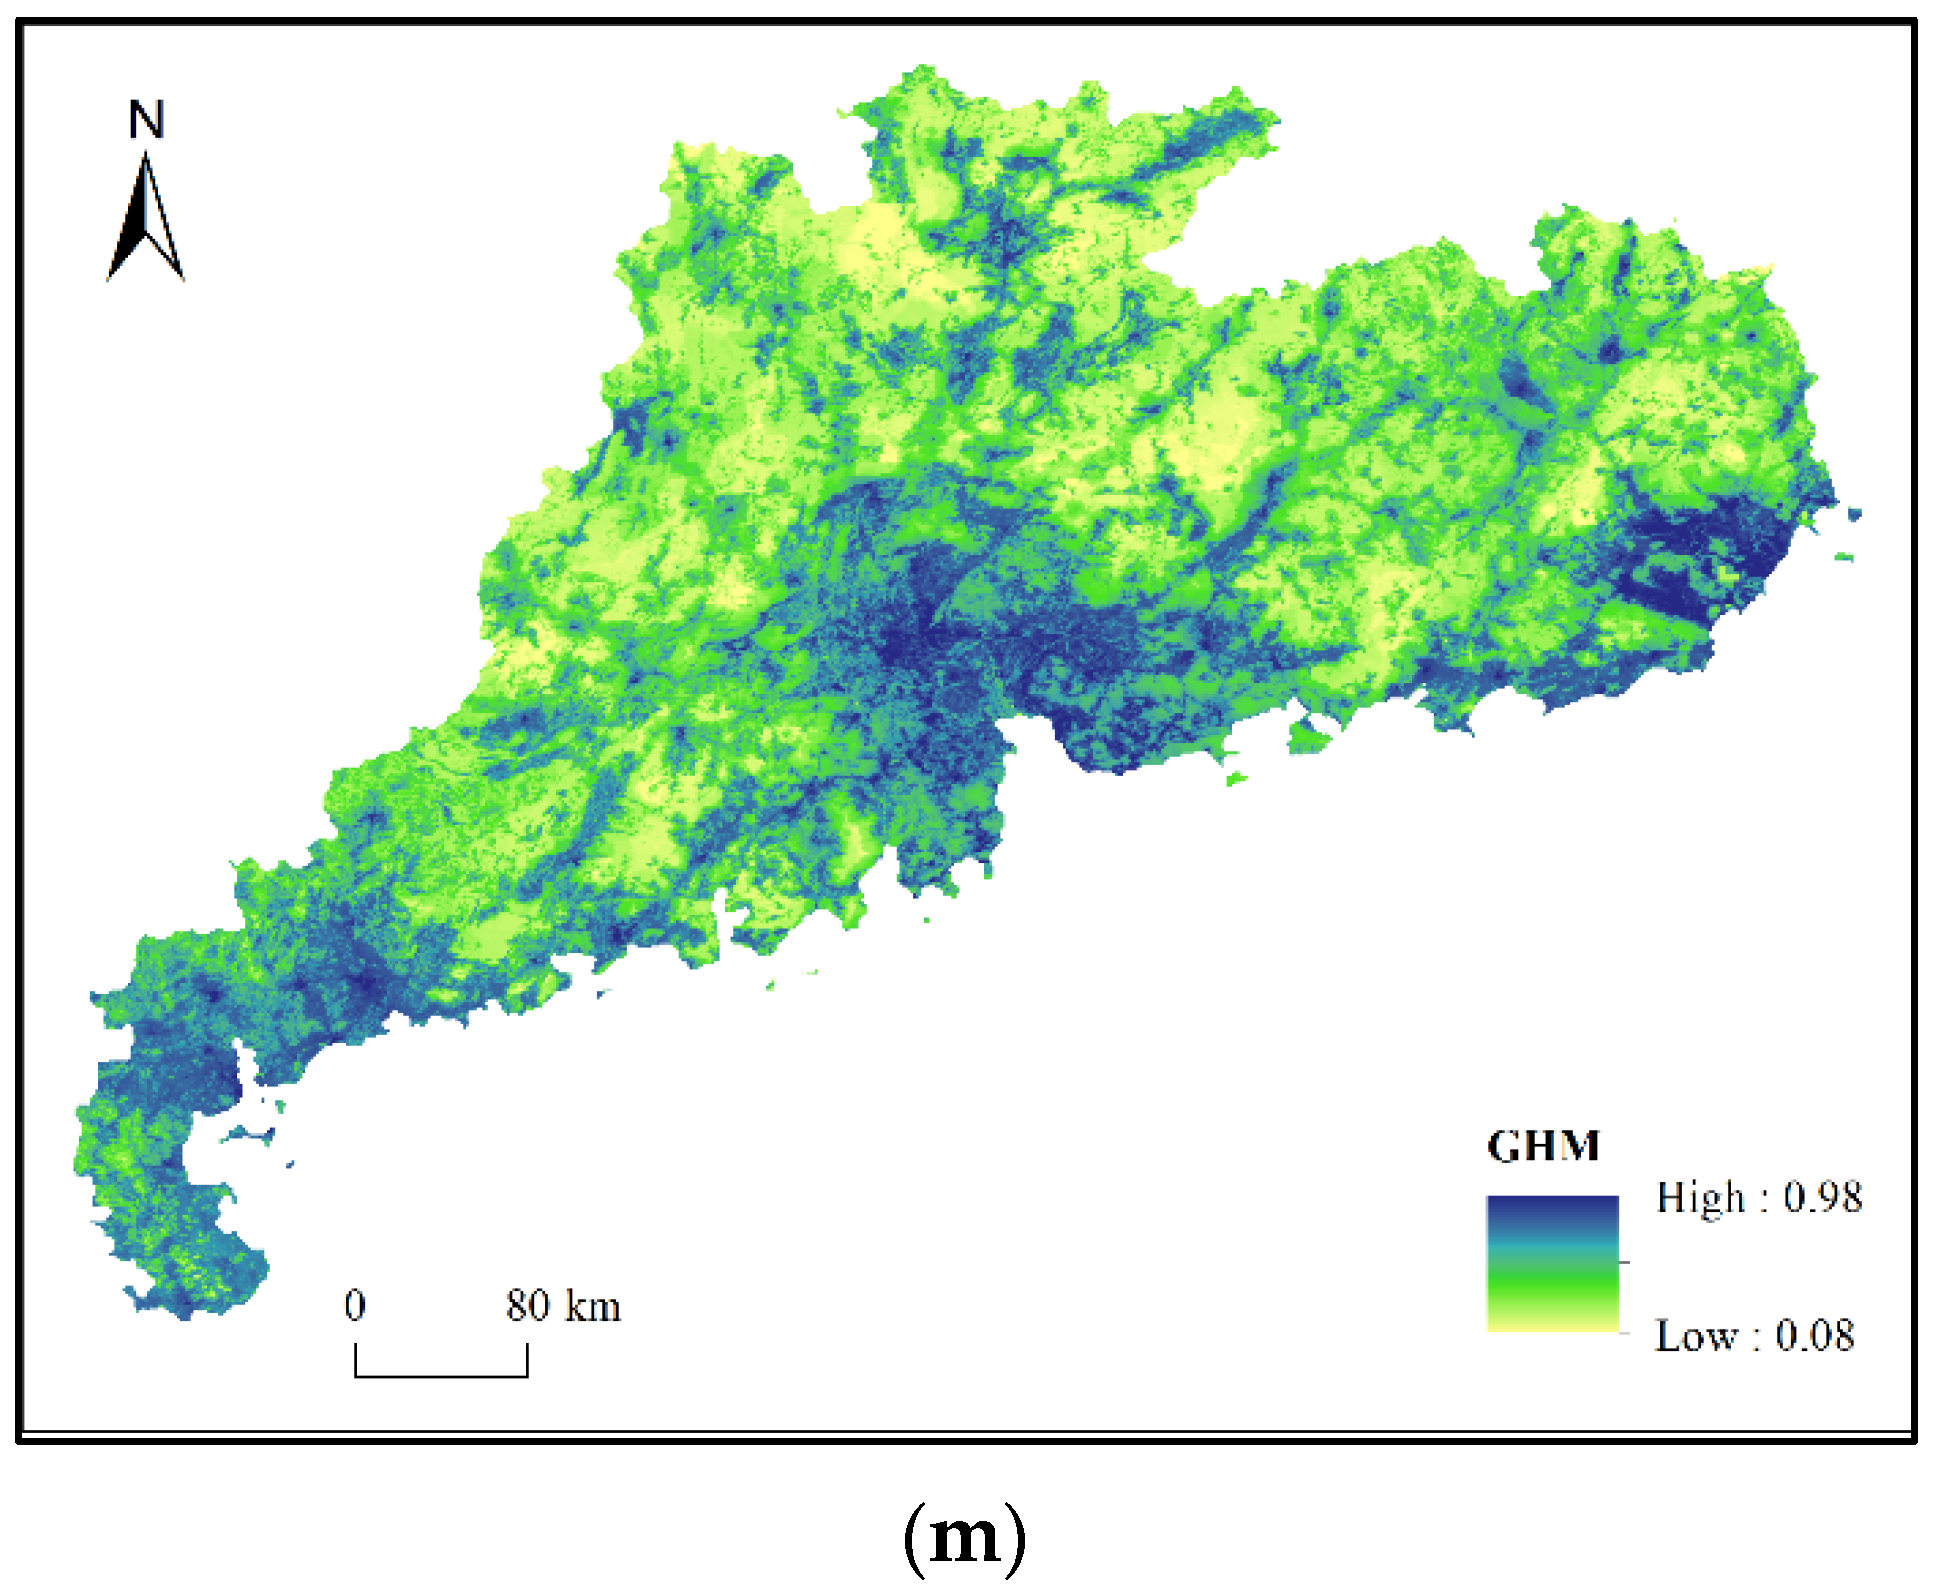
| Global human modification (GHM) | Continuous | 0.08~0.98 | GEE CSP GHM (earthengine.google.com, accessed on 1 December 2021) [54] |


- Topographic dataThe elevation, slope, aspect, profile, and plane curvature were extracted from the 30 m spatial resolution ASTER global digital elevation model (GDEM) V2 version data after resampling (data year 2011). The ASTER GDEM V2 version was adopted in this study because it has been proven to be more accurate than the V1 version and it has more practical use and allows for greater verification than the V3 version [55]. Topographic data are the most commonly used factor in LSM studies [18]. Landslides can occur when elevation and slope exhibit certain conditions [18,48]; a higher curvature means that the slope has a stronger capacity for water accumulation and is more prone to landslides [34,48]; meteorological processes regulate sunlight, hydrological elements, and wind direction, which affect slope stability [48].
- Geological dataLandslides are related to geological conditions [18]. They primarily occur in areas with a weathered soil layer on the bedrock surface [51] as well as with tectonic activity [18]. Thus, the geological data of the study area mainly include lithology and distance to fault, which were derived from the geological vector map of Guangdong Province provided by the National Geological Archive (NGA). The lithology factor was reclassified into the quaternary system, plutonic rock, metamorphic rock, melange (or mélange) rock, hypabyssal rock, extrusive rock, clay rock, clastic rock, and biochemical sedimentary rock, in accordance with the original data description and the study of Liu et al. [41]. The distance to fault factor was calculated using the Euclidean distance between each grid and the nearest fault structure.
- Land cover dataThe normalized difference vegetation index (NDVI) and land cover type were used to represent land cover in the study area, as they can affect slope stability by altering the density of vegetation, soil moisture content, land evapotranspiration, and root strength [18,35]. The NDVI was generated via the Landsat8 Collection 1 Tier 1 8-Day from 2015 to 2019 on the Google Earth Engine (GEE) platform; the maximum values during the study period were adopted as the NDVI factor. The land cover type was obtained from the land cover product GlobeLand30 for 2020. Since Guangdong Province is located in a low-latitude area and has a tropical and subtropical climate, eight land cover types, including cultivated land, forest, grassland, shrubland, wetland, water bodies, artificial surfaces, and bare land, were considered in the study area (excluding tundra and permanent snow and ice).
- Meteorological and hydrological dataRainfall is an important trigger of landslides [56]. Because the rainfall in Guangdong Province is significant and the samples input to the model are all rainfall-induced landslides, it is necessary to consider the rainfall factor. The annual average rainfall represents the average rainfall condition over the long term in the region [24], which has been validated in previous machine learning LSM studies [16,41]. The average annual rainfall of the study area from 2015 to 2019 is used as the rainfall factor; it was calculated by processing the primitive data of the monthly rainfall dataset provided by the National Earth System Science Data Center [53]. The river can carry away the rock and soil mass at the slope toe, resulting in the slope toe near the river easily forming an aerial surface and promoting the occurrence of landslides [24]. Thus, the factor of distance to river was added; it was obtained by calculating each grid’s Euclidean distance to the nearest river. The river network data were obtained from OpenStreetMap.
- Human activity dataThe road construction near slopes can considerably reduce the stability of slopes [24] and even directly lead to landslide occurrence [47]. Therefore, the factor of distance to road indicates a trigger of human activity; it was obtained by calculating the Euclidean distance from each grid to the nearest road based on road data downloaded from the OpenStreetMap. In particular, to fully measure the complicated impact of human activities on landslides [47], the Global Human Modification (GHM) data with a 1 km spatial resolution on the GEE platform were also incorporated (data year 2016) [54]. The GHM is a continuous index ranging from 0 (no human impact) to 1 (high impact), where a greater value indicates more intense human modification of terrestrial lands. It provides an insight into the impact of human activities by analyzing various types of data, including human settlements, agricultural activities, transportation, mining and energy production activities, and electricity infrastructure. As an integrated variable, the GHM considers the impact of different types of human modification.
2.3. Methods
2.3.1. Normalization and Correlation Test of Model Inputs
2.3.2. Construction of LSM Model Considering Sample Type and Balance
2.3.3. Machine-Learning-Based LSM Model Comparison
2.3.4. Model Application and Multidimensional Analysis
3. Results
3.1. The Correlation of Environmental Factors
3.2. Performance Evaluation of Sample Ratios
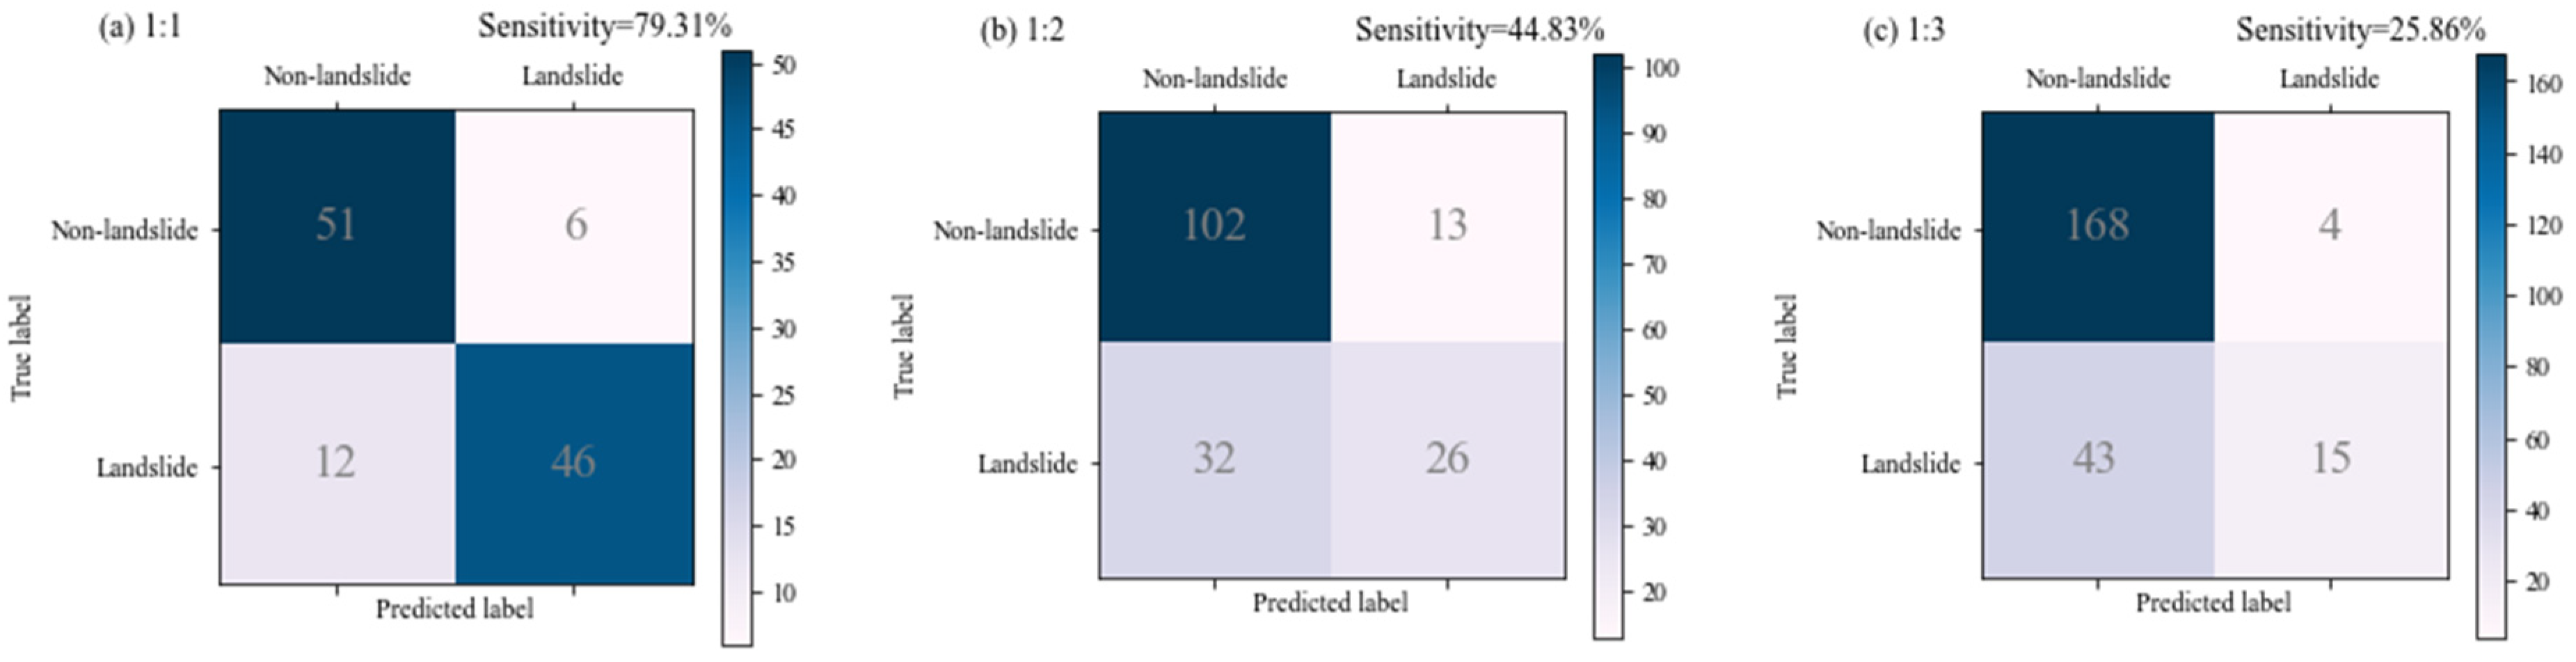
3.2.1. Analysis of Positive-to-Negative Sample Ratio on Sensitivity
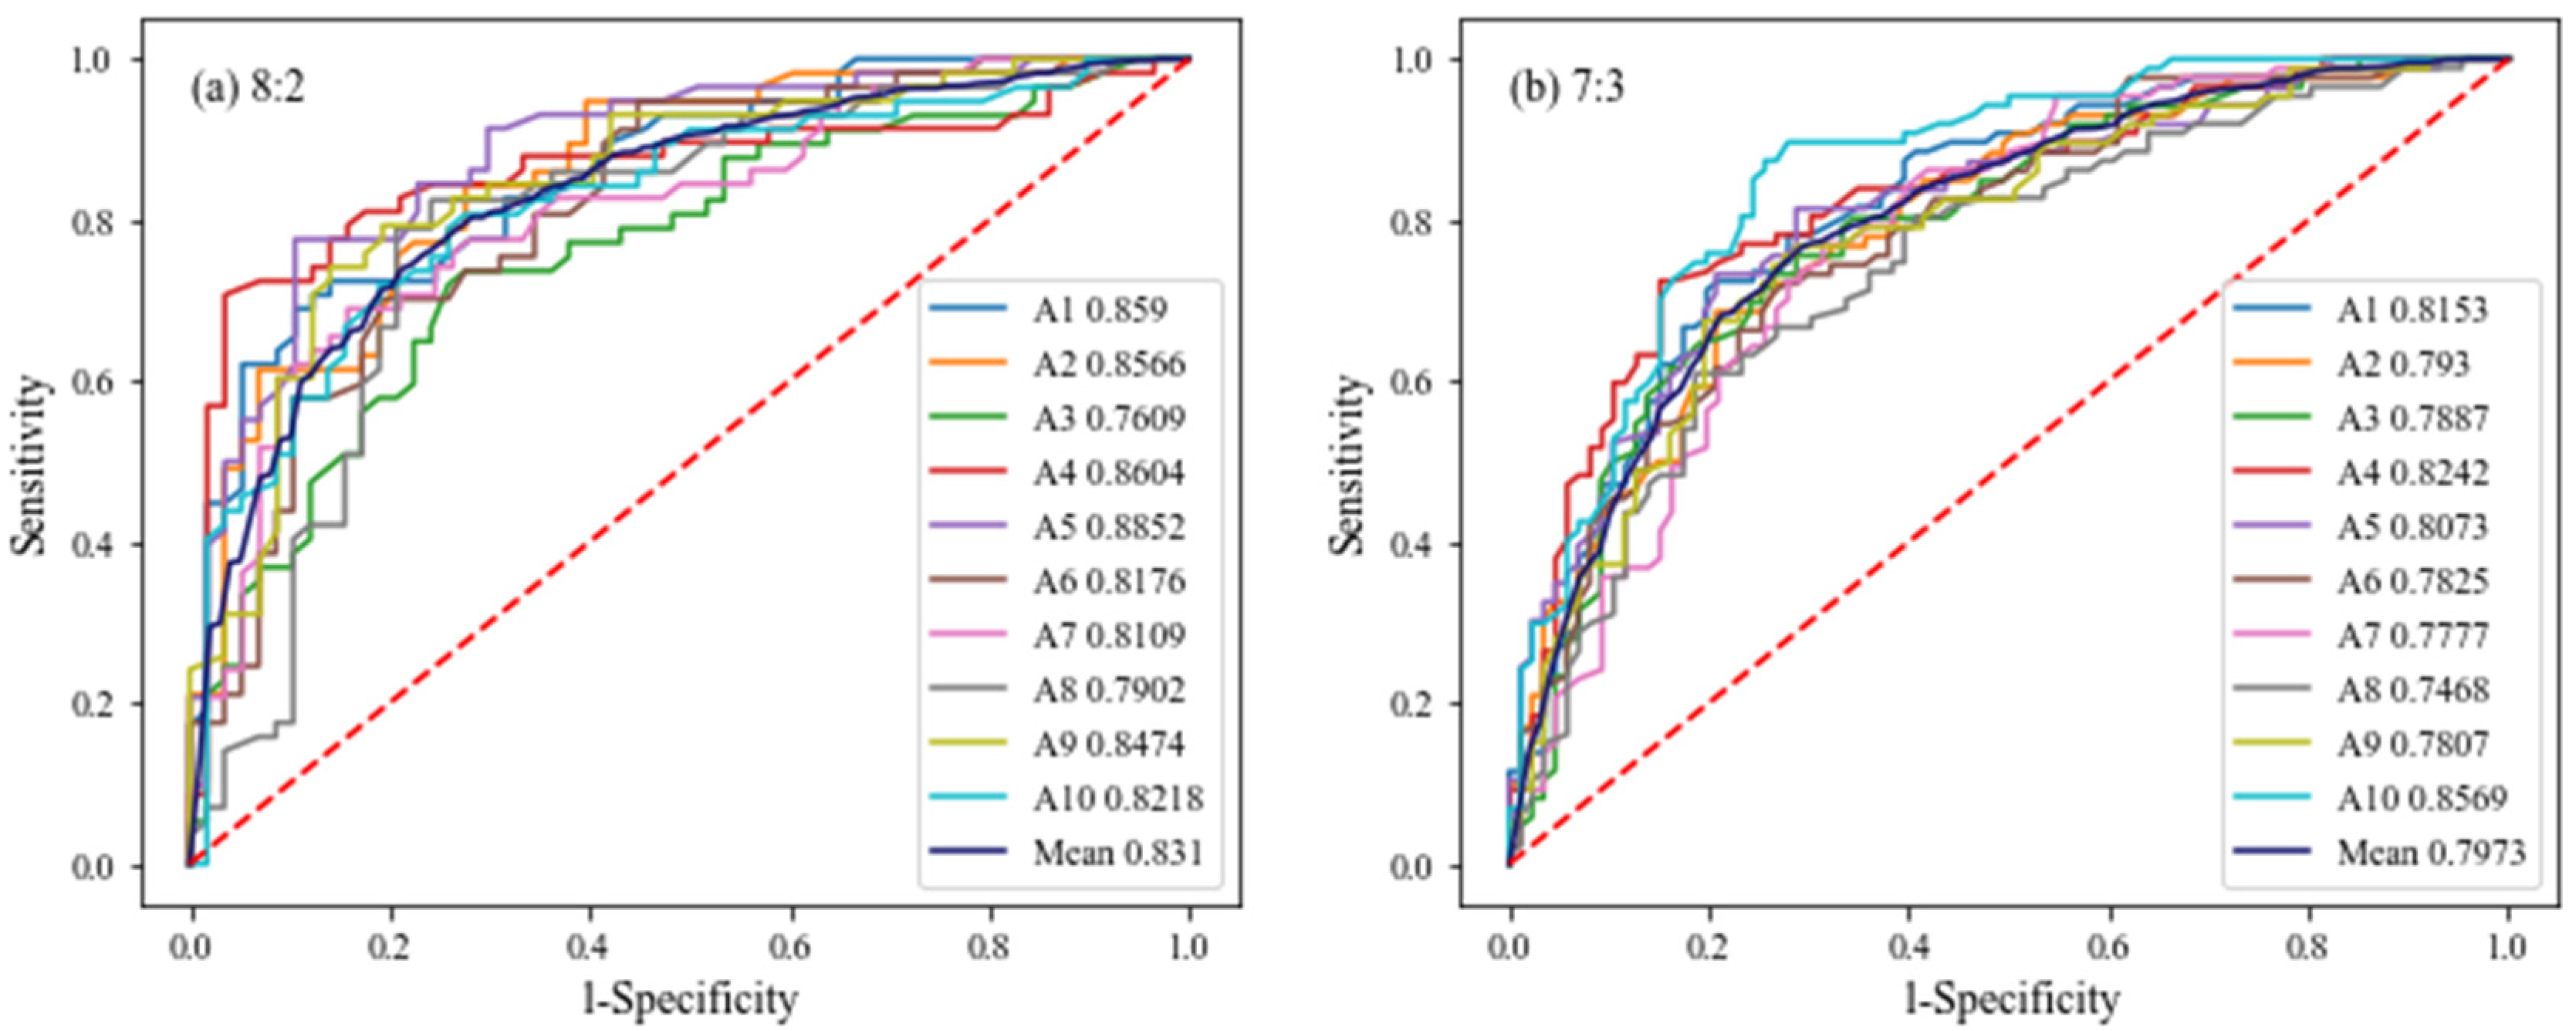
3.2.2. Analysis of Training-to-Test Sample Ratio of AUC
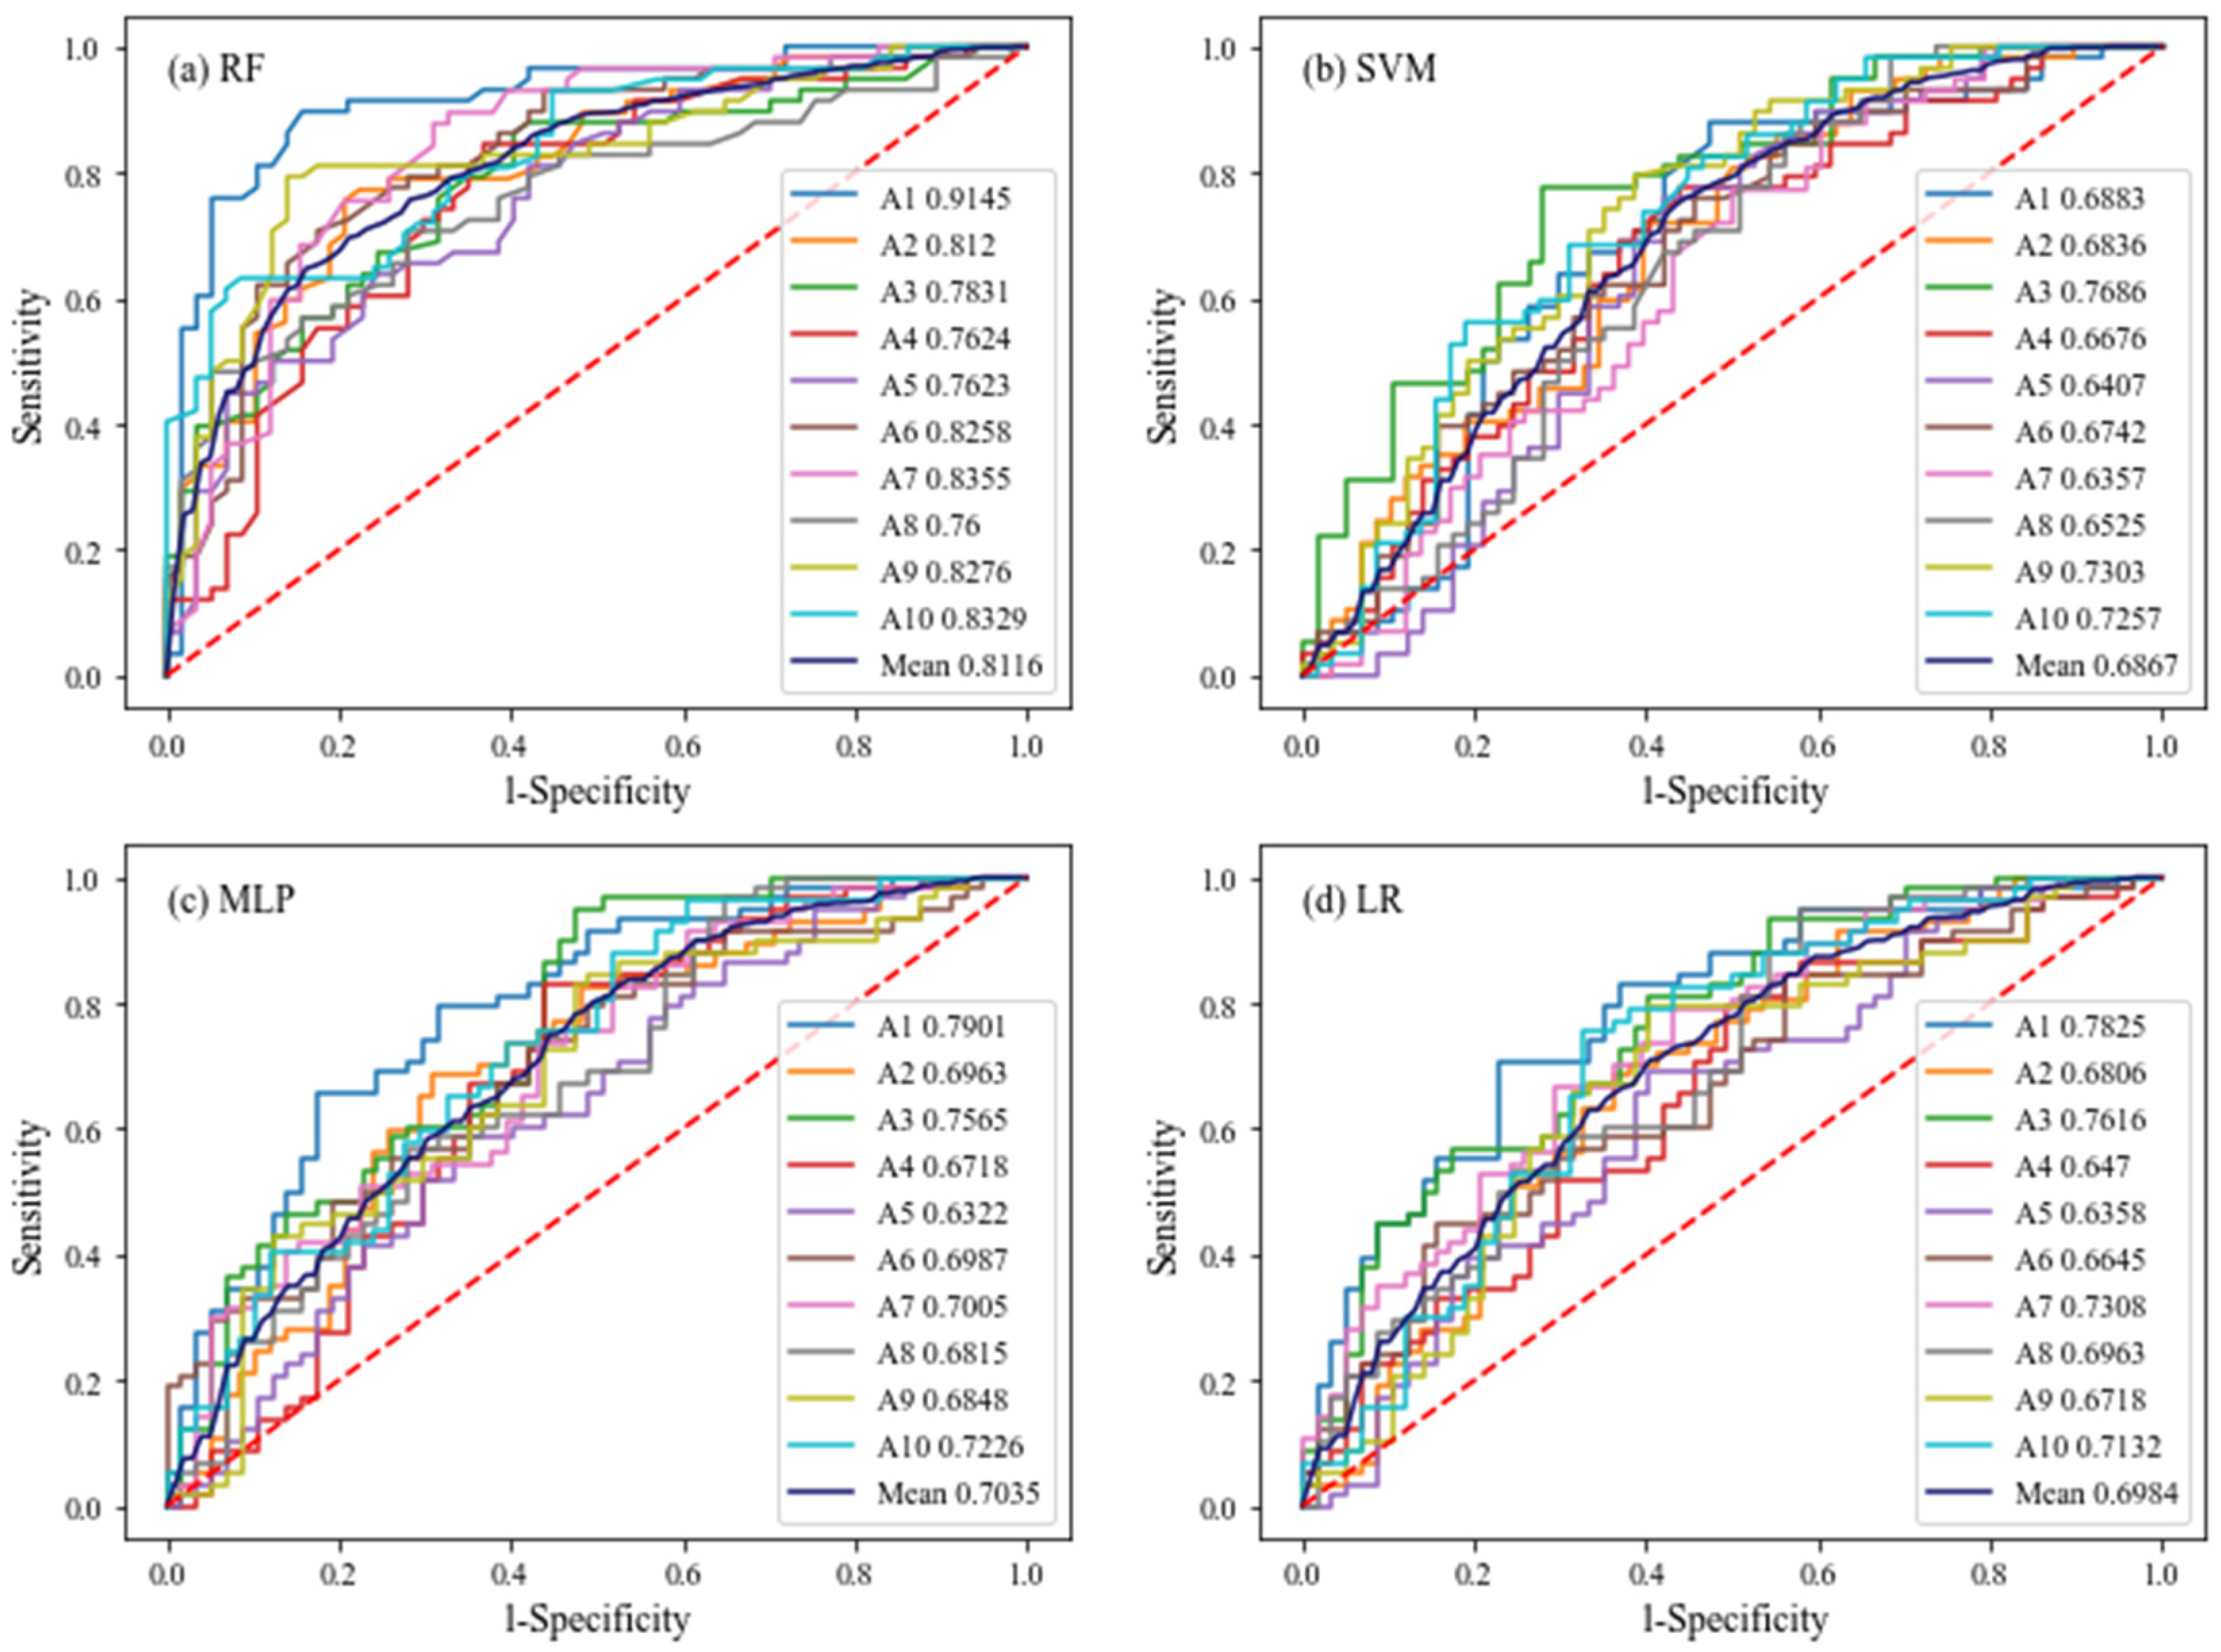
3.3. Comparison of Machine Learning Models
3.4. Analysis of Landslide Susceptibility Distribution Pattern and Factor Importance
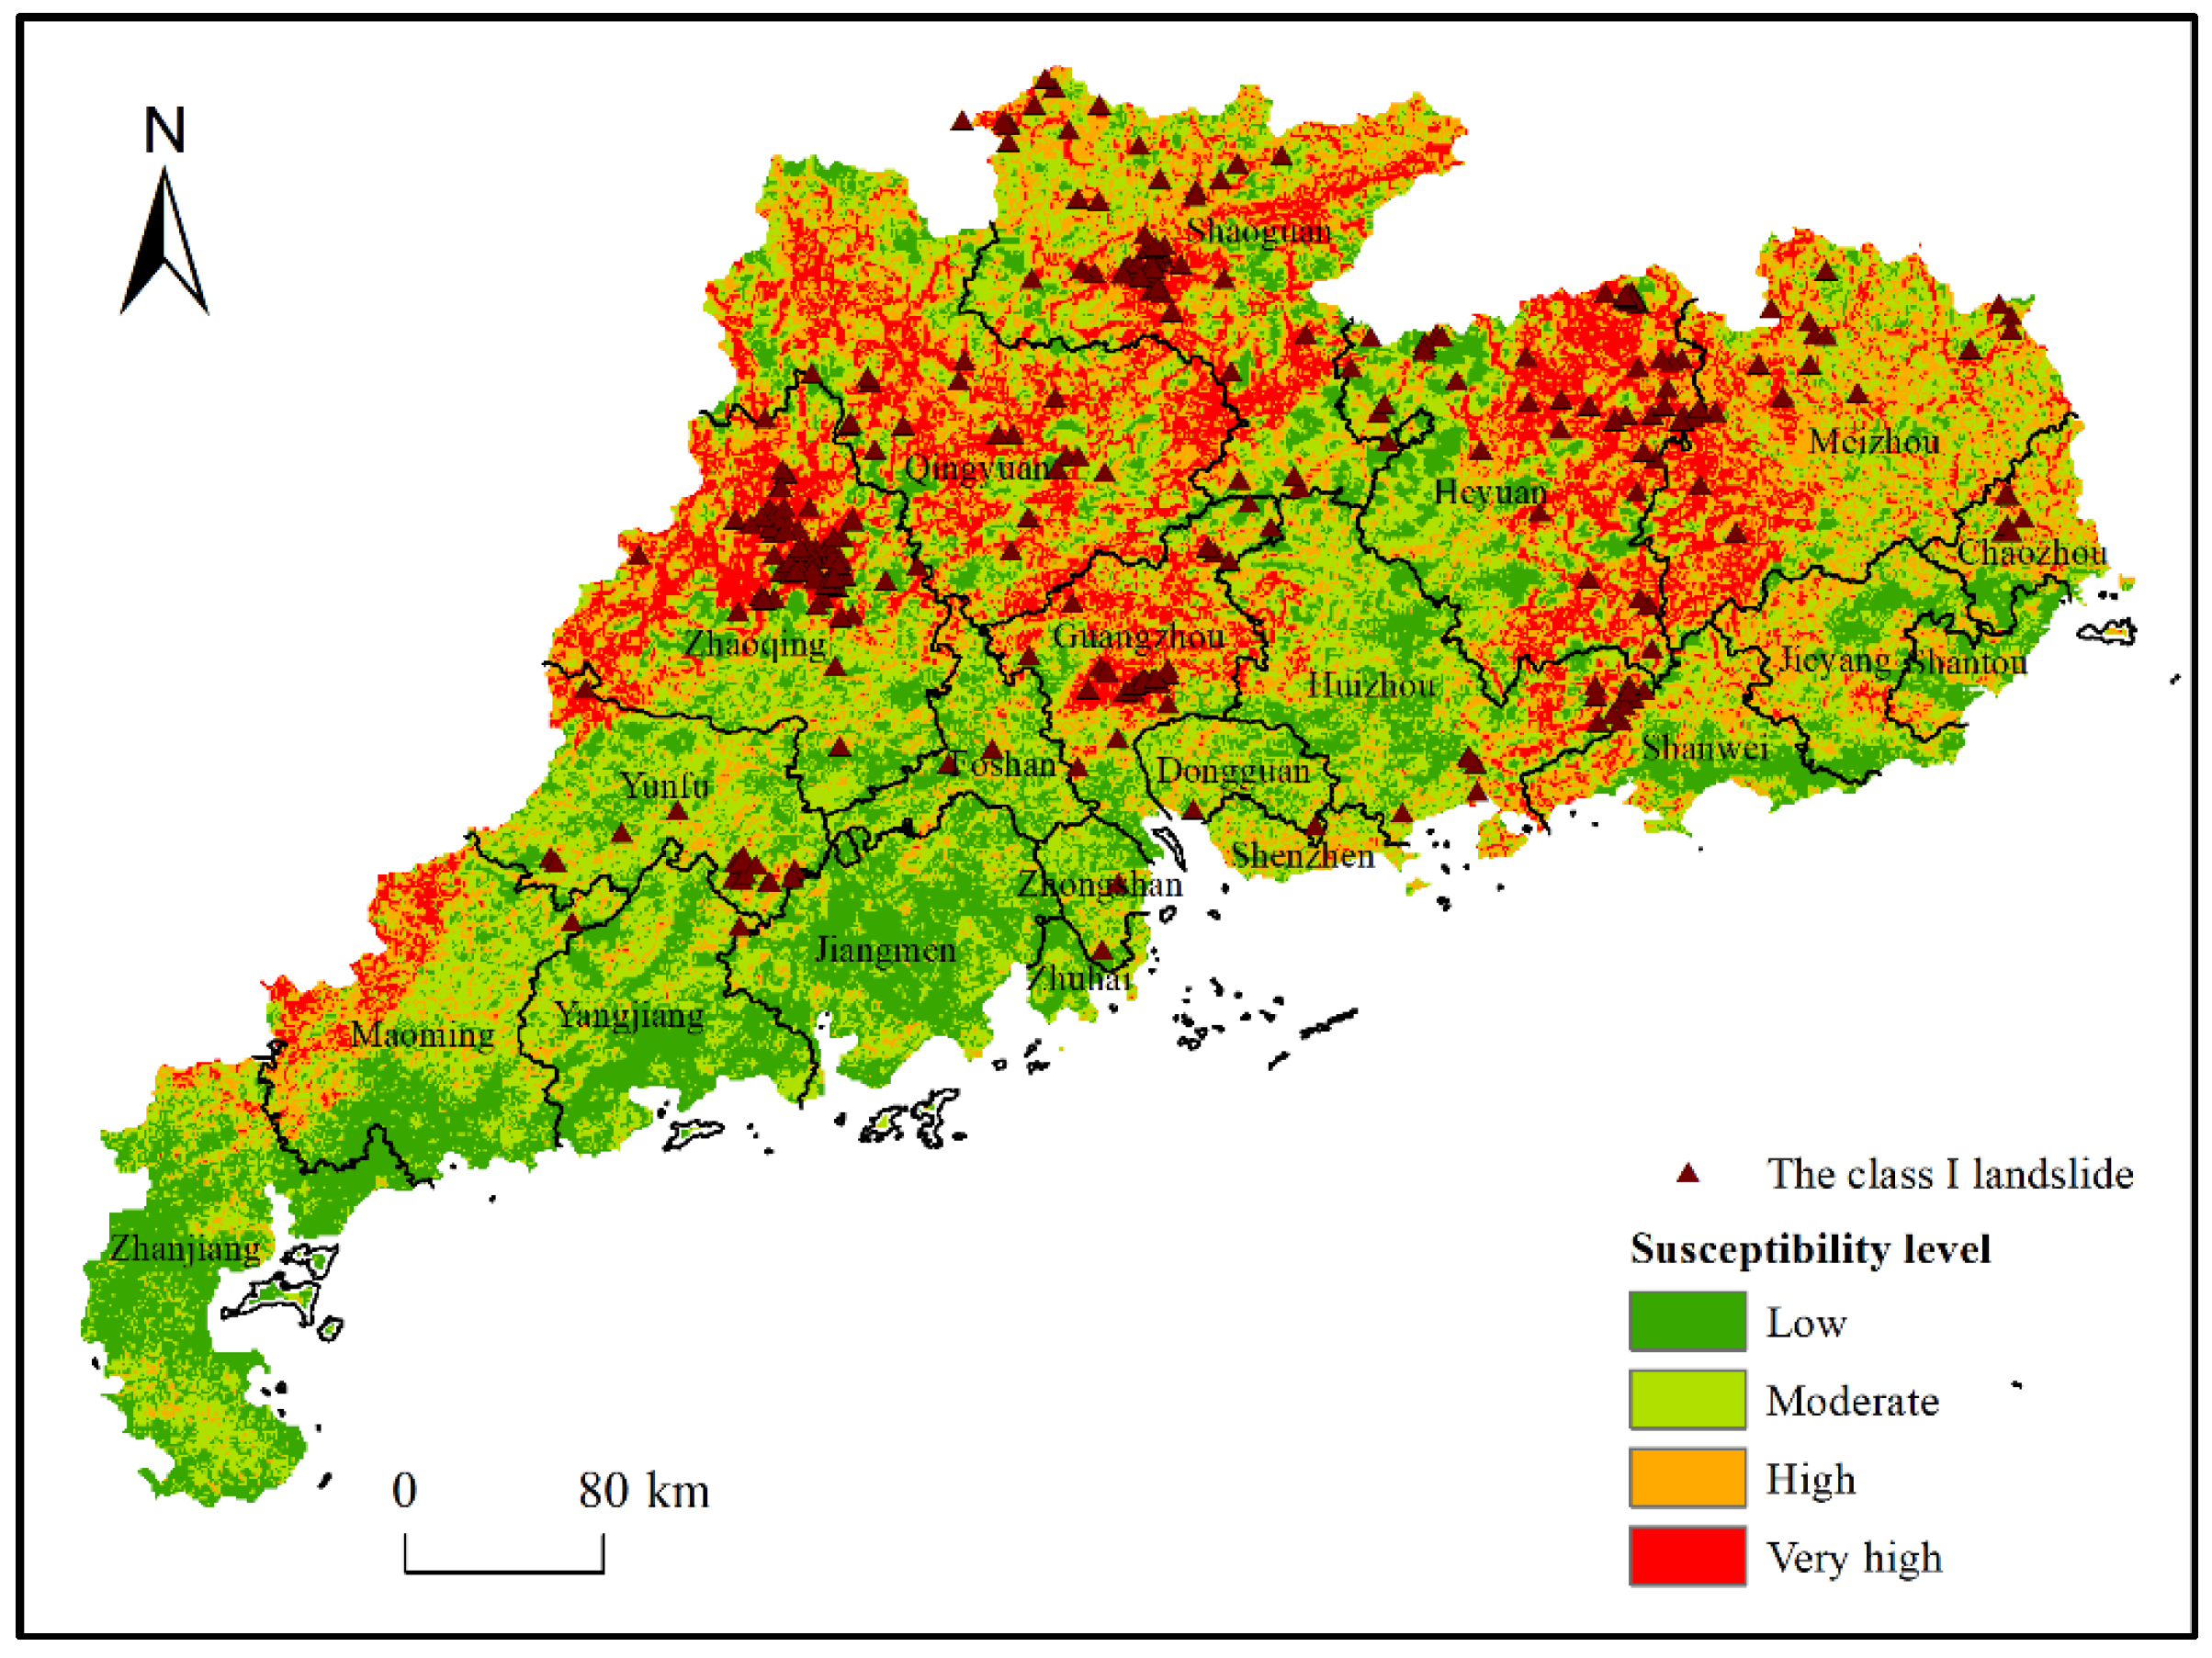
3.4.1. Distribution Pattern Analysis of Landslide Susceptibility at the Provincial Scale
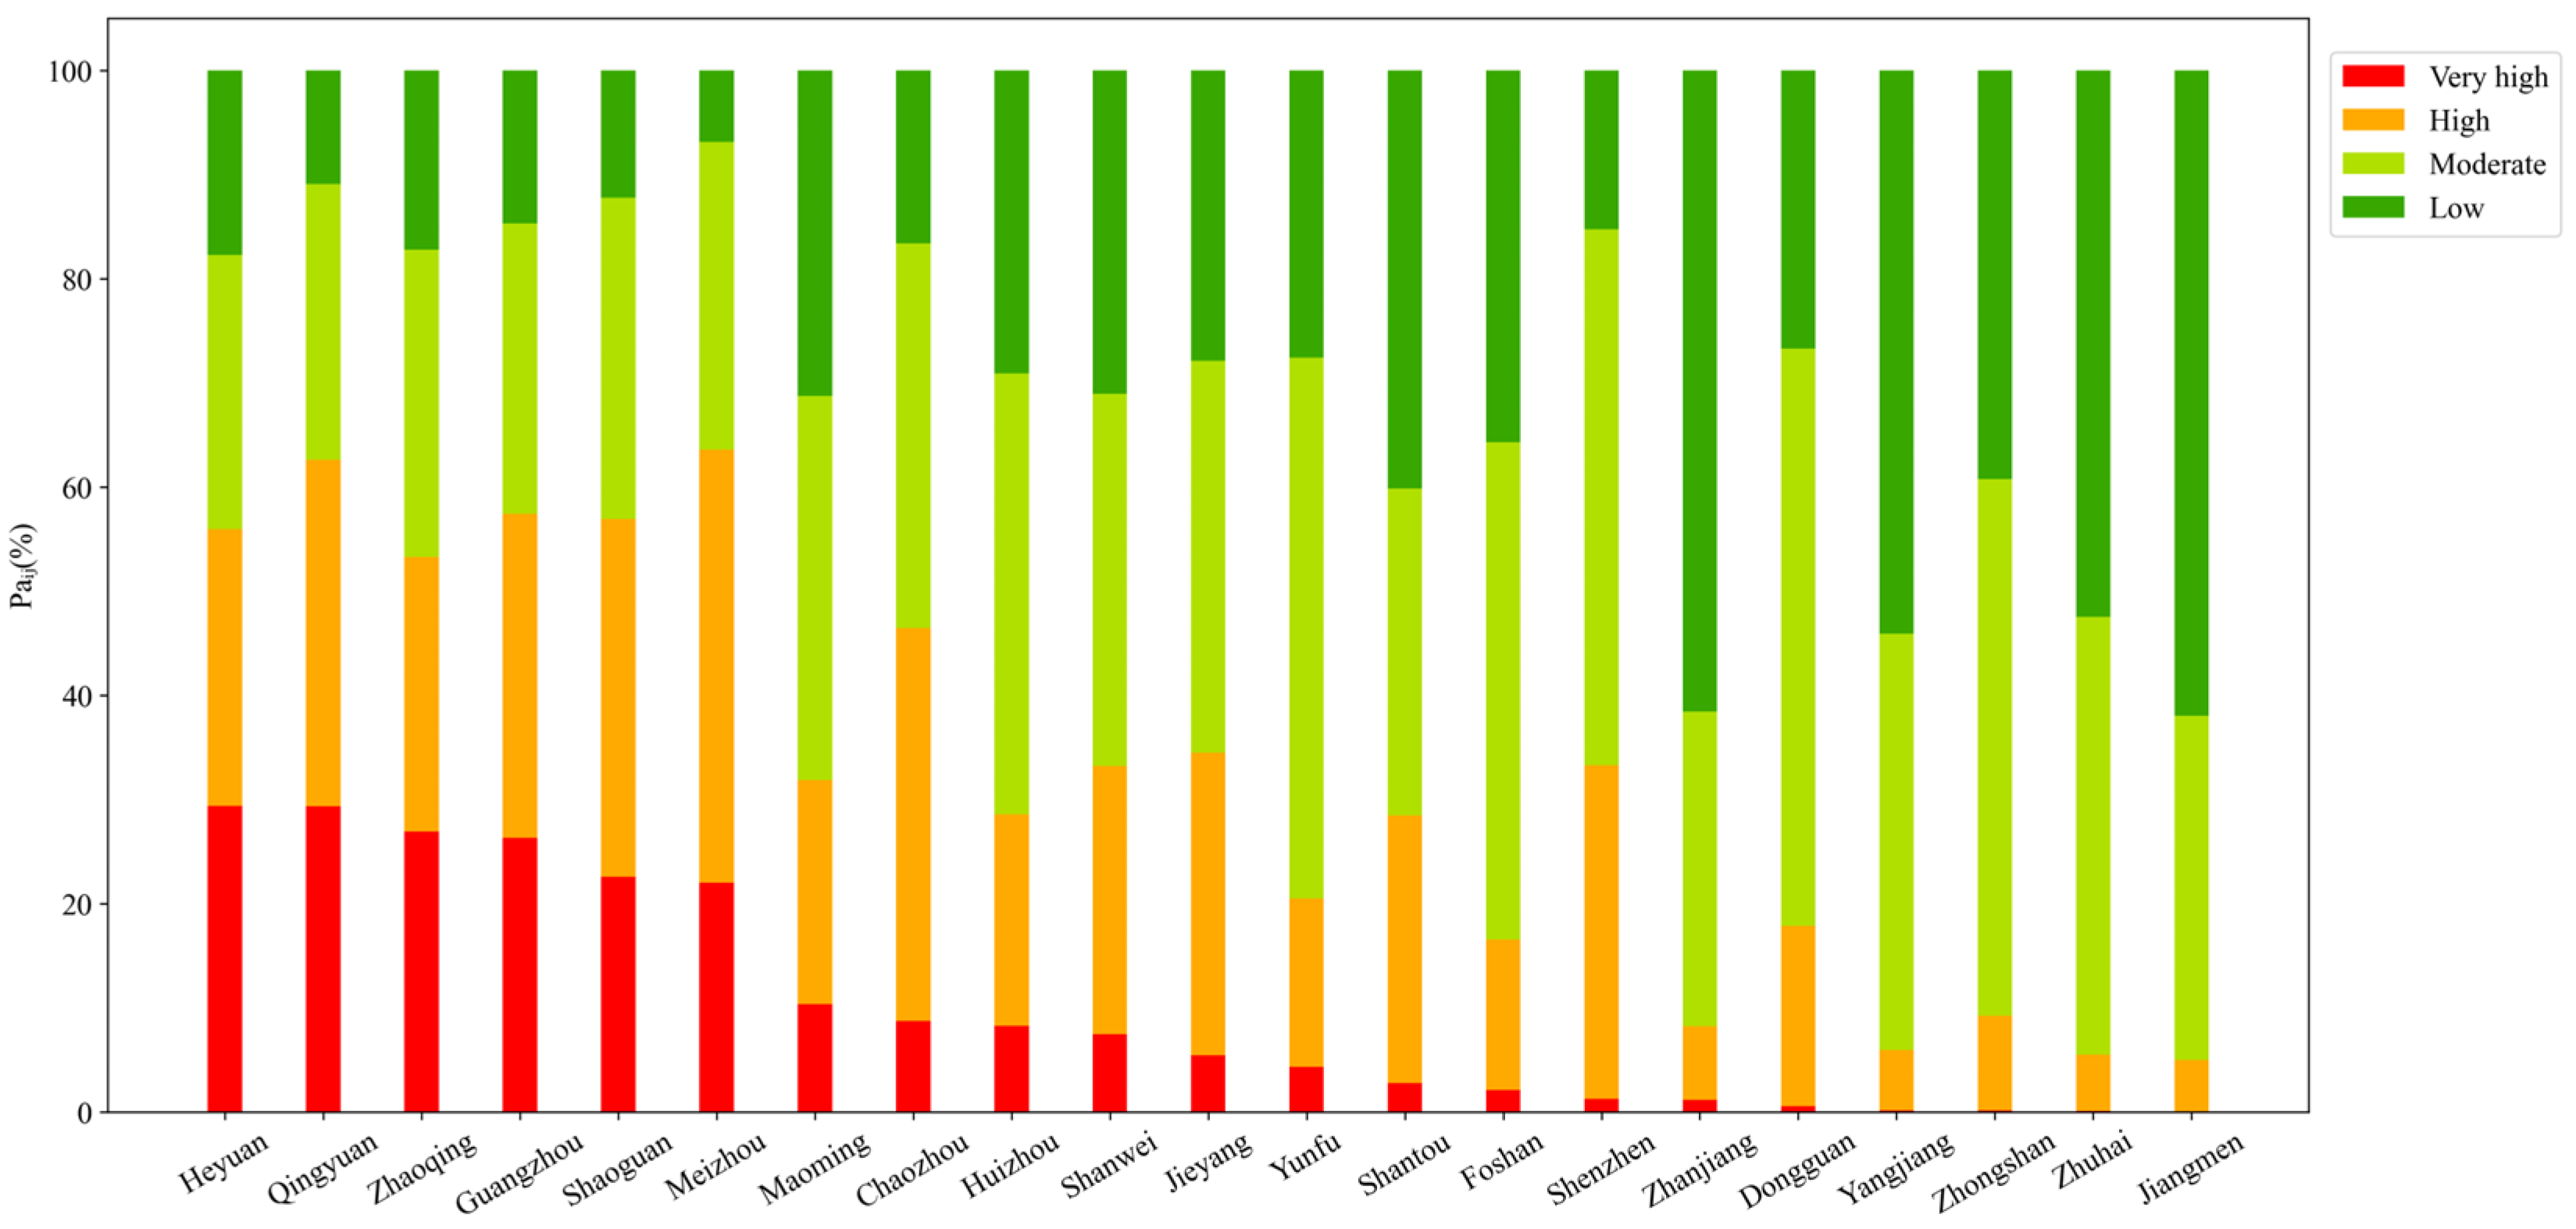
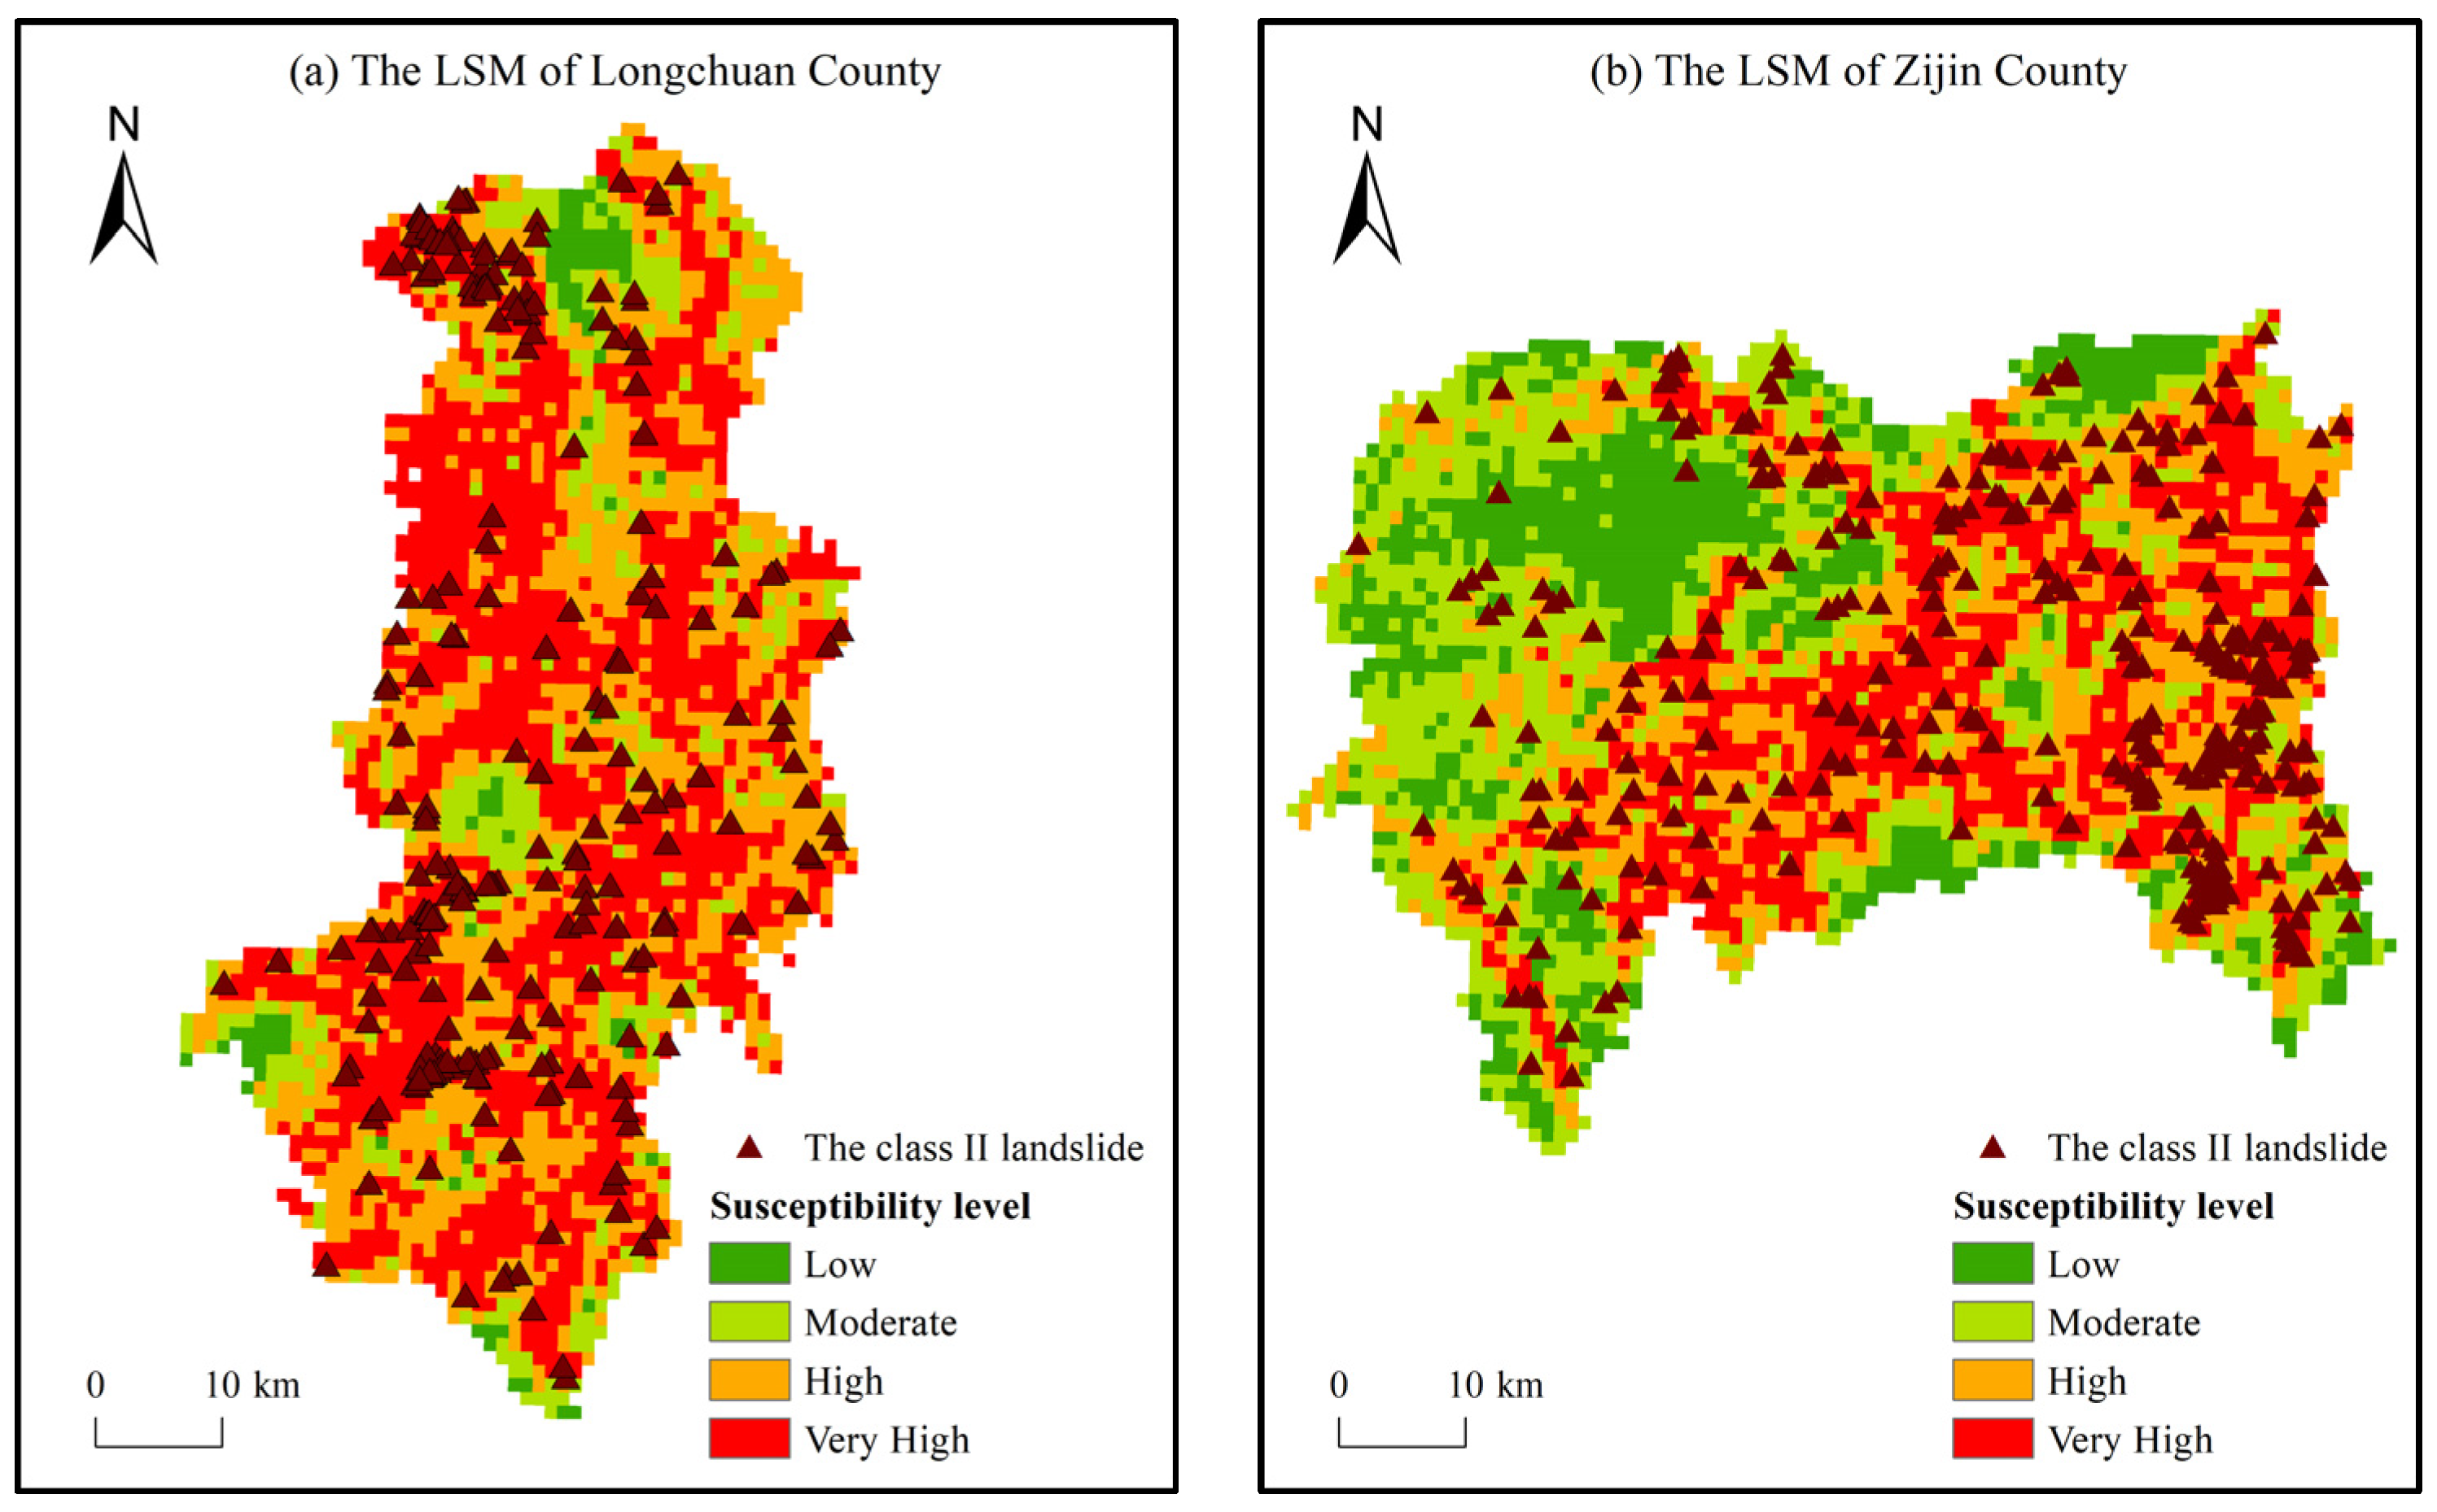
3.4.2. Distribution Pattern Analysis of Landslide Susceptibility at the City Scale
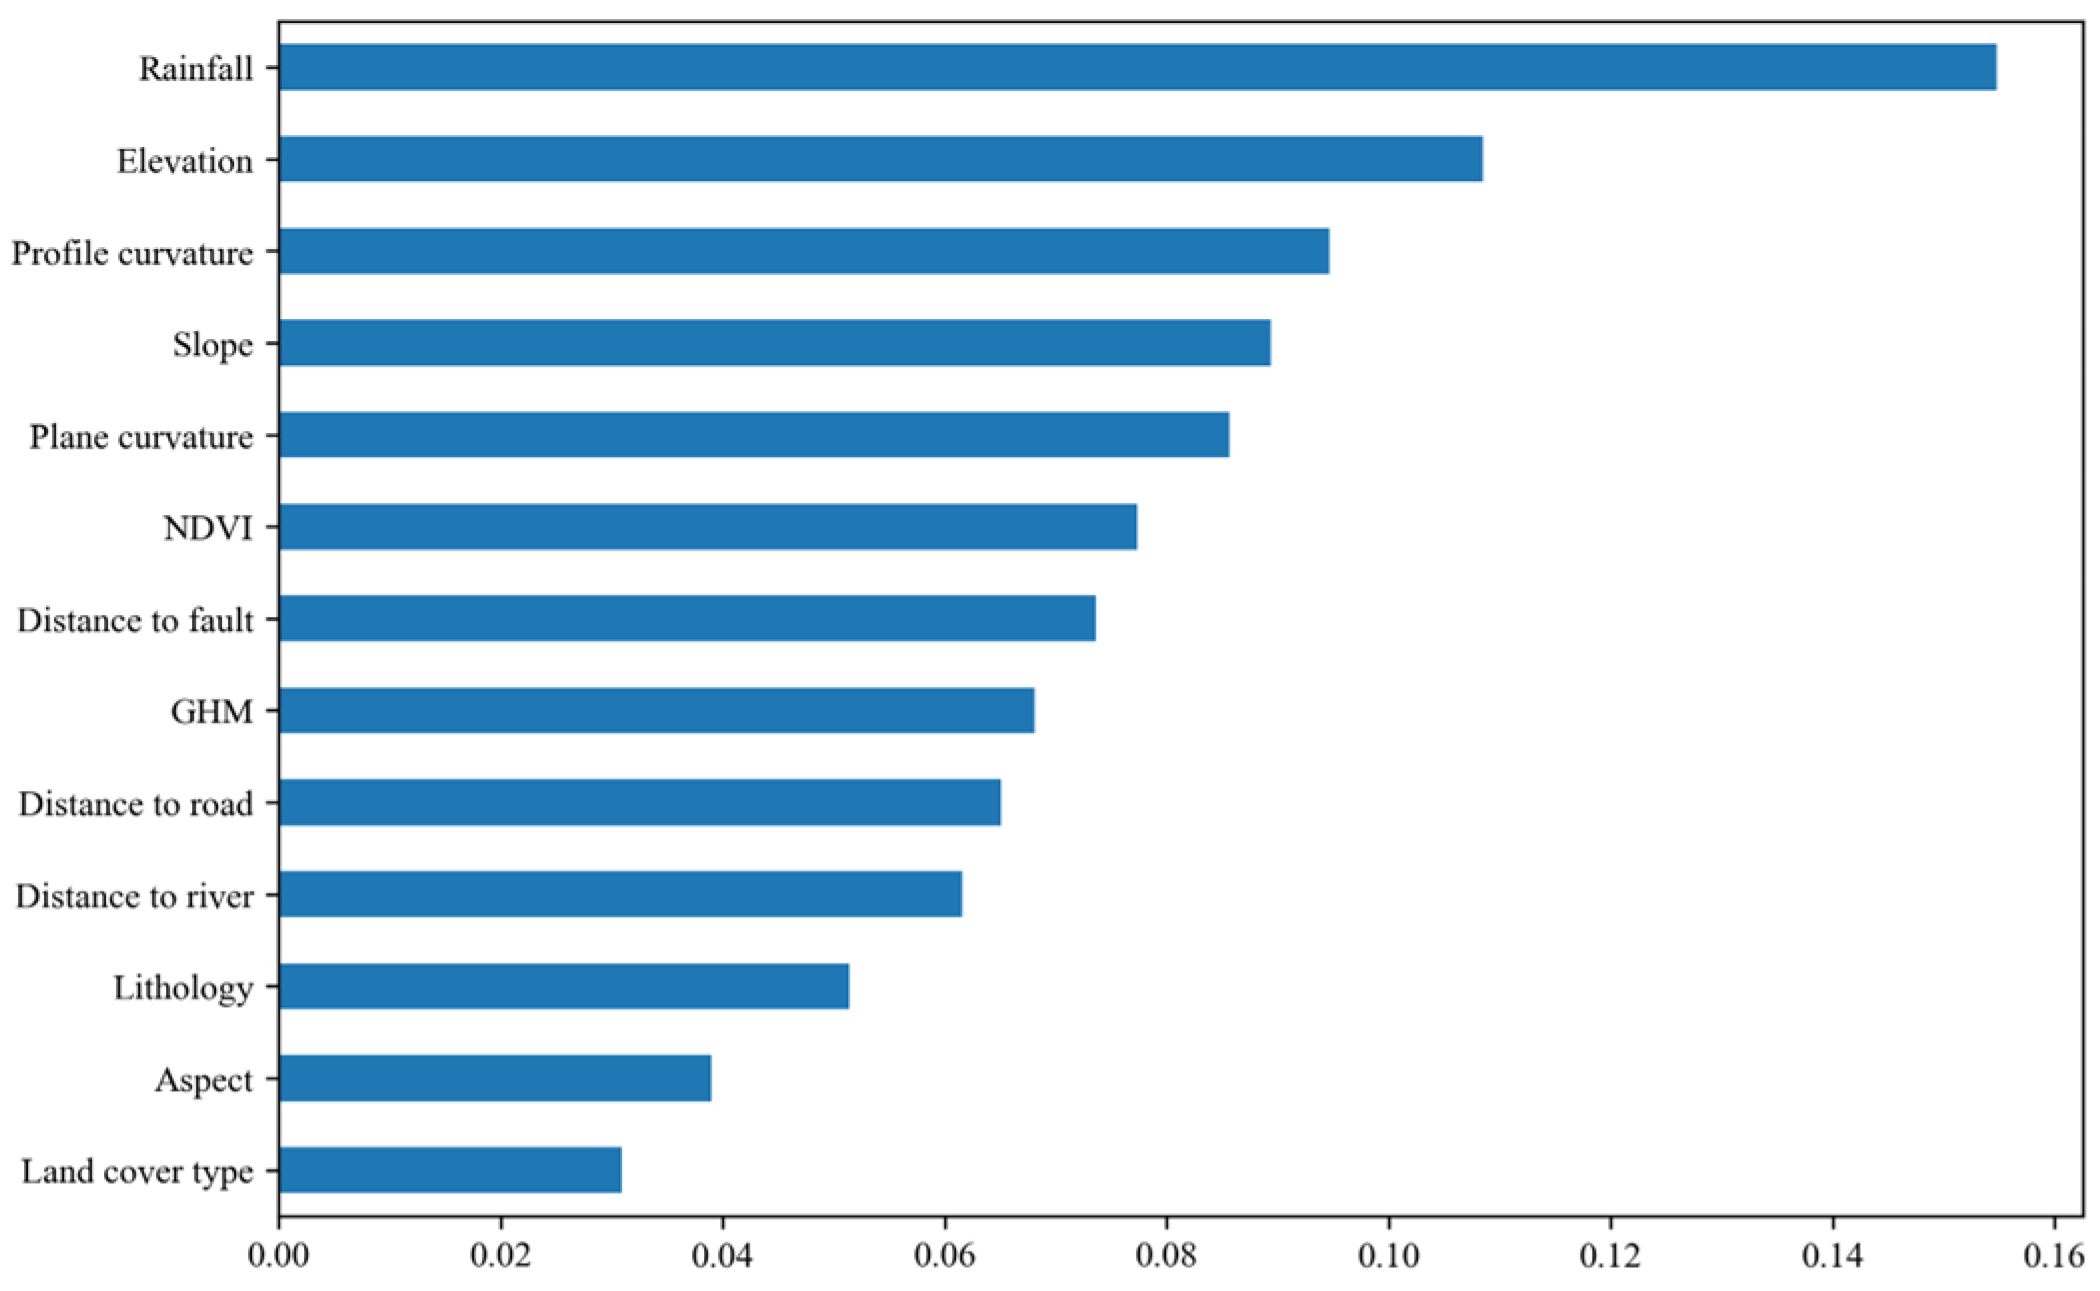
3.4.3. Analysis of Environmental Factor Importance
4. Discussion
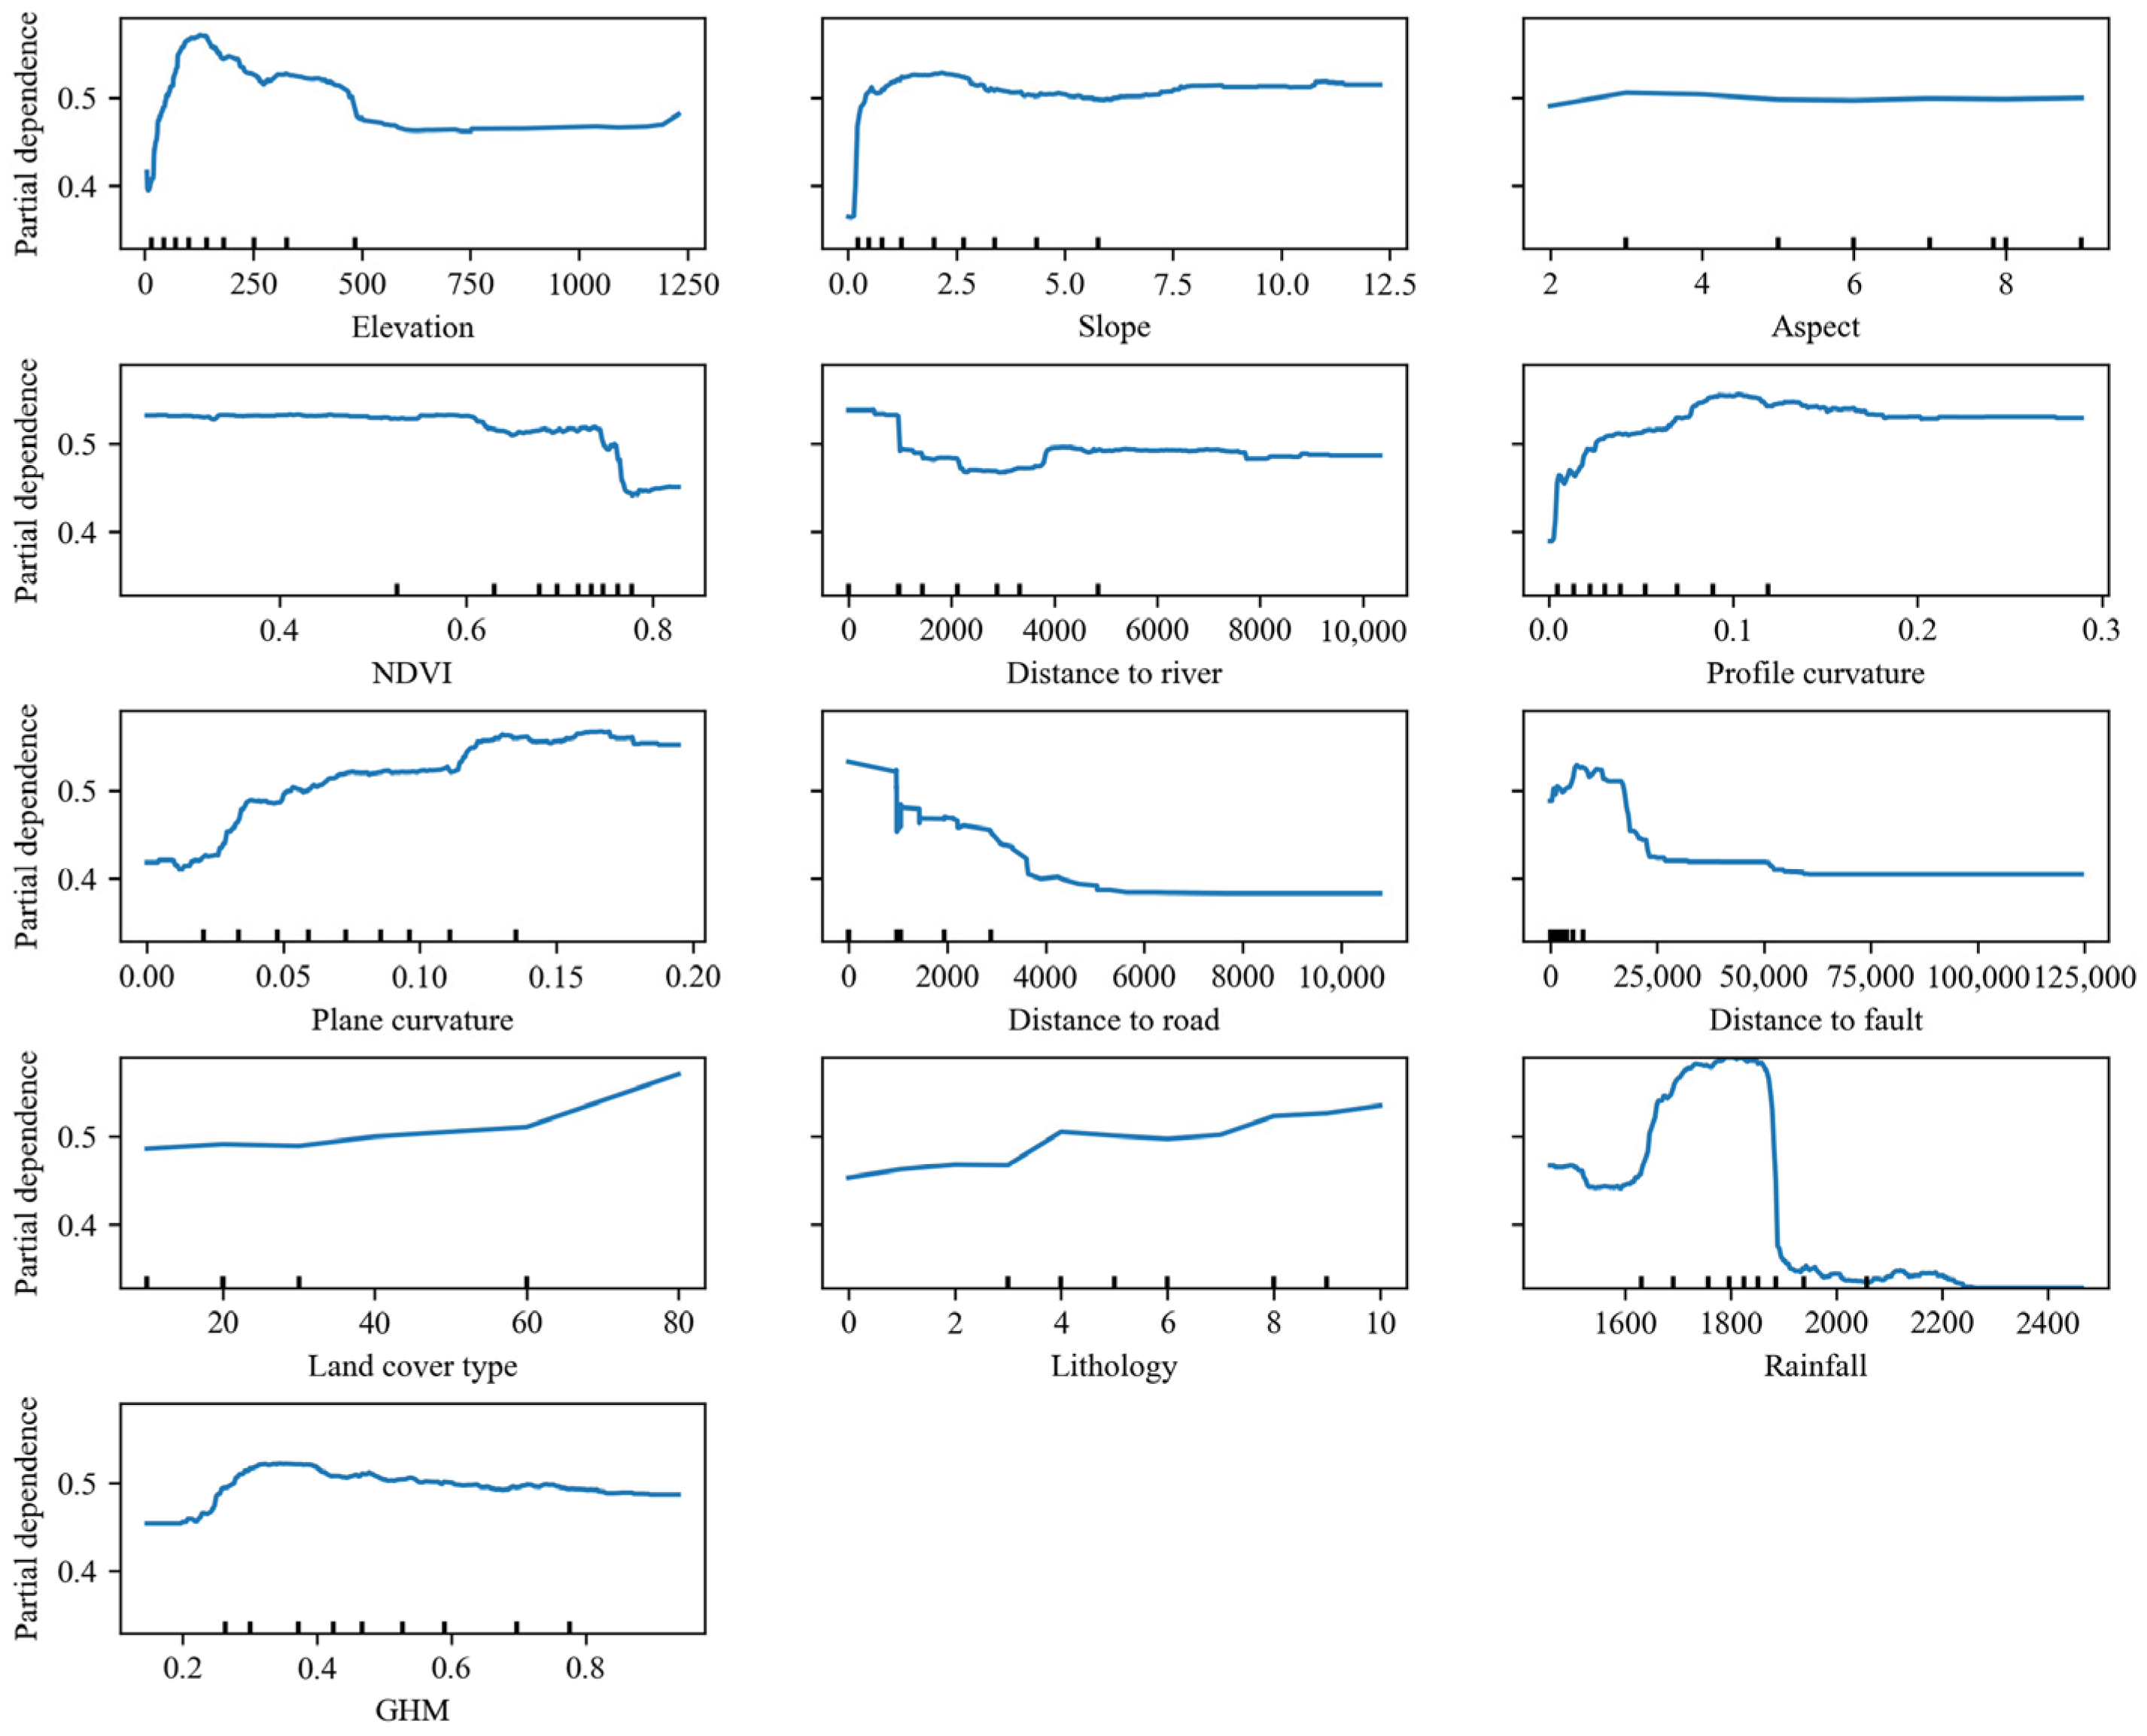
4.1. Impact of Rainfall and GHM on Landslide Susceptibility Mapping
4.2. Analysis of Landslide Environmental Factors in Guangdong Province
4.3. Model Evaluation for Multiple Types of Landslides
4.4. Importance of Sample Type and Balance
5. Conclusions
Author Contributions
Funding
Institutional Review Board Statement
Informed Consent Statement
Data Availability Statement
Acknowledgments
Conflicts of Interest
References
- Guzzetti, F.; Reichenbach, P.; Cardinali, M.; Galli, M.; Ardizzone, F. Probabilistic Landslide Hazard Assessment at the Basin Scale. Geomorphology 2005, 72, 272–299. [Google Scholar] [CrossRef]
- Lin, Q.; Wang, Y. Spatial and Temporal Analysis of a Fatal Landslide Inventory in China from 1950 to 2016. Landslides 2018, 15, 2357–2372. [Google Scholar] [CrossRef]
- Yang, J.; Cheng, C.; Song, C.; Shen, S.; Ning, L. Visual Analysis of the Evolution and Focus in Landslide Research Field. J. Mt. Sci. 2019, 16, 991–1004. [Google Scholar] [CrossRef]
- Zhang, F.; Peng, J.; Huang, X.; Lan, H. Hazard Assessment and Mitigation of Non-Seismically Fatal Landslides in China. Nat. Hazards 2021, 106, 785–804. [Google Scholar] [CrossRef]
- Yu, X. Study on the Landslide Susceptibility Evaluation Method Based on Multi-Source Data and Multi-Scale Analysis. Ph.D. Thesis, China University of Geosciences, Wuhan, China, 2016. [Google Scholar]
- Shi, P. The Natural Disasters, Constructions works for Disaster Reduction and Sustainable Development of China. J. Nat. Resour. 1995, 3, 267–275. [Google Scholar] [CrossRef]
- Alcantara-Ayala, I.; Sassa, K. Contribution of the International Consortium on Landslides to the Implementation of the Sendai Framework for Disaster Risk Reduction; Engraining to the Science and Technology Roadmap. Landslides 2021, 18, 21–29. [Google Scholar] [CrossRef]
- Wang, D.; Hao, M.; Chen, S.; Meng, Z.; Jiang, D.; Ding, F. Assessment of Landslide Susceptibility and Risk Factors in China. Nat. Hazards 2021, 108, 3045–3059. [Google Scholar] [CrossRef]
- Guzzetti, F.; Reichenbach, P.; Ardizzone, F.; Cardinali, M.; Galli, M. Estimating the Quality of Landslide Susceptibility Models. Geomorphology 2006, 81, 166–184. [Google Scholar] [CrossRef]
- Van Westen, C.J.; Castellanos, E.; Kuriakose, S.L. Spatial Data for Landslide Susceptibility, Hazard, and Vulnerability Assessment: An Overview. Eng. Geol. 2008, 102, 112–131. [Google Scholar] [CrossRef]
- Bui, D.T.; Tuan, T.A.; Klempe, H.; Pradhan, B.; Revhaug, I. Spatial Prediction Models for Shallow Landslide Hazards: A Comparative Assessment of the Efficacy of Support Vector Machines, Artificial Neural Networks, Kernel Logistic Regression, and Logistic Model Tree. Landslides 2015, 13, 361–378. [Google Scholar] [CrossRef]
- Ganguly, M.; Aynyas, R.; Nandan, A.; Mondal, P. Hazardous Area Map: An Approach of Sustainable Urban Planning and Industrial Development—A Review. Nat. Hazards 2018, 91, 1385–1405. [Google Scholar] [CrossRef]
- Zhou, J.; Tan, S.; Li, J.; Xu, J.; Wang, C.; Ye, H. Landslide Susceptibility Assessment Using the Analytic Hierarchy Process (AHP): A Case Study of a Construction Site for Photovoltaic Power Generation in Yunxian County, Southwest China. Sustainability 2023, 15, 5281. [Google Scholar] [CrossRef]
- Huang, F.; Cao, Z.; Jiang, S.; Zhou, C.; Huang, J.; Guo, Z. Landslide Susceptibility Prediction Based on a Semi-Supervised Multiple-Layer Perceptron Model. Landslides 2020, 17, 2919–2930. [Google Scholar] [CrossRef]
- Chang, Z.; Du, Z.; Zhang, F.; Huang, F.; Chen, J.; Li, W.; Guo, Z. Landslide Susceptibility Prediction Based on Remote Sensing Images and GIS: Comparisons of Supervised and Unsupervised Machine Learning Models. Remote Sens. 2020, 12, 502. [Google Scholar] [CrossRef] [Green Version]
- Wang, Y.; Feng, L.; Li, S.; Ren, F.; Du, Q. A Hybrid Model Considering Spatial Heterogeneity for Landslide Susceptibility Mapping in Zhejiang Province, China. Catena 2020, 188, 104425. [Google Scholar] [CrossRef]
- Ma, Y.; Li, H.; Wang, L.; Zhang, W.; Zhu, Z.; Yang, H.; Wang, L.; Yuan, X. Machine Learning Algorithms and Techniques for Landslide Susceptibility Investigation: A Literature Review. J. Civ. Environ. Eng. 2022, 44, 53–67. [Google Scholar] [CrossRef]
- Reichenbach, P.; Rossi, M.; Malamud, B.D.; Mihir, M.; Guzzetti, F. A Review of Statistically-Based Landslide Susceptibility Models. Earth-Sci. Rev. 2018, 180, 60–91. [Google Scholar] [CrossRef]
- Wang, Z.; Li, R.; Wang, X. Review of Researches on Regional Landslide Susceptibility Mapping Model. J. Yangtze River Sci. Res. Inst. 2012, 29, 78–85. [Google Scholar] [CrossRef]
- Pradhan, B.; Lee, S. Landslide Susceptibility Assessment and Factor Effect Analysis: Backpropagation Artificial Neural Networks and Their Comparison with Frequency Ratio and Bivariate Logistic Regression Modelling. Environ. Model. Softw. 2010, 25, 747–759. [Google Scholar] [CrossRef]
- Wang, L.; Guo, M.; Sawada, K.; Lin, J.; Zhang, J. A Comparative Study of Landslide Susceptibility Maps Using Logistic Regression, Frequency Ratio, Decision Tree, Weights of Evidence and Artificial Neural Network. Geosci. J. 2016, 20, 117–136. [Google Scholar] [CrossRef]
- Kim, J.C.; Lee, S.; Jung, H.S.; Lee, S. Landslide Susceptibility Mapping Using Random Forest and Boosted Tree Models in Pyeong-Chang, Korea. Geocarto Int. 2018, 33, 1000–1015. [Google Scholar] [CrossRef]
- Arabameri, A.; Pradhan, B.; Rezaei, K.; Lee, C.W. Assessment of Landslide Susceptibility Using Statistical- and Artificial Intelligence-Based FR–RF Integrated Model and Multiresolution DEMs. Remote Sens. 2019, 11, 999. [Google Scholar] [CrossRef] [Green Version]
- Sun, D.; Wen, H.; Wang, D.; Xu, J. A Random Forest Model of Landslide Susceptibility Mapping Based on Hyperparameter Optimization Using Bayes Algorithm. Geomorphology 2020, 362, 107201. [Google Scholar] [CrossRef]
- Rong, G.; Alu, S.; Li, K.; Su, Y.; Zhang, J.; Zhang, Y.; Li, T. Rainfall Induced Landslide Susceptibility Mapping Based on Bayesian Optimized Random Forest and Gradient Boosting Decision Tree Models—A Case Study of Shuicheng County, China. Water 2020, 12, 3066. [Google Scholar] [CrossRef]
- Wu, X.; Song, Y.; Chen, W.; Kang, G.; Qu, R.; Wang, Z.; Wang, J.; Lv, P.; Chen, H. Analysis of Geological Hazard Susceptibility of Landslides in Muli County Based on Random Forest Algorithm. Sustainability 2023, 15, 4328. [Google Scholar] [CrossRef]
- Akinci, H.; Kilicoglu, C.; Dogan, S. Random Forest-Based Landslide Susceptibility Mapping in Coastal Regions of Artvin, Turkey. ISPRS Int. J. Geo-Inf. 2020, 9, 553. [Google Scholar] [CrossRef]
- Huang, F.; Yao, C.; Liu, W.; Li, Y.; Liu, X. Landslide Susceptibility Assessment in the Nantian Area of China: A Comparison of Frequency Ratio Model and Support Vector Machine. Geomat. Nat. Hazards Risk 2018, 9, 919–938. [Google Scholar] [CrossRef] [Green Version]
- Zhao, S.; Zhao, Z. A Comparative Study of Landslide Susceptibility Mapping Using SVM and PSO-SVM Models Based on Grid and Slope Units. Math. Probl. Eng. 2021, 2021, 8854606. [Google Scholar] [CrossRef]
- Zare, M.; Pourghasemi, H.R.; Vafakhah, M.; Pradhan, B. Landslide Susceptibility Mapping at Vaz Watershed (Iran) Using an Artificial Neural Network Model: A Comparison between Multilayer Perceptron (MLP) and Radial Basic Function (RBF) Algorithms. Arab. J. Geosci. 2013, 6, 2873–2888. [Google Scholar] [CrossRef]
- Li, D.; Huang, F.; Yan, L.; Cao, Z.; Chen, J.; Ye, Z. Landslide Susceptibility Prediction Using Particle-Swarm-Optimized Multilayer Perceptron: Comparisons with Multilayer-Perceptron-Only, BP Neural Network, and Information Value Models. Appl. Sci. 2019, 9, 3664. [Google Scholar] [CrossRef] [Green Version]
- Zhu, L.; Huang, J. GIS-Based Logistic Regression Method for Landslide Susceptibility Mapping in Regional Scale. J. Zhejiang Univ. Sci. A 2006, 7, 2007–2017. [Google Scholar] [CrossRef]
- Drobnič, F.; Kos, A.; Pustišek, M. On the Interpretability of Machine Learning Models and Experimental Feature Selection in Case of Multicollinear Data. Electronics 2020, 9, 761. [Google Scholar] [CrossRef]
- Achour, Y.; Pourghasemi, H.R. How Do Machine Learning Techniques Help in Increasing Accuracy of Landslide Susceptibility Maps? Geosci. Front. 2020, 11, 871–883. [Google Scholar] [CrossRef]
- Fang, H.; Shao, Y.; Xie, C.; Tian, B.; Shen, C.; Zhu, Y.; Guo, Y.; Yang, Y.; Chen, G.; Zhang, M. A New Approach to Spatial Landslide Susceptibility Prediction in Karst Mining Areas Based on Explainable Artificial Intelligence. Sustainability 2023, 15, 3094. [Google Scholar] [CrossRef]
- Wu, C.-Y.; Lin, S.-Y. Performance Assessment of Event-Based Ensemble Landslide Susceptibility Models in Shihmen Watershed, Taiwan. Water 2022, 14, 717. [Google Scholar] [CrossRef]
- Zhang, W.; Li, H.; Li, Y.; Liu, H.; Chen, Y.; Ding, X. Application of Deep Learning Algorithms in Geotechnical Engineering: A Short Critical Review. Artif. Intell. Rev. 2021, 54, 5633–5673. [Google Scholar] [CrossRef]
- Wei, X.; Zhang, L.; Luo, J.; Liu, D. A Hybrid Framework Integrating Physical Model and Convolutional Neural Network for Regional Landslide Susceptibility Mapping. Nat. Hazards 2021, 109, 471–497. [Google Scholar] [CrossRef]
- Tan, C.; Sun, F.; Kong, T.; Zhang, W.; Yang, C.; Liu, C. A Survey on Deep Transfer Learning. IEEE Int. Conf. Neural Netw. 2018, 11141, 270–279. [Google Scholar] [CrossRef]
- Cruden, D.M.; Varnes, D.J. Landslide Types and Processes. Spec. Rep.-Natl. Res. Counc. Transp. Res. Board 1996, 247, 36–75. [Google Scholar] [CrossRef]
- Liu, L.; Li, S.; Li, X.; Jiang, Y.; Wei, W.; Wang, Z.; Bai, Y. An Integrated Approach for Landslide Susceptibility Mapping by Considering Spatial Correlation and Fractal Distribution of Clustered Landslide Data. Landslides 2019, 16, 715–728. [Google Scholar] [CrossRef]
- Li, J.; Wang, W.; Li, Y.; Han, Z.; Chen, G. Spatiotemporal Landslide Susceptibility Mapping Incorporating the Effects of Heavy Rainfall: A Case Study of the Heavy Rainfall in August 2021 in Kitakyushu, Fukuoka, Japan. Water 2021, 13, 3312. [Google Scholar] [CrossRef]
- Nourani, V.; Pradhan, B.; Ghaffari, H.; Sharifi, S.S. Landslide Susceptibility Mapping at Zonouz Plain, Iran Using Genetic Programming and Comparison with Frequency Ratio, Logistic Regression, and Artificial Neural Network Models. Nat. Hazards 2014, 71, 523–547. [Google Scholar] [CrossRef]
- Zhao, J.; Zhang, Q.; Wang, D.; Wu, W.; Yuan, R. Machine Learning-Based Evaluation of Susceptibility to Geological Hazards in the Hengduan Mountains Region, China. Int. J. Disaster Risk Sci. 2022, 13, 305–316. [Google Scholar] [CrossRef]
- Feng, W.; Bai, H.; Lan, B.; Wu, Y.; Wu, Z.; Yan, L.; Ma, X. Spatial–Temporal Distribution and Failure Mechanism of Group-Occurring Landslides in Mibei Village, Longchuan County, Guangdong, China. Landslides 2022, 19, 1957–1970. [Google Scholar] [CrossRef]
- Van Den Eeckhaut, M.; Poesen, J.; Vandekerckhove, L.; Van Gils, M.; Van Rompaey, A. Human-Environment Interactions in Residential Areas Susceptible to Landsliding: The Flemish Ardennes Case Study. Area 2010, 42, 339–358. [Google Scholar] [CrossRef]
- Li, Y.; Wang, X.; Mao, H. Influence of Human Activity on Landslide Susceptibility Development in the Three Gorges Area. Nat. Hazards 2020, 104, 2115–2151. [Google Scholar] [CrossRef]
- Mwakapesa, D.S.; Mao, Y.; Lan, X.; Nanehkaran, Y.A. Landslide Susceptibility Mapping Using DIvisive ANAlysis (DIANA) and RObust Clustering Using LinKs (ROCK) Algorithms, and Comparison of Their Performance. Sustainability 2023, 15, 4218. [Google Scholar] [CrossRef]
- Rabby, Y.W.; Li, Y. Landslide Susceptibility Mapping Using Integrated Methods: A Case Study in the Chittagong Hilly Areas, Bangladesh. Geosciences 2020, 10, 483. [Google Scholar] [CrossRef]
- Wubalem, A.; Meten, M. Landslide Susceptibility Mapping Using Information Value and Logistic Regression Models in Goncha Siso Eneses Area, Northwestern Ethiopia. SN Appl. Sci. 2020, 2, 807. [Google Scholar] [CrossRef] [Green Version]
- Ma, S.; Shao, X.; Xu, C. Characterizing the Distribution Pattern and a Physically Based Susceptibility Assessment of Shallow Landslides Triggered by the 2019 Heavy Rainfall Event in Longchuan County, Guangdong Province, China. Remote Sens. 2022, 14, 4257. [Google Scholar] [CrossRef]
- Lin, B.; Yang, S.; Zhu, B.; Wu, H. Geological Structure and Basic Geotechnical Characteristics in Guangdong Province. Chin. J. Rock Mech. Eng. 2006, 25, 3337–3346. [Google Scholar] [CrossRef]
- Peng, S.; Ding, Y.; Liu, W.; Li, Z. 1 Km Monthly Temperature and Precipitation Dataset for China from 1901 to 2017. Earth Syst. Sci. Data 2019, 11, 1931–1946. [Google Scholar] [CrossRef] [Green Version]
- Kennedy, C.M.; Oakleaf, J.R.; Theobald, D.M.; Baruch Mordo, S.; Kiesecker, J. Managing the Middle: A Shift in Conservation Priorities Based on the Global Human Modification Gradient. Glob. Change Biol. 2019, 25, 811–826. [Google Scholar] [CrossRef]
- Tang, X.; Li, S.; Li, T.; Gao, Y.; Zhang, S.; Chen, Q.; Zhang, X. Review on global digital elevation products. Natl. Remote Sens. Bull. 2021, 25, 167–181. [Google Scholar] [CrossRef]
- Gnyawali, K.; Dahal, K.; Talchabhadel, R.; Nirandjan, S. Framework for Rainfall-Triggered Landslide-Prone Critical Infrastructure Zonation. Sci. Total Environ. 2023, 872, 162242. [Google Scholar] [CrossRef]
- Davis, J.; Goadrich, M. The Relationship Between Precision-Recall and ROC Curves. In Proceedings of the 23rd International Conference on Machine Learning–ICML ’06, Pittsburgh, PA, USA, 25–29 June 2006; Volume 148, pp. 233–240. [Google Scholar] [CrossRef] [Green Version]
- Swets, J. Measuring the accuracy of diagnostic systems. Science 1988, 240, 1285–1293. [Google Scholar] [CrossRef] [Green Version]
- Mai, J.; Xian, Y.; Liu, G. Predicting potential rainfall-triggered landslides sites in Guangdong Province (China) using MaxEnt model under climate changes scenarios. J. Geo Inf. Sci. 2021, 23, 2042–2054. [Google Scholar] [CrossRef]
- Yang, S.R. Assessment of Rainfall-Induced Landslide Susceptibility Using GIS-Based Slope Unit Approach. J. Perform. Constr. Facil. 2017, 31, 8. [Google Scholar] [CrossRef]
- Yang, S.R. Probability of Road Interruption Due to Landslides under Different Rainfall-Return Periods Using Remote Sensing Techniques. J. Perform. Constr. Facil. 2016, 30, C4015002. [Google Scholar] [CrossRef]
- Shi, H.; Yang, N.; Yang, X.; Tang, H. Clarifying Relationship between PM2.5 Concentrations and Spatiotemporal Predictors Using Multi-Way Partial Dependence Plots. Remote Sens. 2023, 15, 358. [Google Scholar] [CrossRef]


| Factor | VIF Value | Factor | VIF Value | Factor | VIF Value |
|---|---|---|---|---|---|
| Elevation | 2.4 | NDVI | 2.69 | Land cover type | 1.53 |
| Slope | 2.21 | Distance to river | 1.26 | Rainfall | 1.04 |
| Aspect | 1 | Distance to road | 1.52 | GHM | 2.69 |
| Profile curvature | 1.53 | Distance to fault | 1.09 | ||
| Plane curvature | 1.04 | Lithology | 1.14 |
| Hyperparameter | Explanation | Value |
|---|---|---|
| n_estimators | The number of decision trees. | 200 |
| criterion | The sample segmentation criteria. | gini |
| max_depth | The maximum depth of decision trees. | None |
| min_samples_split | the minimum number of samples required to split an internal node. | 2 |
| min_samples_leaf | the minimum number of samples required to be at a leaf node. | 1 |
| Susceptibility Level | Low | Moderate | High | Very High |
|---|---|---|---|---|
| (%) * | 0.6 | 0.9 | 6.56 | 91.94 |
| Model Category | Optimal Model | Without GHM | Without Rainfall | Without Rainfall and GHM |
|---|---|---|---|---|
| AUC value | 0.9145 | 0.8991 | 0.8917 | 0.8808 |
| Susceptibility Level | Longchuan County | Zijin County |
|---|---|---|
| Low | 0% | 1.11% |
| Moderate | 2.33% | 10.25% |
| High | 25.79% | 37.31% |
| Very high | 71.88% | 51.33% |
Disclaimer/Publisher’s Note: The statements, opinions and data contained in all publications are solely those of the individual author(s) and contributor(s) and not of MDPI and/or the editor(s). MDPI and/or the editor(s) disclaim responsibility for any injury to people or property resulting from any ideas, methods, instructions or products referred to in the content. |
© 2023 by the authors. Licensee MDPI, Basel, Switzerland. This article is an open access article distributed under the terms and conditions of the Creative Commons Attribution (CC BY) license (https://creativecommons.org/licenses/by/4.0/).
Share and Cite
Zhuo, L.; Huang, Y.; Zheng, J.; Cao, J.; Guo, D. Landslide Susceptibility Mapping in Guangdong Province, China, Using Random Forest Model and Considering Sample Type and Balance. Sustainability 2023, 15, 9024. https://doi.org/10.3390/su15119024
Zhuo L, Huang Y, Zheng J, Cao J, Guo D. Landslide Susceptibility Mapping in Guangdong Province, China, Using Random Forest Model and Considering Sample Type and Balance. Sustainability. 2023; 15(11):9024. https://doi.org/10.3390/su15119024
Chicago/Turabian StyleZhuo, Li, Yupu Huang, Jing Zheng, Jingjing Cao, and Donghu Guo. 2023. "Landslide Susceptibility Mapping in Guangdong Province, China, Using Random Forest Model and Considering Sample Type and Balance" Sustainability 15, no. 11: 9024. https://doi.org/10.3390/su15119024