Article

Can New Urbanization Construction Improve Ecological Welfare Performance in the Yangtze River Economic Belt?

1
School of Finance and Economics, Jiangsu University, Zhenjiang 212013, China
2
Industrial Economics Research Institute, Jiangsu University, Zhenjiang 212013, China
*
Author to whom correspondence should be addressed.
Sustainability 2023, 15(11), 8758; https://doi.org/10.3390/su15118758
Submission received: 11 April 2023 / Revised: 15 May 2023 / Accepted: 25 May 2023 / Published: 29 May 2023
(This article belongs to the Special Issue The Interactions between Urban Populations and Their Environments)

Abstract

:
New urbanization construction can effectively improve resource allocation efficiency and promote high-quality development, so there is practical significance to exploring the relationship between new urbanization construction and ecological welfare performance in order to achieve a win-win situation of ecological environmental protection and high-quality development in the Yangtze River Economic Belt. This paper innovatively, from the perspective of input-output, constructs a framework for analyzing the ecological welfare performance, measures the ecological welfare performance of Yangtze River Economic Belt with SE-SBM model, and empirically analyzes the impact of new urbanization on ecological welfare performance using the fixed-effect model. The results showed that: (1). the ecological welfare performance of the Yangtze River Economic Belt showed a U-shaped trend of decreasing and then increasing as a whole. There were significant regional differences in the east, middle, and west of the Yangtze River Economic Belt, especially in the eastern region, a region that has shown an obvious growth trend. (2). Population and land urbanization had a significant negative inhibitory effect on improving ecological welfare performance. On the contrary, economic urbanization and social urbanization had significant positive effects on improving ecological welfare performance. (3). Adopting and implementing policies such as the National New Urbanization Plan (2021–2035) encouraged the co-development of new urbanization and ecological civilizations, promoting new urbanization construction and playing a beneficial role in transforming ecological welfare. So, the Yangtze River Economic Belt should promote a new type of urbanization going forward, promoting green transformation and the upgrading of industries, standardizing the utilization of land resources, improving the well-being of urban residents, and effectively governing urban environmental pollution.

1. Introduction

The Yangtze River Economic Belt, which spans three significant regions from east to west China, is a primary strategy for the country’s overall development. As a national regional development strategy, the Yangtze River Economic Belt covers a wider range of provinces, cities, and regions, and its population and GDP both exceed 40% of the national total. In general, it plays a very important role in promoting the development of the Yangtze River Economic Belt not only for the country’s economic development but also for people’s living standards. However, rapid economic development is followed by severe environmental pollution and excessive consumption of resources [1]. The Annual Report on the Development of Yangtze River Economic Belt (2019–2020) points out that because some enterprises ignored the water environment of the Yangtze River, causing serious problems of direct and stolen sewage discharge as well as deteriorating water quality in the process of development, many pollutants from some watersheds in the Yangtze River Economic Belt account for more than 40% of the total national emissions. This includes significant pollutants exceeding the standard, local severe water environment pollution, excessive pollutants in near-shore waters, and severe regional soil pollution that is also caused by random dumping of industrial solid waste.
Daly, a famous ecological economist, proposed that the economic system is only a subsystem of the natural ecosystem and that economic development must be ecologically sustainable and bearable [2]. Costanza and other scholars believe that economic growth plays an intermediary role in enhancing the sustainable well-being of human society. At the same time, the ecological system is the material basis and guarantee of a good quality of life for human beings [3]. The study area is shown in Figure 1a, and the specific study area is mapped in Figure 1b below.
Since 16 March 2014, when the CPC Central Committee and The State Council jointly issued a National Plan for New Urbanization, the center of national urbanization has shifted from land to people [4]. The goal of the plan is to form a strategic pattern of new-type urbanization, to enhance the capacity of urban clusters to carry the population and the economy, and to protect the ecological environment. For the Yangtze River Economic Belt, a key region in China, it is more than necessary to orderly de-stress non-core urban functions, to constantly enhance the vitality of urban development, and to promote the process of new urbanization. New urbanization is not just a simple increase in the proportion of the urban population and expansion of scale; it also emphasizes ecological civilization and the quality of urbanization, highlights the requirements of green, low-carbon, and intensive energy saving, and steadily promotes primary urban medical and health care services as well as other public services in order that they cover the entire resident population [5]. The new urbanization is transforming ecological environment construction from end-of-pipe treatment to the ecological civilization construction of “pollution prevention and control-clean production-ecological industry-ecological infrastructure-ecological community.” Therefore, new urbanization is different from traditional urbanization. It can bring obvious ecological dividends and act as a stimulus to the ecological management of the Yangtze River Economic Belt. At the same time, it has extremely important strategic significance for realizing the coordinated development of the region, narrowing the gap between urban and rural areas in the Yangtze River Economic Belt, and building harmonious coexistence between people and society. Ecological welfare performance (EWP), as a quantitative indicator reflecting the relative change trend of social welfare and ecological resource consumption [6], can quantify the relative health of economic growth in the context of new urbanization. Therefore, examining the impact of new urbanization construction on the ecological welfare performance of the Yangtze River economic belt can improve the role of new urbanization construction on the ecological environment. This paper measures the ecological welfare performance of the Yangtze River Economic Belt through SE-SBM model, empirically analyzes the impact of new urbanization on ecological welfare performance, and puts forward reasonable suggestions for improving the ecological welfare performance and coordinate high-quality economy development and ecological environmental protection. Compared with previous studies, this study will focus on the social welfare level and residents’ happiness that are caused by ecological welfare performance, and it will add dimensions such as education and health into the measurement. In addition, different aspects of new urbanization will be considered to explore ecological welfare performance, including population urbanization, economic urbanization, land urbanization, and social urbanization for the people-centered green urbanization. This study is clearly different and innovative, with a strong practical significance, and with a strong practical value for the Yangtze River Economic Belt construction.

2. Literature Review

Ecological welfare performance is a quantitative index reflecting the degree of decoupling between social welfare and ecological resource consumption by establishing a ratio between the value of welfare enhancement and ecological resource consumption, and it is the product of closely integrating the ecological environment and social welfare [6]. As an important indicator to measure the degree of sustainable development and ecological dividend of a country or an economic belt, scholars at home and abroad have gradually enriched the research on ecological welfare performance [7]. Daly first introduced the concept of ecological welfare performance to assess the sustainability of an economy, expressing it as the ratio of services to throughput. However, Daly did not give a quantitative indicator to express this concept, so the concept has yet to be widely used. Over time, Rees proposed the concept of “ecological occupancy,” which advocates the use of land and water area in order to estimate the amount of nature that is used by humans to maintain their survival, and the study of ecological welfare performance was thereby developed. There are two main aspects of research on ecological welfare performance: (1). constructing ecological welfare performance measurement methods and indicators, and (2). analyzing factors affecting ecological welfare performance. For example, some scholars measured the ecological welfare performance of some key watersheds or typical cities using the stochastic frontier analysis and data envelopment analysis method [8,9]. The second is the analysis of factors influencing ecological welfare performance. Since Boyd and Banzhaf advocated using consistently defined units of account to measure ecological well-being, more and more scholars have begun to study the problem of ecological welfare performance measurement [10]. Cui et al. used the two-stage Super-NSBM model, MLD index model, and PECM model to measure and compare ecological welfare performance, and proposed that the internal differences in ecological welfare performance among the three major structures system of urban agglomerations of Beijing-Tianjin-Hebei, the Yangtze River Delta, and the Pearl River Delta are different [11]. They used the life expectancy ratio at birth to the ecological footprint per capita to express ecological welfare performance, which has a vital objective. Common has used the ratio of satisfaction output to environmental input as an indicator [12]. DiMaria considered new indicators for assessing national sustainability through ecological footprints, using nonparametric techniques to measure production efficiency [13]. Ng proposed to use the ratio of national average happy life years (HLY) to the ecological footprint per capita to express the ecological welfare level of a region [14]. Jorgenson utilized a ratio construction using anthropogenic carbon emissions per unit of human well-being [15]. In addition to the ratio method, data envelopment analysis has also been used to measure ecological welfare performance. For example, Long et al. used the DEA method to conduct a multidimensional analysis of the level of sustainable development in Shanghai from 1999 to 2012 [16]. Fang et al. measured ecological welfare performance based on the super-efficient DEA method [17], equivalent to an extension of the study based on Long et al. There are more approaches, such as Knight et al., which proposed to construct an ecological footprint regression equation and use the unstandardized residuals of the regression equation results to indicate ecological welfare performance [18]. Dietz et al. use a stochastic preamble production function model to measure ecological welfare performance [19]. Some scholars have further explored the relationship between economic growth and ecological welfare performance by initially addressing the issue of economic growth and ecological resource consumption. However, a consensus conclusion has yet to be reached [10]. The empirical study by Dietz et al., using panel data from 58 countries, shows the relationship between the environmental intensity of human well-being (EIWB) and economic growth is an inverted U-curve, as opposed to the environmental Kuznets curve (EKC) [20]. However, Zhu et al. [21], Fang et al. [17], and Chen et al. [1] show an inverted U-curve relationship between ecological welfare performance and economic growth using regional-level panel data. In addition to economic growth, some scholars have examined the effects of environmental regulation, industrial structure, green technology innovation, and digital economy development on ecological welfare performance [22,23,24,25]. For example, Guo et al. found an innovation compensation effect of environmental regulation, which significantly positively affects urban ecological welfare performance [24]. Zhu et al. found that the digital economy’s development significantly impacts the ecological welfare performance of the city and neighboring cities [25].
As a catalyst for the development of urban industrialization, urbanization reflects the objective law of urban economic development and represents the industrialization level of a country or region [23,24,26]. In recent years, many scholars have considered the impact of digitization and sustainable development on the new urbanization process [27,28]. It has been one of the hot topics of interest to scholars at home and abroad. Seto et al. point out that the challenge for cities is not whether to carry out urbanization but how to achieve it with minimal environmental impact [29]. Sol et al. pointed out that urbanization has led to a general depletion of biodiversity [30]. In addition to ecological problems, Sampson et al. show that green space in densely populated urban areas is negatively associated with depression rates, demonstrating that urbanization negatively impacts some populations’ lives [31]. New urbanization is an essential means to enhance urban development’s resilience and risk resistance and promote the strategic goal of people-centered urbanization in China’s 14th Five-Year Plan period [1]. It is a critical path for a country to accelerate its economic and social transformation development, and it is also a primary measure to improve ecological welfare performance. Most scholars use the entropy method to assign weights to construct new urbanization indicators. Yu used provincial panel data from 2003–2017 to construct comprehensive indicators to evaluate new urbanization from four dimensions: economic urbanization, population urbanization, social urbanization, and environmental urbanization [32]. Wang et al. used the entropy weighting method to objectively weight 24 sub-variables in four dimensions: demographic urbanization, economic urbanization, land urbanization, and social urbanization [33]. Some scholars have also studied urban environmental performance. Zhang et al. used the tripartite evolutionary game model to study the urban haze control mechanism [34]. Meanwhile, Zhang et al. used panel data to investigate the impact of air pollution and socioeconomic status on urban public health [35]. The above studies are related to urban environmental performance, providing certain ideas for urban sustainable development in the process of urbanization. Many experts have realized and proposed that urbanization should not come at the cost of ecology and environment.
More and more scholars have begun to pay attention to the impact of urbanization on the level of urban ecological welfare performance, using data envelopment analysis to construct economic, environmental, and other related indicators to analyze the efficiency of urban sustainability [36]. They have explored the relationship between ecological welfare performance and the level of urbanization construction from different perspectives and levels and have achieved actual research results [37,38,39]. Li et al. used the poor output SBM model to measure the ecological welfare performance of provinces and cities in China, analyzed its spatial distribution characteristics, and concluded that there was a significant positive correlation between the level of urbanization development and the ecological welfare performance of provinces [40]. Wu et al. also studied the temporal and spatial changes of the ecological footprint in the process of urbanization, used the ecological footprint model to measure ecological sustainability, and concluded that the urbanization development of some cities has exceeded the local tolerable performance level [41]. Yan et al. (2021) explored the ecological decline in rapid urbanization, explored the impact of land finance on ecological environment, and proposed the environmental intervention programs [42]. However, research in this direction still needs to improve on certain shortcomings. First, most of the studies have focused on the impact of urbanization level on urban ecological welfare performance. However, these studies ignored the term “new” in the national strategy of new urbanization [43]. In fact, new urbanization emphasizes population and land urbanization as well as new changes in the urban ecological environment. Second, the traditional DEA model can no longer meet some research needs, ignoring the undesired outputs and the slack variables as well as differentiating these efficiency frontier units [44]. Existing studies adopted more DEA extension models, such as the Super Efficiency Slacks-Based Measure Model (SE-SBM), to solve the above problems [45]. Finally, the discussion on the inner mechanism of the impact of new urbanization on ecological welfare performance is not deep enough. New urbanization in China still faces significant challenges. Therefore, this paper takes 11 provinces and cities in the Yangtze River Economic Belt as the research object and constructs a framework for analyzing the ecological welfare performance of cities in the Yangtze River Economic Belt from the perspective of inputs and outputs. This paper measures the ecological welfare performance of the Yangtze River Economic Belt from 2009 to 2020 based on the SE-SBM model, empirically analyzes the impact of new urbanization on ecological welfare performance using a fixed-effects model, and finally proposes policy recommendations to improve ecological welfare performance.

3. Model Construction

3.1. Super Efficiency Slacks-Based Measure(SE-SBM) Model

Data Envelopment Analysis (DEA) is a method for measuring the productivity of decision-making units, using linear programming to estimate the effectiveness of multiple decision-making units (DMUs), and it is widely used in fields such as production and economics. The DEA model was first proposed by Charnes et al. as a new field in operations research [46]. Traditional DEA models include the CCR and BCC models, which are based on radial and angular aspects for measurement. Since the radial approach requires that the inputs and outputs must vary in the same proportion when evaluating efficiency, it cannot address the measurement errors caused by the slack in the inputs and outputs [47]. To address this issue, Tone proposed a non-radial, non-angular DEA model based on relaxation variables, the SBM model, for measuring eco-efficiency in 2001 [48]. To this end, Andersen et al. propose a further method to compare and distinguish effective DMUs—namely, the “super-efficiency” model. This paper uses the SE-SBM model with undesirable outputs to measure ecological welfare performance. In the SE-SBM model with undesirable outputs, the production system is assumed to have b decision-making units (DMUS). Each DMU can distinguish a kinds of inputs x , q 1 kinds of desirable outputs y e , and q 2 kinds of undesirable outputs y n e . The model defines the matrix X , Y e , Y n e as X = x 1 , x 2 , , x b , and Y e = y 1 e , y 2 e , , y b e , Y n e = y 1 n e , y 2 n e , , y b n e , respectively. The inputs, desirable and undesirable outputs x , y e , and y n e are all greater than 0. The production set is denoted under constant scale return as P = x , y e , y n e | x X λ , y e Y e λ , y n e Y n e λ . Equation (1) is as follows:
Min ρ = 1 + 1 a i = 1 a s i x ik 1 1 q r = 1 q 1 s r e + y rk e + r = 1 q 2 s t ne y rk ne s . t .   j = 1 , j k b x ij λ j s i x ik , j = 1 , j k b y rj λ j + s r e + y rk e , j = 1 , j k b y tj ne s t ne y tk ne 1 1 q r = 1 q 1 s r e y rk e + r = 1 q 2 s t ne y rk ne > 0 , s > 0 , s e > 0 , s ne > 0 , λ > 0 i = 1 , 2 , , a ; r = 1 , 2 , , q ; j = 1 , 2 , , b   ( j k )
In the above equation, λ and s denote the weight vector and the slack variables of input and output, respectively. x i j is the i th input of the j th DMU. y r j is the r th input of the j th DMU. ρ represents the ecological welfare performance value, ρ < 1 indicates that there is an ecological welfare performance loss, and ρ 1 indicates that there is no performance loss for the corresponding ecological welfare performance. Dong et al. have used the SE-SBM model to measure the carbon emission efficiency of CEE countries from 2000–2018 [45]. Li et al. have also used the SE-SBM model to measure the eco-efficiency of Min River source counties from 2005–2017 to analyze the spatial and temporal evolution and spatial divergence of eco-efficiency. This paper studies the impact of new urbanization construction on eco-welfare performance in 11 provinces and cities in the Yangtze River Economic Belt from 2009 to 2020. This paper considers the measurement’s feasibility in the specific measurement process and combines Chen et al. and Fang et al. [1,17]. This paper adopts the SE-SBM model to measure eco-welfare performance and selects social welfare level as desirable output, environmental pollution as undesirable output, and resource consumption as input.

3.2. Panel Regression Model

When discussing panel data, it is essential to note that it has cross-sectional and temporal dimensions, N cross-sectional individuals, and T observation periods. If T is less than N, the panel data are called short panels; otherwise, they are long panels. For long panel data, mostly fixed effects regression models are used. The basic assumption of mixed effects is that there are no individual effects, i.e., OLS regression as cross-sectional data, averaging out all individual effects, as in Equation (2). Individual effects are divided into fixed effects and random effects [49]. The individual fixed effects take the form of the deviation from the mixed effects model minus its mean over time, as shown in Equation (3). Time-fixed effects can deal with omitted variables that do not vary with individuals, but with time, as shown in Equation (4). The random-effects model takes the regression coefficients as the variables and estimates them by feasible generalized least squares, with the omitted individual characteristic variables changing neither with individuals nor with the observed period. The random error disturbance term is included in [50], as in Equation (5). If the perturbation term is further assumed to be normally distributed, the logarithmic likelihood function of the sample can be written, and then the maximum likelihood estimation can be performed.
y it = α + x it β + z i δ + ε it
y it y i = ( x it x i ) β + ( ε it ε i )
y it = x it β + z i δ + λ t ε it + ε it
y it θ ^ y = ( x it θ ^ x i ) β + ( 1 θ ^ ) z i δ + [ ( 1 θ ^ ) u i + ( ε it θ ^ ε i ) ]
In Equation (2), y i t is the explained variable. x i t is the explanatory variable. z i is the individual characteristics that do not change with time. ε i t is the disturbance term that varies with individual and time. It is assumed that { ε i t } is independently and identically distributed and uncorrelated with u i uncorrelated. If u i is related to an explanatory variable, the model is further called the fixed effects model. In Equation (3), the u i is eliminated. Therefore, as long as ε i t is correlated with x i t is not correlated, OLS can be used to consistently estimate β , i.e., the fixed effects estimator. In Equation (4), the λ t is the unique intercept term of “period t” and is interpreted as the influence of “period t” on explanatory variables. In Equation (5), u i is uncorrelated with x i t and z i , so the OLS is consistent. However, the specific model used in the study needs to be further determined by an LM test and Hausman test.

4. Empirical Results

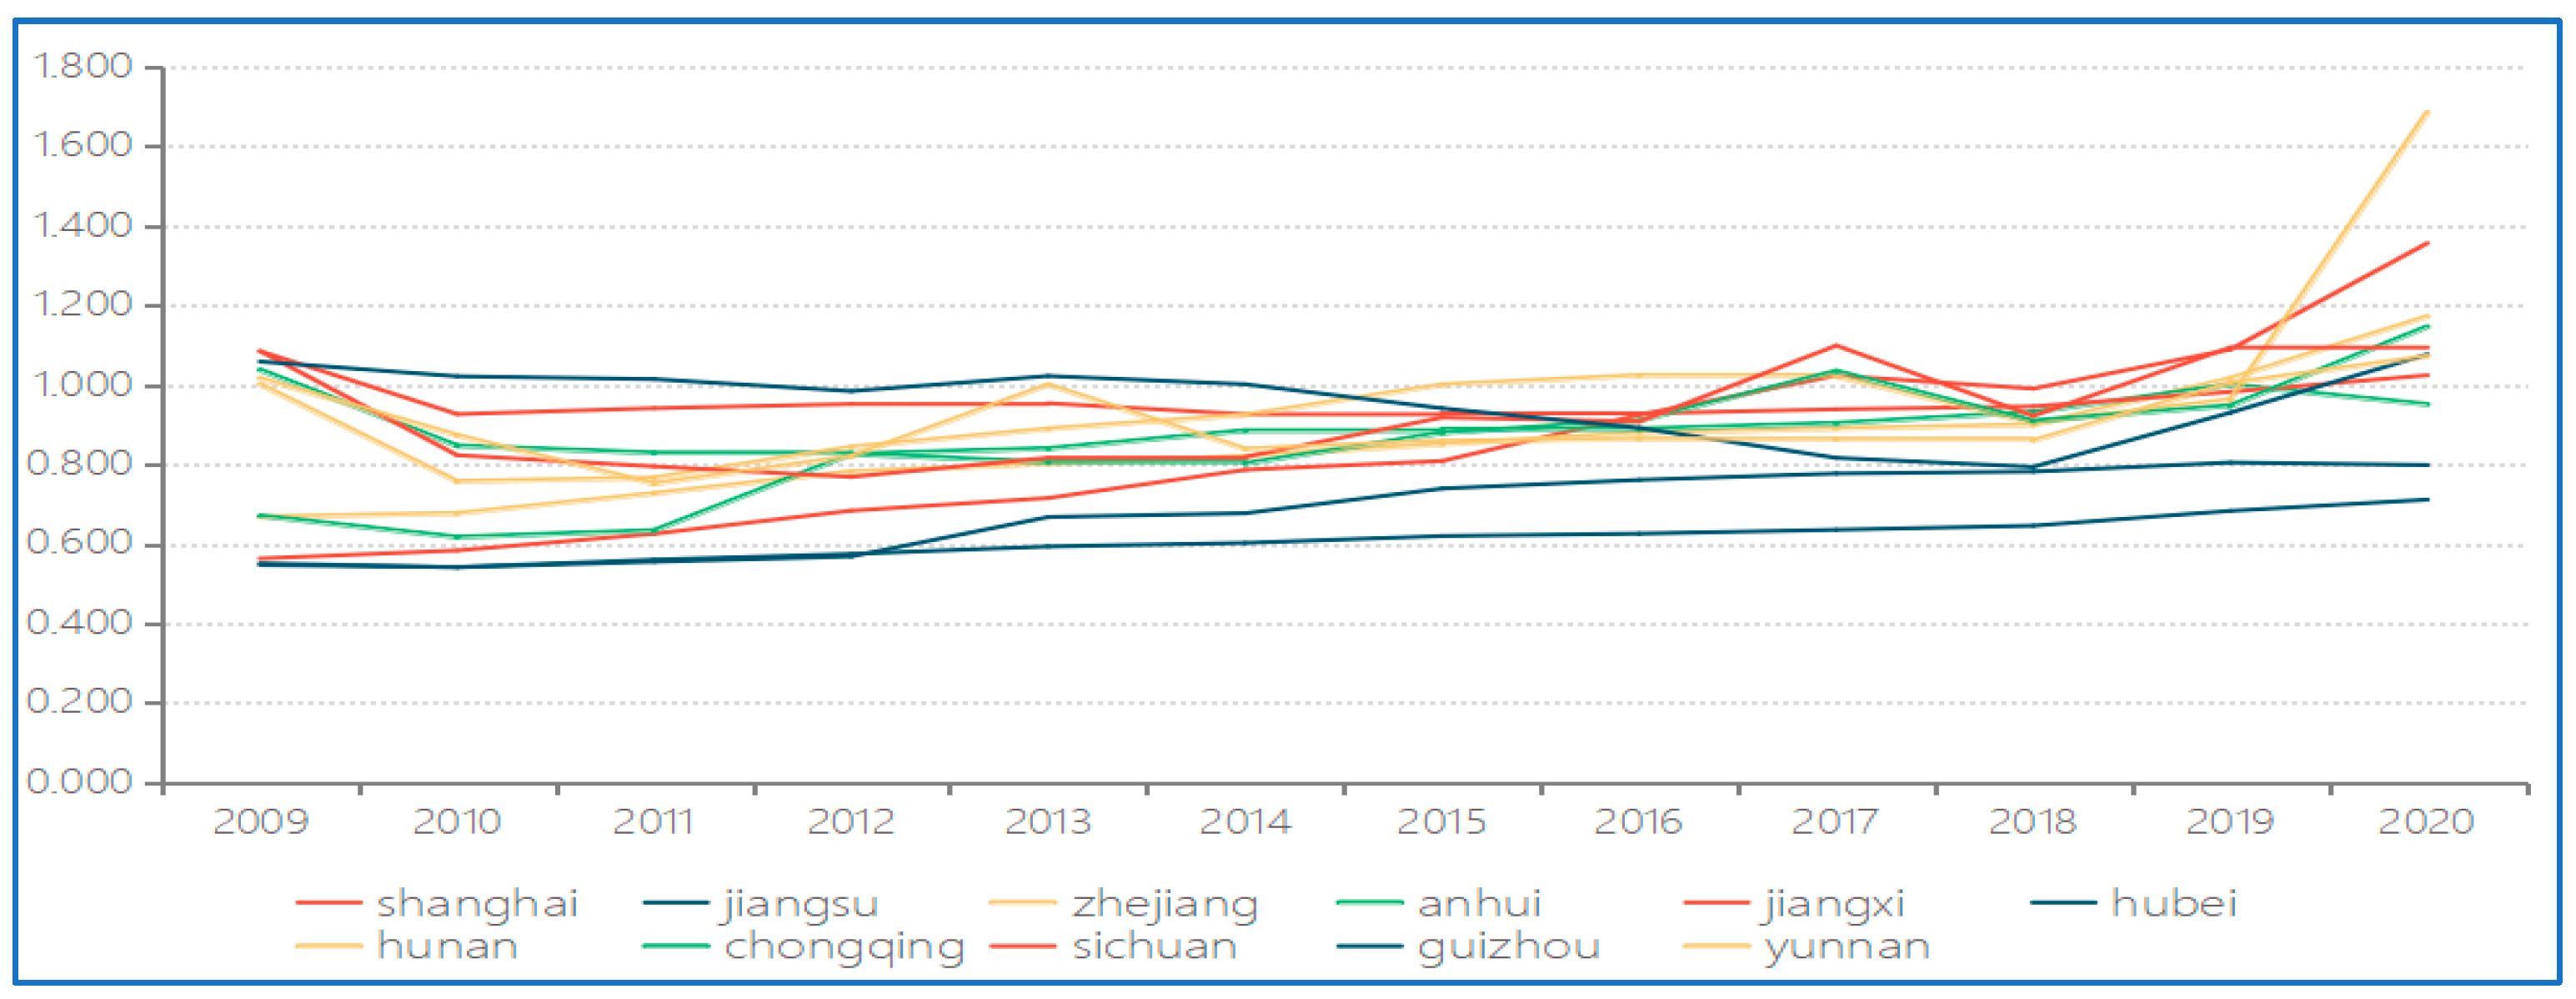
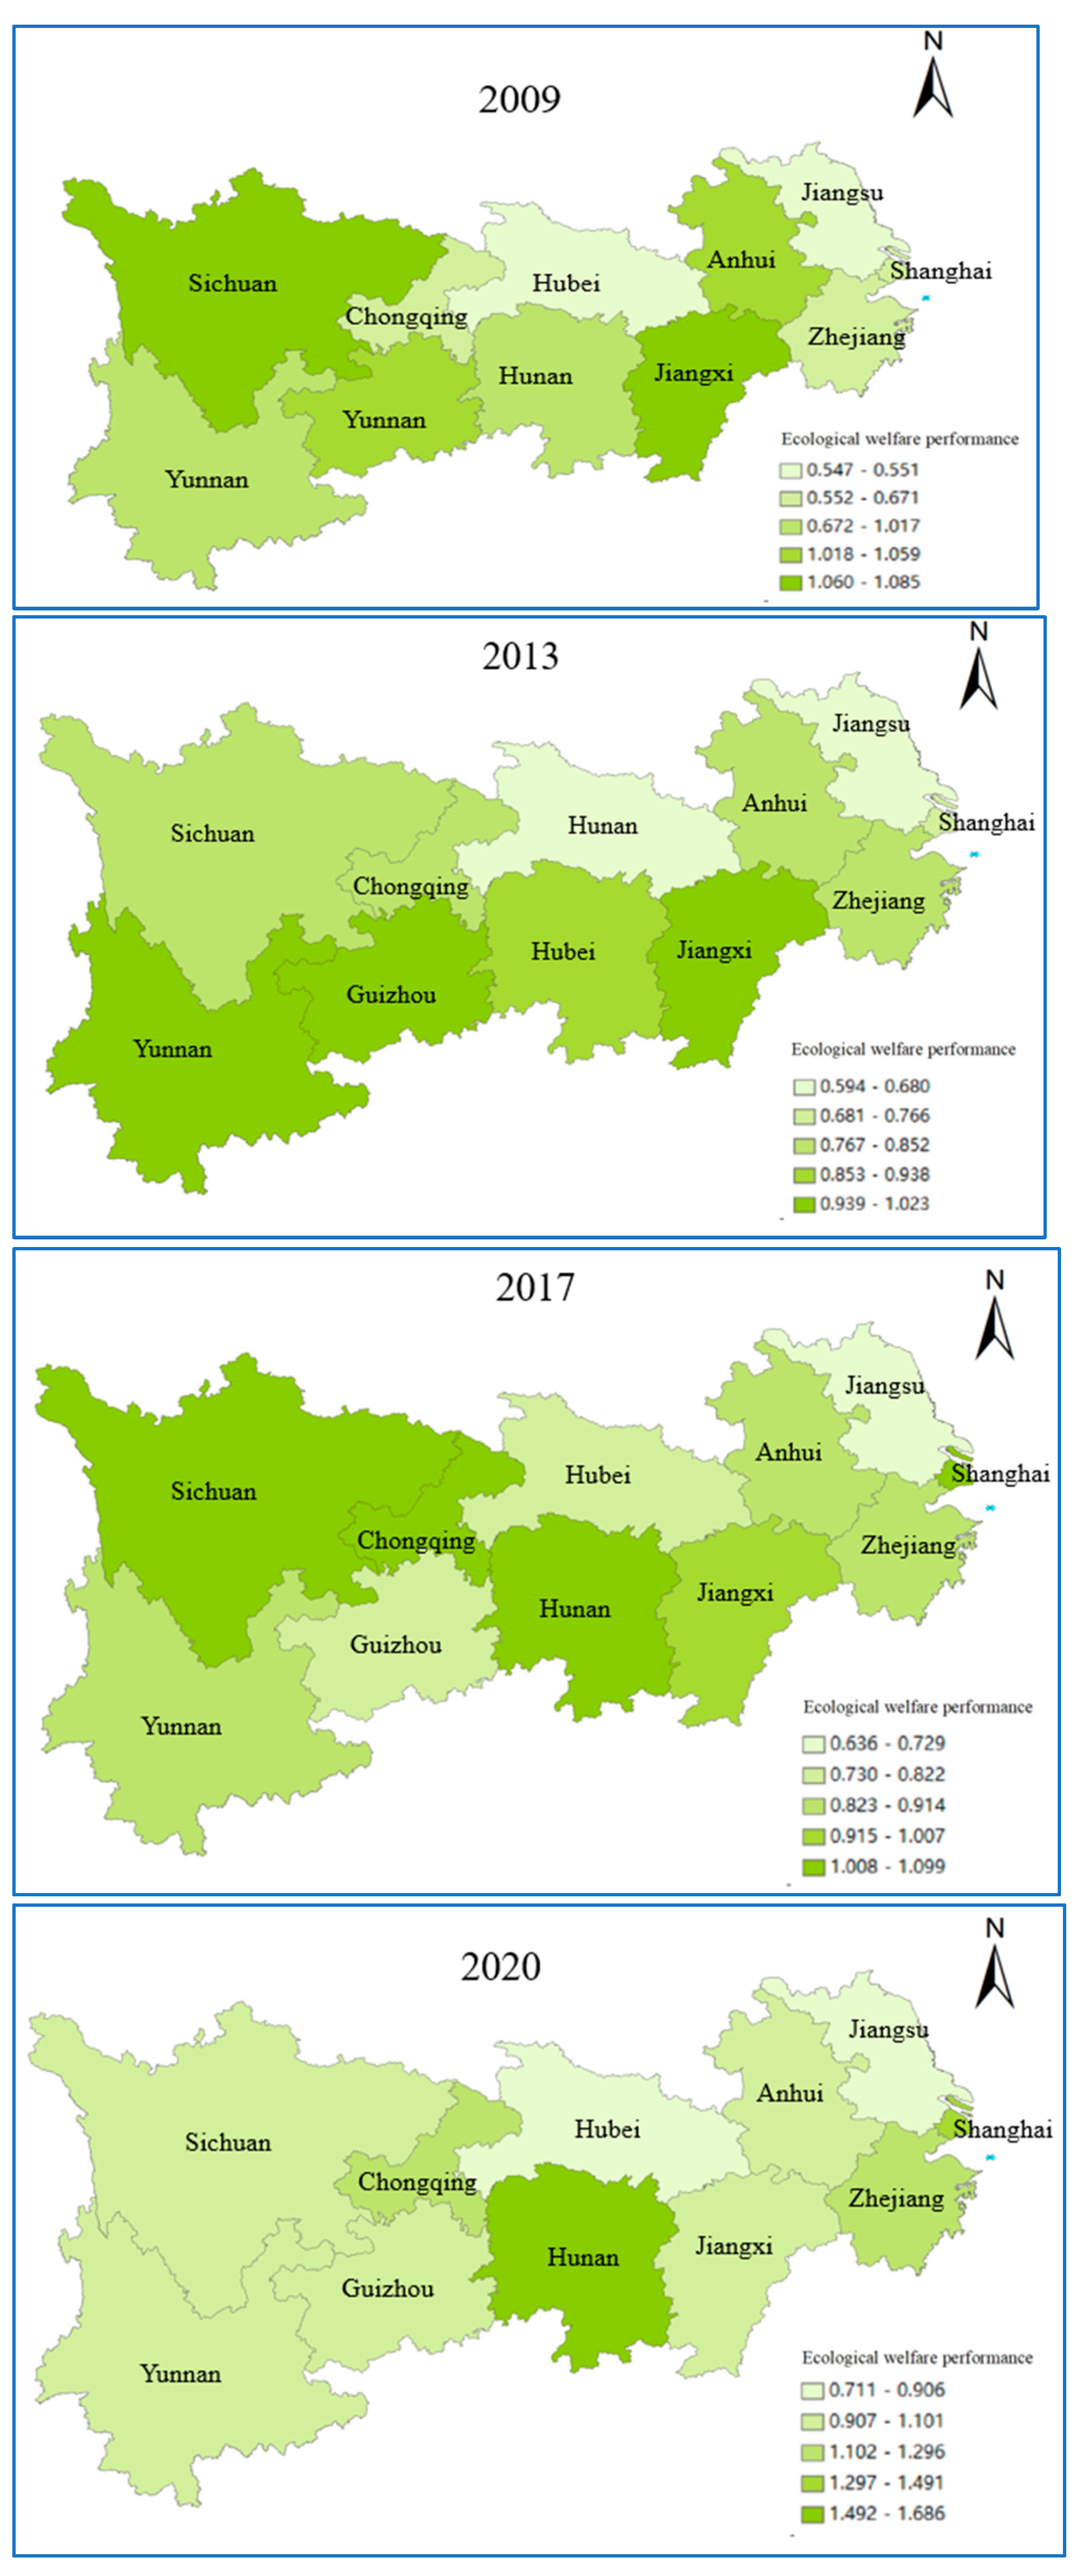
4.1. Measurement of Ecological Welfare Performance in the Yangtze River Economic Belt

As a quantitative indicator reflecting the degree of decoupling between social welfare and ecological resource consumption, ecological welfare performance is a product of the close integration of the ecological environment and social welfare [6]. This paper uses the SE-SBM model to measure the ecological welfare performance of 11 provinces and cities in the Yangtze River Economic Belt from 2009 to 2020. By consuming fewer ecological resources and obtaining a higher social welfare level, the ecological welfare performance is improved, which aligns with the requirements of the DEA method for input and output indicators. This paper refers to Long et al. regarding selecting these ecological welfare performance indicators [51,52]. Since eco-welfare performance is essentially a sublimated version of eco-efficiency, we can also refer to some methods used to study eco-efficiency. The expected output is the level of social welfare, and the undesirable output is the environmental pollution generated in the urbanization process. New urbanization pursues sustainable development and green innovation. Therefore, lowering the undesirable output and increasing the desirable output can improve the quality of new urbanization. This paper selects the social welfare level as the desirable output, environmental pollution as the undesirable output, and resource consumption as the input. The feasibility of measurement is considered. This article combines the methods of Chen et al. and Fang et al. in constructing the indicator system for ecological welfare performance, using unexpected outputs as input indicators to construct the indicator system [53,54,55]. The construction of the indicator system follows the scientific and systematic principles.
(1). Resource consumption: The study uses the resource consumption proposed by Long et al. [16] as an input indicator. The input indicators include three secondary indicators: water resources consumption, land resources consumption, and energy consumption. Water resource consumption is measured by per capita water consumption. The calculation method is total regional water consumption/regional population. Land resource consumption is measured by the area of construction land per capita, calculated as the area of urban construction land/number of the regional population. Energy consumption is measured by the number of standard coal consumed per capita, calculated as total regional energy consumption/regional population. (2). Environmental pollution: Environmental pollution as an input indicator includes three secondary indicators: wastewater discharge, exhaust gas discharge, and solid waste discharge. This study uses industrial wastewater emission per capita to measure wastewater emission. Industrial SO2 emission per capita is used to measure exhaust gas emission, and industrial solid waste generation per capita is used to measure solid waste emission. (3). Social welfare level: All human economic activities are based on improving people’s subjective well-being, and the comprehensive national power of a country largely depends on the development space and quality of life of individuals. The level of welfare is embodied by three dimensions: economy, education, and health. In this paper, the indicators of social welfare level refer to the three dimensions of education, economy, and health level in the Human Development Index (HDI) indicators released by the United Nations Development Program (UNDP). This indicator includes years of education per capita, disposable income per capita, and life expectancy per capita. Long et al. used to combine the three dimensions of education, economy, and health, and introduced the above three indicators to measure the level of social welfare [16]. Most scholars use GDP per capita as an indicator of economic level. However, GDP per capita does not sufficiently reflect the happiness brought by one’s economic level, so disposable income per capita is used as an indicator of economic level. The number of years of education per capita is obtained by calculation. The details are shown in Equation (6):
PE = 6 × P 1 + 9 × P 2 + 12 × P 3 + 16 × P 4 P 1 + P 2 + P 3 + P 4
In Equation (6) P 1 , P 2 , P 3 , and P 4 represent the number of population with four levels of education: elementary school, junior high school, senior high school, and junior college and above, respectively. Life expectancy per capita is measured by life expectancy at birth. This study only collected statistics from the 1990, 2000, and 2010 censuses. Xu et al. analyzed data published by the World Bank and found that overall life expectancy at birth in China increased linearly after 2003 [56]. Therefore, this study draws on their method to fill in the missing data for life expectancy per capita in each province by the corresponding natural growth rate. Per capita disposable income is expressed through the discretionary income of each resident. The primary data for constructing the above indicator system were obtained from the China Statistical Yearbook, China Water Resources Bulletin, China City Statistical Yearbook, China Energy Statistical Yearbook, and Educational Statistics Yearbook of China. With the above index system, this study uses MAXDEA Pro6.4 to estimate the ecological welfare performance of 11 provinces and cities in the Yangtze River Economic Belt. The calculation results are shown in Table 1.

4.2. Tests of Ecological Welfare Performance of New Urbanization

The new urbanization construction is dedicated to expanding the scale of towns and cities and promoting the upgrading of urban industries, improving the ecological welfare performance of cities, and better adapting to the needs of economic growth. In China’s high-quality economic development model, problems such as ecological and environmental pollution and lower living standards of residents have emerged, while some cities have embarked on an irrational development path [57].

4.2.1. Core Explanatory Variables

Referring to the evaluation indicators of new urbanization by some scholars [32,58], this paper will explore the impact of new urbanization on ecological welfare performance in 11 provinces and cities in the Yangtze River Economic Belt from four perspectives: population urbanization, economic urbanization, land urbanization, and social urbanization [58]. The specific indicators are selected as follows. (1). Population urbanization, which can be measured by the proportion of the urban population. Yu et al. have constructed a system from four dimensions: economic, demographic, social, and environmental when studying the ecological effects of new urbanization in China [32]. (2). Economic urbanization, which can be measured by the proportion of tertiary industry. It represents the industrial evolution pattern in the country’s economic development. (3). Land urbanization, such as Ahmad et al., who studied the heterogeneous dynamic link between land urbanization and the level of economic development, and proposed that population urbanization generally accompanies land urbanization [59]. Land urbanization can be measured by the urban road area per capita, which integrates the degree of traffic congestion in a city. (4). Social urbanization, which can be measured by the green coverage of built-up areas, and which is expressed as the ratio of the green coverage of built-up areas to the built-up areas of cities. Relevant data are obtained from China Statistical Yearbook, China City Statistical Yearbook, etc.

4.2.2. Control Variables

Regarding existing studies, the following three control variables are selected in this paper: (1). The level of foreign direct investment (fdi) is chosen to measure the amount of foreign direct investment as a share of GDP. Some experts put forward the heaven effect of pollution caused by FDI through empirical studies, while other experts proposed the pollution halo effect, which may depend on the specific development stage [60]. (2). The level of foreign openness (ft) is measured by choosing a country’s total value of import and export as a proportion of GDP to calculate the foreign trade dependence. The international transfer of environmental costs is implied in the world trade, and China has made great sacrifices for the world despite emitting a lot of carbon and pollutants. (3). The level of science and technology innovation (rd) is measured by calculating the RD intensity by choosing the proportion of R&D expenditure to GDP. The relevant data are obtained from wind, provincial statistical yearbooks, official websites of provincial statistical bureaus, local R&D census bulletins, etc. The improvement of green technology can improve resource allocation and production efficiency, and reduce energy consumption and pollutant emission, while breakthroughs in core technologies can improve China’s position in the value chain [61].
This study uses panel data for each indicator in 11 provinces and cities in the Yangtze River Economic Belt. The panel data have two dimensions of cross-section and time, N cross-section individuals, and T observation periods, and this paper uses long panel data with T large and N small. According to the estimation results of the mixed-effects model, fixed-effects model, and random-effects model, combined with the LM test, the p-value is found to be 0.0265, which is significant at the 5% level. Therefore, the random effects model should be selected. Moreover, combined with the Hausman test, the p-value is found to be 0.0102, which is significant at the 5% level. The fixed-effects model is better than the random-effects model. Therefore, the estimation results of the fixed effect model are finally used. The results are shown in Table 2.

5. Discussion

5.1. Discussion of Ecological Welfare Performance Results

Considering that the SE-SBM model can better measure the ecological welfare performance, this paper selects the relevant index data of 11 provinces and cities in the Yangtze River Economic Belt from 2009 to 2020 to establish the SE-SBM model. The specific input and output indicators are not listed. The line graph is shown in Figure 2 below. In order to further analyze the spatial differentiation of multi-year changes of ecological welfare performance in the Yangtze River Economic Belt, this paper selects four-time points, 2009, 2013, 2017, and 2020. It uses ArcMap software to map the spatial differentiation of ecological welfare performance using the provincial level as the dividing unit. Figure 3 represents the spatio-temporal evolution of ecological welfare performance in the Yangtze River Economic Belt.
First, in terms of development trends, the ecological welfare performance of the Yangtze River Economic Belt from 2009 to 2013 shows a U-shaped trend of decreasing and then increasing (see Figure 2). As shown in Figure 2 from 2009 to 2013, it can be clearly seen that all provinces show a U-shaped trend. The ecological welfare performance changes most obviously in the central and western regions. The main reason for this phenomenon is the backward industrial structure and rough economic growth in the central and western regions in the early stage, which significantly depleted natural resources and caused environmental pollution. The improvement of ecological welfare performance in the later stage is through the active introduction of advanced technology and the improvement of education and medical systems. Except for some provinces and cities in the western region, the rest of the provinces and cities maintain a continuous upward trend. The main reason for this phenomenon is that some enterprises have an insufficient level and ability to develop innovative technology in the later stage. This makes it difficult for sustainable economic development to match the ecological and environmental conditions and affects the social welfare level to a certain extent, affecting the urbanization process and sustainable urban development. Since “Jointly Grasping Great Protection” was put forward, the ecological environment protection of Yangtze River Economic Belt has undergone a watershed change [62].
Second, in terms of regional differences, there are significant regional differences in the ecological welfare performance of the 11 provinces and cities in the Yangtze River Economic Belt. Kuznets’ curve theory mentions the inverted U-shaped relationship between environmental pollution and the economic development stage, which shows that with the improvement of economic level, environmental problems have been partially solved. However, the growing economy also aggravates environmental pollution [54]. The eastern region shows a transparent upward gradient in the change of ecological welfare performance from 2009 to 2020, while the central and western regions show no apparent gradient change (see Figure 2). This phenomenon is closely related to economic development, as the eastern provinces and cities are economically developed, promote economic system reform early, and absorb foreign investment and access to cutting-edge technology, which triggers the cumulative effect of the economy, education, and healthcare. For example, Shanghai, as one of the most economically developed regions, has high ecological welfare performance due to its developed educational and medical resources. The central and western regions are prone to form a strange circle of economic development with low resource use efficiency and high pollution in the catch-up process of narrowing the economic gap. After 2013, the level of environmental technology was not as fast as urbanization, which led to a period of low ecological welfare performance. However, this problem was gradually solved with the introduction of technology diffusion. With the narrowing of regional differences and the spillover of technological innovation, the eco-environmental performance will gradually converge [63].
Third, from the perspective of spatial agglomeration degree, the center of gravity of ecological welfare performance in the Yangtze River Economic Belt from 2009 to 2013 was concentrated in the central and western regions. The center of gravity was shifted relative to the eastern regions from 2014 to 2020. In the early stage, the performance generally took Hunan Province as the high-value aggregation area to the periphery of the central region. The spatial radiation capacity was enhanced, showing a certain “center-edge” spatial structure. The spatial structure of Hunan Province and Shanghai will form the high-value center in the later stage and gradually decrease in all directions. The overall resource level in the eastern region is higher than in other regions, but ecological and environmental protection as well as people’s welfare issues were neglected in the early stage. With the continuous introduction of technology, resource allocation is gradually rationalized, and the environmental pollution caused by economic growth is gradually reduced (Figure 3). Highly polluting enterprises gradually moved to the central region and concentrated near Hubei Province. The above conclusions are consistent with the development status of the western, central, and eastern provinces and cities of the Yangtze River Economic Belt in the past decade, which indirectly confirms the correctness of the conclusions.

5.2. Discussion on the Relationship between New Urbanization and Ecological Welfare Performance

(1). The coefficient of population urbanization is −1.6393 and significant at the 1% level. The result indicates that population urbanization inhibits the ecological welfare performance. It is mainly because the demand for living materials and the corresponding metabolism of various groups of people in the urbanization process will inevitably increase the ecological load. Moreover, with the development of population urbanization, urban infrastructure needs to increase along with the increase in population. However, under the condition of a certain urban area, the addition of infrastructure can only bring pressure to the city. The rapid growth of population urbanization also puts considerable pressure on the ecological environment, thus decreasing social welfare [64]. In addition, some experts have discussed various environmental problems caused by big cities with the overcrowded population, and proposed these small and medium-sized cities [65]. (2). The coefficient of economic urbanization is 0.0093 and significant at the 5% level. The result indicates that economic urbanization promotes the ecological welfare performance of the Yangtze River Economic Belt. Industrial transformation and upgrading is an essential part of sustainable development. Urbanization is also changing to green services, with modern service industries replacing traditional manufacturing as the new driving force of urbanization and economic development [66]. The empirical results are consistent with what academics currently believe. As the proportion of the tertiary industry in the industrial structure increases, the production of the same GDP produces less environmental pollution. The industrial structure is continuously upgraded, and the ecological investment is reduced. Compared with the coefficient of social urbanization, the contribution of economic urbanization is significantly lower than that of social urbanization, which proves that industrial transformation and upgrading and rapid economic development also bring negative effects on ecological welfare performance. However, some experts also put forward the nonlinear relationship between industrialization and ecological environment [67].
(3). The coefficient of land urbanization is −0.0160 and is significant at the 1% level. The reason is that the process of building urban infrastructure and roads will destroy the surface vegetation and the original landforms, and the solid waste and wastewater generated during the construction process will pollute the ecological environment of the town, resulting in over-exploitation and thus causing ecological and environmental problems. Zhou et al. (2022) estimated the associated effects of urban expansion and water pollutant discharge in Yangtze River Delta and proposed the spatial interaction between urban expansion and water pollutant discharge [68]. (4). The coefficient of social urbanization is 1.4316 and significant at the 5% level. The result indicates that social urbanization promotes the ecological welfare performance of the Yangtze River Economic Belt. Most scholars use metrics such as the number of college students per 10,000 pollution to measure the indicators of social urbanization, but these indicators need to be updated somewhat with economic development [69]. As the main indicator of a city’s greening level, the greening coverage of built-up areas is vital to improving the urban environment and restoring organization. The essential reason is that the higher the green coverage rate of built-up areas is, the better the urban environment will be improved, and the organizations damaged by pollution in the ecosystem can be better repaired, and, as a result, the quality of the ecological environment will be improved [70].
In terms of the control variables, the level of foreign investment has a significant positive impact on the ecological welfare performance of the Yangtze River Economic Belt, mainly because with the inflow of FDI, China introduces advanced technology and experience. At the same time, the ecological environment quality improved accordingly. Some scholars found that the inflow of foreign capital brings positive environmental effects to China, promoting the introduction of environmentally-friendly enterprises and improving ecological welfare performance [71,72]. The ratio of total import and export value to a country’s GDP reflects the value of imported and exported goods, which does not directly affect ecological welfare performance. The level of science and technology innovation positively affects the ecological welfare performance of the Yangtze River Economic Belt. The addition of advanced technology reduces the pollution generation during urban development, while the ability to manage the environment strengthens and improves ecological welfare performance. The Yangtze River Economic Belt cannot be substituted in national land development. This paper studies the impact of new-type urbanization construction on the ecological welfare performance of provinces and cities in the Yangtze River Economic Belt. The research results are of exemplary significance for the construction of the Yangtze River Economic Belt and the promotion of the development of similar regions in China and even the world in the future.

6. Robustness Test

This paper uses the following methods to verify the regression robustness. First, municipalities are not included. The municipality has its unique characteristics. Chongqing and Shanghai are under the direct jurisdiction of the central government as municipalities. Unlike other regions, though, they have apparent location and policy advantages in the Yangtze River Economic Belt. Their economic and social environments are also quite different from other provinces and cities in the Yangtze River Economic Belt. Therefore, this paper excludes the municipalities in the sample and conducts regression again. The results are shown in Table 3, which are consistent with the main regression results, indicating that the main regression results are robust. The comparison of the regression coefficients shows that the inhibition effect of population urbanization on ecological welfare performance is weakened, and the promoting effect of economic urbanization on ecological welfare performance is enhanced after removing municipalities directly under the central government. This result indicates that municipalities have full advantages in the aspect of coordinated economic development, industrial transformation, and upgrading. At the same time, their geographical advantages attract service industry and foreign investment industry clusters, which can effectively improve ecological welfare performance.
Second, the core explanatory variables are added. The promulgation and implementation of policies such as the National New Urbanization Plan (2021–2035) can promote the joint development of new urbanization construction and ecological civilization construction. These policies positively affect new urbanization construction in ecological welfare transformation, scanning the practical effect [73]. Some scholars followed the plan mentioned above in the construction of the new urbanization evaluation index system, and added ecological urbanization to the core explanatory variables in terms of parkland area per capita. The results are shown in Table 3. Comparing the regression coefficients shows that after adding ecological urbanization as the core explanatory variable, population urbanization inhibitory effect and economic urbanization promoting effect on ecological welfare performance increase. This result indicates that when eco-urbanization promotes ecological welfare performance, the relatively weaker indicator of population urbanization in the main regression results will be revealed to a certain extent, leading to an increased inhibitory effect.

7. Conclusions and Recommendations

This paper measures the ecological welfare performance of 11 provinces and cities in the Yangtze River Economic Belt based on the “super-efficiency” SE-SBM model. It uses mixed panel, random panel, and fixed panel models in terms of population, economic, land, and social urbanization. It is essential to explore the impact of new urbanization on ecological welfare performance for rapid economic development and ecological civilization protection in the Yangtze River Economic Belt. The results show that: (1). Since 2009, the ecological welfare performance of the Yangtze River Economic Belt has shown a U-shaped trend of “decreasing and then increasing.” In terms of regional differences, there are significant regional differences in ecological welfare performance between the east, middle, and west. The eastern region, in particular, shows an apparent increasing trend. Spatially, the spatial center of gravity gradually shifts from the central and western regions to the eastern region, and the spatial radiation gradually shifts from the central and western regions to the eastern region. (2). The regression results show that population urbanization and land urbanization have a significant negative inhibitory effect on ecological welfare performance. In contrast, economic and social urbanization have a significant positive promoting effect on ecological welfare performance. (3). The level of foreign investment and scientific and technological innovation have a significant positive promoting effect on ecological welfare performance in the Yangtze River Economic Belt. In contrast, the level of opening up to the outside world has no significant correlation with ecological welfare performance. (4). Robustness tests show that the city’s location, political, and economic advantages, as well as the proposed national construction plan for new urbanization, can promote ecological welfare performance.
Based on the above analysis and conclusions, the following recommendations are made for the Yangtze River Economic Belt to improve ecological welfare performance sustainably. Firstly, local governments should promote the orderly transfer of surplus rural labor force, actively guide the population to gather in small and medium-sized cities, and fully ensure the implementation of the rural professional population citizenization, achieving people-centered urbanization. Secondly, local governments should speed up industrial green transformation and upgrading, focus on developing high-tech industries and low-carbon green industries, and eliminate backward production capacity and pollution-intensive industries. Thirdly, the government should improve the utilization efficiency of urban space, better the urban living environment, coordinate the transformation of central urban areas and the construction of new districts, and prohibit blind expansion and disorderly establishment of projects. Fourthly, local government should strengthen municipal facilities and the construction of public service facilities, increase the supply of basic public services, improve greening and garbage disposal, and enhance the supporting capacity for population gathering. Fifthly, local governments should establish a system of ecological and environmental governance by multiple entities, clarify the functional positioning of various cities, facilitate coordinated green development, and promote joint ecological and environmental governance in urban agglomerations.
This paper adopts the SE-SBM model to measure the ecological welfare performance of the Yangtze River Economic Belt and uses a fixed-effects panel model to investigate whether new urbanization can improve ecological welfare performance. Due to limited knowledge, limited access to data resources, and limited mastery of research methods, this study has many shortcomings, such as a lack of research on the mechanisms related to new urbanization and ecological welfare performance. The construction of the relevant index system is borrowed more from other scholars and is less innovative. Mastering research methods is limited, and the research methods are relatively simple. The research on the impact of new urbanization on the ecological welfare performance in the Yangtze River Economic Belt needs to be carried out further. This paper has a good research prospect. First of all, there are few relevant studies on the impact of new-type urbanization on ecological welfare performance. Secondly, this paper not only makes suggestions on improving ecological welfare performance based on core explanatory variables but also analyzes control variables to a certain extent, which has positive significance for the construction of new-type urbanization in the Yangtze River Economic Belt and the improvement of ecological welfare performance.

Author Contributions

Methodology, L.B. and D.M.; Software, L.B.; Investigation, L.B., J.Z. and D.M.; Resources, J.Z.; Writing—original draft, L.B. and X.D.; Writing—review & editing, J.Z. and D.M.; Visualization, J.Z.; Supervision, X.D.; Project administration, X.D. All authors have read and agreed to the published version of the manuscript.

Funding

This research was funded by National Natural Science Foundation of China (72204099), the Humanities and Social Sciences Foundation of the Ministry of Education (21YJC790021), Jiangsu Province University Philosophy and Social Sciences Excellent Innovation Team Building Project (SJSZ2020-20).

Institutional Review Board Statement

Not applicable.

Informed Consent Statement

Not applicable.

Conflicts of Interest

The authors declare no conflict of interest.

References

  1. Chen, D.J.; Liu, W.Y. The Impact of Urbanization on China’s Ecological Welfare Performance: Based on the Two-stage Super-NSBM Model. Jianghan Acad. 2023, 42, 86–98. [Google Scholar]
  2. Daly, H.E. Uneconomic growth in a full world. Soc. Contract J. 2003, 13, 171–180. [Google Scholar]
  3. Costanza, R.; Daly, L.; Fioramonti, L.; Giovannini, E.; Kubiszewski, I.; Mortensen, L.F.; Wilkinson, R. Modelling and measuring sustainable wellbeing in connection with the UN Sustainable Development Goals. Ecol. Econ. 2016, 130, 350–355. [Google Scholar] [CrossRef]
  4. Chen, M.; Liu, W.; Lu, D.; Chen, H.; Ye, C. Progress of China’s new-type urbanization construction since 2014: A preliminary assessment. Cities 2018, 78, 180–193. [Google Scholar] [CrossRef]
  5. O’Neill, D.W. The proximity of nations to a socially sustainable steady-state economy. J. Clean. Prod. 2015, 108, 1213–1231. [Google Scholar] [CrossRef]
  6. Zang, M.; Zhu, D.; Liu, G. Ecological well-being performance: Concept, connotation and empirical of G20. China Popul. Resour. Environ. 2013, 23, 118–124. [Google Scholar]
  7. Daly, H.E. The economics of the steady state. Am. Econ. Rev. 1974, 64, 15–21. [Google Scholar]
  8. Zhang, C.; Li, J.; Liu, T.; Xu, M.; Wang, H.; Li, X. The spatiotemporal evolution and influencing factors of the Chinese cities’ ecological welfare performance. Int. J. Environ. Res. Public Health 2022, 19, 12955. [Google Scholar] [CrossRef]
  9. Dong, J.; Wu, D. An evaluation of the impact of ecological compensation on the cross-section efficiency using SFA and DEA: A case study of Xin’an River Basin. Sustainability 2020, 12, 7966. [Google Scholar] [CrossRef]
  10. Boyd, J.; Banzhaf, S. What are ecosystem services? The need for standardized environmental accounting units. Ecol. Econ. 2007, 63, 616–626. [Google Scholar] [CrossRef]
  11. Cui, S.N.; Xu, P.; Wang, Y.Q.; Zhu, Z.H. Calculation and Comparison of Ecological Welfare Performance in China’s Three Major Urban Agglomerations. Stat. Decis. 2023, 39, 53–58. [Google Scholar]
  12. Common, M. Measuring national economic performance without using prices. Ecol. Econ. 2007, 64, 92–102. [Google Scholar] [CrossRef]
  13. DiMaria, C.H. An indicator for the economic performance and ecological sustainability of nations. Environ. Model. Assess. 2019, 24, 279–294. [Google Scholar] [CrossRef]
  14. Ng, Y.-K. Environmentally Responsible Happy Nation Index: Towards an Internationally Acceptable National Success Indicator. Soc. Indic. Res. 2008, 85, 425–446. [Google Scholar] [CrossRef]
  15. Jorgenson, A.K. Economic development and the carbon intensity of human well-being. Nat. Clim. Chang. 2014, 4, 186–189. [Google Scholar] [CrossRef]
  16. Long, L.J.; Wang, X.; Guo, B. Evaluation on sustainable urban development from the perspective of ecological wellbeing performance-A case study of Shanghai. Resour. Environ. Yangtze Basin 2016, 25, 9–15. [Google Scholar]
  17. Fang, S.J.; Xiao, Q. Research on regional ecological well-being performance and spatial effect in China. China Popul. Resour. Environ. 2019, 29, 1–10. [Google Scholar]
  18. Knight, K.W.; Rosa, E.A. The environmental efficiency of well-being: A cross-national analysis. Soc. Sci. Res. 2011, 40, 931–949. [Google Scholar] [CrossRef]
  19. Dietz, T.; Rosa, E.A.; York, R. Environmentally efficient well-being: Rethinking sustainability as the relationship between human well-being and environmental impacts. Hum. Ecol. Rev. 2009, 16, 114–123. [Google Scholar]
  20. Dietz, T.; Rosa, E.A.; York, R. Environmentally efficient well-being: Is there a Kuznets curve? Appl. Geogr. 2011, 32, 21–28. [Google Scholar] [CrossRef]
  21. Zhu, D.J.; Zhang, S. Research on Ecological Wellbeing Performance and lts Relationship with Economic Growth. China Popul. Resour. Environ. 2014, 24, 59–67. [Google Scholar]
  22. Xiao, L.M.; Ji, H.R. Spatial Structure Change and Influencing Factors of Ecological Well-being Performance from the Perspective of Green Technological Innovation in China: Data Analysis Based on Provincial Panel Data. Sci. Technol. Manag. Res. 2018, 38, 243–251. [Google Scholar]
  23. Huang, J.; Zhong, P.S. Spatial Difference and Dynamic Evolution of the Development Level of New Urbanization in Henan Province. J. Xinyang Norm. Univ. (Philos. Soc. Sci. Ed.) 2022, 6, 1–13. [Google Scholar]
  24. Guo, B.N.; Lin, J.; Liu, T.F. Impact of Environmental Regulations on Urban Ecological Welfare Performance in the Yangtze River Delta. Stat. Decis. 2021, 37, 15–18. [Google Scholar]
  25. Zhu, J.H.; Pang, W.Y. The influence of digital economy development on ecological welfare performance. Stat. Decis. 2022, 38, 79–83. [Google Scholar]
  26. Valaskova, K.; Oláh, J.; Popp, J.; Lăzăroiu, G. Virtual Modeling and Remote Sensing Technologies, Spatial Cognition and Neural Network Algorithms, and Visual Analytics Tools in Urban Geopolitics and Digital Twin Cities. Geopolit. Hist. Int. Relat. 2022, 14, 9–24. [Google Scholar]
  27. Andronie, M.; Lăzăroiu, G.; Iatagan, M.; Hurloiu, I.; Dijmărescu, I. Sustainable cyber-physical production systems in big data-driven smart urban economy: A systematic literature review. Sustainability 2021, 13, 751. [Google Scholar] [CrossRef]
  28. Sullivan, R. The Geopolitics of Urban Digital Twins: Spatial Cognition and Predictive Modeling Algorithms, Simulation and Virtualization Technologies, and Blockchain-enabled Cyber-Physical Systems. Geopolit. Hist. Int. Relat. 2022, 14, 25–39. [Google Scholar]
  29. Chen, F.; Liu, Y.X.; Zhang, Q.; Yan, B.B.; Feng, Y.Y.; Niu, J.Q. Study on the Spatio-temporal Change of Ecosystem Service Value in Henan Province. J. Xinyang Norm. Univ. (Nat. Sci. Ed.) 2023, 2, 173–179. [Google Scholar]
  30. Sol, D.; González-Lagos, C.; Moreira, D.; Maspons, J. Measuring tolerance to urbanization for comparative analyses. Ardeola 2013, 60, 3–13. [Google Scholar] [CrossRef]
  31. Sampson, L.; Ettman, C.K.; Galea, S. Urbanization, urbanicity, and depression: A review of the recent global literature. Curr. Opin. Psychiatry 2020, 33, 233–244. [Google Scholar] [CrossRef]
  32. Yu, B. Ecological effects of new-type urbanization in China. Renew. Sustain. Energy Rev. 2021, 135, 110239. [Google Scholar] [CrossRef]
  33. Wang, S.; Yang, C.Y.; Li, Z.H. Spatio-Temporal Evolution Characteristics and Spatial Interaction Spillover Effects of New-Urbanization and Green Land Utilization Efficiency. Land 2021, 10, 1105. [Google Scholar] [CrossRef]
  34. Zhang, Z.; Zhang, G.; Hu, Y.; Jiang, Y.; Zhou, C.; Ma, J. The evolutionary mechanism of haze collaborative governance: Novel evidence from a tripartite evolutionary game model and a case study in China. Humanit. Soc. Sci. Commun. 2023, 10, 69. [Google Scholar] [CrossRef]
  35. Zhang, Z.; Zhang, G.; Su, B. The Spatial Impacts of Air Pollution and Socio-Economic Status on Public Health: Empirical Evidence from China. Socio-Econ. Plan. Sci. 2022, 83, 101167. [Google Scholar] [CrossRef]
  36. Alfonso Piña, W.H.; Pardo Martínez, C.I. Development and urban sustainability: An analysis of efficiency using data envelopment analysis. Sustainability 2016, 8, 148. [Google Scholar] [CrossRef]
  37. Chen, M.X.; Ye, C.; Lu, D.D.; Sui, Y.; Guo, S. Cognition and construction of the theoretical connotations of new urbanization with Chinese characteristics. J. Geogr. Sci. 2019, 29, 1681–1698. [Google Scholar] [CrossRef]
  38. Haase, D.; Frantzeskaki, N.; Elmqvist, T. Ecosystem Services in Urban Landscapes: Practical Applications and Governance Implications. Ambio 2014, 43, 407–412. [Google Scholar] [CrossRef]
  39. Lin, K.; Deng, X.; Ye, J. Evaluation of Regional Ecological Well-Being Performance Based on Super- NSBM and Window DEA Model: A Case Study of Fujian Province. Ecol. Environ. Sci. 2020, 29, 2110–2117. [Google Scholar]
  40. Li, C.; Zhang, S.; Zhang, W.; Liao, X. Measurement and Influencing Factors of Inter-Provincial Ecological Well-being Performance in China. Sci. Geogr. Sin. 2019, 39, 1875–1883. [Google Scholar]
  41. Wu, J.; Bai, Z.; Eggert, R.G. Spatial and temporal changes of the ecological footprint of China’s resource-based cities in the process of urbanization. Resour. Policy 2022, 75, 102491. [Google Scholar] [CrossRef]
  42. Yan, B.; Wu, L.; Wang, X.H.; Wu, J.N. How can environmental intervention work during rapid urbanization? Examining the moderating effect of environmental performance-based accountability in China. Environ. Impact Assess. Rev. 2021, 86, 106476. [Google Scholar] [CrossRef]
  43. Zhou, L.; Xia, Y.; Chen, W. Review of low carbon development targets and relative co-benefits in China. China Popul. Resour. Environ. 2020, 30, 10–17. [Google Scholar]
  44. Ren, W.Z.; Zhang, Z.L.; Wang, Y.J.; Xue, B.; Chen, X. Measuring Regional Eco-Efficiency in China (2003–2016): A “Full World” Perspective and Network Data Envelopment Analysis. Int. J. Environ. Res. Public Health 2020, 17, 3456. [Google Scholar] [CrossRef]
  45. Dong, F.; Li, Y.F.; Gao, Y.J.; Zhu, J.; Qin, C.; Zhang, X. Energy transition and carbon neutrality: Exploring the non-linear impact of renewable energy development on carbon emission efficiency in developed countries. Resour. Conserv. Recycl. 2022, 177, 106002. [Google Scholar] [CrossRef]
  46. Charnes, A.; Cooper, W.W.; Rhodes, E. Measuring the efficiency of decision making units. Eur. J. Oper. Res. 1978, 2, 429–444. [Google Scholar] [CrossRef]
  47. Hu, Z.; Zhao, Z.; Zhang, Y.; Jing, H.; Gao, S.; Fang, J. Does ‘Forage-Livestock Balance’ policy impact ecological efficiency of grasslands in China? J. Clean. Prod. 2019, 207, 343–349. [Google Scholar] [CrossRef]
  48. Tone, K.A. Slacks-based measure of efficiency in data envelopment analysis. Eur. J. Oper. Res. 2001, 130, 498–509. [Google Scholar] [CrossRef]
  49. Hoechle, D. Robust standard errors for panel regressions with cross-sectional dependence. Stata J. 2007, 7, 281–312. [Google Scholar] [CrossRef]
  50. Zhou, Q.X.; Tong, C.F. Does Rapid Urbanization Improve Green Water-Use Efficiency? Based on the Investigation of Guangdong Province, China. Sustainability 2022, 14, 7481. [Google Scholar] [CrossRef]
  51. Tian, X.H.; Lu, F.; Xu, C.R. Ecological Efficiency Measurement and Spatial Correlation Analysis in theMiddle and Lower Reaches of the Yellow River Based on the Super-SBM Model. J. Xinyang Norm. Univ. (Philos. Soc. Sci. Ed.) 2023, 1, 89–97. [Google Scholar]
  52. Long, L.J.; Wang, X. A study on Shanghai’s ecological well-being performance. China Popul. Resour. Environ. 2017, 27, 84–92. [Google Scholar]
  53. Wang, R.; Feng, Y. Research on China’s Ecological Welfare Performance Evaluation and Improvement Path from the Perspective of High-Quality Development. Math. Probl. Eng. 2020, 2020, 5476089. [Google Scholar] [CrossRef]
  54. Wang, Z.; Wang, Z. Spatial Pattern Evolution and Influencing Factors of Ecological Welfare Performance in Yangtze River Economic Belt: Based on Super Efficiency SBM Model. Resour. Environ. Yangtze Basin 2021, 30, 2822–2832. [Google Scholar]
  55. Deng, Y.; Yang, X.; Ma, Q.; Wang, K. Regional disparity and convergence of Chinas ecological welfare performance level. China Popul. Resour. Environ. 2021, 31, 132–143. [Google Scholar]
  56. Xu, Y.D.; Qi, P.; Tong, L.F. Spatial-temporal Differentiation of Chinese Provincial Ecological Well-being Performance. Reg. Econ. Rev. 2017, 28, 123–131. [Google Scholar]
  57. Cheng, H.R. Evaluation and Analysis of High-Quality Development of New Urbanization Based on Intelligent Computing. Math. Probl. Eng. 2022, 2022, 6428970. [Google Scholar] [CrossRef]
  58. Wang, S.; Wang, J. Nonlinear relationship between municipal solid waste and economic growth: Empirical analysis based on environmental Kuznets curve. China Popul. Resour. Environ. 2022, 32, 63–70. [Google Scholar]
  59. Ahmad, M.; Rehman, A.; Shah, S.A.A.; Solangi, Y.A.; Chandio, A.A.; Jabeen, G. Stylized heterogeneous dynamic links among healthcare expenditures, land urbanization, and CO2 emissions across economic development levels. Sci. Total Environ. 2021, 753, 142228. [Google Scholar] [CrossRef]
  60. Yang, Z.H.; Tian, L. A Panel Co-integration Analysis of the Pollution Haven Hypothesis and Its Determinants in China. J. World Econ. 2017, 40, 148–172. [Google Scholar]
  61. Li, Z.; Duan, K.; Sun, T. How does Industrial Agglomeration of manufacturing Industry Affect ecological Environment?—Research on Dual Mediation Model based on Green Technology Innovation and Foreign Direct Investment. Sci. Technol. Prog. Policy 2019, 36, 51–57. [Google Scholar]
  62. Duan, X.J.; Wang, L.; Kang, J.Y.; Yan, W. Achievements in Ecological and Environmental Governance and Green Development in the Yangtze River Economic Belt. Resour. Environ. Yangtze Basin 2022, 31, 1677–1684. [Google Scholar]
  63. Wu, W.L.; Luo, S.H.; Liu, X.G. Measurement Evaluation, Dynamic Distribution and Convergent Tendency of the Inclusive Green Development in the Yangtze River Economic Belt. J. Jiangxi Univ. Financ. Econ. 2021, 6, 13–28. [Google Scholar]
  64. Arnaut, J.; Lidman, J. Environmental Sustainability and Economic Growth in Greenland: Testing the Environmental Kuznets Curve. Sustainability 2021, 13, 1228. [Google Scholar] [CrossRef]
  65. Shen, J.; Zhang, K.Y. An empirical analysis of factors leading to typical urban problems in China. Prog. Geogr. 2020, 39, 1–12. [Google Scholar] [CrossRef]
  66. Liu, J.S.; Yi, B.Z. Green Development: The New lmpetus of Urbanization in Japan. Contemp. Econ. Jpn. 2015, 204, 34–41. [Google Scholar]
  67. Liu, M.F.; Xie, H.J. Analysis of the Double Threshold Effect of Industrialization and Urbanization in the Proceed of Environment Economic Aggregation. Manag. Rev. 2017, 29, 21–33. [Google Scholar]
  68. Zhou, K.; Chen, Y.F.; Xu, Y. Associated effects and interaction mechanism of urban expansion and water pollutant emissions: A case study of the Yangtze River Delta from 2011 to 2015. Acta Ecol. Sin. 2022, 48, 3167–3180. [Google Scholar]
  69. Zhang, X.J.; Xu, W.X.; Liu, C.J. Spatiotemporal disparity of Coupling Coordination of Economic–Land–Population–Society Urbanization in Guangdong–Hong Kong–Macao Region and Its Influencing Factors. Inq. Econ. Issues 2019, 10, 54–64. [Google Scholar]
  70. Yan, D.Q.; Zhang, X.Q. An Analysis of Government Environmental Responsibility in Urbanization. J. Nanjing For. Univ. 2013, 13, 71–76. [Google Scholar]
  71. Letchumanan, R.; Kodama, F. Reconciling the conflict between the ‘pollution-haven’ hypothesis and an emerging trajectory of international technology transfer. Res. Policy 2000, 29, 59–79. [Google Scholar] [CrossRef]
  72. Taylor, C.G. Globalization and the Environment: Determinants of Firm Self-Regulation in China. J. Int. Bus. Stud. 2001, 32, 439–458. [Google Scholar]
  73. Shen, Q.J. Study on New Urbanization based on Ecological Civilization. Urban Plan. Forum 2013, 1, 29–36. [Google Scholar]
Figure 1. Distribution of provincial-level administrative regions in China (the study area is the Yangtze River Economic Belt). (a) Provincial-level administrative regions in China; (b) the Yangtze River Economic Belt.
Sustainability 15 08758 g001
Figure 2. Changes in ecological welfare performance of 11 provinces and cities in the Yangtze River Economic Belt: 2009–2020.
Sustainability 15 08758 g002
Figure 3. Spatial and temporal evolution of ecological welfare performance in key years.
Sustainability 15 08758 g003
Table 1. Calculation results of ecological welfare performance of 11 provinces and cities in the Yangtze River Economic Belt: 2009–2020.
Region200920102011201220132014201520162017201820192020
Shanghai0.5630.5830.6260.6840.7150.7870.8090.9251.0240.9911.0891.357
Jiangsu0.5470.5420.5600.5750.5940.6020.6200.6260.6360.6460.6830.711
Zhejiang0.6680.6770.7270.7820.8010.8200.8510.8790.8900.8991.0161.172
Anhui1.0380.8470.8290.8260.8400.8850.8890.8890.9030.9321.0000.951
Jiangxi1.0850.9270.9420.9520.9540.9260.9290.9280.9390.9460.9831.025
Hubei0.5510.5410.5550.5680.6680.6770.7390.7610.7770.7820.8050.799
Hunan1.0010.7570.7660.8440.8890.9241.0011.0241.0210.9040.9631.686
Chongqing0.6710.6170.6340.8260.8060.8020.8790.9101.0350.9100.9471.147
Sichuan1.0850.8230.7950.7690.8170.8190.9180.9081.0990.9221.0941.096
Guizhou1.0591.0221.0150.9851.0231.0020.9410.8920.8160.7940.9301.077
Yunnan1.0170.8730.7510.8201.0010.8390.8590.8640.8640.8601.0041.072
Table 2. Impact measurement of new urbanization on ecological welfare performance of the Yangtze River Economic Belt.
VariablesMixed-Effects ModelFixed-Effects Model
UNIT
Random-Effects Model
Coefficientp-ValueCoefficientp-ValueCoefficientp-Value
population−1.41710.000−1.63930.000−1.39080.000
economy0.02280.0000.00930.0320.02230.000
land−0.01040.001−0.01600.000−0.01060.000
social2.47170.0001.43160.0172.38920.000
fdi3.34710.0063.68850.0013.43190.004
ft−0.22320.0020.09630.405−0.21680.013
rd8.89980.0138.93070.0088.57830.003
_cons−0.03760.0410.79840.031−0.32800.081
Prob > F0.00000.00000.0000
R-squared0.56530.53340.5649
Adj R-squared0.5408----
F-value23.0418.45--
Note: For the fixed-effects model, the estimation should be followed by within-R2; for the random-effects model, the estimation should be followed by overall-R2.
Table 3. Robustness test.
VariablesExcluding Municipalities Adding Core Explanatory Variables
Coefficientp-ValueCoefficientp-Value
Population−1.37550.001−1.82220.000
Economy0.00990.0370.01150.010
Land−0.01840.001−0.01670.000
Social1.16090.0811.01800.109
Ecological----0.01180.077
Fdi5.31320.0004.65020.000
Rt0.16300.2510.10950.340
Rd6.49760.13411.34040.002
Disclaimer/Publisher’s Note: The statements, opinions and data contained in all publications are solely those of the individual author(s) and contributor(s) and not of MDPI and/or the editor(s). MDPI and/or the editor(s) disclaim responsibility for any injury to people or property resulting from any ideas, methods, instructions or products referred to in the content.

