Article

Assessment of Economic Sustainability of Cropping Systems in the Salt–Affected Coastal Zone of West Bengal, India

1
Sasya Shyamala Krishi Vigyan Kendra, Ramakrishna Mission Vivekananda Educational & Research Institute, Arapanch, Sonarpur 700150, India
2
School of Agriculture and Rural Development, Ramakrishna Mission Vivekananda Educational & Research Institute, Narendrapur Campus, Kolkata 700103, India
3
Business School, University of New England, Armidale, NSW 2351, Australia
4
Department of Agronomy, Bidhan Chandra Krishi Viswavidyalaya, Mohanpur 741252, India
5
Department of Agricultural Meteorology, Odisha University of Agriculture and Technology (OUAT), Bhubaneswar 751003, India
6
Department of Agricultural Meteorology, Bidhan Chandra Krishi Viswavidyalaya, Mohanpur 741252, India
7
Water Security Program, CSIRO Environment, Black Mountain Science and Innovation Park, Canberra, ACT 2601, Australia
*
Author to whom correspondence should be addressed.
Sustainability 2023, 15(11), 8691; https://doi.org/10.3390/su15118691
Submission received: 24 April 2023 / Revised: 24 May 2023 / Accepted: 24 May 2023 / Published: 27 May 2023

Abstract

:
Identifying productive, profitable, and less risky cropping systems is pivotal for ensuring sustainable farm–based livelihoods in the context of climatic uncertainties and market volatility, particularly in many developing nations. Conventional field crop research often identifies the best or optimal solutions based on treatment replicates at a specific point in time without considering the influence of market volatility and climatic uncertainties. To address this gap, we conducted an assessment of productivity profitability and climate– and market–uncertainty-driven risk for eleven different rice-based cropping systems (eight existing and three potential systems) in the coastal region of Gosaba Block, West Bengal, India. Farmers’ observations of the best, typical, and worst seasonal yields and price data for the selected cropping systems over the last five to seven years were collected from fifty farm households. Irrespective of the scenarios, the rice–lathyrus systems, followed by rice–onion and rice–lentil systems, recorded the lowest rice equivalent yields and system yields. However, the highest rice equivalent yields and system yields were recorded for rice–chilli systems, followed by rice–tomato and rice–potato–green-gram systems. Per hectare, total paid–out cost (TPC) of rice–tomato systems was higher, followed by rice–chilli, rice–potato–green–gram, and rice–potato systems. However, irrespective of seasonal conditions (best, normal, and worst), rice–chilli systems gave a higher net return followed by rice–tomato and rice–potato–green–gram systems. The rice–fallow system recorded the lowest value for both parameters. Under the worst seasonal conditions, the rice–onion system gave a negative net return. Under all the scenarios, the rice–chilli system gave the highest benefit over cost, followed by the rice–tomato, rice–potato–green-gram, and rice–potato systems. The cumulative probability distribution (CDF) of per ha net income of the rice–tomato system showed first–degree stochastic dominance over other systems, implying that the system is economically the most profitable and less risky. Additionally, the CDF of net income per ha of the rice–chilli system showed second–degree stochastic dominance over the rest of the systems, indicating that the system is economically more profitable and less risky than other rice/non–rice cropping systems except for the rice–tomato system. Furthermore, the risk analysis results suggest that the likelihood of obtaining negative net income was nil for the selected cropping systems, except the rice–onion system had a slight chance (<1%) of providing a negative net return. Considering the productivity and economic viability (e.g., profitability and risk) of different rice–based systems, it is recommended to promote the adoption of the rice–vegetable systems, especially rice–tomato and rice–chilli from among the existing systems and rice–potato–green-gram systems from among the potential systems, for achieving sustainable intensification in these coastal saline tracts of the region.

1. Introduction

Global food demand is expected to increase by 70–100% by 2050 [1], and sustainable development of agriculture will be crucial to meet the increasing and diverse demand with available natural resources to overcome the challenges of hunger, nutritional insecurity, unemployment, and socio–political instability [2,3]. The early efforts of agricultural intensification during the green revolution have been praised for their tremendous productivity boost but condemned for serious social and environmental externalities [4], thus advocating for sustainable forms of farming [5]. ’Sustainable intensification’ (SI) of agriculture emerged as a logical response to the sustainability crises in agriculture and developed into a loaded and debated concept across research groups [6]. Despite the similarity of SI’s unique perceived benefit, i.e., ’increased productivity without altering ecological balance’ with closely related paradigms of regenerative agriculture such as ’ecological intensification’, sustainable intensification is pitched as a broader–spectrum concept encompassing productivity, as well as economic, social, and ecological intensification [7,8,9]. Although the connotation of ’sustainable intensification of agriculture’ is often considered ambiguous [3], or even an ’oxymoron’ [10], this has been practised and promoted widely to avoid the harmful impact of conventional high–input intensive agriculture and the ever–widening problem of food and nutritional insecurity [11,12]. Many of these endeavours take the form of modifications of and transformations within existing cropping systems in smallholder agriculture [13,14]. The economic viability of these cropping systems under risky scenarios needs to be understood to strike a balance between profitability and externality in sustainable cropping systems, which is a prerequisite for upscaling cropping system intensification initiatives.
As with many agriculture–dependent countries, India negotiates the dual pressure of feeding a population of 1.27 billion [15] and sustaining the livelihoods of its 53% agrarian population [16,17]. Apart from reducing the pressure on limited agricultural lands, SI is capable of transitioning to desirable effects on soil health, the labour economy, socioeconomics, energy use, and climate resilience [18]. However, the upscaling of sustainable intensification is only possible when a shift in the cropping system and associated innovations are economically viable. This is critical in fragile ecosystems where farming is already clinging to non–remunerative margins. Despite multi-criteria assessment gaining momentum in cropping system research [19], in the present study, we confined ourselves to the economic sustainability of different cropping system intensifications in selected areas of the Indian Sundarbans because of the overwhelming importance of farm income in the region.
Economic sustainability has been used to examine the outcomes of crop production from the very beginning of the development of farm management as a distinct discipline [20]. The focus has been on investigations, factors of production and their use, farm planning and design, and their management [21]. Over the years, economic performance indicators such as cost of cultivation, gross revenue, net profit, and benefit–cost ratio became inseparable parts of cropping system assessment [22]. Where traditionally this suite of economic indicators is still used by many public agricultural research agencies, others have used the idea of economic sustainability explicitly [23]. Their work has included economic returns, subsidies given to the farmers for different inputs, and value addition. Farming Systems Research, on the other hand, developed its whole-farm-system analysis approach, which developed in parallel to so-called green revolution farm management economics [24]. Deytieux et al. [25] and Pasheai Kamali et al. [26] worked on a multi–criteria assessment of sustainability and validation of scores from different experts by producing literature reviews. Later on, Spada et al. [27] took an attempt to estimate the economic sustainability of Mediterranean crop (shell almond, fig, and olive) production using the life cycle assessment method along with different economic parameters. Ed-Dafali et al. [28] worked on the economic sustainability of industries, encompassing ambidexterity in business, orientations in marketing and entrepreneurship, and sustainable competitive advantage in the context of the fourth industrial revolution (Industry 4.0) with smart digital technologies. Research on economic sustainability in agriculture has been found to vary among different research traditions, with no single concept or approach emerging as the best. However, with the increasing risks of climate and market instability in less integrated regions, a mere description of economic indicators may not suffice for identifying sustainable cropping systems, even if they are ex ante in approach [29]. The assessed systems must be simulated under probable risky scenarios to ascertain ex ante economic sustainability [30,31], which is a clear knowledge gap in the coastal zones of India. In our study, we have tried to incorporate the risk associated with economic parameters, to add futuristic perspectives in developing resilient and profitable crop planning in coastal zones.
Crop production along with animal husbandry and forestry contribute significantly to the livelihoods of rural households in this coastal area [32]. However, agriculture has increasingly become non–remunerative due to climatic, edaphic, topographic, and drainage–related problems. Additionally, a steady workforce leaves the farm sector every year, exacerbating the situation. However, such issues do not necessarily imply that agriculture is at a point of no return. In fact, farm–based enterprises still form the main livelihood option for the rural people in Sundarbans [33,34], and they ask for efficient utilization of scarce resources to extract more output from existing production systems. Rainy (kharif) rice is central to the cropping systems in coastal West Bengal, grown in an estimated area of 3.33 lakh ha with a production of 8.15 lakh tonnes in the South 24 Parganas district [35]. Almost all cropping systems revolve around this crop, and these rice–based systems have been extensively studied for their economic and ecological performances and optimum resource use efficiencies [36]. Although there is substantial cultivation of short–duration pulse crops, vegetables, oilseeds, potato, and grain maize crops in the winter (rabi) and summer seasons in the coastal zone, the post–rice fallow system is the predominant cropping scenario (more than 80% crop fields remain fallow during the post–monsoon period) due to drainage–obstruction–associated waterlogging, lack of suitable irrigation water in dry seasons, and the problem of soil salinity [37]. Adding vegetables to the cropping systems on small farms and having access to irrigation can significantly increase farm income [38]. However, such a strategy is not free from associated biophysical, climatic, and market risks [39], and it often requires investment in farm redesign, infrastructure [40,41], and institutional innovation. These are often beyond the capability of smaller farms, and they thwart the upscaling of sustainable cropping systems.
Farmers of the coastal area often experience climate–change–related obstacles such as floods, uncertain rainfall, sea level rise, and frequent cyclones, complicating the performance of farming activities. Every year, the deltaic Sundarbans experience multi–hazard weather abnormalities, and nearly 65% households of in the region are considered economically deprived every year due to such extreme climatic events [42]. Very recently, cyclones such as Fani (during April–May 2019), Bulbul (during November 2019), Amphan (during May 2020), Yaas (during May 2021) and Sitrang (October 2022) have repeatedly caused mayhem for millions of villagers in this region and disrupted their livelihood options. Attempts have been made from different quarters of the society to relocate the distressed people and restore their destabilized economy. Such recursive climatic perturbations after extreme events trigger hydro–meteorological abnormalities in the local socio-ecological systems and necessitate reorientation and transformation in crop choice and management options. Although there are available climate–resilient technologies to improve output of existing cropping systems, nominal profitability or farmers’ noncompatible socio–economic conditions often impede the adoption of apparently beneficial crop management techniques [43]. This necessitates an estimation of present cropping systems’ feasibility and an ex ante assessment of their sustainability to identify pragmatic operations/modifications within the cropping systems to develop resilience against projected long–term climate change and associated market vulnerabilities. Recent studies have compared the techno–economic performances of different cropping systems in coastal Sundarbans [36]. However, simulation studies are necessary to understand the existing profitability assessments and associated trade–offs for the coastal region to assess the ’best’, ’normal’, and ’worse’ performance of cropping systems under economic risk associated with future climate change scenarios. Biophysical models have been instrumental in estimating the sensitivity of generic cropping system practices to climate change [43,44]. Such models have previously been used for different farming system options in the Bangladesh part of coastal Sundarbans to estimate projected crop yield [30] and economics [31] under varied climatic and soil salinity situations, as well as economic performances of the farming systems under varied sowing dates and fertilizer applications [45].
In the Indian part of Sundarbans, Bidhan Chandra Krishi Viswavidyalaya (BCKV) and the Ramakrishna Mission Vivekananda Educational & Research Institute (RKMVERI) along with the Australian Centre for International Agricultural Research (ACIAR) have conducted several research programs since 2016 in two costal area villages (Rangabelia and Jatirampur villages under Gosaba Block) of the South 24 Parganas district, West Bengal, India regarding the agricultural, social, and economic development of the coastal region, in order to implement sustainable intensification through site–specific scientific interventions.
In the present study, using a questionnaire survey with farmers from the case–study villages, we aim to estimate the productivity and economic indicators of different rice-based cropping systems and assess risk associated with long–term climate change and related market variability. First, we hypothesise that system productivity and system profitability will differ considerably among different rice–based systems in the study areas. Upon rejection of the null hypothesis, followed by a post hoc test, we expect to identify the best systems having an edge over other systems in terms of both yield and economics. Second, we hypothesise variable responses for different rice–based systems in terms of associated economic risk. Rejection of the null hypothesis will possibly lead us to discover the best cropping systems having the least risk under climate-change-related abnormalities.

2. Materials and Methods

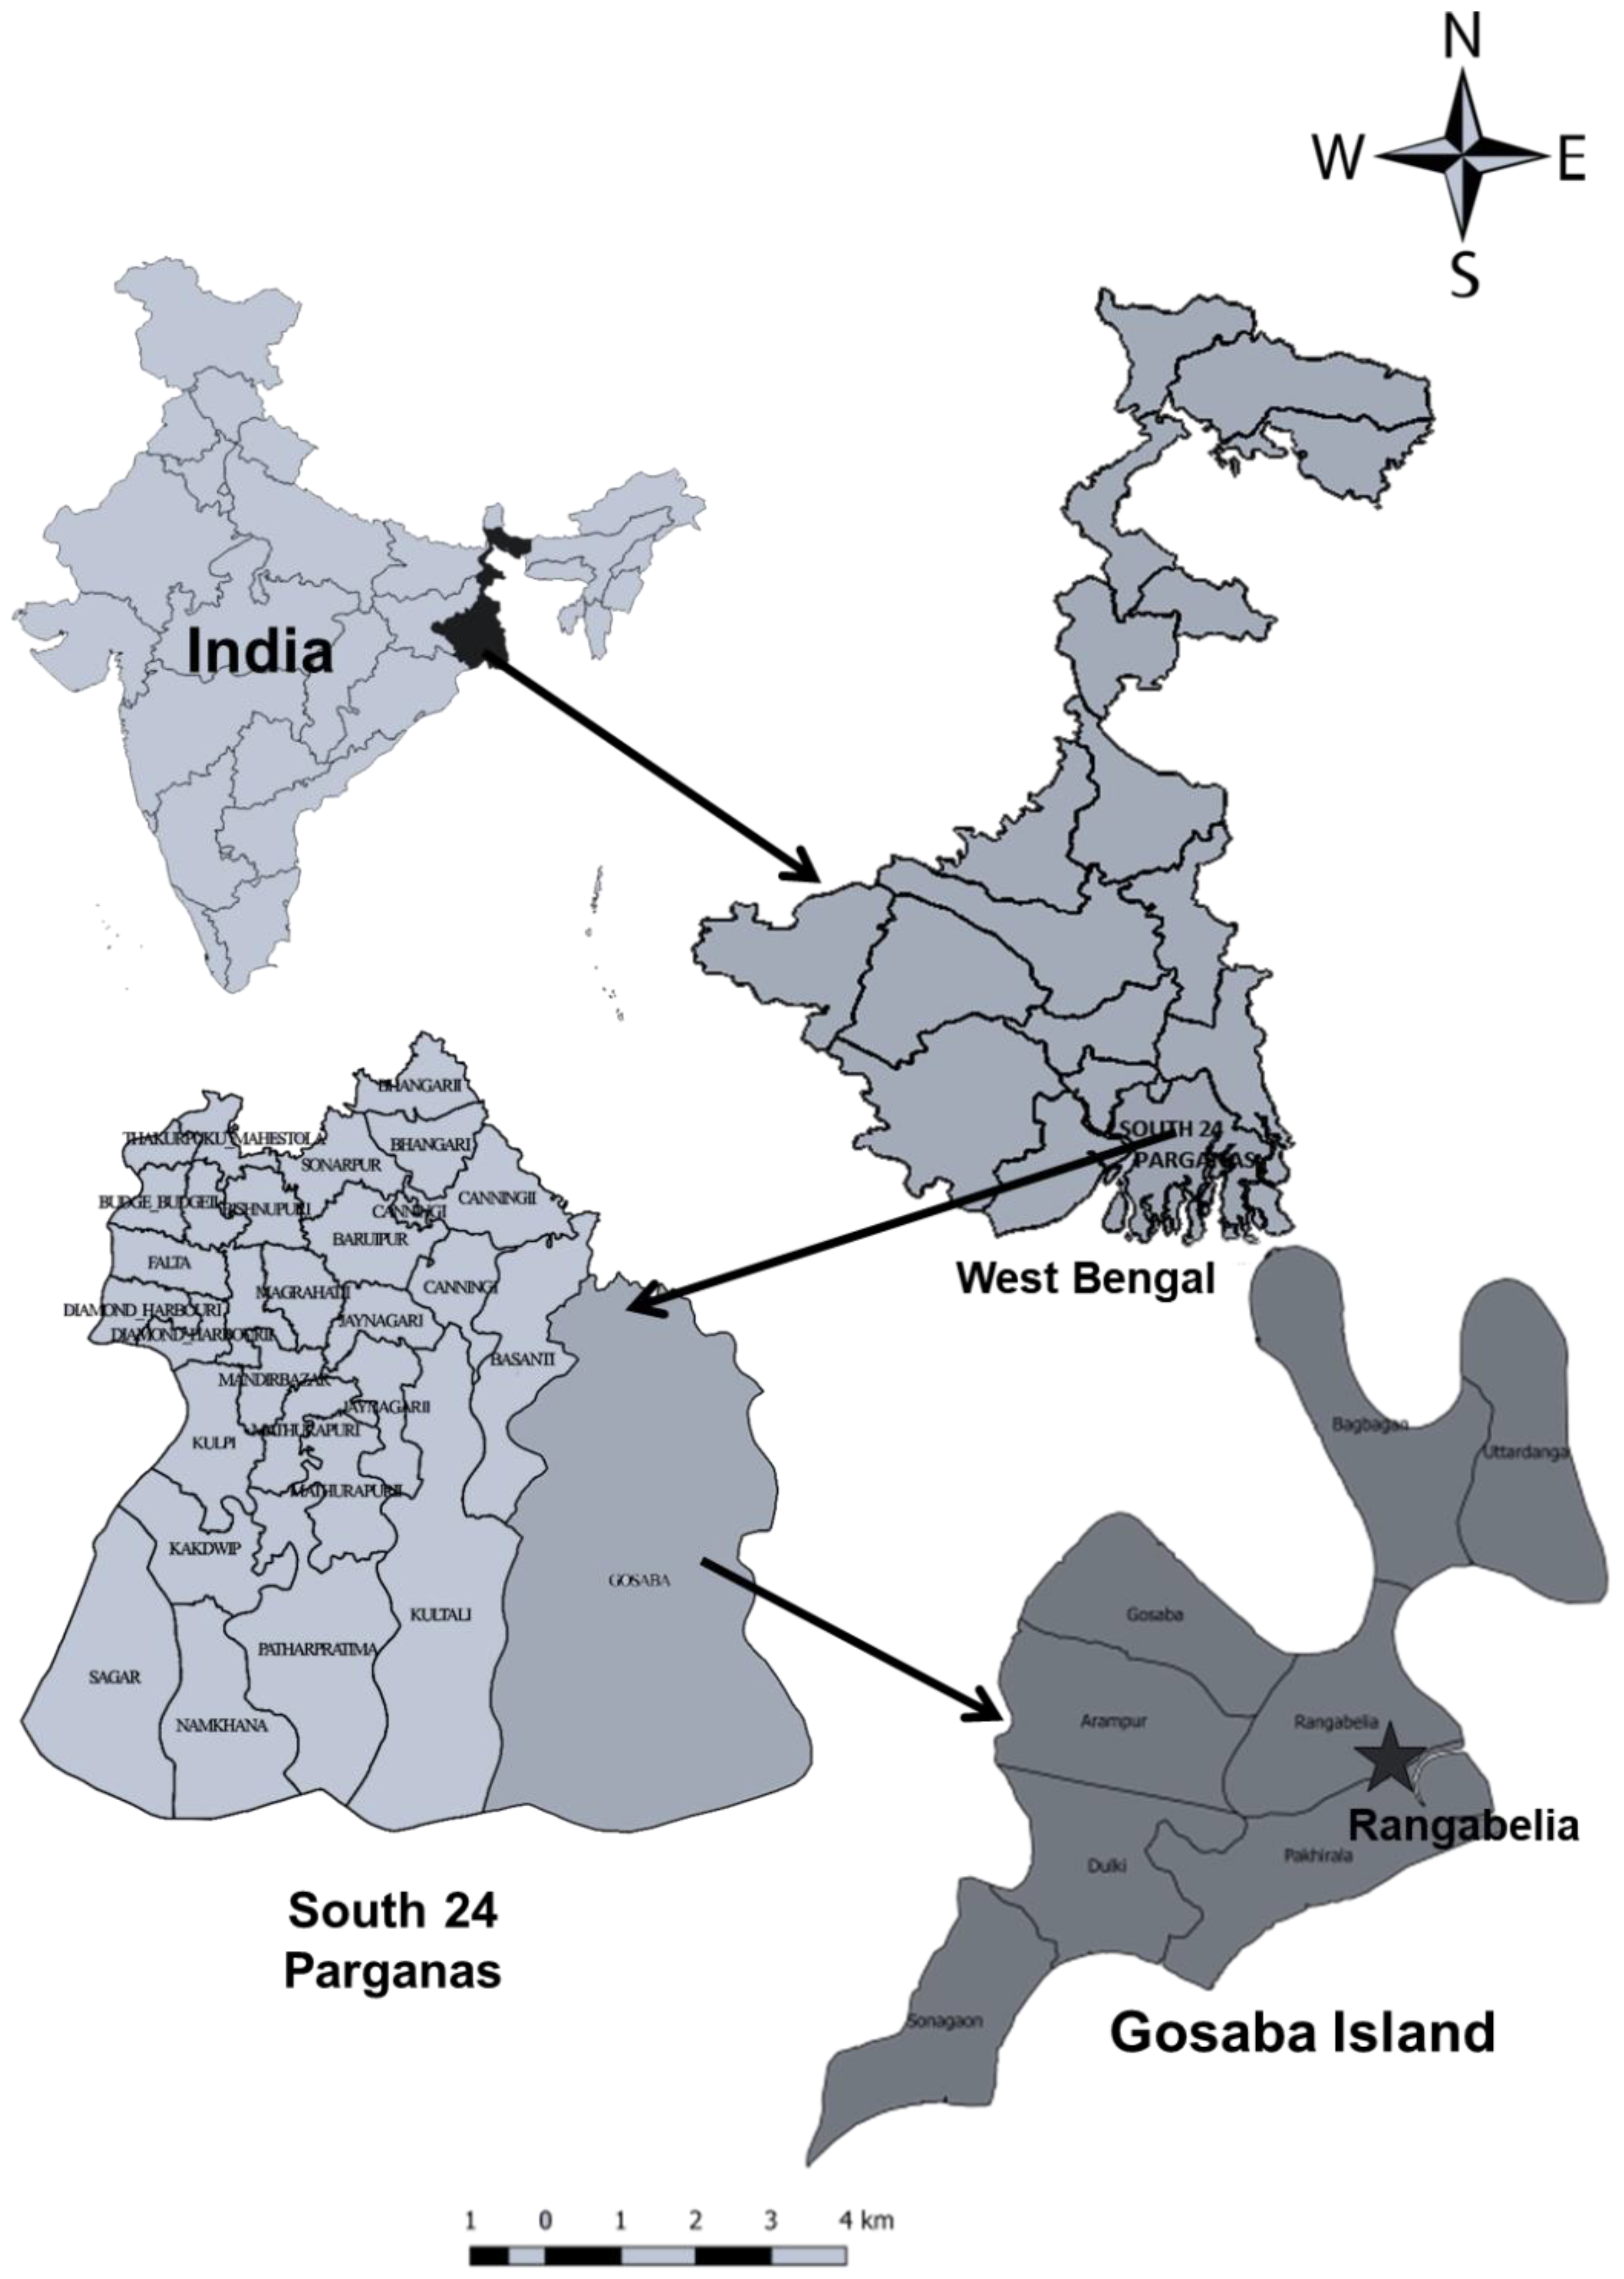
2.1. Study Location and Cropping Systems

We selected the study villages purposively from the Gosaba Block of South 24 Parganas district, West Bengal (Figure 1). Gosaba Block (located between 22°12′44″ N and 88°46′42″ E) is surrounded by the Sandeshkhali II Block of North 24 Parganas district in the north, Basanti Block in the west, and the Sundarbans forests in the east and south. Across the forests, the eastern border is bounded by the Satkhira District of Bangladesh. Gosaba Block has an area of 296.43 sq km, and owing to its low elevation, the area is extremely prone to inundation. Average annual rainfall is estimated to be around 1800 mm, more than 85% of which is received during the rainy (kharif) season, and the rest of which is received during the winter (rabi) season. The salinity of the river water is very high (about 20 dS/m) during the dry season, thus restricting its use in the crop fields. Furthermore, average groundwater level and groundwater salinity range from 0.05 to 1.93 m and 7.4 to 13.3 dS/m, respectively [46].
The majority of the respondents, in general, raised more than one crop in a year. Most of them grew two; others grew three crops in a single growing season ((kharif (rainy)—rabi(winter)—pre-kharif (summer)) on a small proportion of their land. We identified eleven major cropping systems in the study areas, of which eight systems were in practice for at least the last ten years—rice–tomato, rice–lathyrus, rice–potato, rice–fallow, rice–rice, rice–lentil, rice–onion, and rice-chilli. However, three potential systems were suggested by state government officials and scientists after conducting trials for three consecutive years in that location, viz., rice–fallow–green-gram, rice–maize, and rice–potato–green-gram (Table 1; see photographs in Supplementary Materials File S2).

2.2. Identification of Socio–Demographic and Physiographic Variables and Their Description

The variables were identified in an exploratory manner in consultation with the respondents and local project stakeholders. The questionnaire was used to record the age, primary and secondary occupation, education, caste, total family members, type of family, total land area, type of land, availability of irrigation water, soil fertility status, and perception of women’s participation in both household and agricultural activities. Details regarding the variables are summarized in Supplementary Table S1.

2.3. Primary Data Collection

The research team selected the blocks, gram panchayats, and villages purposively in consultation with the Tagore Society for Rural Development (TSRD), West Bengal, India, which is a civil society organization, working in the study locations (http://www.tsrd.org, accessed on 13 February 2023), Bidhan Chandra Krishi Viswavidyalaya (BCKV), and the State Agricultural University (SAU) at Nadia, West Bengal (http://www.bckv.edu.in, accessed on 13 February 2023) as per the mandate of the project ’Cropping system intensification in the salt-affected coastal zones of Bangladesh and West Bengal, India (CSI4CZ)’ of the Australian Centre for International Agricultural Research (ACIAR) (details available at URL: https://aciar.gov.au/project/lwr-2014-073, accessed on 13 February 2023). Initially, the team selected the key informant purposively for each village, and then, after surveying the first household, the rest of the respondents were selected using the simple random sampling (SRS) method from a manually prepared list of farmers in the study areas. The total number of respondents in the two villages was 50. The field enumerator collected data from March–May, 2019 with the help of a pretested semi-structured interview schedule. Exploratory focus group discussions (FGDs) were organized to explain the study objectives (to the interviewees) and to develop an idea about the comparative profitability of different cropping systems (for the interviewers). Additionally, we conducted ten in-depth interviews (out of the 50 respondents) with the farmers regarding their experiences of disaster-induced devastation, their survival strategies (or inability), and post–calamity market vulnerabilities.

2.4. Rice Equivalent Yield and System Yield

Rice equivalent yield (REY) of cropping systems was estimated based on dry season (both during winter and summer seasons) crop yields, as reported by farmers, as per the formula given below [22]:
REY = Y d . P d P r
where, REY is rice equivalent yield of the system (t/ha), Yd is yield of a dry season crop (t/ha), Pd is selling price of that dry season crop (Indian rupees or INR/t), and Pr is the selling price of the rice crop (INR/t).
Then REY (t/ha) was added to the rainy season rice yield (t/ha) to estimate the system yield of any of the cropping systems (t/ha).

2.5. Costs and Returns for Farm Enterprises

Economic indicators such as total paid–out cost (TPC), total imputed cost (TIC), total cost (TC), gross return (GR), net return (NR), and benefit:cost ratio (B:C ratio) for different systems were calculated as per information provided by the farmers. For both the ’paid-out’ and ’unpaid/imputed’ costs of cultivation, costs incurred for individual crop management operations (from land preparation to harvesting, and then post-harvesting operations) were considered and then summed up for any cropping system. The formula for estimation of different economic indicators was used as per Kabir et al. [45] with slight modifications:
TPC ( INR / ha ) = Total   cost   paid   to   perform   different   operations   and   purchase   different   inputs  
TIC   ( INR / ha ) = Total   cost   of   inputs   supplied   by   farm   family   ( including   family   labour   engaged   in   field   operations )
TC   ( INR / ha ) = TPC + TIC  
GR   ( INR / ha ) = Crop   yield   ( including   yield   of   byproducts ) × selling   price
NR   ( INR / ha ) = GR TC
B   : C   ratio = GR TC  
The gross and net returns and B:C ratios of different crops in a system were then summed up to obtain system returns and B:C ratios. Prevailing market prices (for the year 2018–2019) in INR for inputs and outputs for crops in different cropping systems were used for different estimations.

2.6. Risk Analysis

Cumulative density functions (CDFs) for net returns of individual crops and also for different cropping systems were determined using the program @RISK Student Version 7.5 along with Microsoft Excel. A Monte Carlo simulation was used to generate probability distributions of system yield and net returns. The lower limit was the farmers’ perceived worst case, and the upper limit was the best-case scenario [30] under varied weather conditions and market situations, excluding weather extremes that caused a complete loss of crop fields. To increase the stability of the distribution, 10,000 iterations were used to simulate the CDFs. Risk analysis was accomplished by comparing the CDFs of different cropping systems. Simple stochastic dominance concepts were used to draw logical conclusions. If individual crop/cropping system 1 is preferred more by farmers (the decision makers) to individual crop/cropping system 2, for some/any amount of net return, the former will have first-degree stochastic dominance (FSD) over the later, regardless of the utility function (in our case consumption preferences for economic products). The concept of second–degree stochastic dominance (SSD) assumes that, for a given expected net income, farmers prefer individual crop/cropping system 1 to individual crop/cropping system 2 in terms of less variability (less risk associated) to more variability (more risk associated), regardless of utility function. Using these concepts, we ranked the studied cropping systems. To predict the impact of change in a component crop’s yield and selling price in a cropping system (independent variable) on system net return (dependent variable), we performed a deterministic sensitivity analysis using a tornado chart.

2.7. Statistical Analysis

Data on the background information of the respondents and the mean values of different yield and economic parameters for different rice-based cropping systems were compared using Tukey’s honest significant difference (HSD) test method using the software SPSS v.21.0 (Version 21.0, IBM SPSS Statistics for Windows, IBM Corporation, Armonk, NY, USA). Descriptive statistics were also used to calculate the standard error of those parameters. Excel software (ver. 2007, Microsoft Inc., WA, USA) was used to draw graphs and figures.

3. Results

3.1. Socio–Demographic and Physiographic Features

More than half of the respondents (54%) interviewed were in the age group of 40–60 years, and a majority of them did not complete secondary education (82%) (Table 2). Agriculture was their primary occupation (88%), and a sizable proportion of them (72%) supplemented farm income with non–agricultural secondary occupations such as rickshaw–van pulling, running wholesale shops, working as a casual wage labourer, etc. (68%). About 88% of the respondents belonged to the general caste; the rest were scheduled castes. A portion of the families were nuclear, consisting of fewer than 5 members (48%), while the others were extended, constituted of 5–7 members (48%). A large proportion of respondents (64%) owned land, and the rest of them (36%) cultivated leased-in land. A majority of the farmers (64%) farmed on less than an acre of land, and another 28% cultivated 1–2.5 acres of land (28%). A little more than half of the farms (56%) could irrigate part of their land with surface water, while the others had constrained or no access to irrigation sources (44%). Only a negligible proportion of farmers (12%) got their soil tested, and a large portion of farmers perceived their soil to be fertile (38%) or unfertile (30%). Women’s participation was very high both in farming (86%) and household activities (92%) due to seasonal migration of their male family members.

3.2. Climatic Trends

Figure 2a,b clearly depicts the trend of weather parameters during 2014–2018. Although the maximum and minimum temperatures did not show much variability throughout these years (Figure 2a), there was considerable variability in cumulative rainfall (Figure 2b). The increments of atmospheric temperature started at the end of February and continued through the end of May. A sudden temperature drop was observed at the end of October–November during these five years. The variations in peak cumulative rainfall from July to August, and again in October, have major implications for kharif and rabi crops’ management and yield outcomes.

3.3. Farmers’ Perceptions of Climate and Market Changes

Table 3 represents the seasonal variability in yield and price of rice and non-rice crops in Rangabelia and Jatirampur villages. In consultation with farmers, we classified the performance of the crops and market prices as based on ’best’, ’typical’, and ’worst’ seasonal conditions. The seasonal yield variations in both wet (40.74%) and dry (41.54%) season rice, lathyrus (35.71%), green-gram (42.86%), and maize (34.25%) were notable. On the other hand, seasonal variability of price was markedly high for perishable crops such as tomato (53.33%), onion (44.44%), chillies (35.0%), and potato (33.33%). Price variations in lentil (42.86%) and maize (33.33%) were also high. The studied villages witnessed frequent disasters caused by salt intrusion, flood situations, and natural calamities such as cyclonic storms. These uncontrollable events cause huge losses to agricultural crops and household properties every year, and farmers repeatedly rebuild, adapt, transform, or abandon their farming practices to sustain their livelihoods. We qualitatively analysed the transcripts of the farmers’ narratives recorded during the 10 in-depth interviews, and we cite a few of them here to demonstrate climatic vulnerabilities that influence the risk analysis presented later in this article:
  • #Farmer 1: “First, there was a flood in 2006 in my area, then Aila in 2009, and now Fani in 2019… Field crops are damaged every time because of salt intrusion in crop fields… It takes time to restore normal soil conditions… For the last few years, I have been growing lathyrus, but I do not know whether we will be able to grow it in the coming rabi (winter) season (in 2019) or not, as there will be a salinity problem”.
  • #Farmer 2: “Due to these devastating effects of nature, sustainable livelihood is affected, and despite the adoption of new technologies and varieties farmers could hardly have any savings because of these recurrent cyclones or floods”.
  • #Farmer 3: “I use farm profit to meet family expenditure, but there are no extra savings because every year we have to face cyclones and floods… We concede damages to our property like homes, ponds and crop fields. And every time it takes time to recover from the situation. Not only that, the uncertain weather conditions like early monsoon also sometimes destroy the summer (pre-kharif) crops”.
  • #Farmer 9: “This year, due to the early monsoon, I incurred a huge loss, and could not manage a bag of green-gram from my plot. The price of green-gram varied from INR.35 to 45/kg in general. However, in some years it may rise up to INR.65/kg. But we seldom get an opportunity to exploit the price rise”.
  • #Farmer 10: “Chilli was once a very remunerative crop in our area. But frequent virus attack (chilli leaf curl virus) has reduced the area of chilli cultivation. The price also varies… if demand rises in the market and if it is your lucky day, you will be able to sell it at INR.120 per kg, but in normal situations, it is generally sold at INR.55 to 65 per kg”.

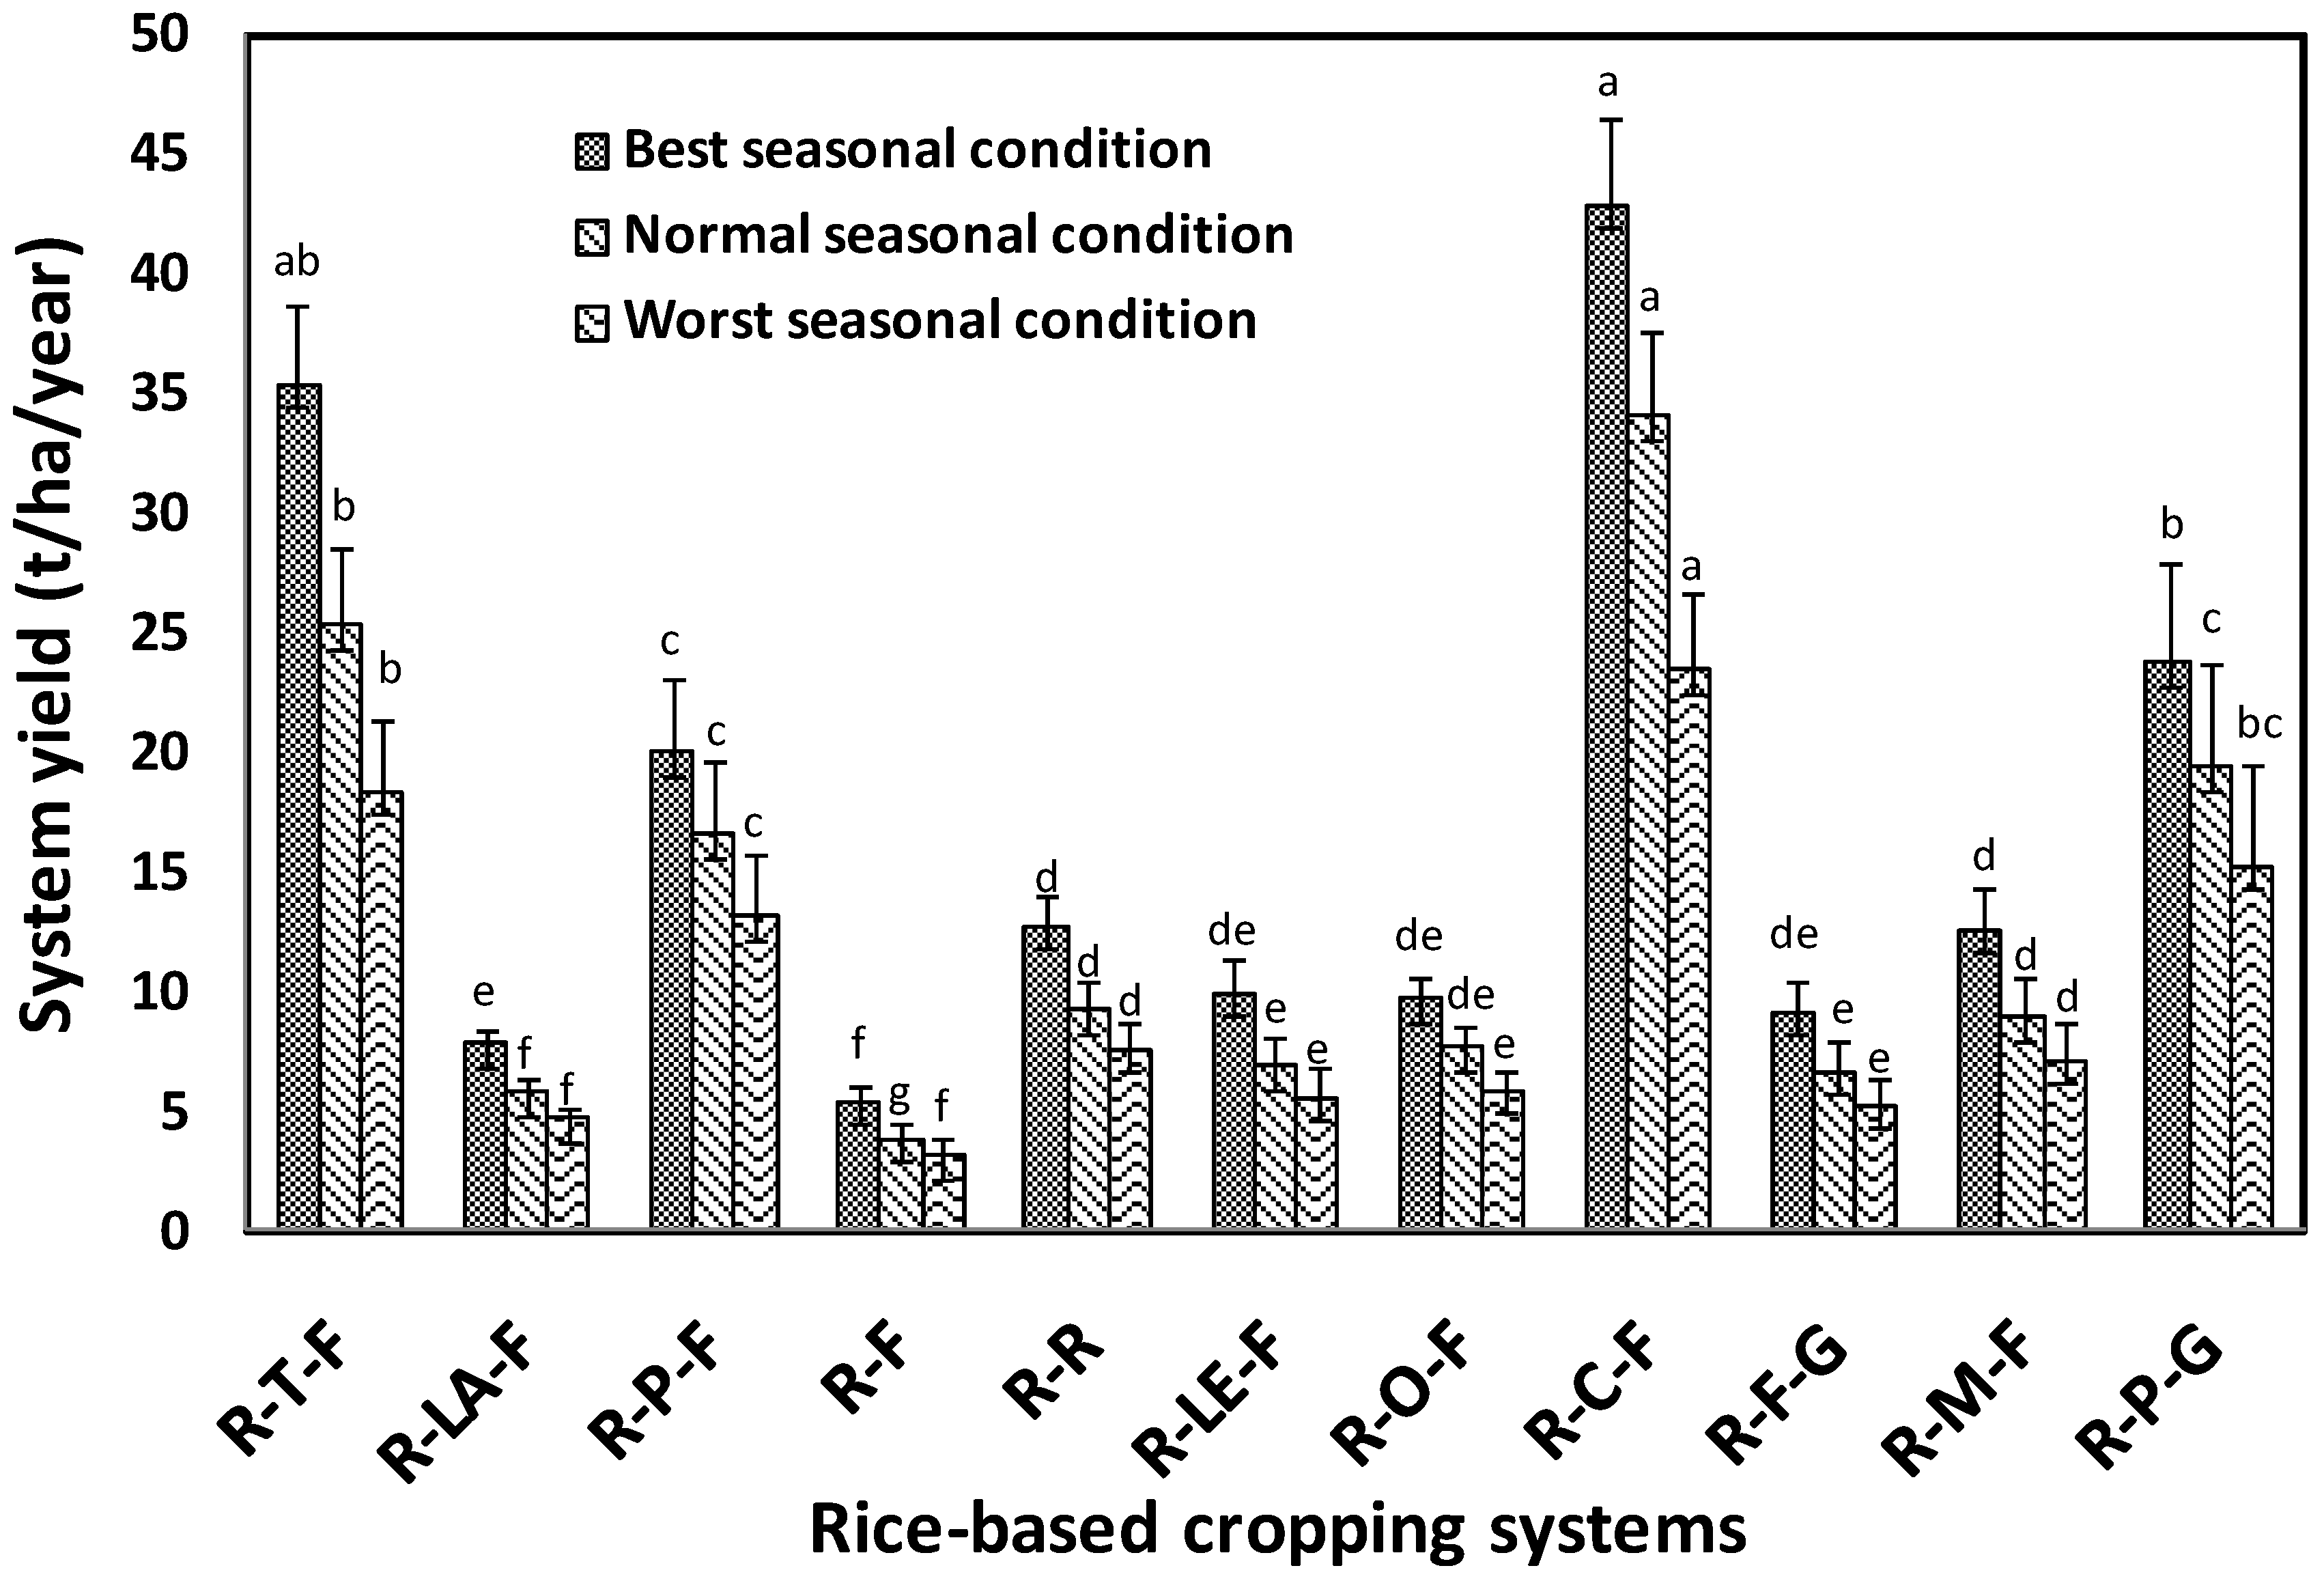
3.4. Productivity of Rice–Based Cropping Systems

The rice equivalent yield (REY) was estimated for all three situations—best, normal, and worst (Figure 3), for different existing and potential cropping systems (see Table 1 for cropping systems). Among different existing cropping systems, irrespective of the best, normal, and worst weather situations, rice–lathyrus systems recorded the lowest rice equivalent yields, followed by rice–onion and rice–lentil systems. However, the highest rice equivalent yields were recorded for rice–chilli systems, followed by rice–tomato and rice–potato–green-gram systems (Figure 3).
The system yield of different rice-based systems showed similar trends to REY (Figure 4). The highest system yield among different existing systems was estimated for rice–chilli systems, followed by rice–tomato and rice–potato systems. On the other hand, the lowest system yield was observed for rice–fallow systems. Among the potential systems, the highest system yield was estimated for rice–potato-green-gram systems, and the lowest was observed for rice–fallow–green-gram systems.

3.5. Profitability of Rice-Based Cropping Systems

Figure 5 presents the relative economic performance of existing and potential rice-based cropping systems in Rangabelia and Jatirampur villages. Per hectare total paid-out cost (TPC), total imputed cost (TIC), and total cost (TC) of the systems did not vary with climate and market variability. It was estimated that the TPC of rice–tomato systems was higher, followed by rice–chilli, rice–potato–green-gram, and rice–potato systems. However, irrespective of seasonal conditions (best, normal, and worst), rice–chilli systems recorded higher net returns followed by rice–tomato and rice–potato–green-gram systems (Figure 5). Rice–fallow systems recorded the lowest value for both these parameters. Under the worst seasonal conditions, rice–onion systems gave a negative net return (Figure 5c). It can be noted that except for rice–onion systems, combinations of rainy season rice followed by non-rice crops (in the post-monsoon dry season) in the cropping systems were economically more efficient compared to rainy season rice, followed by summer rice. Among the potential systems, it was observed that three-crop systems (rice–potato–green-gram, i.e., PCS3) gave higher net returns compared to two-crop systems (rice–fallow–green-gram, i.e., PCS1 and rice–maize, i.e., PCS2). The benefit–cost ratio of different rice-based systems is shown in Figure 6. Under both best, normal, and worst situations, the highest B:C ratios were observed for rice–chilli, rice–tomato, rice–potato–green-gram, and rice–potato systems. On the other hand, the lowest B:C ratio was observed in the case of rice–onion systems.

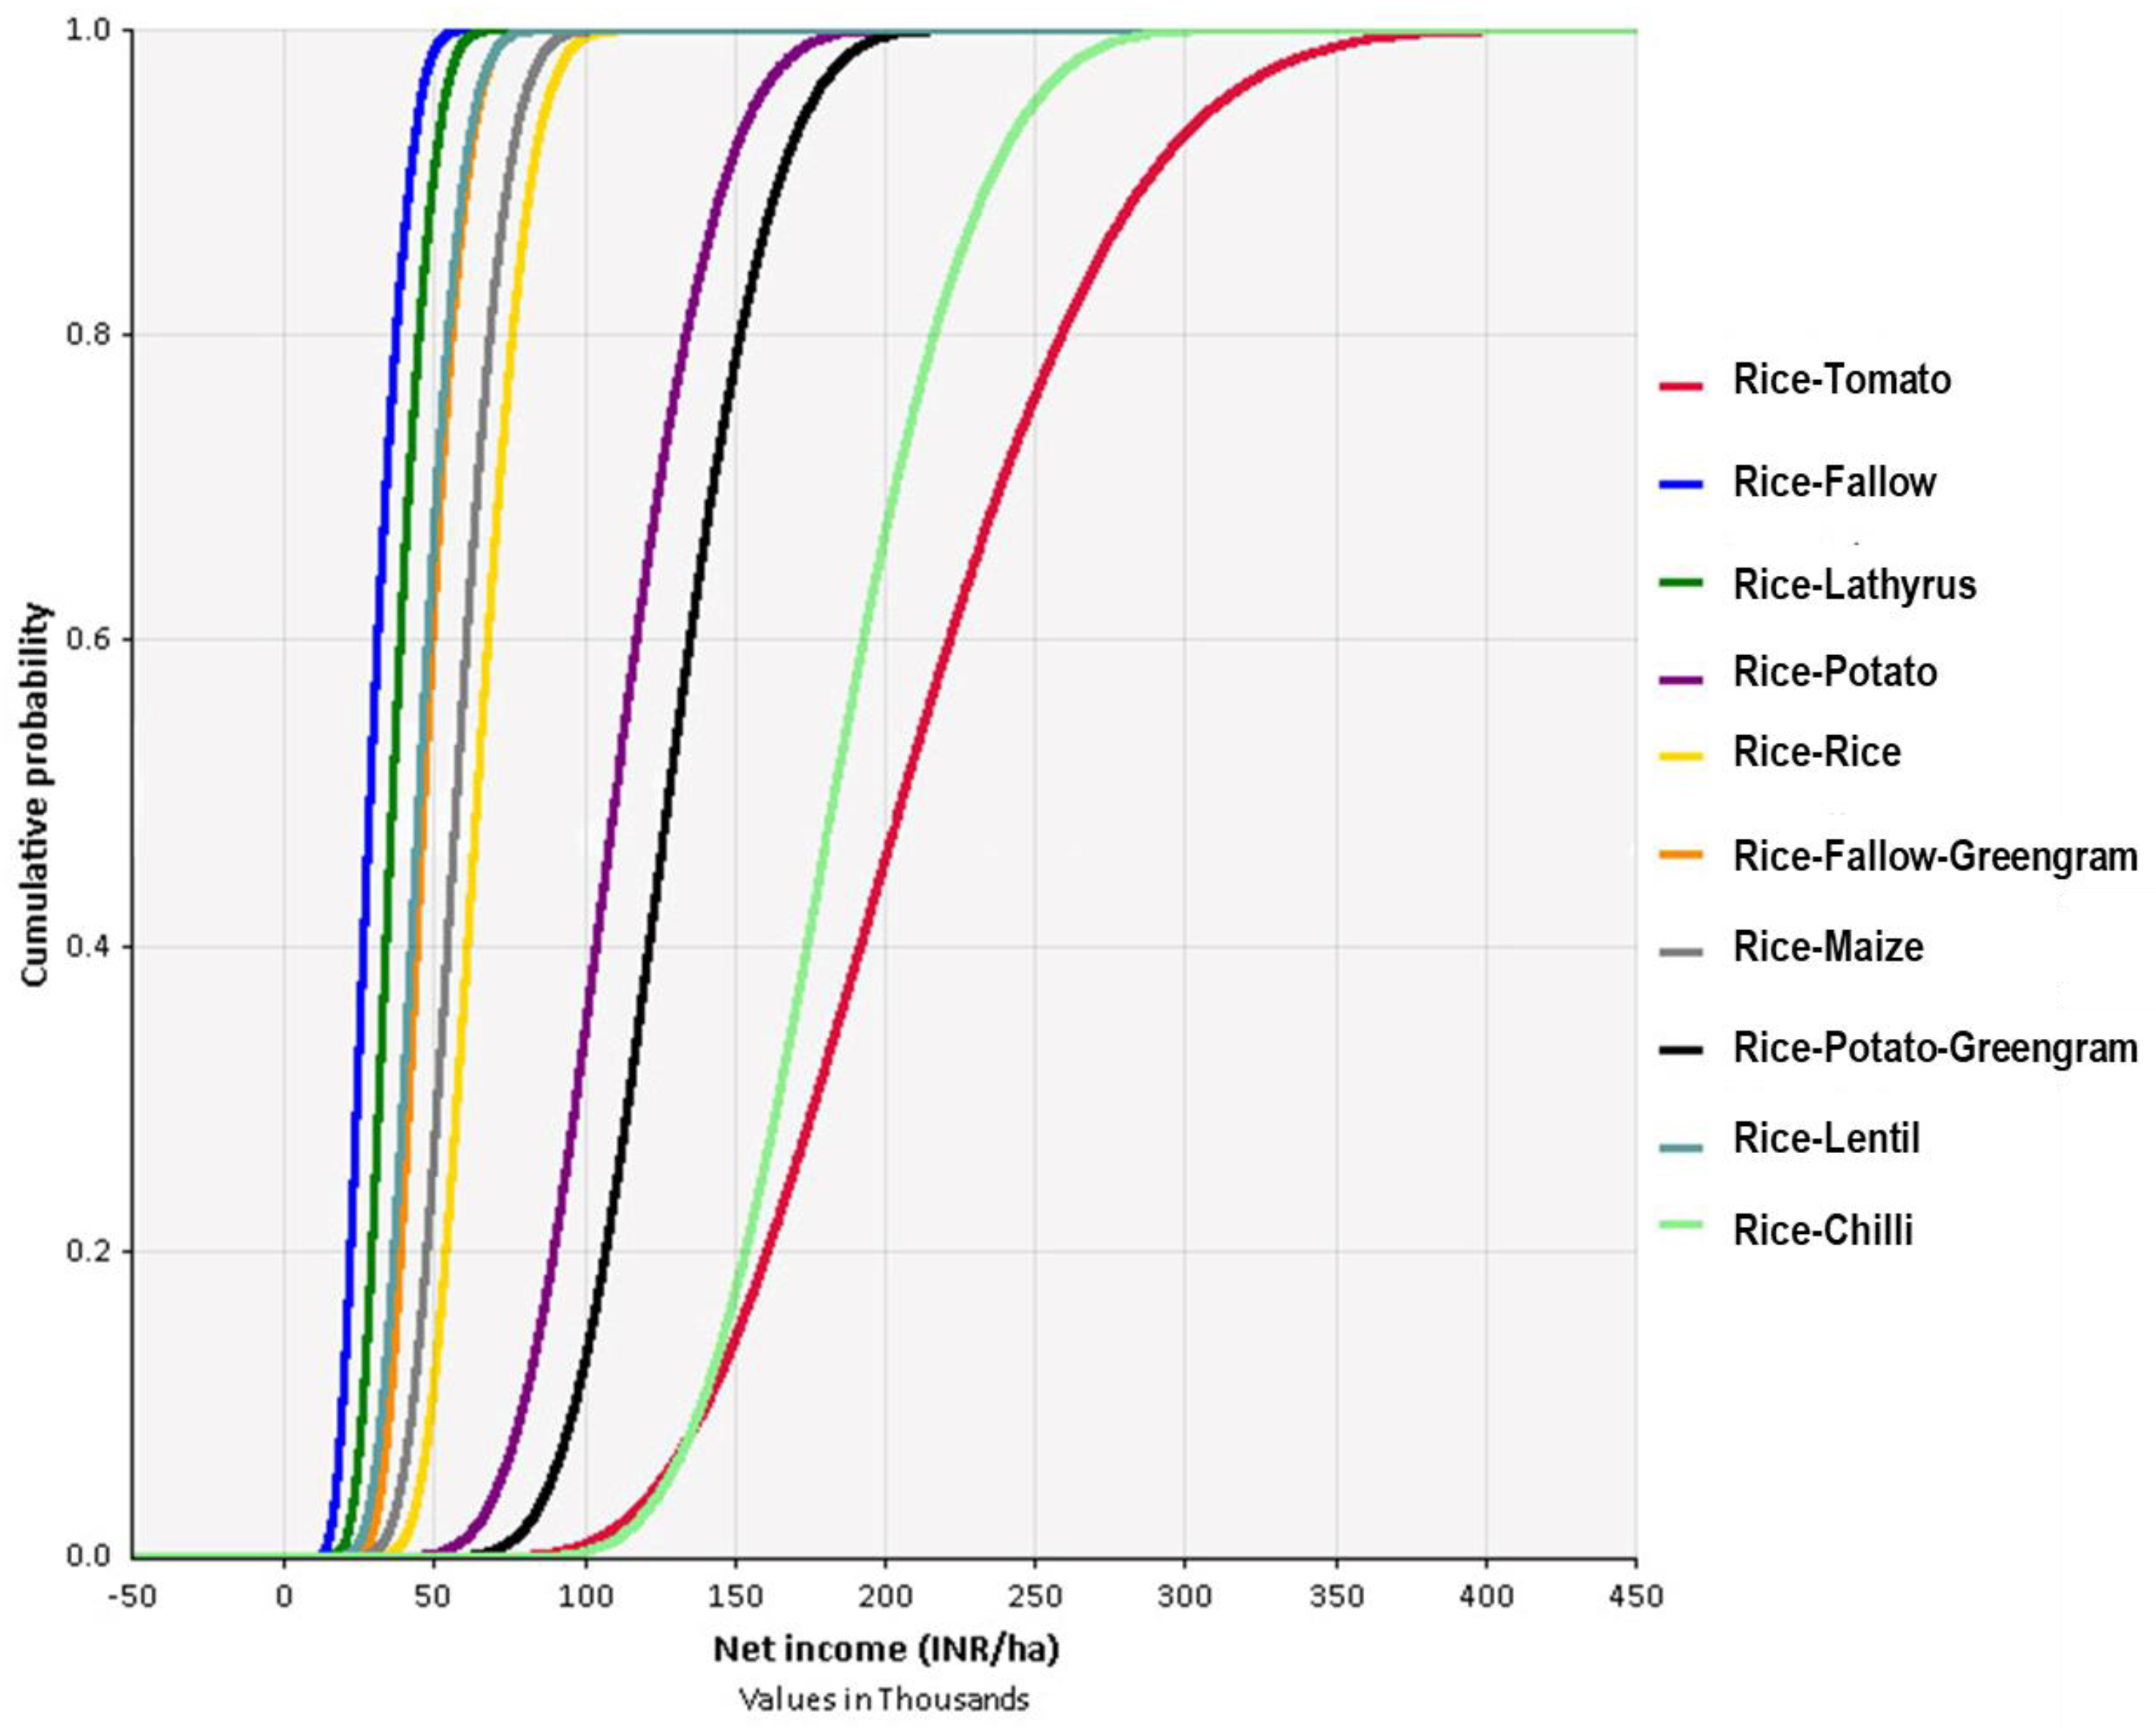
3.6. Stochastic Dominance Analysis

A stochastic dominance analysis was carried out to assess risk and returns trade-off in the existing and potential cropping systems. We performed the CDFs for all rice and non-rice crops, all existing systems, and also for existing + potential systems separately. CDFs of rice and non-rice crops in Figure 7 clearly depict that CDFs for tomatoes lie on the right side of the figure followed by chilli and potato, respectively, whereas, those for dry season rice, maize, green-gram, lentil, and lathyrus are placed in the middle position (from right to middle), and the CDF for onion is found in the left position. From Figure 8, comprising CDFs for existing rice-based cropping systems, it is observed that the CDF for rice–tomato lies on the right side, followed by CDFs for rice–chilli and rice–potato, whereas CDFs for rice–onion followed by rice–fallow are on the left side. In Figure 9, CDFs for both major existing and potential rice-based cropping systems are shown, where the CDF for rice–tomato lies on the right side, followed by rice–chilli, rice–potato–green-gram, and rice–fallow on the left side. Stochastic rankings of the cropping systems are listed in Table 4, showing the rice–chilli at first rank, followed by rice–tomato and rice–potato–green-gram systems. The lowest rank was for rice–onion systems.

3.7. Sensitivity Analysis

Table 5 and Supplementary Figures S1–S11 show how seasonal variability in yield and price impacts the net return of the cropping systems. The seasonal variability of tomato price followed by tomato yield, rice yield, and rice price contributed most to the variability in net return from the rice–tomato cropping systems. Similarly, the seasonal variability of potato price contributed most to variability in the net return of the rice–potato cropping systems, followed by potato yield, rice yield, and rice price. The seasonal variability of the price of chillies demonstrated the highest impact on variability in the net return of rice–chilli cropping systems, followed by chilli yield, rice yield, and rice price. On the other hand, seasonal variability in yield of rainfed, rainy season rice yield contributed most to variability in net income, followed by dry season rice yield, price of wet season rice, and price of dry season rice. For rice–onion systems, rice yield followed by onion price, rice price, and onion yield were found sensitive to variability in system net return. The results indicate that uncertainty in the price of non-rice crops is more responsible for seasonal fluctuation of return. On the contrary, climate–induced variability in the grain yield of rice impacts the fluctuation of the net return of the cropping systems.

4. Discussion

The rationale of the SI concept hinges on multiple objectives—(a) increasing productivity by introducing new crop varieties, crop diversification, and application of integrated crop, nutrient, and pest management practices; (b) increasing profitability by using good market linkages, less risky ventures, higher profitability, appropriate seasons for crop harvest, and good transport systems; (c) ensuring social benefits by allowing gainful participation of women farmers, as well as higher and quicker adoption and diffusion of technologies; and (d) improving ecosystem services by adopting climate-smart regenerative agriculture techniques that have low energy use, low greenhouse gas emissions, and a smaller ecological footprint of the cropping systems [8,47]. SI in agricultural practices ideally starts with identifying the most suitable cropping systems for a region. By strategically incorporating two or three crops in a system, cropping system intensification can offset the negative outcomes of a mono-cropping system on soil, environment, and economy [48]. The transition from ’cropping system intensification’ to ’sustainable intensification of cropping system’ needs further assessment of systems in terms of multiple dimensions and yardsticks sensitive to climate change and market variability [1]. In the present study, our approach is to estimate economic sustainability in the forms of costs incurred and returns received for any cropping system and to examine the vulnerability of such systems’ economic outcomes regarding climatic scenarios and choppy market situations.
Among the existing and potential cropping systems identified in our study, rice–lathyrus systems, followed by rice–fallow–green-gram and rice–onion systems recorded comparatively lowest rice equivalent yields irrespective of best, normal, and worst situations (Figure 3). However, the system yield was lowest for rice–fallow, followed by rice–lathyrus and rice–fallow–green-gram systems. The rice–fallow system, i.e., the mono-crop rainy season rice production system, has been a serious concern in the past decades. An area of almost 22.3 million ha in South Asia falls under rice–fallow systems, of which India accounts for more than 80% [49], and West Bengal state shares about 1.72 million ha of rice–fallow [16,17]. The rice–fallow system is widely reported to be intensified to improve system performance [47,49,50,51] in eastern parts of the country. Although pulse crop cultivation in post-rainy-season rice is a common intensification strategy in South Asia, especially in eastern India, the production of pulse crops is suboptimal because of their cultivation in marginal lands with poor input management practices. Apart from judicious fertilizer management, water is the most important input for pulse crops, which is often ignored by the farmers [52]. In the present study area, pulse crops are sometimes grown without irrigation in the standing crop field (e.g., using the residual moisture of paddy fields). However, application of irrigation at critical stages can enhance pulse productivity. Moisture stress at critical stages often causes low crop yield even under irrigated conditions [53]. The highest rice equivalent yield and system yield, considering both existing and potential systems, were recorded for rice–chilli, followed by rice–tomato and rice–potato–green-gram systems. An increase in cropping intensity and improvement in crop diversification in coastal Bengal between 1998–1999 and 2014–2015 suggests the significance of fruits, vegetables, and pulse crops being strategically embedded in improved interventions such as land shaping and integrated farming systems, especially after the devastating Aila cyclone [42]. Singh et al. [52] explored the role of vegetable crops in intensifying rice–fallow areas with improved agro-techniques such as drip irrigation and mulching. On the other hand, Samant [54], Yadav et al. [51], and Ray et al. [22] have estimated a higher net return vis-a-vis low risk in rice–vegetable systems. In our study, rice–tomato systems recorded the highest total paid-out cost followed by rice–chilli, rice–potato–green-gram and rice–potato systems under best, normal, and worst situations. However, irrespective of seasonal conditions, rice–chilli offered higher net return and B:C ratio than rice–tomato and rice–potato–green-gram systems.
However, our study contradicts the previous findings of Banerjee et al. [33] and Ray et al. [22] who observed higher energy and cost involvement in potato cultivation. The reason may be that unlike other parts of West Bengal where potato is sown after heavy tillage to pulverize the post-paddy soil, the coastal area is mostly dominated by zero–tillage potato cultivated areas. The zero–tillage potato has been largely acclaimed for its decent productivity, higher return from the unit land area, and higher post–harvest storability of potatoes. Our research advocates the rice–potato–green-gram system where apart from higher productivity and economics, the inclusion of green-gram crops in the summer season may significantly reduce the application of nitrogenous fertilizer and fossil fuel in the system. Other pulse crops such as lentil and lathyrus are less preferred by the farmers due to their lesser ability to withstand biotic stress situations (e.g., mid-season and terminal salinity, rainfall, etc.). Although rice–fallow systems alone recorded the lowest value of net return under the best seasonal conditions, rice–onion systems accompanied by rice–fallow systems witnessed the lowest net return in normal situations. Under the worst situation, rice–onion systems could not even provide positive returns and demonstrated the worst performance. Farmers in the coastal belt grow onions in smaller areas for subsistence purposes with minimum input investment, often without tillage. They mostly use straw mulching and organic manure and apply fewer irrigations. Although the rice–onion system yield in different seasonal conditions was almost in parity with other low-yielding systems (such as rice–pulses, rice–fallow, rice–rice), the lack of confidence among farmers regarding achievable yield and price of zero-tilled onion might have resulted in a negative net return of the system under worst seasonal conditions. The chilli crop has been documented as an important remunerative crop in coastal West Bengal before the Aila cyclone [55]. Red chilli cultivation was prevalent in more than 60% of the farming areas and was highly preferred by the farmers as they dried and stored chillies to sell them during lean months to earn a profit [56]. However, salt intrusion in the post–Aila period [57] coupled with chilli leaf curl virus outbreak [58] affected chilli–growing areas and discouraged chilli cultivation in coastal Bengal.
The variability of climatic conditions along with market accessibility can largely dictate the yield and economics of farming systems in any particular region [30]. In India, climate change and associated weather abnormalities often pose threats to crop production and food security [59,60]. Both the quality and quantity of the outcome are affected, which invariably affects selling prices of the end products. Due to limited available resources and technologies, mostly small farmers are affected by climate change, and their access to food is also drastically reduced, along with their intake of healthy food materials. If proper adaptation and mitigation strategies are not implemented in due time, average yield reduction and land use change may be significant in the coming decades [61,62]. Although the share of agriculture and allied sectors in India’s economy has decreased in the period between 1970–1971 (37%) [63] and 2020–2021 (20.2%) [64], the sector still provides livelihood opportunities to the majority of the population and can cause significant loss in gross domestic product (GDP). Thus, the assessment of major cropping systems of smallholders based on the resilience of the systems when faced with economic risks due to climate change will offer tangible and actionable policy information, considering that the ’economic sustainability’ of cropping practices necessitates that cropping systems achieve multifunctional benefits with an explicit emphasis on production economics and introduction of marketing facilities [3,65]. Discrepancies in crop yield and selling price under varied climate and market situations should be well accounted for, and risk assessment must be performed to select economically viable cropping systems. To abide by these aspects of sustainability, we performed a stochastic dominance analysis, following the method of Kabir et al. [30], to record the trade-off between such variability in yield and price components of cropping systems.
In our study, the CDF of tomato shows first–degree stochastic dominance over other rice and non-rice crops. The CDF of chilli shows second-degree stochastic dominance over other rice and non-rice crops. Further, potatoes show first-degree stochastic dominance over other crops except for tomatoes and chilli. The CDFs also show that only onion has chances (64%) to render a negative net return. On the other hand, the rest of the crops show a 100% probability to give positive net returns. In addition, tomatoes and chilli show more than an 80% probability to give net income above the upper benchmark.
The results of risk analysis indicate that tomatoes are economically more viable (higher return and less risky) followed by chillies and potatoes compared to other rice and non-rice crops. Among the different cropping systems studied, rice–tomato systems show first-degree stochastic dominance over other systems, and rice–chilli systems show second-degree stochastic dominance over the rest of the rice- and non-rice-based cropping systems. Noticeably, only rice–onion systems have a small chance (<1%) of a negative net return, whereas the rest of the cropping systems are highly likely to produce a positive net return. Further, the rice–tomato, rice–chilli, and rice–potato systems are highly likely to give a positive net return over the upper benchmark (INR100 thousand/ha).
Finally, after assessment of productivity, profitability, and risk of different rice-based systems, rice–vegetable systems, especially rice–tomato and rice–chilli systems among the existing systems and rice–potato–green-gram systems among the potential systems, can be recommended for the coastal saline zone of West Bengal as these systems can largely offset climate- and market-related uncertainty and can be tailored for socio-economic improvement and ecological stability of the study sites.
The findings of our study have several policy implications. First, public research organizations might develop or screen biotic and abiotic stress-resistant tomato, chilli, potato, and pulses through on-farm trials that fit into the existing farming systems. Second, public extension systems might draw on the identified cropping systems to develop profitable and resilient crop planning for the coastal zones in consultation with local stakeholders (e.g., public extension offices and agriculture-related bodies under the decentralized governance systems). Third, tomato and chilli are prone to certain biotic stresses and are also perishable in nature. This necessitates technology and advisory backstopping in the first place. Additionally, low-cost storage coupled with established, ‘non-exploitative’ market integration might be needed if such cropping sequences are upscaled. Small-scale value addition might also be a hedge against perishability and can leverage the existing women’s groups or farmer collectives [66]. We argue that a balanced approach of rice–tomato, rice–chilli, and rice–potato–green-gram systems may be promoted considering the different types of farmers to sustain the economic benefits promised by the identified cropping systems.

5. Conclusions

The coastal saline zone of West Bengal frequently faces climatic hazards, especially in remote island areas. Despite numerous contingency agricultural plans documented in policy papers, these are mostly ad hoc and are effective in a post-hazard scenario with limited use during a crisis period. These policies make people ‘tolerate and resist’, but they cannot ‘avoid’ the crises or make their systems progressively resilient. As successful crop choice and management sustain rural livelihoods in these areas, coherent decision making within farming communities in consultation with technologists, extension workers, and local administrations plays a crucial role before (preparedness) and after natural calamities (mitigation). Farmers traditionally change cropping sequences each year considering climatic vagaries and associated market instability. Many crops, in this way, have been discontinued and abandoned by farming communities, which otherwise would have been ‘decently’ performing cropping systems. Our study is positioned in a context that has experienced several super cyclones in the past ten years, and attempts have been made to account for existing (in practice) and potential (suggested from different field trials conducted by research institutes and extension groups) cropping systems in terms of their system yields and profits under risk averse situations. Although it is very difficult to arrive at a conclusive idea regarding ideal cropping systems from the results of a time-bound study, since extraneous complex issues go beyond statistical conclusions, the outcome of the present study uses stochastic methods and explains how quantitative system yield and economics can be jeopardized under climate and market-related risks.
Among the existing systems, we found rice–vegetables (mainly tomato and chilli) systems to be more productive and profitable than other rice-based systems. However, the study also analysed maize, zero-tillage potato, and green-gram as emerging and potential crops for rice–fallow intensification in post-rice dry seasons. The results suggest that seasonal variability in net returns from the systems was more sensitive to prices of non-rice crops and grain yield variation in rice crops. Observation of different systems’ CDFs definitely offers ideas about suitable systems under climate and market fluctuations. The rice–tomato and rice–chilli systems are first-degree and second-degree stochastically dominant systems, respectively, over other systems. This necessarily means that the likelihood of receiving a lower return is smaller for rice–tomato systems, but under uncertain adverse situations, decision makers could opt for rice–chilli systems. Since such assumptions are not very restrictive, farmers are likely to find available alternatives. We suggest choosing both rice–tomato and rice–chilli systems from among the existing systems and rice–potato–green-gram systems from among potential systems, as they are profitable and productive under uncertain situations in the coastal saline zone of West Bengal or similar agroclimatic conditions. However, we are well aware that the the perishability of vegetable crops as well as issues with pest infestation, storage, and market integration need to be addressed in order to build sound ecosystems within which such profitable cropping systems can achieve their full potential.
Even after addressing several research questions, we accept that there is room for criticism, and we suggest areas of future research to address that. First, for extending the external validity of the research outcomes, the study could have been conducted with a larger sample representing more cropping systems from a wider geographical region in order to identify the differences in productivity, profitability, and market risks associated with the cropping systems. Second, the study used a small amount of qualitative assessment based on farmers’ narratives, employing free quotations as the source of evidence. This could have been extended to thematic analysis to explore the social, economic, demographic, and cultural contexts of climate vulnerability and farmers’ acceptance/rejection of adapting cropping systems. Third, apart from economic sustainability, the study could also have attended to the food and nutritional security and environmental externalities of cropping systems and analysed their trade-offs.

Supplementary Materials

The following supporting information can be downloaded at: https://www.mdpi.com/article/10.3390/su15118691/s1, Table S1: Description of the Variables for Socio-Demographic and Physiographic Features; Figure S1: Input Ranked by Effect on Output Mean of Rice–Tomato Cropping System; Figure S2: Input Ranked by Effect on Output Mean of Rice–Lathyrus Cropping System; Figure S3: Input Ranked by Effect on Output Mean of Rice–Potato Cropping System; Figure S4: Input Ranked by Effect on Output Mean of Rice–Fallow Cropping System; Figure S5: Input Ranked by Effect on Output Mean of Rice–Rice cropping system; Figure S6: Input Ranked by Effect on Output Mean of Rice–Lentil Cropping System; Figure S7: Input Ranked by Effect on Output Mean of Rice–Onion Cropping System; Figure S8: Input Ranked by Effect on Output Mean of Rice–Chilli Cropping System; Figure S9: Input Ranked by Effect on Output Mean of Rice–Fallow–Green-Gram Cropping System; Figure S10: Input Ranked by Effect on Output Mean of Rice–Maize Cropping System; Figure S11: Input Ranked by Effect on Output Mean of Rice–Potato–Green-Gram Cropping System. File S2. Photographs of component field crops of different cropping systems.

Author Contributions

Conceptualization, K.R. (Krishnendu Ray), M.J.K. and S.S.; resources, K.B., M.K.N., R.G. and M.M.; data curation, K.R. (Kalyan Roy), S.M. (Sanchayeeta Misra), M.J.K., S.S. and R.G.; writing—original draft preparation, K.R. (Krishnendu Ray), S.M. (Suman Mondal), S.S., K.R. (Kalyan Roy), A.G., S.M. (Sanchayeeta Misra), S.G. and R.G.; writing—review and editing, R.G., M.K.N., K.B. and M.M.; visualization, R.G., M.K.N., K.B. and M.M.; supervision, M.M. All authors have read and agreed to the published version of the manuscript.

Funding

This research was funded by the Australian Centre for International Agricultural Research (ACIAR) sponsored research project, viz., ‘Cropping system intensification in the salt-affected coastal zones of Bangladesh and West Bengal, India’ (LWR/2014/073).

Institutional Review Board Statement

The study was conducted following the Human Research Ethics Procedure of CSIRO (approval number 065/15).

Informed Consent Statement

Informed consent was obtained from all subjects involved in the study.

Data Availability Statement

The data presented in this study are available on request.

Acknowledgments

Authors are thankful to the farmers from Rangabelia and Jatirampur villages of Gosaba Block, South 24 Parganas and staff from the Tagore Society for Rural Development (TSRD), Rangabelia, Gosaba for their hearty support during the study.

Conflicts of Interest

The authors declare no conflict of interest. The funders had no role in the design of the study; in the collection, analyses, or interpretation of data; in the writing of the manuscript; or in the decision to publish the results.

References

  1. Schut, M.; van Asten, P.; Okafor, C.; Hicintuka, C.; Mapatano, S.; Nabahungu, N.L.; Kagabo, D.; Muchunguzi, P.; Njukwe, E.; Dontsop-Nguezet, P.M.; et al. Sustainable intensification of agricultural systems in the Central African. Agric. Syst. 2016, 145, 165–176. [Google Scholar] [CrossRef]
  2. Xie, H.; Huang, Y.; Chen, Q.; Zhang, Y.; Wu, Q. Prospects for agricultural sustainable intensification: A review of research. Land 2019, 8, 157. [Google Scholar] [CrossRef]
  3. Reich, J.; Paul, S.S.; Snapp, S.S. Highly variable performance of sustainable intensification on smallholder farms: A systematic review. Glob. Food Secur. 2021, 30, 100553. [Google Scholar] [CrossRef]
  4. Wezel, A.; Soboksa, G.; McClelland, S.; Delespesse, F.; Boissau, A. The blurred boundaries of ecological, sustainable, and agroecological intensification: A review. Agron. Sustain. Dev. 2015, 35, 1283–1295. [Google Scholar] [CrossRef]
  5. Pretty, J. Agricultural sustainability: Concepts, principles and evidence. Philos. Trans. R. Soc. Lond. B Biol. Sci. 2008, 363, 447–465. [Google Scholar] [CrossRef]
  6. Cassman, K.G.; Grassini, P. A global perspective on sustainable intensification research. Nat. Sustain. 2020, 3, 262–268. [Google Scholar] [CrossRef]
  7. Tittonell, P.; Giller, K.E. When yield gaps are poverty traps: The paradigm of ecological intensification in African smallholder agriculture. Field Crops Res. 2013, 143, 76–90. [Google Scholar] [CrossRef]
  8. Smith, A.; Snapp, S.; Chikowo, R.; Thorne, P.; Bekunda, M.; Glover, J. Measuring sustainable intensification in smallholder agroecosystems: A review. Glob. Food Sec. 2017, 12, 127–138. [Google Scholar] [CrossRef]
  9. Cortner, O.; Garrett, R.D.; Valentim, J.F.; Ferreira, J.; Niles, M.T.; Reis, J.; Gil, J. Perceptions of integrated crop-livestock systems for sustainable intensification in the Brazilian Amazon. Land Use Policy 2019, 82, 841–853. [Google Scholar] [CrossRef]
  10. Mahon, N.; Crute, I.; Simmons, E.; Islam, M.M. Sustainable intensification-‘oxymoron’ or ’third-way’? A systematic review. Ecol. Indic. 2017, 74, 73–97. [Google Scholar] [CrossRef]
  11. Umesha, S.; Manukumar, H.M.G.; Chandrasekhar, B. Chapter 3—Sustainable agriculture and food security. In Biotechnology for Sustainable Agriculture: Emerging Approaches and Strategies; Singh, R.K., Mondal, S., Eds.; Woodland Publishing: Salt Lake City, UT, USA, 2018; pp. 67–92. [Google Scholar]
  12. Agrawal, A.; Brandhorst, S.; Jain, M.; Liao, C.; Pradhan, N.; Solomon, D. From environmental governance to governance for sustainability. One Earth 2022, 5, 615–621. [Google Scholar] [CrossRef]
  13. Tripathi, S.C.; Venkatesh, K.; Meena, R.P.; Chander, S.; Singh, G.P. Sustainable intensification of maize and wheat cropping system through pulse intercropping. Sci. Rep. 2021, 11, 18805. [Google Scholar] [CrossRef] [PubMed]
  14. Lamichhane, J.R.; Alletto, L.; Cong, W.F.; Dayoub, E.; Maury, P.; Plaza-Bonilla, D.; Reckling, M.; Saia, S.; Soltani, E.; Tison, G.; et al. Relay cropping for sustainable intensification of agriculture across temperate regions: Crop management challenges and future research priorities. Field Crops Res. 2023, 291, 108795. [Google Scholar] [CrossRef]
  15. FAO. World Food and Agriculture—Statistical [Yearbook]; FAO: Rome, Italy, 2021; Volume 2021. [Google Scholar] [CrossRef]
  16. Kumar, H.M.V.; Chauhan, N.B.; Patel, D.D.; Patel, J.B. Predictive factors to avoid farming as a livelihood. Econ. Struct. 2019, 8, 10. [Google Scholar] [CrossRef]
  17. Kumar, R.; Mishra, J.S.; Upadhyay, P.K.; Hans, H. Rice fallows in the eastern India: Problems and prospects. Indian J. Agri. Sci. 2019, 89, 567–577. [Google Scholar] [CrossRef]
  18. Zsögön, A.; Peres, L.E.P.; Xiao, Y.; Yan, J.; Fernie, A.R. Enhancing crop diversity for food security in the face of climate uncertainty. Plant J. 2022, 109, 402–414. [Google Scholar] [CrossRef]
  19. Bonnet, C.; Gaudio, N.; Alletto, L.; Raffaillac, D.; Bergez, J.E.; Debaeke, P.; Gavaland, A.; Willaume, M.; Bedoussac, L.; Justes, E. Design and multicriteria assessment of low-input cropping systems based on plant diversification in southwestern France. Agron. Sustain. Dev. 2021, 41, 65. [Google Scholar] [CrossRef]
  20. Chavas, J.P.; Chambers, R.G.; Pope, R.D. Production economics and farm management: A century of contributions. Am. J. Agric. Econ. 2010, 92, 356–375. [Google Scholar] [CrossRef]
  21. Collinson, M. Farm Management in Peasant Agriculture; Routledge: New York, NY, USA, 2019. [Google Scholar]
  22. Ray, K.; Hasan, S.S.; Goswami, R. Techno-economic and environmental assessment of different rice-based cropping systems in an inceptisol of West Bengal. India. J. Cleaner. Prod. 2018, 205, 350–363. [Google Scholar] [CrossRef]
  23. Rasul, G.; Thapa, G.B. Sustainability of ecological and conventional agricultural systems in Bangladesh: An assessment based on environmental, economic and social perspectives. Agric. Syst. 2004, 79, 327–351. [Google Scholar] [CrossRef]
  24. Darnhofer, I.; Gibbon, D.; Dedieu, B. Farming systems research: An approach to inquiry. In Farming Systems Research into the 21st Century: The New Dynamic; Springer: Berlin/Heidelberg, Germany, 2012; pp. 3–31. [Google Scholar]
  25. Deytieux, V.; Munier-Jolain, N.; Caneill, J. Assessing the sustainability of cropping systems in single- and multi-site studies. A review of methods. Eur. J. Agron. 2016, 72, 107–126. [Google Scholar] [CrossRef]
  26. Pashaei Kamali, F.; Borges, J.A.R.; Meuwissen, M.P.M.; de Boer, I.J.M.; Oude Lansink, A.G.J.M. Sustainability assessment of agricultural systems: The validity of expert opinion and robustness of a multi-criteria analysis. Agric. Syst. 2017, 157, 118–128. [Google Scholar] [CrossRef]
  27. Spada, E.; Stillitano, T.; Falcone, G.; Iofrida, N.; Gulisano, G.; De Luca, A.I. Economic sustainability assessment of Mediterranean crops: A comparative Life Cycle Costing (LCC) analysis. Front. Sustain. Food Syst. 2022, 6, 1004065. [Google Scholar] [CrossRef]
  28. Ed-Dafali, S.; Al-Azad, M.S.; Mohiuddin, M.; Reza, M.N.H. Strategic orientations, organizational ambidexterity, and sustainable competitive advantage: Mediating role of industry 4.0 readiness in emerging markets. J. Cleaner. Prod. 2023, 401, 136765. [Google Scholar] [CrossRef]
  29. Sadok, W.; Angevin, F.; Bergez, J.É.; Bockstaller, C.; Colomb, B.; Guichard, L.; Reau, R.; Doré, T. Ex ante assessment of the sustainability of alternative cropping systems: Implications for using multi-criteria decision-aid methods. A review. Agron. Sustain. Dev. 2008, 28, 163–174. [Google Scholar] [CrossRef]
  30. Kabir, M.J.; Cramb, R.; Gaydon, D.S.; Roth, C.H. Bio-economic evaluation of cropping systems for saline coastal Bangladesh: III Benefits of adaptation in current and future environments. Agric. Syst. 2018, 161, 28–41. [Google Scholar] [CrossRef]
  31. Kabir, J.; Cramb, R.; Gaydon, D.S.; Roth, C.H. Bio-economic evaluation of cropping systems for saline coastal Bangladesh: II. Economic viability in historical and future environments. Agric. Syst. 2017, 155, 103–115. [Google Scholar] [CrossRef]
  32. Mainuddin, M.; Karim, F.; Gaydon, D.S.; Kirby, J.M. Impact of climate change and management strategies on water and salt balance of the polders and islands in the Ganges Delta. Sci. Rep. 2021, 11, 7041. [Google Scholar] [CrossRef]
  33. Banerjee, H.; Sarkar, S.; Ray, K. Energetics, GHG emissions and economics in nitrogen management practices under potato cultivation: A farm level study. Energy Ecol. Environ. 2017, 2, 250–258. [Google Scholar] [CrossRef]
  34. Ghosh, S.; Mistri, B. Drainage induced waterlogging problem and its impact on farming system: A study in Gosaba Island, Sundarban, India. Spat. Inf. Res. 2020, 28, 709–721. [Google Scholar] [CrossRef]
  35. Directorate of Agriculture, Government of West Bengal. Area, yield and production of major field crops. In Evaluation Wing, Directorate of Agriculture; Government of West Bengal: Kolkata, India, 2021. [Google Scholar]
  36. Ray, K.; Sen, P.; Goswami, R.; Sarkar, S.; Brahmachari, K.; Ghosh, A.; Nanda, M.K.; Mainuddin, M. Profitability, energetics and GHGs emission estimation from rice-based cropping systems in the coastal saline zone of West Bengal, India. PLoS ONE 2020, 15, e0233303. [Google Scholar] [CrossRef]
  37. Ghosh, S.; Mistri, B. Coastal agriculture and its challenges: A case study in Gosaba Island, Sundarban, India. Space Cult. 2020, 8, 140–154. [Google Scholar] [CrossRef]
  38. Mandal, S.; Sarangi, S.K.; Mainuddin, M.; Mahanta, K.K.; Mandal, U.K.; Burman, D.; Digar, S.; Sharma, P.C.; Maji, B. Cropping system intensification for smallholder farmers in coastal zone of West Bengal, India: A socio-economic evaluation. Front. Sustain. Food Syst. 2022, 6, 1001367. [Google Scholar] [CrossRef]
  39. Jamal, M.R.; Kristiansen, P.; Kabir, M.J.; Lobry de Bruyn, L. Cropping systems intensification and diversification: Risk, vulnerability and adaptation in southwest coastal Bangladesh. Int. J. Sustain. Dev. World Ecol. 2022, 29, 677–694. [Google Scholar] [CrossRef]
  40. Mandal, U.K.; Burman, D.; Bhardwaj, A.K.; Nayak, D.B.; Samui, A.; Mullick, S.; Mahanta, K.; Lama, T.D.; Maji, B.; Mandal, S.; et al. Waterlogging and coastal salinity management through land shaping and cropping intensification in climatically vulnerable Indian Sundarbans. Agric. Water Manag. 2019, 216, 12–26. [Google Scholar] [CrossRef]
  41. Prusty, A.K.; Natesan, R.; Panwar, A.S.; Jat, M.L.; Tetarwal, J.P.; López-Ridaura, S.; Toorop, R.A.; Akker, J.V.D.; Kaur, J.; Ghasal, P.C.; et al. Redesigning of farming systems using a multi-criterion assessment tool for sustainable intensification and nutritional security in Northwestern India. Sustainability 2022, 14, 3892. [Google Scholar] [CrossRef]
  42. Mandal, S. Risks and profitability challenges of agriculture in Sundarbans India. In The Sundarbans: A Disaster-Prone Eco-Region, Coastal Research; Sen, H.S., Ed.; Springer Nature: Basel, Switzerland, 2019; pp. 353–371. [Google Scholar] [CrossRef]
  43. Hassan, A.; Wahid, S.; Shrestha, M.L.; Rashid, M.A.; Ahmed, T.; Mazumder, A.; Sarker, M.H.; Md. Tamim Al Hossain, B.; Mumu, S.; Sarker, M.H. Climate change and water availability in the Ganges-Brahmaputra-Meghna Basin: Impact on local crop production and policy directives. In Research Insights on Climate and Water in the Hindu Kush Himalayas; Vaidya, R., Sharma, E., Eds.; International Centre for Integrated Mountain Development (ICIMOD): Kathmandu, Nepal, 2014; pp. 97–108. [Google Scholar]
  44. Lázár, A.N.; Clarke, D.; Adams, H.; Akanda, A.R.; Szabo, S.; Nicholls, R.J.; Matthews, Z.; Begum, D.; Saleh, A.F.M.; Abedin, A.; et al. Agricultural livelihoods in coastal Bangladesh under climate and environmental change-a model framework. Environ. Sci. Process. Impacts. 2015, 17, 1018–1031. [Google Scholar] [CrossRef]
  45. Kabir, M.J.; Gaydon, D.S.; Cramb, R.; Roth, C.H. Bio-economic evaluation of cropping systems for saline coastal Bangladesh: I. Biophysical simulation in historical and future environments. Agric. Syst. 2018, 162, 107–122. [Google Scholar] [CrossRef]
  46. MainMainuddin, M.; Kirby, M.; Gaydon, D.; Glover, M.; Janardhanan, S.; Yu, Y.; Bell, R.; Barrett-Lennard, E.; Ali, A.; Saha, R.R.; et al. (Eds.) Cropping System INTENSIFICATION in the Salt Affected Coastal Zones of Bangladesh and West Bengal, India; Project summary report; CSIRO: Perth, Australia, 2021; 27p. [Google Scholar]
  47. Kabir, M.J.; Cramb, R.; Alauddin, M.; Gaydon, D.S. Farmers’ perceptions and management of risk in rice-based farming systems of south-west coastal Bangladesh. Land Use Policy 2019, 86, 177–188. [Google Scholar] [CrossRef]
  48. Tittonell, P. Ecological intensification of agriculture—Sustainable by nature. Curr. Opin. Environ. Sustain. 2014, 8, 53–61. [Google Scholar] [CrossRef]
  49. Kumar, R.; Mishra, J.S.; Rao, K.K.; Mondal, S.; Hazra, K.K.; Choudhary, J.S.; Hans, H.; Bhatt, B.P. Crop rotation and tillage management options for sustainable intensification of rice-fallow agro-ecosystem in eastern India. Sci. Rep. 2020, 10, 11146. [Google Scholar] [CrossRef] [PubMed]
  50. Bogužas, V.; Skinulienė, L.; Butkevičienė, L.M.; Steponavičienė, V.; Petrauskas, E.; Maršalkienė, N. The effect of monoculture, crop rotation combinations, and continuous bare fallow on soil CO2 emissions, earthworms, and productivity of winter rye after a 50-year period. Plants 2022, 11, 431. [Google Scholar] [CrossRef] [PubMed]
  51. Yadav, G.S.; Lal, R.; Meena, R.S.; Datta, M.; Babu, S.; Das, A.; Layek, J.; Saha, P. Energy budgeting for designing sustainable and environmentally clean/safer cropping systems for rainfed rice fallow lands in India. J. Cleaner. Prod. 2017, 158, 29–37. [Google Scholar] [CrossRef]
  52. Singh, A.K.; Das, B.; Mali, S.S.; Bhavana, P.; Shinde, R.; Bhatt, B.P. Intensification of rice-fallow cropping systems in the Eastern Plateau region of India: Diversifying cropping systems and climate risk mitigation. Clim. Dev. 2020, 12, 791–800. [Google Scholar] [CrossRef]
  53. Ray, L.I.P.; Swetha, K.; Singh, A.K.; Singh, N.J. Water productivity of major pulses—A review. Agric. Water. Manag. 2023, 281, 108249. [Google Scholar] [CrossRef]
  54. Samant, T.K. System productivity, profitability, sustainability and soil health as influenced by rice-based cropping systems under mid central table land zone of Odisha. Int. J. Agric. Sci. 2015, 7, 746–749. [Google Scholar]
  55. Samanta, B. Changing scenario of red chilli cultivation after Cyclone Aila in Haripur. Int. J. Res. Anal. Rev. 2018, 5, 920–925. [Google Scholar]
  56. Lahiri, K. Role of Participatory Management for Livelihood Resurgence in Sundarban Region with Special Reference to Sagar Island and Canning Blocks. 2011. Sodhganga. Available online: http://shodhganga.inflibnet.ac.in/handle/10603/155888 (accessed on 12 April 2023).
  57. Debnath, A. Condition of agricultural productivity of Gosaba C.D. Block, South24 Parganas, West Bengal, India after severe Cyclone Aila. Int. J. Sci. Res. Publ. 2013, 3, 1–4. [Google Scholar]
  58. Patel, L.C.; Mondal, C.K. Management of causal agents of chilli leaf curl complex through bio-friendly approaches. J. Plant Prot. Sci. 2013, 5, 20–25. [Google Scholar]
  59. Aggarwal, P.K. Global climate change and Indian agriculture: Impacts, adaptation and mitigation. Indian J. Agric. Sci. 2008, 78, 911–919. [Google Scholar]
  60. Pathak, H. Impact, adaptation, and mitigation of climate change in Indian agriculture. Environ. Monit. Assess. 2022, 195, 52. [Google Scholar] [CrossRef]
  61. Guntukula, R. Assessing the impact of climate change on Indian agriculture: Evidence from major crop yields. J. Public Aff. 2020, 20, e2040. [Google Scholar] [CrossRef]
  62. Birthal, P.S.; Hazrana, J.; Negi, D.S.; Bhan, S.C. Climate change and land-use in Indian agriculture. Land Use Policy 2021, 109, 105652. [Google Scholar] [CrossRef]
  63. Birthal, P.S.; Khan, T.; Negi, D.S.; Agarwal, S. Impact of climate change on yields of major food crops in India: Implications for food security. Agric. Econ. Res. Rev. 2014, 27, 145–155. [Google Scholar] [CrossRef]
  64. Department of Economic Affairs, Ministry of Finance, Government of India. Economic Survey 2012-22. 2022; p. 236. Available online: https://www.indiabudget.gov.in/economicsurvey/ebook_es2022/index.html#p=262 (accessed on 10 April 2023).
  65. Kassie, M.; Teklewold, H.; Jaleta, M.; Marenya, P.; Erenstein, O. Understanding the adoption of a portfolio of sustainable intensification practices in eastern and southern Africa. Land Use Policy 2015, 42, 400–411. [Google Scholar] [CrossRef]
  66. Chebrolu, S.P.; Dutta, D. Managing sustainable transitions: Institutional innovations from india. Sustainability 2021, 13, 6076. [Google Scholar] [CrossRef]
Figure 1. Location map of the study area (21.920° N latitude and 88.800° E longitude). (The figure is drawn from the CIA (public domain) (https://www.cia.gov/library/publications/the-world-factbook/index.html, accessed on 20 February 2023) that complies with the CC BY 4.0 license).
Sustainability 15 08691 g001
Figure 2. Monthly average temperature (a) and cumulative monthly rainfall (b) of the study region during 2014–2018.
Sustainability 15 08691 g002
Figure 3. Rice equivalent yield of dry and summer season crops in Rangabelia and Jatirampur villages. Error bars represent the standard error of means. Bars representing the mean values with different letters at the outside end are significantly different at p < 0.05 (otherwise statistically at par) based on Tukey’s honest significant difference (HSD) test. (Note: R–T: rice–tomato, R–LA: rice–lathyrus, R–P: rice–potato, R–F: rice–fallow, R–R: rice–rice, R–LE: rice–lentil, R–O: rice–onion, R–C: rice–chilli, R–F–G: rice–fallow–green-gram, R–M: rice–maize, R–P–G: rice–potato–green-gram).
Sustainability 15 08691 g003
Figure 4. Total system productivity of existing and some potential rice-based cropping systems in Rangabelia and Jatirampur villages. The error bars represent the standard error of means. Bars representing the mean values with different letters at the outside end are significantly different at p < 0.05 (otherwise statistically at par) based on Tukey’s honest significant difference (HSD) test. (Note: R–T: rice–tomato, R–LA: rice–lathyrus, R–P: rice–potato, R–F: rice–fallow, R–R: rice–rice, R–LE: rice–lentil, R–O: rice–onion, R–C: rice–chilli, R–F–G: rice–fallow–green-gram, R–M: rice–maize, R–P–G: rice–potato–green-gram).
Sustainability 15 08691 g004
Figure 5. Profitability of existing and potential rice-based cropping systems under best (a), normal (b), and worst (c) seasonal conditions in Rangabelia and Jatirampur villages. Bars for the mean values with the letter ‘a’ represent their significantly highest values at p < 0.05 generated using Tukey’s honest significant difference (HSD) test. (Note: TPC: total paid out cost, TIC: total imputed cost, GR: gross return, NR: net return, ECS1: rice–tomato, ECS2: rice–lathyrus, ECS3: rice–potato, ECS4: rice–fallow, ECS5: rice–rice, ECS6: rice–lentil, ECS7: rice–onion, ECS8: rice–chilli, PCS1: rice–fallow–green-gram, PCS2: rice–maize, PCS3: rice–potato–green-gram).
Sustainability 15 08691 g005
Figure 6. Benefit:cost ratio of different rice-based systems of the study area under best, normal, and worst situations. Error bars represent standard error of means. Bars representing the mean values with different letters at the outside end are significantly different at p < 0.05 (otherwise statistically at par) as per Tukey’s honest significant difference (HSD) test. (Note: ECS1: rice–tomato, ECS2: rice–lathyrus, ECS3: rice–potato, ECS4: rice–fallow, ECS5: rice–rice, ECS6: rice–lentil, ECS7: rice–onion, ECS8: rice–chilli, PCS1: rice–fallow–green-gram, PCS2: rice–maize, PCS3: rice–potato–green-gram).
Sustainability 15 08691 g006
Figure 7. Cumulative probability distribution (CDF) of net income of rice and non–rice crops from the study area based on current prices and last five years’ yields (Note: DS: dry season).
Sustainability 15 08691 g007
Figure 8. Cumulative probability distribution (CDF) of net income for existing major rice–based cropping systems in Rangabelia and Jatirampur villages. (Notes: CDFs were developed based on farmers’ perceived seasonal variability in yields and prices of rice and non–rice crops over the last five years).
Sustainability 15 08691 g008
Figure 9. Cumulative probability distribution (CDF) of eight existing major and three potential rice–based cropping systems in Rangabelia and Jatirampur villages. Notes: CDFs were developed based on farmers’ perceived seasonal variability in yields and prices of rice and non–rice crops over the last five years.
Sustainability 15 08691 g009
Table 1. Existing and potential cropping systems in Rangabelia and Jatirampur villages.
Cropping SystemWet SeasonDry SeasonEarly Wet Season
ExistingRiceTomatoFallow
RiceLathyrusFallow
RicePotatoFallow
RiceFallowFallow
RiceRiceFallow
RiceLentilFallow
RiceOnionFallow
RiceChilliFallow
PotentialRiceFallowGreen-gram
RiceMaizeFallow
RicePotatoGreen-gram
Table 2. Socio-demographic and perceived physiographic features in Rangabelia and Jatirampur villages.
VariablesFrequency (%)
Age (years)
<4010 (20)
40–6027 (54)
>6013 (26)
Primary occupation
Agriculture44 (88)
Non-agriculture6 (12)
Secondary occupation
Agriculture2 (4)
Non-agriculture34 (68)
Nil14 (28)
Education (class)
<1041 (82)
10–118 (16)
≥121 (2)
Caste
General44 (88)
Schedule caste6 (12)
Total family members (number)
<524 (48)
5–724 (48)
>72 (4)
Family type
Nuclear38 (76)
Extended12 (24)
Tenurial status of land
Own land32 (64)
Leased-in land18 (36)
Total operational land (acre) *
<132 (64)
1–2.514 (28)
>2.54 (8)
Irrigation availability
Unirrigated22 (44)
Irrigated28 (56)
Soil testing performed or not
Not performed44 (88)
Performed6 (12)
Fertility status of soil
Fertile16(32)
Medium fertile19 (38)
Unfertile15 (30)
Perception about women’s participation in agricultural activities
Active participation43 (86)
No participation7 (14)
Perception about women’s participation in household activities
Active participation46 (92)
No participation4 (8)
* 1 acre = 0.4 ha.
Table 3. Seasonal variability of yield (t/ha) and market price (INR/kg) of rice and non-rice crops during the last five years (2014–2019) in Rangabelia and Jatirampur villages.
CropGrain Yield (t/ha)Selling Price (INR/kg)
Best Seasonal ConditionNormal Seasonal ConditionWorst Seasonal Condition % Variation (1–3)High PriceNormal PriceLow Price% Variation (5–7)
(1)(2)(3)(4)(5)(6)(7)(8)
Wet season rice5.43.83.240.7415131220.00
Dry season rice6.54.53.841.541715.51417.65
Potato18.316.615.018.031210833.33
Lathyrus1.41.20.935.71262220.521.15
Lentil1.00.80.730.0070504042.86
Tomato15.014.013.013.3330201453.33
Onion3.63.43.211.1118151044.44
Chilli5.65.33.832.14100756535.00
Green-gram1.41.10.842.8640353025.00
Maize7.35.54.834.2515121033.33
Notes: Farmers’ perceived seasonal variability in yield and price of rice and non-rice crops in Rangabelia and Jatirampur villages, Gosaba.
Table 4. Stochastic dominance ranking of different systems under varied climatic scenarios and market fluctuations.
Sl. No.Cropping SystemsRanks
ExistingRice–tomato2
Rice–lathyrus=5
Rice–potato4
Rice–fallow=5
Rice–rice=5
Rice–lentil=5
Rice–onion6
Rice–chilli1
PotentialRice–fallow–green-gram=5
Rice–maize=5
Rice–potato–green-gram3
= indicates cropping systems are equal.
Table 5. Impact of yield and price variability on system net return (INR/ha) of rice–based cropping systems.
SystemsInputNet Return (INR/ha)
Rice–tomatoRice price9820
Rice yield26,694
Tomato price1,64,858
Tomato yield91,303
Rice–lathyrusRice price10,627
Rice yield26,221
Lathyrus price4274
Lathyrus yield7865
Rice–potatoRice price10,671
Rice yield26,556
Potato price65,956
Potato yield47,215
Rice–fallowRice price10,689
Rice yield26,297
Rice–riceRainy season rice price10,612
Rainy season rice yield26,190
Summer season rice price12,023
Summer season rice yield29,673
Rice–lentilRice price10,758
Rice yield26,381
Lentil price17,634
Lentil yield9411
Rice–onionRice price10,641
Rice yield26,383
Onion price18,707
Onion yield10,095
Rice–chilliRice price10,346
Rice yield25,860
Chilli price89,345
Chilli yield78,872
Rice–fallow–green-gramRice price10,717
Rice yield26,263
Green-gram price7795
Green-gram yield14,663
Rice–maizeRice price10,617
Rice yield26,148
Maize price20,291
Maize yield21,913
Rice–potato–green-gramRice price10,698
Rice yield26,522
Potato price65,911
Potato yield47,139
Green-gram price7550
Green-gram yield14,286
Disclaimer/Publisher’s Note: The statements, opinions and data contained in all publications are solely those of the individual author(s) and contributor(s) and not of MDPI and/or the editor(s). MDPI and/or the editor(s) disclaim responsibility for any injury to people or property resulting from any ideas, methods, instructions or products referred to in the content.

