Article

Does Socially Responsible Investing Make a Better Society?—A Micro Perspective through Mutual Funds and Their Investee Companies

1
Institute of Quantitative Economics, Huaqiao University, Xiamen 361021, China
2
School of International Education, Chongqing Medical University, Chongqing 400016, China
*
Author to whom correspondence should be addressed.
Sustainability 2023, 15(11), 8671; https://doi.org/10.3390/su15118671
Submission received: 27 April 2023 / Revised: 22 May 2023 / Accepted: 25 May 2023 / Published: 26 May 2023

Abstract

:
Socially responsible investing (SRI) aims to guide corporate behavior through investing and thus to make a better society since its debut. From a micro perspective, this study aims to empirically examine whether the propensity for SRI of mutual funds promotes the corporate social performance (CSP) of investee companies and to determine what are the mechanisms under this promotion effect and under what circumstances this promotion effect gets stronger. After our main analysis confirms the promotion effect in China, our mechanism analysis shows the following: mutual funds with a high propensity for SRI promote investee CSP, because they promote internal control and demand better disclosure of social responsibility information; the promotion effect of mutual funds as shareholders from within a company can substitute for the effects of a good external environment such as a highly marketized region or a competitive industry. Our heterogeneity analysis further shows that the promotion effect is stronger in state-owned enterprises, where corporate executives are more willing to accept suggestions related to social responsibility and in a good social trust atmosphere, which sheds light on shareholder activism in private and informal manners.

1. Introduction

Socially responsible investing (SRI), also known as responsible investing, is a philosophy of investing that not only focuses on financial returns but is also inclined to make positive social effects, “doing well while doing good”.
During the Vietnam War from 1963 to 1973, the U.S. military dropped 380,000 tons of napalm on Vietnam and sprayed 76 million liters of Agent Orange, a highly toxic defoliant. The health of nearly 4 million Vietnamese was damaged, and more than 100,000 U.S. servicemen also suffered. Monsanto, a major manufacturer of Agent Orange, and Dow Chemical, a major manufacturer of napalm, were widely boycotted by socially responsible investors during that time. In response to the demands of socially responsible investors, Pax World Fund, widely recognized as the first socially responsible investing fund, was established in 1971 with a commitment not to invest in any business involved in the military. As the SRI fund industry expanded, Agent Orange production ceased in a few years. In the 1980s, under pressure from socially responsible investors, many companies, including General Motors and Coca-Cola, divested from South Africa, hastening the end of apartheid in South Africa [1]. Throughout history, inducing investable companies to be more socially responsible has been the main positive social effect of SRI.
Early studies on the social effects of SRI are mostly discourses. Rivoli [2] argues that SRI can cause positive social effects in an imperfectly competitive environment. Waring and Lewer [3] take a perspective on human resource management and argue that the integration of ethical concerns into the investing decisions of SRI investors has a positive influence on the employee relations policies of listed companies. Stakeholder theory shows that monitoring from outside the firm prompts firms to act in a more socially responsible manner [4]. Other than these discourses, Heinkel et al. [5], Dam and Heijdra [6], and Pastor et al. [7] construct equilibrium models and analyze the influences of such factors as the proportion of SRI investors, the level of investors’ SRI preferences, and the cost for firms to be socially responsible to explore the social effects of SRI. However, still very few studies empirically explore the impact of the propensity for SRI of corporate shareholders on corporate social performance [8]. This micro perspective allows us to provide concrete and measurable evidences on the social effects of SRI and therefore is of great theoretical value for research.
In September 2020, at the 75th session of the United Nations General Assembly, Chinese President Xi Jinping laid out China’s overarching climate policy goals: to peak carbon emissions before 2030 and to achieve carbon neutrality by 2060. Not only does the “carbon” fever continue to rise, but also ESG and other SRI concepts are flourishing in China. However, SRI in China is still in its early stages of development, and the studies on the social effects of SRI in China are also mostly discourses, while policymakers and practitioners need evidence-based insights into the actual impact and effectiveness of SRI in the Chinese context for a more sustainable and responsible investment landscape in China, so it is of important practical significance to empirically test the social effects of SRI from a microscopic perspective.
The 2021 Social Responsibility Report of Mutual Fund Companies in Chinese Asset Management Industry, published by the Asset Management Association of China, indicates that 87 out of the 123 Chinese mutual fund companies in 2020 will consider the social performance of companies they might invest in. Mutual funds have the motivation to promote social responsibility of their investee companies, because social responsibility generally benefits corporate fundamentals in China and funds have the chance of “doing well while doing good” [9]; mutual funds also have the power to promote social responsibility of their investee companies, because they are resourceful and influential institutional investors and may conduct private communication with corporate executives. Considering the two reasons above, it is feasible to assume that mutual funds with a high propensity for SRI can promote the social performance of their investee companies and thus develop a study.
In summary, it is of great theoretical value, important practical significance, and high feasibility to empirically study the relationship between the social performance of Chinese enterprises and the propensity for SRI of funds among shareholders. We aim not only to examine whether the propensity for SRI promotes the social performance of investee companies, but also to determine what are the mechanisms under this promotion effect and under what circumstances this promotion effect gets stronger. We have arranged the rest of the sections of this paper as follows: Section 2 reviews related literature and develops research hypotheses based on our research aims; Section 3 introduces the data of this study; Section 4 is the main analysis regarding the existence of the promotion effect; Section 5 analyzes the mechanisms; Section 6 takes our heterogeneity analysis further and discusses the relationship of this study to the theory of shareholder activism; and Section 7 concludes this paper. This study has obtained its research aims and contributes to the research on the social effects of SRI to the praxis of SRI in China and to the theory of shareholder activism.

2. Theoretical Analysis

2.1. Literature Review and Hypothesis Development

Mutual funds are resourceful institutional investors, and the impact of institutional investors on the corporate social performance (CSP) of investee companies has received widespread academic attention. Environmental, social, and governance (ESG) are the three most important dimensions for evaluating CSP nowadays. Dyck et al. [10] demonstrate that institutional investors can help improve the environmental and social dimensions (E&S) of investee CSP globally by conducting a comprehensive sample of listed companies in more than 40 countries. They argue that institutional investors enhance the E&S of their investee companies for dual motives, both financial and social. Especially after the global financial crisis, firms with a larger ratio of shares held by institutional investors push harder to improve E&S. Aggarwal et al. [11] show that institutional investors can promote the governance dimension in CSP. In the case of China, Xiang et al. [12] find that managers are less motivated to promote CSP when they are less monitored by institutional investors. Both Chen et al. [13] and Zhou and Gan [14] show that the site visits of institutional investors are positively associated with CSP.
Among the many classifications of institutional investors, Bushee [15] is the first to introduce the concept of “transient” versus “dedicated” institutional investors and finds that firms with a high proportion of dedicated institutional shareholders are less likely to myopically cut down R&D for short-term financial goals. Both Glossner [16] and Kim et al. [17] find that longer investor horizons of institutional investors are related to better CSP. Oikonomou et al. [18] distinguish between long-term and short-term institutional investors and show that long-term institutional investment is positively related to CSP. In the case of China, Zhen et al. [19] show that dedicated institutional investors promote CSP. Xiong et al. [20] show that only long-term institutional investors can drive CSP. In China, social responsibility is generally considered to have a strong relationship with steady long-term growth, so funds with a stronger propensity for SRI should be more in line with the characteristics of dedicated institutional investors than funds with a weaker propensity for SRI. Based on all the analyses in this paragraph, a hypothesis is formulated:
Hypothesis 1 (H1).
The propensity for SRI of mutual funds promotes the CSP of investee companies.
Funds with a stronger propensity for SRI should also need high-quality social responsibility information to make investment decisions. With a good disclosure of a firm’s social responsibility information, the market can understand its CSP with higher information efficiency and reward its responsible behavior (or punish its irresponsible behavior) more quickly and accurately. Consequently, the firm has a stronger incentive to improve its CSP. Both international [21,22] and Chinese [23] empirical studies show the positive relationships between CSP and the disclosure of social responsibility information. Apparently, the better the disclosure of social responsibility information, the more sensitively and rapidly the market responds according to CSP and the higher the returns companies can get from investing in their own social responsibility. Institutional investors should be aware of the relationship between social responsibility information disclosure and CSP, and those with a higher propensity for SRI should have stronger incentives to ask for better disclosure of social responsibility information, hoping it can regulate corporate behavior and improve CSP. In light of the above discussion, the following research hypothesis is proposed:
Hypothesis 2 (H2).
Funds with a stronger propensity for SRI demand better disclosure of social responsibility information from their investee companies, thus promoting investee CSP.
The drivers of corporate social responsibility have received great attention. The Supporting Guidelines on Corporate Internal Control issued by the Ministry of Finance of China and five other ministries in 2010 clearly stated that companies should pay attention to internal control when promoting corporate social responsibility. This indicates that the goal framework of internal control in China includes the pursuit of CSP. Internal control not only enhances the effective allocation of corporate resources but also leads to effective social responsibility strategic planning, thus promoting CSP. Empirical studies on this relationship are abundant. Li et al. [24] use a sample of 1767 listed companies in A-shares from 2011 to 2016 and found that effective internal control significantly improved corporate social responsibility. Huang and Huang [25] study 1603 A-share heavy polluters in China from 2010 to 2016 and find that those with poorer internal control also had poorer green levels. Both Li [26] and Wang et al. [27] find that internal control promotes corporate tech invention and CSP. Considering that mutual funds, as mature institutional investors, may be aware of the relationship between internal control and CSP, and considering that internal control is closely related to the governance (G) dimension in the ESG concept, we suggest that funds with a high propensity for SRI may try to promote investee CSP by promoting internal control and propose the following research hypothesis:
Hypothesis 3 (H3).
Funds with a stronger propensity for SRI promote internal control of their investee companies, thus promoting investee CSP.
In addition to factors within a company, the external institutional environment also affects corporate social responsibility fulfillment [28], and the degree of marketization of the region where a company is located is particularly important. Jing [29] finds that the marketization process not only directly improves corporate social responsibility itself but also further moderates the positive relationship between product market competition and corporate social responsibility. China has vigorously advocated sustainable development in the past decade or so and emphasized that enterprises should take social responsibility, and there should be certain requirements for corporate social responsibility in the market. In a region with a higher degree of marketization, investors may have a better understanding and higher requirements of corporate social responsibility, and the market’s demand for CSP can be more effectively transmitted to enterprises, so regional marketization helps promote the CSP of local companies. Further, the marketization process as an external factor of the institutional environment and fund investors as an internal factor of enterprises may be substitutes for each other. In other words, where the degree of marketization is low, the propensity for SRI of funds has a more significant promotional effect on investee CSP, so the following research hypothesis is proposed:
Hypothesis 4 (H4).
The marginal promotional effect of the propensity for SRI of mutual funds on investee corporate social performance is more significant in less marketized regions.
Porter and Vanderlinde [30] pioneered the opinion that social responsibility helps improve the competitiveness of a company. Specifically, companies under competition pressure will encourage R&D staff to apply social responsibility to the production process, thereby enabling product differentiation and thus gaining a competitive edge in the market. However, in an industry that is monopolized by a few companies, both the monopolist and other ordinary companies lack the incentive to promote social responsibility to improve competitiveness. Therefore, competition within an industry may have a facilitating effect on CSP. Chang and Jo [31] empirically show the positive correlations between the degree of employee friendliness in U.S. firms and the extent of competition in the product market. In the case of China, Meng and Sima [32] also find the positive correlation between the extent of competition in an industry and the social responsibility of companies in the industry. In summary, competition within the industry helps promote CSP, and this external promoting factor may be a substitute for the role that funds play as the shareholders of a company. That is, the propensity for SRI of funds has a more significant promotional effect on investee CSP when the industry lacks competition, so the following research hypothesis is proposed:
Hypothesis 5 (H5).
The marginal promotional effect of the propensity for SRI of mutual funds on investee corporate social performance is relatively significant in industries lacking competition.

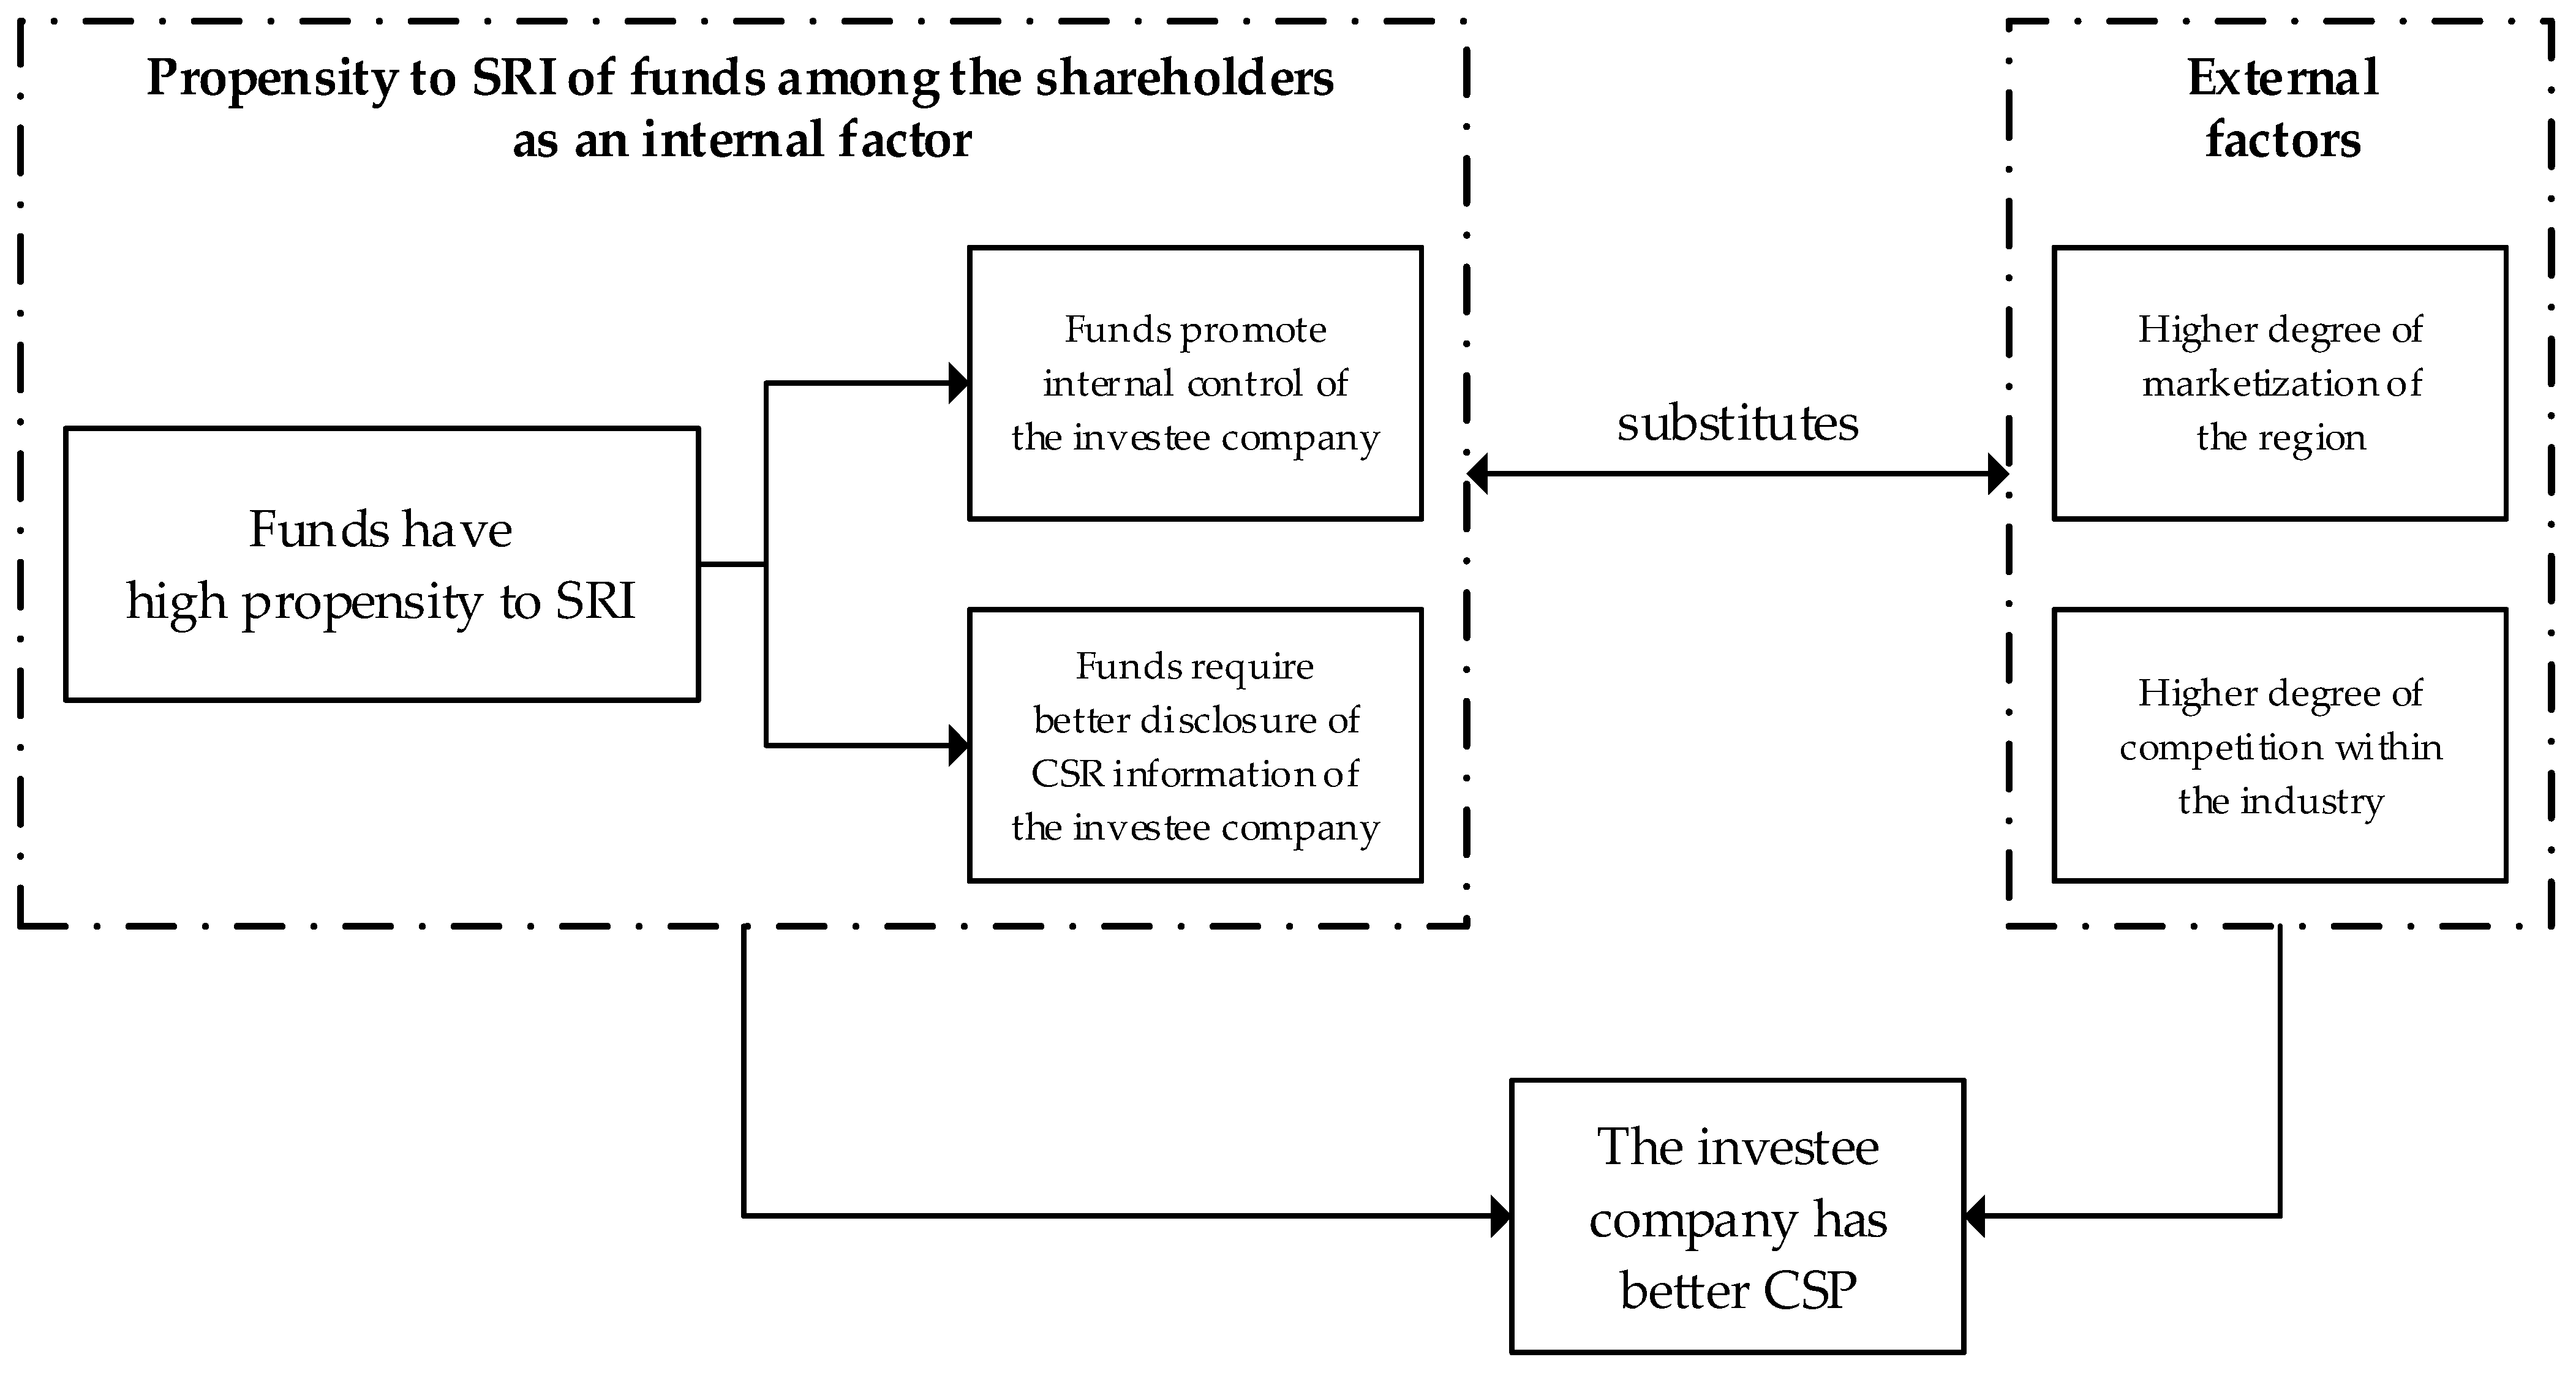
2.2. Research Framework

Based on the research hypotheses and relevant discussions presented in Section 2.1, we illustrate the main research framework of this paper with Figure 1.

3. Data

3.1. Sample Source and Data Screening

In this paper, the social responsibility scores of listed companies are obtained from Hexun. The internal control scores of companies are from the DIB database. The marketization indexes of provinces are calculated according to the method of Fan et al. [33]. Other company-level raw data are from the CSMAR database and the Wind database.
Since the sample period of the propensity for SRI in this paper is from 2011 to 2018 and the available social responsibility scores are from 2010 to 2017, the research period in this paper shall be from 2011 to 2017. Financial companies and companies whose stocks have been in abnormal states ST, ST*, or PT in the research period excluded, our research objects include 3044 A-share listed companies.

3.2. Construction of Variables

3.2.1. Dependent Variable

Corporate social performance. We use the social responsibility total score from Hexun to measure the corporate social performance (CSP) of a company. This rating product of Hexun is widely adopted by studies on social responsibility in China [27,34,35], and we also chose to adopt this rating product for the following two reasons.
(1)
Long coverage time period: Hexun is an early provider of a social responsibility rating product in China. The rating product was launched in September 2013. Upon its release, the social responsibility scores for the years 2010–2012 were announced. Subsequently, every year, Hexun announces the social responsibility scores for the previous year.
(2)
Wide coverage of companies: The rating of Hexun covers almost all A-share companies, as Hexun rates the social responsibility of a company based on not only its social responsibility report but also its annual report.
The social responsibility total score of a company constitutes five subscores—“Shareholder”, “Employee”, “SCC”, “Environment”, and “Society”. They are designed to reflect corporate responsibility towards its shareholders, towards its employees, towards its suppliers, clients, and customers, towards the natural environment, and towards society (in a narrow sense, because it only concerns the monetary contributions of a company to society). The constitution of the social responsibility total score has undergone structural changes, for Hexun has stopped calculating the subscore “SCC” and the subscore “Environment” since 2018. Therefore, the final year of the dependent variable CSP in this article is 2017.

3.2.2. Explanatory Variable

Propensity to SRI. Referring to Kempf and Osthoff [36], Zhang et al. [37], and Hwang et al. [8], the propensity for the SRI of a fund at a disclosure date is reflected by FCSR, which is the weighted average CSR score of its stock portfolio. To reflect the propensity for SRI of all share-holding funds of a firm, noted as PSRI, the weighted average FCSR of all share-holding mutual funds is calculated as follows:
P s r i i , t = j = 1 p F c s r j , t × w j , i , t j = 1 p w j , i , t
In Equation (1), p represents the number of mutual funds with FCSR scores among the shareholders of company i at the end of year t. F c s r j , t is the FCSR score of fund j at the disclosure date at the end of t, reflecting the propensity for SRI of fund j. w j , i , t is the number of shares of company i held by fund j at the end of t and j = 1 q w j , i , t is the sum of the number of company i shares held by p funds. In other words, according to the principle that the more shares, the greater the voice in the company, P s r i i , t can reflect the average propensity for SRI of mutual funds as shareholders of the company i funds at the disclosure date of the end of year t.
In this paper, the dependent variable CSP reflects the social responsibility performance of a company over the period of a calendar year, while Psri only reflects the average propensity for SRI of mutual funds as shareholders of a company at the year-end disclosure date. To better show the relationship between the dependent variable and the explanatory variable, the simple average of the two Psri values, one at the year-end disclosure date and the other at the disclosure date at the end of the previous year, is used as a proxy variable for the propensity for SRI of mutual funds as shareholders of a company over the period of a calendar year:
P S R I i , t = P s r i i , t + P s r i i , t 1 2
Considering that fund j may continuously hold the stock of a company i for many years, to avoid endogeneity, referring to Li et al. [38], we delete the stock of company i when calculating F c s r j , t , and recalculate adjusted PSRI according to Equations (1) and (2), denoted as P S R I _ A i , t . To ensure robustness, both P S R I i , t and P S R I _ A i , t will be parallelly used in each of our regressions.

3.2.3. Mechanism Variables

Referring to Shi et al. [39], we measure the internal control level of a company using the internal control score in the DIB internal control and risk management database. Because a separately published social responsibility report benefits the social responsibility information comparison and evaluation, we generate a dummy variable that equals one when the company publishes its social responsibility report separately from its annual report. We use provincial marketization indexes calculated with the method of Fan et al. [33] to proxy the marketization level of the region where a company is located. We calculate the Herfindahl index of the annual operating income of all companies within an industry to proxy the extent of competition within the industry. To facilitate observations, we take opposite numbers of Herfindahl indexes to generate a variable, so a greater value of the variable indicates a higher degree of competition within an industry.

3.2.4. Control Variables

Many control variables are also included in this paper. The original values of some control variables are their instantaneous values at the disclosure date at the end of each year, and these control variables are treated in the same way as the explanatory variables, i.e., the two values taken at the year-end disclosure date and the previous year-end disclosure date are simply averaged to proxy the situation over the period of a calendar year.

3.3. Data Summary

A summary of definitions and generation processes of variables is shown in Table 1.
We also use Table 2 to present the descriptive statistics of these variables. All continuous variables are winsorized at 1%. Missing values are excluded and a sample of 11,454 firm-year-level observations is obtained.
The mean of CSP is 27.121, with a minimal value of −1.390 and a maximum value of 75.510. The social responsibility performance of different companies varies greatly. The statistics of PSRI and adjusted PSRI_A are close, so it can be expected that the two indicators as explanatory variables can produce similar regression results. The mean of INS is 0.404, showing that on average, 40.4% of stocks are held by institutional investors. The impact of institutional investors on CSP is worth studying.

4. Main Analysis

4.1. Baseline Regression

4.1.1. Model and Method

To examine the relationship between corporate social performance and the propensity for SRI of mutual funds among the shareholders of a company, the baseline regression model is set as follows:
C S P i , t = α + β X i , t + γ C O N T R O L i , t + I N D U S T R Y i + Y E A R t + ϵ i , t
In the model, the dependent variable C S P i , t is the social responsibility score of company i in year t; the explanatory variable X can be PSRI or PSRI_A, reflecting the propensity for SRI of mutual funds among the shareholders; and CONTROL is the control variables as described above. Because some control variables do not change over time, to avoid perfect collinearity, we adopt, for the industry, the fixed effect I N D U S T R Y i . Among the industries, manufacturing industries are classified according to CSRC subcategories, and other industries are classified according to the CSRC industries. We also use the fixed effect I N D U S T R Y 2 i as a robustness test, where all industries are classified according CSRC subcategories. Dummies for the year, fixed effect Y E A R t , are also utilized. ϵ i , t is the clustered standard error term. The baseline regressions employ the OLS method.

4.1.2. Results

Table 3 presents the regression results of the impact of the propensity for SRI of mutual funds among the shareholders of a company on corporate social performance. The dependent variable is CSP, and the core explanatory variable is the propensity for SRI of mutual funds among the shareholders, reflected by PSRI or PSRI_A. The empirical results in columns (1) to (4) show that the estimated coefficients of PSRI or PSRI_A are significantly positive at the 1% level, regardless of controlling for fixed effect of industry or industry subcategory, indicating a significant positive effect of the propensity for SRI of mutual funds among the shareholders of a company on corporate social performance. In other words, the propensity for SRI of mutual funds promotes the CSP of investee companies, so the research hypothesis 1 of this paper is confirmed. Our result is in line with previous empirical studies regarding the relationship between the propensity for SRI of mutual funds and investee CSP [8,38].

4.2. Endogeneity Analysis

4.2.1. Lagged Independent Variables

In the baseline regression model (3), the core explanatory variable P S R I t or P S R I _ A t reflecting the propensity for SRI of mutual funds among the shareholders of a company and the dependent variable C S P t reflecting corporate social performance are in the same year, and there may be an endogeneity problem of reverse causality. Specifically, although the annual report that carries some social responsibility information about the company in year t will not be published until April 30 of year t + 1 and the social responsibility report that some companies choose to publish separately may be published even later, it is possible that mutual funds, as resourceful institutional investors, may learn about the social responsibility performance of the company in year t through other channels before then. It is possible, then, that a good CSP attracts mutual funds with a high propensity for SRI. To alleviate this endogeneity problem, the core explanatory variable PSRI or PSRI_A is lagged by one year in columns (1) to (4) of Table 4, and all independent variables are lagged by one year in columns (5) to (8) of Table 4. Comparing Table 4 with Table 3, we can find that the coefficients of PSRI or PSRI_A are still significantly positive, so the result of the baseline regression is robust.

4.2.2. Instrumental Variable Method

While we have addressed the issue of reverse causality in Section 4.2.1, the empirical results may still be subject to the influence of unobserved variables. Additionally, there may be potential endogeneity issues arising from measurement errors, omitted variables, a sample selection bias, etc. To address these concerns, we employ an instrumental variables approach.
Following the method proposed by Lewbel [40], instrumental variables IV and IV_A were constructed for PSRI and PSRI_A, respectively. The construction process is as follows: first, we regress an original explanatory variable on original controls to generate a panel data of residual terms; and second, the panel data of the instrumental variables are SOE, which is relatively exogenous, multiplied by the corresponding residuals. Since the SOE is relatively exogenous and the Breusch and Pagan [41] test shows heteroskedasticity in the above regression for generating residual terms, the obtained instrumental variables meet the requirements [42].
Durbin–Wu–Hausman tests on the regression models are conducted. The results show that the DWH statistics are 11.8102 or 13.3975 when PSRI or PSRI_A acts as the explanatory variable, respectively. The null hypothesis of no endogeneity is rejected at the 1% significance level in both cases. Table 5 presents the results of the two-stage regression of the instrumental variables method. Columns (1) and (3) are the results of the first-stage regression, and columns (2) and (4) are the results of the second-stage regression. The regression coefficients of PSRI on IV in column (1) and PSRI_A on IV_A in column (3) are significantly positive at the 1% level, showing that the instrumental variables are correlated to the instrumented variables. The regression coefficients of PSRI and PSRI_A in columns (2) and (4) are significantly positive at the 1% level, which indicates that after mitigating the potential endogeneity, the results of the baseline regression still hold, i.e., there is a significant positive effect of propensity for SRI of mutual funds among the shareholders on the CSP of the company. In other words, the propensity for SRI of mutual funds promotes the CSP of investee companies. In addition, the Kleibergen–Paap weak instrumental variable test statistics of 53.634 and 51.151 are shown in columns (2) and (4), respectively, which exceed the critical values at all significance levels, indicating no weak instrumental variable problem.

4.3. Robustness Tests

In the baseline regression, the annual CSP is measured by the social responsibility total score from Hexun. However, the judgement of CSP is somehow subjective, and the scores given by different organizations may not be consistent. Therefore, we use the ESG rating provided by the Sino-Securities Index Information Service in our robustness test. This ESG rating covers the vast majority of A-share listed companies, and companies are rated from good to poor as AAA, AA, A, BBB, BB, B, CCC, CC, and C for a total of nine levels, according to their overall social responsibility performance. Therefore, the ratings can be converted into a variable CSP_HZ that takes values from 9 to 1, and a greater value indicates a better CSP. Columns (1) to (4) in Table 6 show the regression results of replacing the dependent variable CSP in model (3) with CSP_HZ. A comparison with Table 3 reveals that the regression coefficients of PSRI or PSRI_A are still significantly positive at the 1% level, so the result of the baseline regression is robust. Considering that CSP_HZ is an ordinal variable, we conducted an ordered logistic method in addition to the OLS method. Columns (5) and (6) in Table 6 show that the regression coefficients of PSRI or PSRI_A are still significantly positive at the 1% level. In summary, after changing the data source of the dependent variable, the propensity for SRI of mutual funds among the shareholders still has a significant positive effect on the CSP of a company. Research Hypothesis 1 of this paper, that the propensity for SRI of mutual funds promotes the CSP of investee companies, is further confirmed.

5. Mechanism Analysis

In Section 4, this paper provided preliminary evidence on the promotional effect of the propensity for SRI of mutual funds among the shareholders on CSP. This promotional effect can be partly attributed to the fact that mutual funds with a high propensity for SRI seek long-term returns and may belong to the “dedicated” institutional investors described in previous studies, which are widely believed to promote the CSP of investee companies. What are the other channels and mechanisms through which the propensity for SRI promotes investee CSP? The following sections explore three aspects, which are the disclosure of social responsibility information, internal control, and the external environment.

5.1. Mechanism of Social Responsibility Information Disclosure

A mutual fund with a high propensity for SRI also values the quality of social responsibility information, and it may demand better social responsibility disclosure from its investee companies. The expression of demand also helps corporate executives understand the benefits of promoting CSP and makes them pay more attention to social responsibility. In addition, the information from the social responsibility reports can be cross-compared with the information from the financial reports, so better social responsibility disclosure also promotes the standardization of accounting information, thus urging the company to fully pay taxes according to laws. Paying taxes is an important part of the contributions a company can make to society and is one of the evaluation factors for CSP. The correlation between social responsibility information disclosure and CSP has also been confirmed empirically [21]. In conclusion, better disclosure of social responsibility information may act as a partial mediator in the relationship of a higher propensity for SRI and a better CSP.
Table 7 presents the results of adding the mediator variable DISCL, which reflects the quality of disclosure of social responsibility information, to the baseline regression model (3). Because a logistic (Logit) regression with DISCL as the dependent variable loses part of the sample, OLS is also conducted. The coefficients of PSRI or PSRI_A in columns (1) to (4) are both significantly positive at the 1% level, indicating that better disclosure of social responsibility is indeed positively correlated to the propensity for SRI of mutual funds among shareholders. The coefficients of DISCL in columns (3) and (4) are significantly positive at the 1% level, indicating that better disclosure of social responsibility does indeed promote CSP, which is in line with the results in both international [21,22] and Chinese [23] empirical studies. The coefficients of PSRI in column (5) and PSRI_A in column (6) remain significantly positive at the 1% level, and the Sobel_z statistics are 10.099 and 6.433, respectively, indicating that better disclosure of social responsibility information does act as a partial mediator in the relationship of a higher propensity for SRI and a better CSP. In conclusion, research hypothesis 2 of this paper is confirmed; that is, funds with a stronger propensity for SRI demand better disclosure of social responsibility information from their investee companies, thus promoting investee CSP.

5.2. Mechanism of Internal Control

Internal control is closely related to the G (Governance) dimension of the ESG concept, which is now an important part of SRI philosophy, so mutual funds with a high propensity for SRI may prompt investee companies to improve internal control, which has the function of facilitating and regulating organizational decision making and governance and can improve CSP. Therefore, better internal control may also act as a partial mediator in the relationship between a higher propensity for SRI and a better CSP.
Table 8 presents the results of adding the mediator variable INCTRL, which reflects the level of internal control, into the baseline regression model (3). The coefficients of PSRI or PSRI_A in columns (1) and (2) are significantly positive at the 10% level, indicating that the level of internal control is indeed positively related to the propensity for SRI of mutual funds among shareholders. The coefficients of INCTRL in columns (3) and (4) are significantly positive at the 1% level, confirming that internal control enhances CSP, which is in line with the results of previous studies in China [24,25]. The coefficients of PSRI in column (3) and PSRI_A in column (4) remain significantly positive at the 1% level, and the Sobel_z statistics are 1.983 and 1.952, respectively, indicating that internal control does act as a partial mediator in the relationship of a higher propensity for SRI and a better CSP. In conclusion, research Hypothesis 3 of this paper is confirmed; namely, funds with a strong propensity for SRI promote the internal control of their investee companies, thus promoting investee CSP.

5.3. Role of External Environment

In the past decade or so, China has vigorously advocated sustainable development and emphasized that companies should assume social responsibilities, so the market should have some requirements for CSP. In highly marketized region, the public may have a better understanding and higher demand for corporate social responsibility, and the market demand for CSP can be transmitted to companies more effectively. Therefore, we believe that regional marketization can improve the CSP of local companies.
In an industry dominated by a small number of firms, neither the monopolistic companies nor the other regular companies have a motivation to enhance their competitiveness through social responsibility. In contrast, in a competitive industry, individual companies can differentiate themselves by improving their social responsibility performance to attract consumers [30]. Therefore, competition within the industry may have a facilitating effect on CSP.
Both the process of marketization and the competition within the industry can be summarized as external factors affecting CSP. We assume that these external promotional effects may be substitutes for the internal effect of funds with high SRI among the shareholders of a company. In a highly marketized region or a competitive industry, the marginal promotional effect of funds with high SRI among the shareholders on CSP may be relatively weak. In a poorly marketized region or an industry lacking competition, the marginal promotional effect of funds with high SRI among the shareholders on CSP may be relatively strong. In other words, the marketization level of a region and the degree of competition within an industry may be moderators of the PSRI–CSP relationship, so we add the interaction terms between moderators and the explanatory variable to the baseline regression model (3) and get the regression model (4).
C S P i , t = α + β 1 X i , t + β 2 X i , t × E M K T i , t + β 3 X i , t × E C O M P E i , t + β 4 E M K T i , t + β 5 E C O M P E i , t + γ C O N T R O L i , t + I N D U S T R Y i + Y E A R t + ϵ i , t
where the explanatory variable X can be PSRI or PSRI_A, both of which indicate the propensity for SRI of mutual funds among shareholders of company i.
The regression results of model (4) are presented in Table 9. In column (1), the regression coefficients of PSRI, EMKT, and ECOMPE are all positive, and PSRI×EMKT, PSRI×ECOMPE are significantly negative at the 5% and 10% levels, respectively, which indicates that the marginal promotional effect of PSRI on CSP is weaker when the regional marketization level is better or the degree of competition within the industry is higher. Column (2) replaces the industry fixed effect with the industry subcategory fixed effect compared to column (1), and the results are robust. In columns (3) and (4), the explanatory variable is replaced with the adjusted PSRI_A, and all the above results remain robust. To sum up, both the marketization level of the region and the degree of competition within the industry are negative moderators in the positive correlation between the propensity for SRI of mutual funds among shareholders and CSP. In other words, the marginal promotional effect of the propensity for SRI of mutual funds on investee CSP is relatively significant in less marketized regions or in industries lacking competition. Here, research Hypotheses 4 and 5 are confirmed.

6. Heterogeneity Analysis and Discussions

6.1. Social Trust Atmosphere

Today, the understanding of SRI and corporate social responsibility among different groups of people in China is diverse. The benefits of social responsibility, e.g., reducing agency cost [43], are not necessarily recognized by corporate executives. In countries and regions with a long history of SRI, SRI investors tend to practice “shareholder activism” and to influence the behavior of their investee companies in a public and institutionalized manner. In China, mutual funds with a high propensity for SRI are more likely to provide advice and express their demands to corporate executives through a gentle and private means of communication as shareholders. According to the trust theory, the more trust corporate executives have in shareholders, the more likely they are to accept suggestions from shareholders, and specifically, the more likely they are to accept suggestions of improving CSP from mutual funds with a high propensity for SRI as shareholders. Therefore, it can be inferred that corporate executives in areas with a better social trust atmosphere are more likely to be influenced by the mutual funds as shareholders to enhance CSP.
In this section, the social trust index at the province-year level is constructed based on the CGSS database, and the study sample is divided equally into two equal groups based on the level of the social trust index, and the baseline regression (3) is conducted again in the two group. Comparing columns (1) and (2) in Table 10, we observe that the regression coefficient of PSRI is greater in column (2) than in column (1). This suggests that in a favorable social trust atmosphere, the influence of the mutual fund shareholders’ propensity for SRI on CSP is more pronounced. In columns (3) and (4), robust results are shown when the adjusted PSRI_A is used. In summary, the promotional effect of the propensity for SRI of mutual funds on investee CSP is stronger under a good social trust atmosphere.

6.2. SOEs vs. Regular Companies

Due to political, historical, and social reasons, Chinese enterprises can be divided into two categories depending on the nature of their property rights—state-owned enterprises and non-state-owned enterprises. State-owned enterprises (SOEs) are very different from non-state-owned enterprises in terms of their roles, development goals, and personnel management. In state-owned enterprises, it is common for the CEO and chairman of the board to be appointed by the corresponding government agencies. They usually serve for a limited period and are subject to frequent change. Due to the fact that higher authorities appoint the chairmen and CEOs of SOEs, these executives tend to dedicate a significant amount of effort towards understanding and aligning with the intentions and directives of those higher authorities. ESG has been increasingly supported by the Chinese government in the last decade. It can be assumed that compared with executives of regular companies, SOE executives have a deeper knowledge base about corporate social responsibility and may react more positively when receiving suggestions about social responsibility from shareholders. Therefore, we infer that the promotional effect of the propensity for SRI of mutual funds among shareholders on CSP is stronger in SOEs than in non-SOEs.
We therefore divide our sample into two groups—SOEs and non-SOEs. To avoid perfect collinearity, the dummy variable SOE is removed from the control variable group based on the baseline regression (3). Comparing columns (1) and (2) in Table 11, we can see that the regression coefficient of PSRI in column (2) is larger than that of PSRI in column (1), proving that the promotional effect of the propensity for SRI of mutual funds among shareholders on CSP is stronger in SOEs than in non-SOEs. In columns (3) and (4), the results are robust when the adjusted PSRI_A is used.

6.3. Discussions

Section 6.2 shows that the promoting effect of PSRI on CSP is stronger in SOEs than in regular companies. We infer that this difference may be due to the greater willingness of SOE executives to accept suggestions related to social responsibility than the willingness of executives from regular companies. Section 6.1 shows that this promoting effect is stronger in a good social trust atmosphere than in a poor atmosphere. We infer that a better social trust atmosphere makes corporate executives more receptive to various suggestions from shareholders, including those related to social responsibility. In other words, both of our inferences are related to the possible phenomenon of corporate executives accepting suggestions for enhancing social responsibility from shareholders with a high propensity for SRI.
Shareholder activism refers to the actions taken by shareholders to influence or change the strategic decisions, corporate governance practices, or management of a listed company. It involves shareholders engaging in various activities, such as submitting shareholder proposals, voting on corporate matters, initiating proxy contests, and engaging in public campaigns. However, recent SRI studies often focus on voting [44], which is a very formal and transparent action to influence an investee company. Some studies take a look into either shareholder proposals that go to a vote or those withdrawn [45]. Furthermore, the findings in this section shed light on a form of shareholder activism that is likely to be prevalent but has not been extensively examined by scholars, which is shareholders engaging in possibly private communication, offering suggestions with corporate executives.

7. Conclusions

With fixed effects and clustered standard error types for panel data, our baseline regression shows that a higher propensity for SRI of mutual funds among shareholders leads to better CSP. This result is robust when we address endogeneity issues by using lagged independent variables or the instrumental variable method. Our mechanism analysis shows the following: (i) mutual funds with a high propensity for SRI promote internal control and demand better disclosure of social responsibility information, which are part of the mechanisms for how they promote investee CSP; and (ii) the promotional effect of the propensity for SRI of mutual funds on investee CSP is relatively significant in less marketized regions or in industries lacking competition, which indicates that the internal promotional effect by mutual funds as shareholders are somehow substitutes to external promotional effects by the environment. Our heterogeneity analysis shows that the promotional effect of the propensity for SRI on CSP is stronger in a good social trust atmosphere, where corporate executives are more receptive to suggestions and in SOEs, where corporate executives have a better cognitive base of social responsibility and are more willing to accept related suggestions.
SRI aims to guide corporate behavior through investing and thus to make a better society since its debut. Regarding whether and how SRI achieves this social effect, we do not limit our study to a discourse, but take a micro perspective and empirically demonstrate the promotional effect of the propensity for SRI of mutual funds on corporate social performance (CSP) of investee companies, which is an innovative perspective for China. Although we are not the first to take this micro perspective, we still expand the research in this field by providing multiple mechanisms and a heterogeneity analysis to explain this promotional effect. The implication of our heterogeneity analysis to the theory of shareholder activism is that private communication and suggestions may play an indispensable role. One limitation of our study also lies here: we have not directly empirically examined this indispensable role. Scholars can try to obtain relevant data and conduct further and more direct research. Another limitation of our study is that our model identification method may not be very advanced. Scholars can look for quasi-natural experiments to better prove the causal relationship between the propensity for SRI and CSP. The implication of our study to SRI praxis in China is that regulatory authorities should encourage mutual funds to participate in corporate decision making and lower the requirements for shareholder proposals, allowing mutual funds to practice SRI shareholder activism not only through informal private channels but also through formal public means.

Author Contributions

Conceptualization, R.H.; Methodology, C.Z.; Software, C.Z.; Validation, W.W. and C.Z.; Formal analysis, W.W. and C.Z.; Investigation, W.W.; Resources, R.H.; Data curation, W.W.; Writing–original draft, W.W. and C.Z.; Writing–review & editing, Y.S.; Supervision, Y.S.; Project administration, R.H.; Funding acquisition, R.H. All authors have read and agreed to the published version of the manuscript.

Funding

This work was financially supported by the Natural Science Foundation of Fujian Province (grant number: 2022J01320) and supported by the Fundamental Research Funds for the Central Universities in Huaqiao University.

Institutional Review Board Statement

Not applicable.

Informed Consent Statement

Not applicable.

Data Availability Statement

The datasets used during the current study are available from the corresponding author upon reasonable request.

Conflicts of Interest

The authors declare no conflict of interest.

References

  1. Renneboog, L.; Ter Horst, J.; Zhang, C. The price of ethics and stakeholder governance: The performance of socially responsible mutual funds. J. Corp. Financ. 2008, 14, 302–322. [Google Scholar] [CrossRef]
  2. Rivoli, P. Making a difference or making a statement? Finance research and socially responsible investment. Bus. Ethics Q. 2003, 13, 271–287. [Google Scholar] [CrossRef]
  3. Waring, P.; Lewer, J. The impact of socially responsible investment on human resource management: A conceptual framework. J. Bus. Ethics 2004, 52, 99–108. [Google Scholar] [CrossRef]
  4. Mitchell, R.K.; Agle, B.R.; Wood, D.J. Toward a theory of stakeholder identification and salience: Defining the principle of who and what really counts. Acad. Manag. Rev. 1997, 22, 853–886. [Google Scholar] [CrossRef]
  5. Heinkel, R.; Kraus, A.; Zechner, J. The effect of green investment on corporate behavior. J. Financ. Quant. Anal. 2001, 36, 431–449. [Google Scholar] [CrossRef]
  6. Dam, L.; Heijdra, B.J. The environmental and macroeconomic effects of socially responsible investment. J. Econ. Dyn. Control 2011, 35, 1424–1434. [Google Scholar] [CrossRef]
  7. Pastor, L.; Stambaugh, R.F.; Taylor, L.A. Sustainable investing in equilibrium. J. Financ. Econ. 2021, 142, 550–571. [Google Scholar] [CrossRef]
  8. Hwang, C.Y.; Titman, S.; Wang, Y. Investor tastes, corporate behavior, and stock returns: An analysis of corporate social responsibility. Manag. Sci. 2022, 68, 7131–7152. [Google Scholar] [CrossRef]
  9. Hamilton, S.; Jo, H.; Statman, M. Doing well while doing good? The investment performance of socially responsible mutual funds. Financ. Anal. J. 1993, 49, 62–66. [Google Scholar] [CrossRef]
  10. Dyck, A.; Lins, K.V.; Roth, L.; Wagner, H.F. Do institutional investors drive corporate social responsibility? International evidence. J. Financ. Econ. 2019, 131, 693–714. [Google Scholar] [CrossRef]
  11. Aggarwal, R.; Erel, I.; Ferreira, M.; Matos, P. Does governance travel around the world? Evidence from institutional investors. J. Financ. Econ. 2011, 100, 154–181. [Google Scholar] [CrossRef]
  12. Xiang, C.; Chen, F.; Jones, P.; Xia, S. The effect of institutional investors’ distraction on firms’ corporate social responsibility engagement: Evidence from China. Rev. Manag. Sci. 2021, 15, 1645–1681. [Google Scholar] [CrossRef]
  13. Chen, X.Y.; Wan, P.; Sial, M.S. Institutional investors’ site visits and corporate social responsibility: Implications for the extractive industries. Extr. Ind. Soc. 2021, 8, 374–382. [Google Scholar] [CrossRef]
  14. Zhou, T.Y.; Gan, J.W. Institutional investors’ site visits and corporate social responsibility: Evidence from China. Econ. Model. 2022, 115, 13. [Google Scholar] [CrossRef]
  15. Bushee, B.J. The influence of institutional investors on myopic R&D investment behavior. Account. Rev. 1998, 73, 305–333. [Google Scholar] [CrossRef]
  16. Glossner, S. Investor horizons, long-term blockholders, and corporate social responsibility. J. Bank Financ. 2019, 103, 78–97. [Google Scholar] [CrossRef]
  17. Kim, H.D.; Kim, T.; Kim, Y.; Park, K. Do long-term institutional investors promote corporate social responsibility activities? J. Bank Financ. 2019, 101, 256–269. [Google Scholar] [CrossRef]
  18. Oikonomou, I.; Yin, C.; Zhao, L. Investment horizon and corporate social performance: The virtuous circle of long-term institutional ownership and responsible firm conduct. Eur. J. Financ. 2020, 26, 14–40. [Google Scholar] [CrossRef]
  19. Zhen, H.; Ling, F.; Jing, Y. “Participation in governance” or “selective governance”?—Based on the test of the endogenous relationship between institutional investors and accounting conservatism. Syst. Eng. Theory Pract. 2021, 41, 2198–2217. [Google Scholar] [CrossRef]
  20. Xiong, W.F.; Dong, M.M.; Xu, C. Institutional investors and corporate social responsibility: Evidence from China. Emerg. Mark. Financ. Trade 2022. [Google Scholar] [CrossRef]
  21. Dawkins, C.E.; Fraas, J.W. An exploratory analysis of corporate social responsibility and disclosure. Bus. Soc. 2013, 52, 245–281. [Google Scholar] [CrossRef]
  22. Manning, B.; Braam, G.; Reimsbach, D. Corporate governance and sustainable business conduct-effects of board monitoring effectiveness and stakeholder engagement on corporate sustainability performance and disclosure choices. Corp. Soc. Responsib. Environ. Manag. 2019, 26, 351–366. [Google Scholar] [CrossRef]
  23. Zhong, P.; Wu, T.; Li, X. An empirical study on the relationship among corporate social responsibility report, social irresponsibility and financial performance of listed companies. Forecasting 2021, 40, 17–23. [Google Scholar] [CrossRef]
  24. Li, X.; Zheng, C.M.; Liu, G.; Sial, M.S. The effectiveness of internal control and corporate social responsibility: Evidence from Chinese capital market. Sustainability 2018, 10, 4006. [Google Scholar] [CrossRef]
  25. Huang, R.B.; Huang, Y.B. Does internal control contribute to a firm’s green information disclosure? Evidence from China. Sustainability 2020, 12, 3197. [Google Scholar] [CrossRef]
  26. Li, X. The effectiveness of internal control and innovation performance: An intermediary effect based on corporate social responsibility. PLoS ONE 2020, 15, 0234506. [Google Scholar] [CrossRef]
  27. Wang, X.; Zhang, Z.; Chun, D. The influencing mechanism of internal control effectiveness on technological innovation: CSR as a mediator. Sustainability 2021, 13, 13122. [Google Scholar] [CrossRef]
  28. Campbell, J.L. Why would corporations behave in socially responsible ways? An institutional theory of corporate social responsibility. Acad. Manag. Rev. 2007, 32, 946–967. [Google Scholar] [CrossRef]
  29. Jing, L. Corporate governance mechanism, marketization process and corporate social responsibility. Stat. Decis. 2020, 36, 168–172. [Google Scholar] [CrossRef]
  30. Porter, M.E.; Vanderlinde, C. Green and competitive: Ending the stalemate. Harv. Bus. Rev. 1995, 73, 120–134. [Google Scholar] [CrossRef]
  31. Chang, S.; Jo, H. Employee-friendly practices, product market competition and firm value. J. Bus. Finan. Account. 2019, 46, 200–224. [Google Scholar] [CrossRef]
  32. Meng, S.; Sima, Y. Foreign competition and corporate social responsibility: The role of the firm-government relationships. Chin. Manag. Stud. 2023, 17, 89–111. [Google Scholar] [CrossRef]
  33. Fan, G.; Wang, X.; Zhu, H. NERI Index of Marketization of China’s Provinces 2011 Report; Economic Science Press: Beijing, China, 2011. [Google Scholar]
  34. Fu, L.L.; Pan, L.Y.; Zhao, J.M. Can passive investors improve corporate social responsibility? Evidence from Chinese listed firms. Emerg. Mark. Financ. Trade 2023, 59, 404–419. [Google Scholar] [CrossRef]
  35. Bai, G.Y.; Li, T.G.; Xu, P. Can analyst coverage enhance corporate innovation legitimacy? -Heterogeneity analysis based on different situational mechanisms. J. Clean Prod. 2023, 405, 13. [Google Scholar] [CrossRef]
  36. Kempf, A.; Osthoff, P. SRI funds: Nomen est omen. J. Bus. Finan. Account. 2008, 35, 1276–1294. [Google Scholar] [CrossRef]
  37. Zhang, C.; Zhu, S.; Wu, Y.; Chen, M. Research on behavior and performance of socially responsible investing based on fund holdings. Chin. J. Manag. 2021, 18, 1840–1850. [Google Scholar] [CrossRef]
  38. Li, Z.F.; Patel, S.; Ramani, S. The role of mutual funds in corporate social responsibility. J. Bus. Ethics 2021, 174, 715–737. [Google Scholar] [CrossRef]
  39. Shi, Y.; Song, M.; Li, F.; Zhen, H. Share pledge of controlling shareholders and protection of corporate creditors interests: Evidence from China’s bond market. Econ. Res. J. 2021, 56, 109–126. [Google Scholar]
  40. Lewbel, A. Using heteroscedasticity to identify and estimate mismeasured and endogenous regressor models. J. Bus. Econ. Stat. 2012, 30, 67–80. [Google Scholar] [CrossRef]
  41. Breusch, T.S.; Pagan, A.R. A simple test for heteroscedasticity and random coefficient variation. Econometrica 1979, 47, 1287–1294. [Google Scholar] [CrossRef]
  42. Baum, C.F.; Lewbel, A. Advice on using heteroskedasticity-based identification. Stata J. 2019, 19, 757–767. [Google Scholar] [CrossRef]
  43. Hasan, F. Corporate social responsibility and agency cost: Evidence from the UK retail industry. Int. J. Res. Financ. Manag. 2021, 4, 105–115. [Google Scholar] [CrossRef]
  44. Bernard, J.; Boiral, O.; Guillaumie, L.; Brotherton, M.C. Does proxy voting really promote corporate sustainability? Corp. Gov. 2022, 31, 445–463. [Google Scholar] [CrossRef]
  45. Baloria, V.P.; Klassen, K.J.; Wiedman, C.I. Shareholder activism and voluntary disclosure initiation: The case of political spending. Contemp. Account. Res. 2019, 36, 904–933. [Google Scholar] [CrossRef]
Figure 1. Relationship between the propensity for SRI of funds and investee CSP.
Sustainability 15 08671 g001
Table 1. Variable definitions and descriptions.
VariableDefinition or Description
Dependent
CSPSocial responsibility total score from Hexun. A greater value indicates better corporate social performance.
Explanatory
PSRIOverall propensity for SRI of mutual funds among the shareholders of a company. First, we calculate the weighted average propensity for SRI of mutual funds among the shareholders of a company at the end of each year, then we average the year-end value and the previous-year-end value to proxy the PSRI of the entire year.
A larger PSRI indicates greater propensity for SRI.
PSRI_AFirm-level PSRI score adjusted by excluding the data of the indicated firm when calculating the propensity for SRI of mutual funds holding the stock of the indicated firm. A larger PSRI_A indicates greater propensity for SRI.
Mechanism
INCTRLThe annual DIB internal control index of the company. A greater value indicates better internal control.
DISCLA dummy variable that equals 1 if the company publishes a social responsibility report separately from the annual report for that year. Such companies are considered to have better disclosure of social responsibility information.
EMKTProvincial Fan et al. [33] marketization index. A greater value indicates better marketization of the region where a company is located.
ECOMPEThe opposite number of Herfindahl index of the annual operating income of all companies within an industry. A greater value indicates a higher degree of competition within the industry that a company belongs to.
Controls
SIZELogarithmic average of year-end and previous-year-end values of total assets of a company.
AGEAverage of year-end and previous-year-end values of company age.
LEVAverage of year-end and previous-year-end values of asset-liability ratio.
BMAverage of year-end and previous-year-end values of B/M ratio.
GROWTHAnnual growth rate of the operating income.
ROEAnnual return on equity.
INSAverage of year-end and previous-year-end percentages of shares held by institutional investors.
TOPAverage of year-end and previous-year-end percentages of shares held by the top shareholder.
ZINDEXAverage of year-end and previous-year-end Z index. Z index is the ratio of shares held by the top shareholder to the shares held by the second largest shareholder.
DUALA dummy variable that equals 1 if the CEO also acts as the chairman of the board within the year.
INDDAverage of year-end and previous-year-end rates of independent directors.
SOEA dummy variable that equals 1 if the company is a state-owned enterprise.
Table 2. Descriptive statistics.
VariableObsMeanMedianStdMinMax
CSP11,45427.12122.83517.368−1.39075.510
PSRI11,4540.3730.3600.0880.2240.594
PSRI_A11,4540.3730.3610.0880.2240.595
INCTRL11,454658.427671.96096.0530.000849.300
DISCL11,4540.3030.0000.4600.0001.000
EMKT11,4548.2458.8901.7182.92010.290
ECOMPE11,454−0.265−0.2410.075−0.599−0.201
SIZE11,45422.22222.0391.25119.92226.012
AGE11,45417.31716.8625.1464.19532.645
LEV11,4540.4170.4080.2030.0520.856
BM11,4540.5880.5760.2250.1481.063
GROWTH11,4540.1820.1110.395−0.4902.573
ROE11,4540.0720.0680.077−0.2440.300
INS11,4540.4040.4110.2240.0090.872
TOP11,4540.2300.2000.1780.0060.691
ZINDEX11,45410.0753.50816.4751.023103.669
DUAL11,4540.2840.0000.4510.0001.000
INDD11,4540.3730.3540.0500.3330.571
SOE11,4540.3730.0000.4840.0001.000
Table 3. Baseline regression: impact of propensity for SRI on CSP.
(1)(2)(3)(4)
CSPCSPCSPCSP
PSRI41.741 ***42.010 ***
(9.59)(9.74)
PSRI_A 33.192 ***33.490 ***
(7.55)(7.69)
SIZE4.017 ***4.124 ***4.331 ***4.435 ***
(12.00)(12.16)(12.88)(13.02)
AGE0.0520.0570.0540.059
(1.17)(1.27)(1.21)(1.32)
LEV−12.303 ***−12.644 ***−12.664 ***−13.002 ***
(−9.33)(−9.56)(−9.54)(−9.77)
BM−4.360 ***−4.256 ***−4.910 ***−4.801 ***
(−2.78)(−2.73)(−3.11)(−3.06)
GROWTH−0.751 ***−0.736 **−0.847 ***−0.829 ***
(−2.58)(−2.53)(−2.90)(−2.84)
ROE72.320 ***72.394 ***72.902 ***72.980 ***
(28.48)(28.51)(28.53)(28.56)
INS−1.742−1.898−1.776−1.934
(−1.14)(−1.23)(−1.15)(−1.25)
TOP2.4112.6552.3232.568
(1.13)(1.24)(1.08)(1.19)
ZINDEX0.0000.0010.0010.002
(0.02)(0.07)(0.07)(0.12)
DUAL−0.262−0.286−0.268−0.290
(−0.67)(−0.74)(−0.68)(−0.74)
INDD0.8120.4640.9080.557
(0.21)(0.12)(0.23)(0.14)
SOE2.294 ***2.278 ***2.360 ***2.338 ***
(4.17)(4.04)(4.26)(4.11)
Constant−76.887 ***−79.224 ***−80.342 ***−82.627 ***
(−12.44)(−12.60)(−12.92)(−13.05)
Year FEYESYESYESYES
Industry FEYESNOYESNO
Industry subcategory FENOYESNOYES
Adj R20.3480.3500.3450.347
R20.3520.3550.3480.352
N11,45411,45411,45411,454
Note: The t-statistics calculated based on cluster robust standard errors are in brackets below the regression coefficients. ** and *** indicate significance at the 5%, and 1% levels, respectively. “YES” indicates that the corresponding fixed effects are controlled.
Table 4. Lagged independent variables: impact of propensity for SRI on CSP.
Core Explanatory Variable LaggedAll Independent Variables Lagged
(1)(2)(3)(4)(5)(6)(7)(8)
CSPCSPCSPCSPF_CSPF_CSPF_CSPF_CSP
PSRI 28.835 ***29.441 ***
(6.36)(6.60)
PSRI_A 21.386 ***21.999 ***
(4.67)(4.88)
L_PSRI32.992 ***33.058 ***
(7.38)(7.49)
L_PSRI_A 25.625 ***25.718 ***
(5.66)(5.76)
Constant−66.346 ***−68.710 ***−68.842 ***−71.172 ***−73.986 ***−75.999 ***−77.175 ***−79.134 ***
(−9.93)(−10.16)(−10.24)(−10.45)(−11.34)(−11.48)(−11.77)(−11.89)
CVsYESYESYESYESYESYESYESYES
Year FEYESYESYESYESYESYESYESYES
Industry FEYESNOYESNOYESNOYESNO
Industry subcategory FENOYESNOYESNOYESNOYES
Adj R20.3340.3360.3310.3320.2720.2740.2700.271
R20.3390.3420.3360.3390.2770.2810.2750.278
N88628862885388539065906590659065
Note: The t-statistics calculated based on cluster robust standard errors are in brackets below the regression coefficients. *** indicate significance at the 1% level. “YES” indicates that the corresponding fixed effects are controlled.
Table 5. Instrument variable method: impact of propensity for SRI on CSP.
(1)(2)(3)(4)
PSRICSPPSRI_ACSP
PSRI 129.295 ***
(3.99)
IV0.121 ***
(7.32)
PSRI_A 129.086 ***
(3.81)
IV _A 0.118 ***
(7.15)
Constant−0.381 ***−48.389 ***−0.368 ***−50.172 ***
(−21.36)(−3.18)(−20.81)(−3.26)
CVsYESYESYESYES
Year FEYESYESYESYES
Industry FEYESYESYESYES
Adj R20.7880.3050.7870.293
R20.7890.3090.7880.297
Kleibergen–Paap 53.634 51.151
N11,45411,45411,45411,454
Note: The t-statistics calculated based on cluster robust standard errors are in brackets below the regression coefficients. *** indicates significance at the 1% levels. “YES” indicates that the corresponding fixed effects are controlled.
Table 6. Robustness test: CSP reflected by the CSI ESG rating.
OLSOLSOLSOLSOLogitOLogit
(1)(2)(3)(4)(5)(6)
CSP_HZCSP_HZCSP_HZCSP_HZCSP_HZCSP_HZ
PSRI18.291 ***18.728 *** 3.883 ***
(6.46)(6.63) (6.72)
PSRI_A 11.644 ***12.072 *** 2.497 ***
(4.11)(4.28) (4.33)
Constant−7.790 *−8.514 *−10.302 **−10.992 **
(−1.77)(−1.90)(−2.34)(−2.45)
CVsYESYESYESYESYESYES
Year FEYESYESYESYESYESYES
Industry FEYESNOYESNONONO
Industry subcategory FENOYESNOYESNONO
Adj R20.2620.2680.2600.265
R20.2660.2730.2640.270
Pseudo R2 0.1130.111
N11,41611,41611,41611,41611,41611,416
Note: The t-statistics calculated based on cluster robust standard errors are in brackets below the regression coefficients. *, ** and *** indicate significance at the 10%, 5%, and 1% levels, respectively.
Table 7. Mechanism of social responsibility information disclosure.
LogitLogitOLSOLSOLSOLS
(1)(2)(3)(4)(5)(6)
DISCLDISCLDISCLDISCLCSPCSP
PSRI5.796 *** 0.904 *** 22.792 ***
(6.06) (7.19) (7.70)
PSRI_A 3.360 *** 0.574 *** 21.113 ***
(3.59) (4.56) (7.11)
DISCL 20.967 ***21.060 ***
(55.76)(56.11)
Constant−26.277 ***−26.931 ***−4.013 ***−4.138 ***7.253 *6.794
(−15.74)(−16.04)(−19.04)(−19.64)(1.74)(1.62)
CVsYESYESYESYESYESYES
Year FEYESYESYESYESYESYES
Industry FEYESYESYESYESYESYES
Pseudo R20.2540.250
Chi2591.349575.758
Adj R2 0.2830.2790.5690.568
R2 0.2870.2830.5710.571
Sobel_z 10.0906.433
Mediated rate 0.4540.364
N11,40111,40111,45411,45411,45411,454
Note: The t-statistics calculated based on cluster robust standard errors are in brackets below the regression coefficients. * and *** indicate significance at the 10% and 1% levels, respectively.
Table 8. Mechanism of internal control level of the enterprise.
(1)(2)(3)(4)
INCTRLINCTRLCSPCSP
PSRI44.178 * 41.443 ***
(1.95) (9.53)
PSRI_A 43.116 * 32.898 ***
(1.90) (7.50)
INCTRL 0.007 ***0.007 ***
(4.00)(4.05)
Constant397.268 ***396.348 ***−79.560 ***−83.045 ***
(12.46)(12.45)(−12.83)(−13.30)
CVsYESYESYESYES
Year FEYESYESYESYES
Industry FEYESYESYESYES
Adj R20.1690.1690.3490.346
R20.1740.1740.3530.349
Sobel_z 1.9831.952
Mediated rate 0.0070.009
N11,45411,45411,45411,454
Note: The t-statistics calculated based on cluster robust standard errors are in brackets below the regression coefficients. * and *** indicate significance at the 10%, and 1% levels, respectively.
Table 9. Moderators of the PSRI–CSP correlation.
(1)(2)(3)(4)
CSPCSPCSPCSP
PSRI48.513 ***48.592 ***
(4.22)(4.25)
PSRI×EMKT−2.362 **−2.363 **
(−2.25)(−2.27)
PSRI×ECOMPE−41.759 *−42.848 *
(−1.81)(−1.88)
PSRI_A 38.833 ***38.970 ***
(3.36)(3.39)
PSRI_A×EMKT −2.425 **−2.426 **
(−2.29)(−2.31)
PSRI_A×ECOMPE −47.867 **−48.767 **
(−2.06)(−2.14)
EMKT1.086 ***1.094 ***1.115 ***1.124 ***
(2.92)(2.96)(2.96)(3.00)
ECOMPE24.417 ***14.954 *26.935 ***17.442 *
(2.79)(1.67)(3.04)(1.93)
Constant−79.317 ***−83.588 ***−82.278 ***−86.531 ***
(−10.62)(−11.09)(−10.90)(−11.35)
CVsYESYESYESYES
Year FEYESYESYESYES
Industry FEYESNOYESNO
Industry subcategory FENOYESNOYES
Adj R20.3500.3510.3460.348
R20.3530.3560.3500.353
N11,45411,45411,45411,454
Note: The t-statistics calculated based on cluster robust standard errors are in brackets below the regression coefficients. *, ** and *** indicate significance at the 10%, 5%, and 1% levels, respectively.
Table 10. The PSRI–CSP relationship under different social trust atmospheres.
Social TrustPoorGoodPoorGood
Atmosphere(1)(2)(3)(4)
CSPCSPCSPCSP
PSRI37.678 ***46.763 ***
(6.62)(8.88)
PSRI_A 29.304 ***37.942 ***
(5.09)(7.20)
Constant−76.782 ***−77.399 ***−80.211 ***−80.891 ***
(−9.51)(−10.84)(−9.88)(−11.25)
CVsYESYESYESYES
Year FEYESYESYESYES
Industry FEYESYESYESYES
Adj R20.3530.3450.3490.341
R20.3600.3520.3560.348
N5727572757275727
Note: The t-statistics calculated based on cluster robust standard errors are in brackets below the regression coefficients. *** indicates significance at the 1% levels.
Table 11. The PSRI–CSP relationship between SOEs and non-SOEs.
Non-SOESOENon-SOESOE
(1)(2)(3)(4)
CSPCSPCSPCSP
PSRI35.816 ***48.520 ***
(7.08)(6.07)
PSRI_A 27.747 ***38.859 ***
(5.42)(4.86)
Constant−69.841 ***−68.764 ***−72.324 ***−73.252 ***
(−8.28)(−6.84)(−8.45)(−7.31)
CVsYESYESYESYES
Year FEYESYESYESYES
Industry FEYESYESYESYES
Adj R20.3250.3730.3220.370
R20.3310.3820.3270.378
N7183427171834271
Note: The t-statistics calculated based on cluster robust standard errors are in brackets below the regression coefficients. *** indicates significance at the 1% levels.
Disclaimer/Publisher’s Note: The statements, opinions and data contained in all publications are solely those of the individual author(s) and contributor(s) and not of MDPI and/or the editor(s). MDPI and/or the editor(s) disclaim responsibility for any injury to people or property resulting from any ideas, methods, instructions or products referred to in the content.

