Article

Recovery of Bound Phenolic Compounds from Rice Hulls via Microwave-Assisted Alkaline Hydrolysis

by
Anastasia Kyriakoudi
1,
Kleoniki Misirli
2,
Ioannis Mourtzinos
1,* and
Nikolaos Nenadis
2,*
1
Laboratory of Food Chemistry and Biochemistry, School of Agriculture, Aristotle University of Thessaloniki (AUTH), 54124 Thessaloniki, Greece
2
Laboratory of Food Chemistry and Technology, School of Chemistry, Aristotle University of Thessaloniki (AUTH), 54124 Thessaloniki, Greece
*
Authors to whom correspondence should be addressed.
Sustainability 2023, 15(10), 8425; https://doi.org/10.3390/su15108425
Submission received: 18 April 2023 / Revised: 16 May 2023 / Accepted: 20 May 2023 / Published: 22 May 2023
(This article belongs to the Special Issue A Sustainable Approach in Food Science and Technology Aspects)

Abstract

:
The present study aimed to optimize the recovery of bound phenolic antioxidants from rice hulls via microwave-assisted alkaline hydrolysis using response surface methodology. The microwave treatment duration, temperature, and solvent:solid ratio were the independent variables selected; whereas total phenol content, antioxidant activity (DPPH, ABTS●+, CUPRAC assays), and the p-coumaric and ferulic acids concentration were the dependent ones. The optimum conditions were found to be 3.6 min, 155 °C, and 50:1 v/w which were then applied to hulls from different rice varieties cultivated in Greece [Gladio, Krezo, Scirocco, Karolina (two samples), Europa, Bravo, Bella (parboiled), and Fino (long-grain rice)]. The results were compared to those obtained using an optimized ultrasound-assisted alkaline hydrolysis protocol (120 min, 80 °C, 50:1 v/w) proposed in the literature. The values obtained with microwaves were much higher compared to those obtained by ultrasounds (i.e., p-coumaric acid levels were 1.2 to 2.2-fold higher, and those of ferulic acid were 2.1 to 6.0-fold higher) using almost 2-fold higher temperature but reducing the hydrolysis duration by ~33-fold. Thus, the optimized approach may assist the valorization of rice hulls as a sustainable source of natural phenolic antioxidants for novel food applications.

1. Introduction

Rice (Oryza sativa L.) is the second most important cereal grain in the world after wheat, and constitutes a staple food for millions of people, especially in Asian countries [1]. The rice-milling process results in the production of high volumes of low-value by-products and wastes, such as rice bran and hulls (or husks). The latter accounts for nearly 20% of the grain weight and represents a major disposal issue for the rice-milling industry worldwide as it is estimated that ~120 million tons of hulls are produced every year. Until now, rice hulls, which mainly consist of cellulose (~35%), hemicellulose (~25%), lignin (~20%), and inorganic elements (~17%), are traditionally used as a fuel for power generation and steam production for parboiling, since their high silicon content, as well as their low digestibility, limit their food and feed applications [2]. Even though they contain significant amounts of valuable phenolic compounds (e.g., ferulic and p-coumaric acids) [3], the latter ones are localized in the cell wall matrix of the plant in bound forms with carbohydrates, lignin, or silicon via ester or ether bonds. Only a small amount of them is found in free soluble form [4]. Bound phenolic compounds cannot be easily liberated with mild conditions, and therefore drastic ones are required. In this frame, alkaline hydrolysis, facilitating the cleavage of ester linkages of ferulic acid with polysaccharides and ether linkages with lignin, is the most common chemical hydrolysis method employed to liberate bound phenolics from rice hulls [5]. Instead with an acidic approach (e.g., using hydrochloric or sulfuric acid), though glycosidic bonds are broken, the ester and ether bonds remain intact and hydroxycinnamic acids may even be degraded. An alternative approach, namely the use of enzymatic extraction, is considered mild and alkaline hydrolysis is proposed as a reference regarding how phenolic acids are totally liberated in this way [6]. Furthermore, the need to find the appropriate mixture of enzymes that could best act synergistically is required and even if this is achieved, compared to alkaline hydrolysis as recently observed for the release of ferulic acid from rye and wheat bran via Viscozyme [7], the required duration of the treatment is long (24 h).
Until now, hydrolysis was performed using time-consuming conventional techniques, requiring large amounts of solvents, and having a low recovery yield. This was shown for example in the work of Butsat et al. [8] as well as Butsat and Sirianmornpun [9] who performed alkaline hydrolysis for the extraction of bound phenolic acids from hulls of different Thai rice varieties using a 2 mol/L sodium hydroxide (NaOH) solution with the aid of a shaking incubator for 1 h at 25 °C. In the same frame, Nenadis et al. [3] examined the effect of alkaline and acid digestion on the phenolic content, antioxidant activity, and phenolic composition of rice hull extracts derived from selected Greek varieties using 1 and 4 mol/L NaOH or hydrochloric acid with the aid of a commercial pressure cooker (120 °C, 120 kPa). The authors managed to reduce the duration of hydrolysis that was required compared to that using orbital-shaking at room temperature; however, 2 h were still necessary. Moreover, Vadivel and Brindha [10] used an orbital shaker to carry out alkaline and acid hydrolysis with 2 mol/L NaOH for 90 min or 2% sulfuric acid for 120 min, for the recovery of bound phenolic acids from rice hulls. Nevertheless, the extraction of bioactive compounds from various plant materials is continuously updated and innovative extraction techniques, such as enzymatic hydrolysis as well as ultrasound and microwave-assisted hydrolysis approaches, have gained popularity during the last decades [5]. Higher yields and extraction rates could be obtained using combined novel technologies [11].
However, to the best of our knowledge, information is extremely limited regarding the use of such novel techniques in the case of rice hulls. More specifically, Irakli et al. [12] optimized the ultrasound-assisted alkaline hydrolysis conditions (2.5 mol/L NaOH, 120 min, 80 °C) for the recovery of bound phenolics from rice hulls. Ultrasounds for 90 min at 40 °C were also applied by Kim et al. [13] to assist the alkaline hydrolysis of bound phenolic compounds from rice hulls using a 4 mol/L NaOH solution. The enzymatic hydrolysis with a cellulase mixture at 50 °C for 24 h as a pretreatment step has been also reported for the liberation of phenolic compounds from rice hulls from Thailand [14]. Even though the use of microwaves has been reported for the extraction of phenolic compounds from various plant materials (e.g., [15,16,17]), their application in the case of rice hulls is limited only to the recovery of free phenolic compounds using ethanol [18] or its mixtures with water [19]. Microwaves act directly on molecules by ionic conduction and dipole rotation leading to fast heating of the solvent and the sample resulting in enhanced mass transfer and extraction efficiency as well as reduced duration and solvent consumption [20].
To address these gaps, the present work aimed to systematically investigate the relationship between microwave-assisted alkaline hydrolysis conditions (i.e., duration, temperature, solvent:solid ratio) and the total phenol content, the antioxidant activity (DPPH, ABTS●+, CUPRAC assays), and the concentration of the major phenolic compounds (p-coumaric and ferulic acids) of the obtained ethyl acetate extracts derived from hulls originating from a Greek rice-milling industry.
The microwave-assisted alkaline hydrolysis conditions were optimized using response surface methodology (RSM). Then, the optimum conditions were applied to a set of nine rice hull samples and results were compared to those obtained by employing an optimized ultrasound-assisted hydrolysis protocol proposed in the literature for the same purpose [12].

2. Materials and Methods

2.1. Reagents and Solvents

Ferulic acid (99%) and p-coumaric acid (99%) were purchased from Biosynth (Compton, UK). Trolox (6-hydroxy-2,5,7,8-tetramethyl-chroman-2-carboxylic acid) (97%) was from Aldrich Chemical Cο., (Steinheim, Germany). DPPH (1,1-diphenyl-2-picrylhydrazyl radical), ABTS [2,2′-azinobis (3-ethylbenzothiazoline-6-sulfonic acid) diammonium salt] and neocuproine were from Sigma Chemical Co. (St. Louis, MO, USA). Potassium persulfate was from Supelco Inc (Bellefonte, PA, USA), whereas copper chloride dehydrate was from Thermo Fisher (Kandel) GmbH (Kandel, Germany). Folin-Ciocalteu’s phenol reagent, sodium carbonate, ammonium acetate, sodium sulfate anhydrous, potassium chloride, sodium hydroxide pellets, potassium dihydrogen phosphate, di-sodium hydrogen phosphate, hydrochloric acid (37%, w/w), and glacial acetic acid, as well as HPLC grade methanol, ethanol, water, and ethyl acetate, were purchased from Chem-Lab (Zedelgen, Belgium).

2.2. Materials

Rice hull samples from different commercial varieties cultivated in Greece, namely Gladio, Krezo, Scirocco, Karolina (two samples), Europa, Bravo, Bella (parboiled), and Fino (long grain rice), as well as a mixture of rice hulls of different varieties, were kindly donated by Agrino EV. GE. PISTIOLAS S.A. (Agrinio, Greece). The hulls were ground in a laboratory mill (Arthur H. Thomas Co., Philadelphia, PA, USA), passed through a 0.25 mm sieve, and stored in a glass jar without headspace in the dark until further use.

2.3. Experimental Design for Optimizing the Microwave-Assisted Alkaline Hydrolysis of Rice Hulls

A mixture of hulls from different rice varieties cultivated in Greece was subjected to alkaline hydrolysis with the aid of microwaves for various periods (t), temperature (T), and solvent:solid ratios (S/S) values. A MARS X microwave digestion oven (CEM, Model 1000, Matthews, NC, USA) equipped with a 14-vessel carousel, PTFE vessels and a stirring mechanism was used. During the operation, both temperature and pressure were monitored in a control vessel. The microwave oven delivered energy at a frequency of 2450 MHz and operated at a constant power of 1200 W, which is the maximum power output of the instrument. Different amounts of the rice hull sample were weighed directly into the PTFE vessels and 25 mL of 4 N NaOH were added. At the end of each process, the mixture was centrifuged at 6000 rpm for 20 min. The supernatant was collected, and the pH value was adjusted to 1 with 12 mol/L HCl acid in an ice bath. The solution was then centrifuged once more (6000 rpm, 20 min) and the collected supernatant was then extracted with ethyl acetate (3 × 50 mL). The ethyl acetate fractions were combined and dried with anhydrous sodium sulfate. The solvent was then evaporated to dryness and the dry residue was re-dissolved in 15 mL methanol for further analyses.
Experiments aiming to study the effects of three independent variables of the microwave-assisted alkaline hydrolysis, namely, duration (min) (X1), temperature (°C) (X2), and solvent:solid ratio (X3), were designed in Minitab 15.1.20.0 (Minitab, Inc., State College, PA, USA) software, using an unblocked full factorial central composite design (CCD) for the response surface methodology. Each of these factors had five experimental levels coded as −a, −1, 0, +1, +a (a = 1.41421), where −1, +1, and 0, correspond to the low, high, and mid-levels. The low and the high levels were selected for each of the above factors and the rest were calculated from the equation shown as a footnote in Table 1.
The CCD consisted of twenty experimental runs, six of which were conducted at the center points to detect any deviation in linearity that may exist in the models (Table 2). A wide range of responses were examined: total phenol content (TPC) (Y1), DPPH (ADPPH) (Y2) and ABTS●+ (AABTS) (Y3) radical scavenging activity, plus cupric ion reducing antioxidant capacity (ACUPRAC) (Y4), as well as the concentration of p-coumaric acid (p-CA) (Y5) and ferulic acid (FA) (Y6). Each experimental response was analyzed, and a second-order regression equation was obtained:
Υ = β0+ β1X1 + β2X2 + β3X3 + β11X12 + β22X22 + β33X32 + β12X1X2 + β13X1X3 + β23X2X3
where Υ corresponds to the responses, X1, X2, and X3 represent the factors of duration, temperature, and solvent:solid ratio, and β0, β1, … β23 are the estimated coefficients with β0 being a scaling constant.
The significance of the models was evaluated by analysis of variance (ANOVA). The quality of the fit of the polynomial model was expressed by the value of the coefficient of determination (R2), the significance of each parameter through the F-test (calculated p-value), and the lack of fit of the model. Coefficients with a p-value lower than 0.05 were considered statistically significant. Where possible, the model was simplified by the omission of insignificant terms. Multi-response optimization of the fitted polynomials was also performed using the Minitab software. The optimum conditions found by RSM were experimentally tested at least in triplicate, aiming to investigate whether the experimental response values matched with the model prediction outcomes.

2.4. Determination of the Total Phenol Content (TPC)

The total polar phenol content of the prepared rice hull extracts was determined spectrophotometrically by the Folin-Ciocalteu assay as previously described by Nenadis et al. [3] using a UV-1800 spectrophotometer, Shimadzu, Kyoto, Japan. Gallic acid was used as a reference standard and results were expressed as gallic acid equivalents (mg GAE/100 g dry rice hulls). Measurements were performed at least in triplicate and results were expressed as the mean value ± s.d.

2.5. Antioxidant Activity Determination

The DPPH scavenging activity (ADPPH) was determined according to Nenadis et al. [3] using 0.1 or 0.05 mL rice hull extracts with the aid of a UV-1800 spectrophotometer. Radical scavenging activity (%) values (%RSA) were determined by using the formula %RSA = [Abs515(t = 0) − Abs515(t)] × 100/Abs515(t = 0) after correction with appropriate blanks. These values were converted to Trolox equivalents via a calibration curve (y = 0.6451x + 1.6615, R2 = 0.995). ABTS●+ scavenging activity (AABTS) was evaluated according to the protocol of Re et al. [21] using 10 or 20 μL of diluted rice hull extracts (1:10, v/v, with methanol). Inhibition in percent (% Inh) was calculated via the formula % Inh = [Abs734(t = 0) − Abs734(t)] × 100/Abs734(t = 0) after correction with an appropriate blank. These values were converted to Trolox equivalents via a calibration curve (y = 2.8165x − 0.1907, R2 = 0.999). The cupric ion-reducing antioxidant capacity (ACUPRAC) of rice hull extracts was measured according to the protocol of Apak et al. [22]. Absorbance at 450 nm was recorded after 30 min and these values were converted to Trolox equivalents via a calibration curve (y = 0.0038x − 0.1098, R2 = 0.996). In all cases, measurements were performed at least in triplicate and results were finally expressed as μmol Trolox/100 g dry rice hulls ± s.d.

2.6. RP-HPLC-DAD Analysis of Phenolic Compounds

The content of p-CA and FA were determined by RP-HPLC-DAD. The HPLC system consisted of a Marathon IV series HPLC pump (Rigas Laboratories, Thessaloniki, Greece), an injection valve with a 20 µL fixed loop (Rheodyne, Cotaki, CA, USA) and a UV6000 LP diode array detector (DAD, Thermo Separation Products, San Jose, CA, USA). Separation was carried out on a Fortis C18 (250 mm × 4.6 mm i.d., 5 µm) column (Fortis Technologies Ltd., UK) using isocratic elution as described by Hegde et al. [23] with slight modifications. In particular, the elution system was a mixture of water:acetic acid:methanol (70.5:5:24.5 v/v). The flow rate was 0.8 mL/min. Column temperature was set at 35 °C with the aid of a Timberline TL-50 controller and maintained as such in a TL-340 column heater. Injection volume was 20 µL. The analytical sample was prepared after proper dilution with methanol and filtration through 0.45 µm PTFE hydrophilic filters (Frisenette, Knebel, Denmark). Monitoring was in the range 200–600 nm. Identification of p-CA and FA was achieved by comparing the retention times and spectral characteristics (absorption maxima) with those of available standards. Their quantification (mg/100 g dry hulls) was based on the construction of appropriate calibration curves of properly diluted methanolic solutions of (i) p-CA at 310 nm (y = 26,701.36x + 5,534,707.48, R2 = 0.989, 200–2000 ng/20 µL, n = 6) and (ii) FA at 324 nm (y = 17,985.51x + 706,053.68, R2 = 0.994, 100–2000 ng/20 µL, n = 7). Chromatographic data were processed using the ChromQuest version 3.1.6 software (Thermo Electron Corporation, Beverly, CA, USA).

2.7. Application of Optimum Conditions to Rice Hull Samples of Different Varieties and Comparison to Ultrasound-Assisted Alkaline Hydrolysis

The optimized microwave-assisted alkaline hydrolysis conditions were then applied to hull samples of different rice varieties cultivated in Greece [Gladio, Krezo, Scirocco, Karolina (two samples), Europa, Bravo, Bella (parboiled), and Fino (long grain rice)]. For comparison purposes, extraction conditions of an optimized ultrasound-assisted extraction protocol proposed in the literature [12] for the recovery of bound phenolic compounds from rice hulls were also applied to the same samples. According to this protocol, 0.2 g rice hulls were extracted with 10 mL of 2.5 N NaOH with the aid of a sonication bath for 120 min at 80 °C. During sonication, the temperature was measured periodically with the aid of an external thermometer. At the end of this process, the mixture was centrifuged at 1500× g for 5 min, the pH value of the collected supernatant was adjusted to 1 with 12 mol/L HCl acid in an ice bath and the solution was centrifuged once more (1500× g, 5 min). The collected supernatant was then extracted with ethyl acetate (3 × 25 mL), and the ethyl acetate fractions were collected, combined, and dried over anhydrous sodium sulfate. The solvent was then evaporated to dryness and the dry residue was re-dissolved in 5 mL of an ethanol-water mixture, 50:50, v/v, for further studies.

2.8. Statistical Analysis

To identify significant differences between the mean values obtained for each measured parameter by applying microwave- and ultrasound-assisted alkaline hydrolysis, a two-tailed paired t-test was carried out (p = 0.05) using the IBM SPSS Statistics for Windows software, Version 27.0 (IBM Corp., Armonk, NY, USA).

3. Results

3.1. Model Fitting for TPC, ADPPH, AABTS, ACUPRAC, p-CA, and FA

RSM was applied to investigate the effects of duration of microwave-assisted alkaline hydrolysis (X1), temperature (X2), and solvent:solid ratio (X3) on the TPC, ADPPH, AABTS, ACUPRAC, p-CA, and FA values. Treatment with microwaves was selected, as these electromagnetic waves, which cause the rotation of dipole molecules (e.g., water) and generate heat, can lead to enhanced extraction efficiency and reduced duration compared to conventional techniques, contributing to energy saving [24]. Experimental responses (Table 2) for all the examined variables were analyzed by ANOVA (Table 3) to test the validity of each model. The experimental data in all cases were fitted to the second-order polynomial model Equation (1). Models for DPPH scavenging activity and FA content revealed a non-significant regression. On the other hand, the models for TPC, AABTS, ACUPRAC, and p-CA showed a statistically significant regression, non-significant lack-of-fit, and R2 ranging from 0.804 to 0.919, indicating that they could explain > 80% of the variability of the responses. Simplified second-order polynomial equations [Equations (2)–(9)] obtained for the four responses (Models A–D) are shown in Table 4.

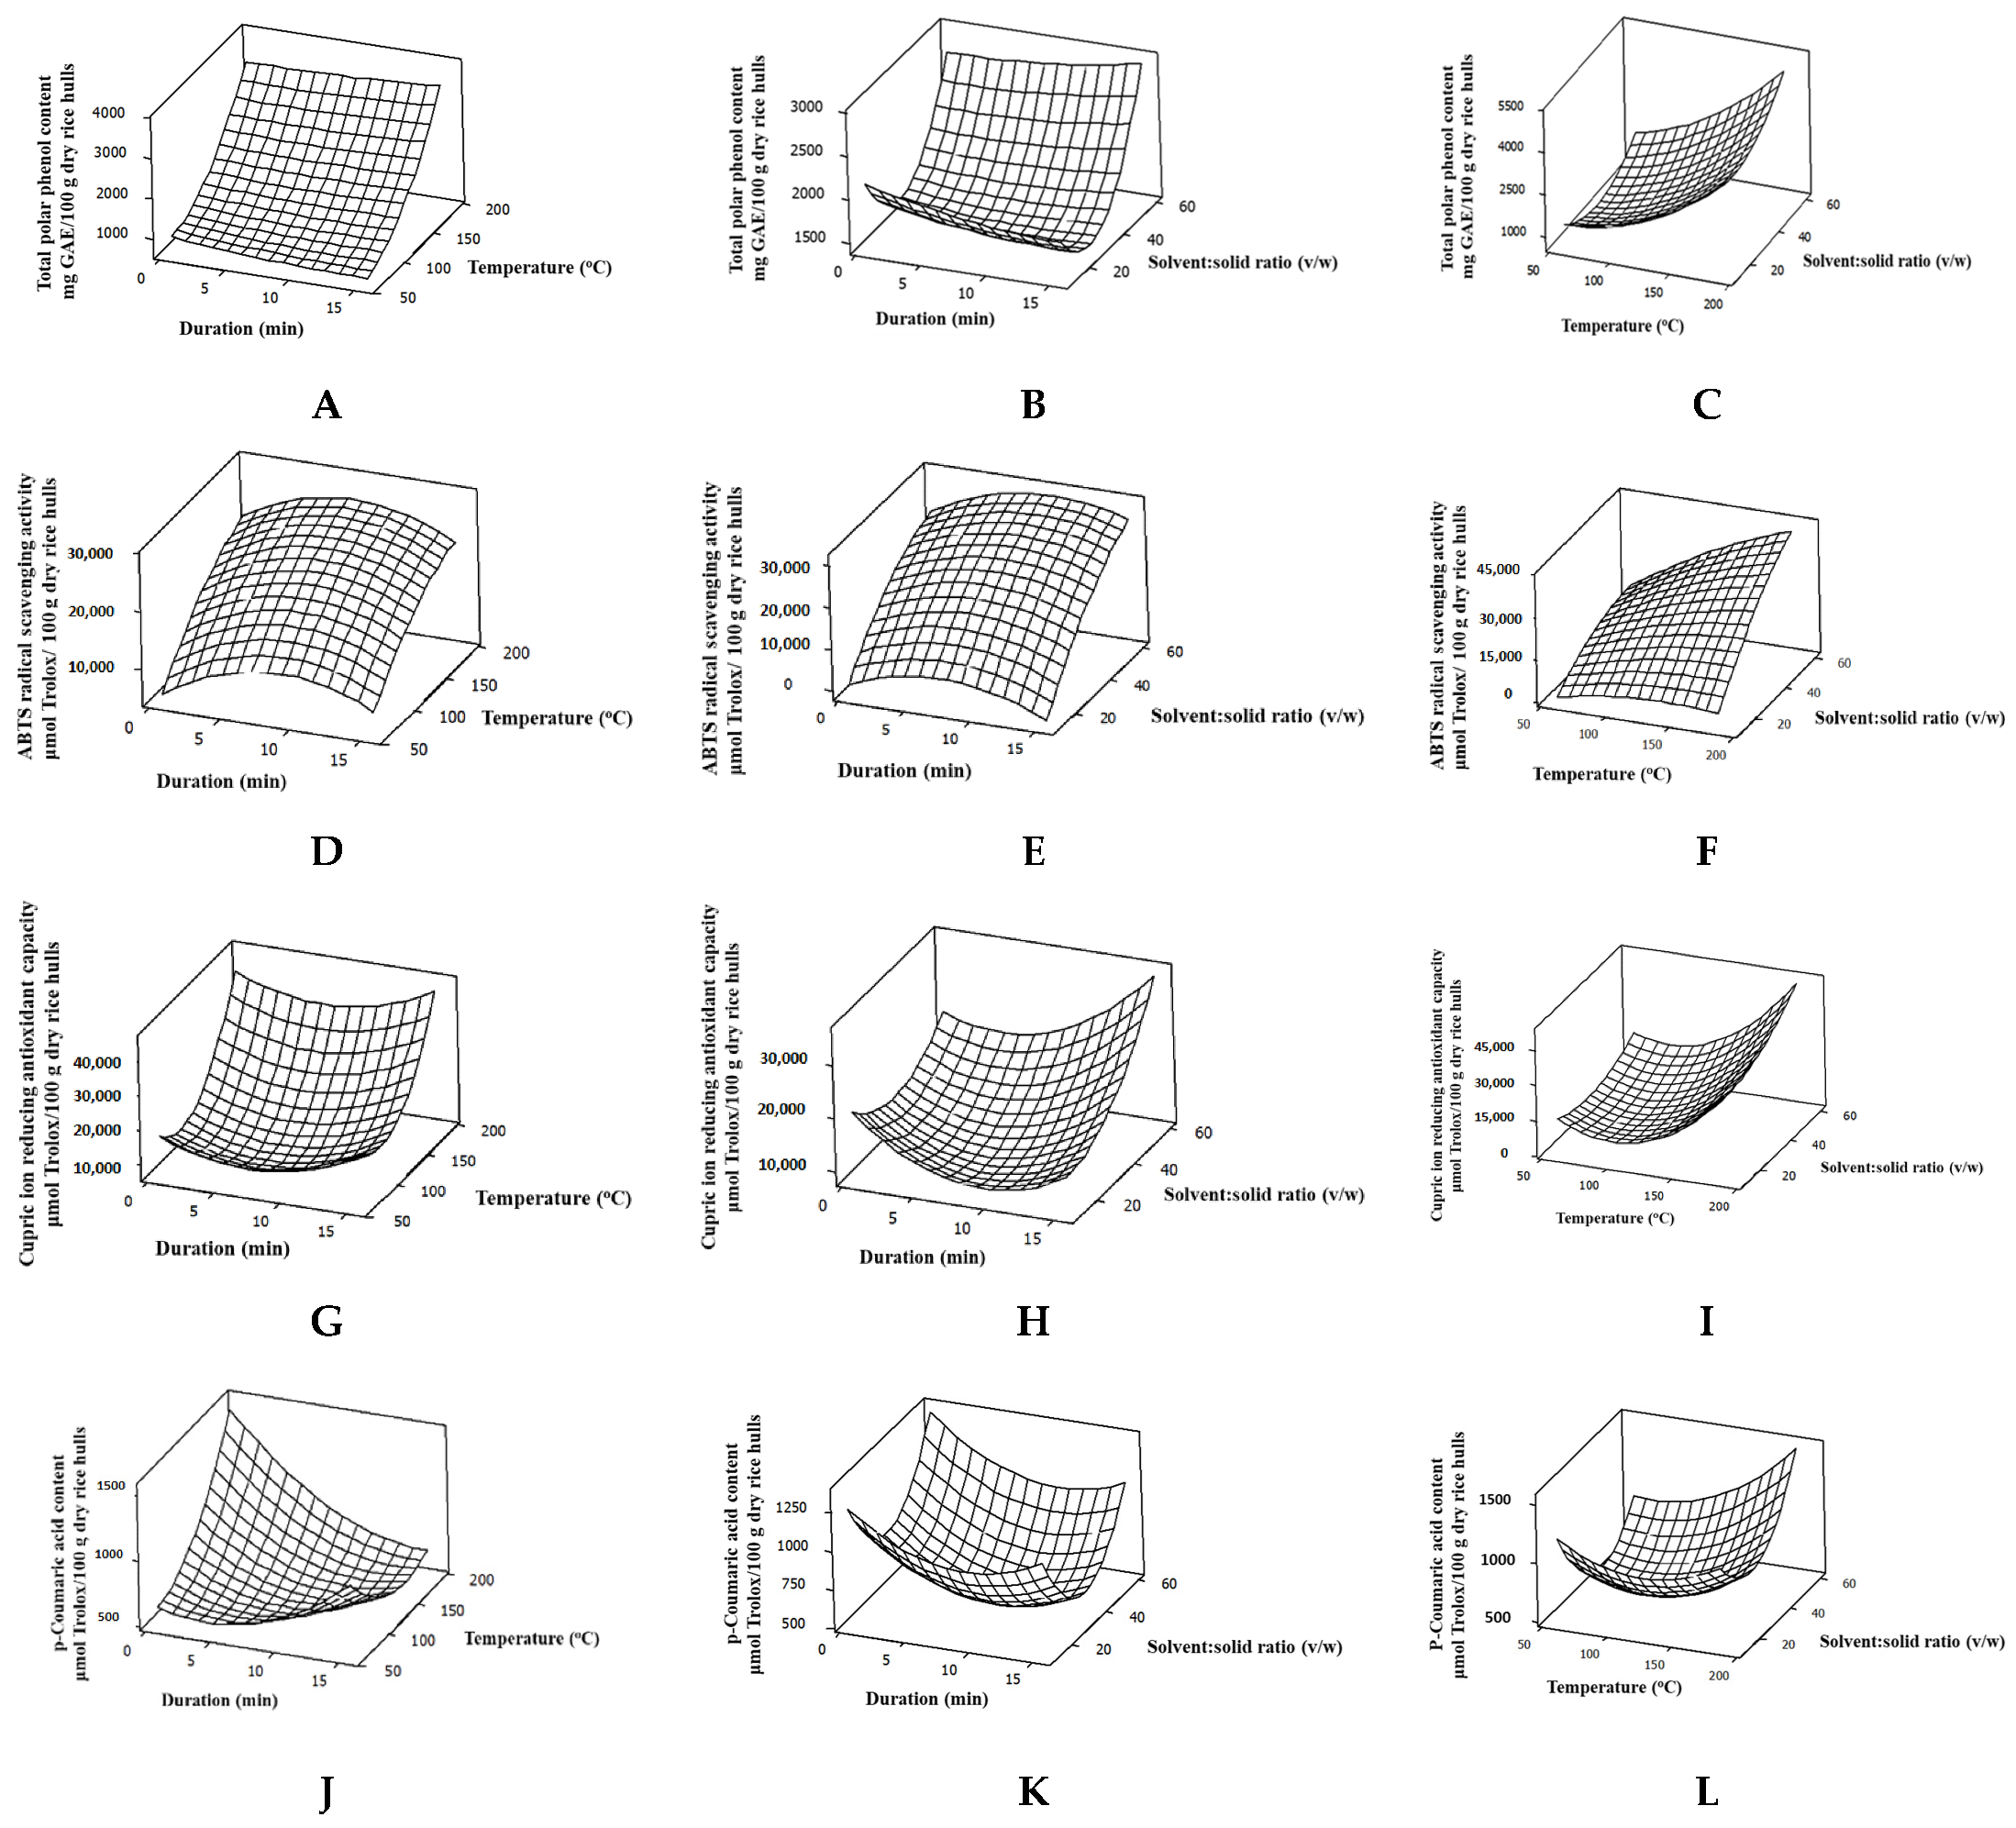
3.2. Main Effects of Microwave-Assisted Alkaline Hydrolysis Conditions on Total Phenol Content, Antioxidant Activity, and Concentration of Major Phenolic Acids

TPC values of the obtained extracts were found to range from 826 ± 49 to 3614 ± 415 mg GAE/100 g dry rice hulls (Table 2). Analysis of variance for TPC values (Model A) showed that both linear and quadratic X3 and linear X2 had a significant and positive effect, with linear X2 exerting the strongest impact [Equation (2)]. Linear and quadratic X1 were statistically non-significant. Figure 1A–C shows the generated three-dimensional surface plots for each pair of factors keeping the third one constant at its middle level (Table 1). As is shown, TPC reached its highest absolute values upon microwave treatment at high temperatures with high solvent:solid ratio.
Antioxidant activity values of the rice hull extracts using the DPPH assay varied from 1156 ± 100 to 4261 ± 38 μmol Trolox/100 g dry rice hulls. A statistically insignificant regression model was found for DPPH scavenging activity. A lack of a statistically significant model for DPPH has also been reported by Pyrka et al. [25] who optimized olive leaves’ thin layer using intermittent near-infrared-drying. The authors attributed this finding to synergistic and/or antagonistic phenomena of phenols that may occur upon testing the extracts [26], having as a consequence the minimization of differences in the estimated antioxidant activity, despite variations in their phenolic content. On the contrary, the model B for ABTS●+ scavenging activity described 93.59% of the variability of the responses (Table 3). This could be attributed to the presence of p-CA, which is the major phenolic acid in the obtained extracts, and although inactive toward the DPPH, is reported to be a very efficient ABTS●+ scavenger, more than ferulic acid [27,28]. Regarding ABTS●+ scavenging activity, linear X2 and X3, as well as quadratic X1, were found to have significant positive and negative effect, respectively [Equation (4)]. As is shown in Figure 1D–F, illustrating the corresponding response surface plots, maximum ABTS●+ scavenging activity could be obtained when high temperature and high solvent:solid ratio are used upon microwave-assisted alkaline hydrolysis keeping the duration of irradiation up to its middle level. A statistically significant model was also found for CUPRAC assay, which is also based on an electron transfer mechanism, such as Folin Ciocalteu, indicating that the hydrolysis influences the redox properties of the rice hull extracts. A similar trend between the results obtained with Folin-Ciocalteu and CUPRAC assays has also been observed by Pyrka et al. [25], where the authors suggested that drying affects the redox status of olive leaves. Temperature (X2) and solvent:solid ratio (X3) exhibited significant and positive linear and quadratic effects on CUPRAC response, whereas the duration of microwave treatment (X1) exhibited a significant and positive quadratic effect. In Figure 1G–I, a trend toward higher CUPRAC redox potential can be noted by increasing temperature and solvent:solid ratio up to their high levels.
A statistically insignificant regression model was found for FA. On the contrary, model D for p-CA values, which were ~4-fold higher on average than those of FA, could describe 90.84% of the variability of the responses (Table 3), with linear and quadratic effects of X1 having a significant negative and positive effect, respectively. Moreover, the linear and quadratic effects of X2 as well as the quadratic effect of X3 had a significant positive effect whereas the X1X2 interaction had a significant negative effect [Equation (8)]. As shown in the corresponding surface plots in Figure 1J–L, maximum values could be obtained when a short duration of microwave treatment, high temperature, and solvent:solid ratio are used. Generally, high temperatures tend to degrade monomeric phenolic acids. However, p-CA, as well as FA, are expected to exhibit higher stability during microwave treatment due to the presence of a single hydroxyl group in the aromatic ring [29]. The increased stability combined with a short irradiation time further improves the recovery. A similar observation on the effective combination of short time-high temperature (90 s, 190 °C) has also been reported in the case of microwave-assisted extraction of the same bound phenolic acids (p-CA and FA) from sorghum, maize bran, and flour fractions upon alkaline hydrolysis (2 mol/L NaOH) [15].

3.3. Multiple Response Optimization for Microwave-Assisted Alkaline Hydrolysis Conditions

Application of RSM following a multiply response optimization approach for the independent variables (the duration of microwave-assisted alkaline hydrolysis, the temperature, and the solvent:solid ratio) based on TPC, AABTS, ACUPRAC, and p-CA values were found to be 3.6 min, 155 °C, and 50:1 v/w, respectively. The predicted values 2941 mg GAE/100 g dry rice hulls, 30,370 μmol Trolox/100 g dry rice hulls, 26,670 μmol Trolox/100 g dry rice hulls, and 1130 mg/100 g dry rice hulls, respectively, fitted well with the experimental ones of the respective responses (2659 ± 218, 33,543 ± 2268, 21,500 ± 1963, and 956 ± 49, respectively) as shown in Table 5.

3.4. Application of Optimum Conditions to Greek Rice Hull Samples and Comparison to Ultrasound-Assisted Alkaline Hydrolysis

The optimum microwave-assisted alkaline hydrolysis conditions were then applied to hull samples of nine different Greek rice varieties (Table 6, Protocol 1). The values of all measured responses were found to range from 2259 to 2995 mg GAE/100 g dry rice hulls (TPC), 3218 to 3642 μmol Trolox/100 g dry rice hulls (ADPPH), 21,191 to 29,110 μmol Trolox/100 g dry rice hulls (AABTS), 10,667 to 15,318 μmol Trolox/100 g dry rice hulls (ACUPRAC), 711 to 1269 mg/100 g dry rice hulls (p-CA), and 160 to 289 mg/100 g dry rice hulls (FA), respectively. These values were much higher compared to the respective ones obtained for extracts of the same rice hull varieties that were prepared by employing an optimized ultrasound-assisted alkaline hydrolysis protocol (Table 6, Protocol 2) proposed in the literature [12] that had a ~33-fold longer duration (120 min). For example, and focusing on the recovery of the two acids, the levels of p-CA measured after microwave irradiation were 1.2 to 2.2-fold higher, and those of FA were 2.1 to 6.0-fold higher, thus highlighting the efficiency of the proposed technique in the present work for better evaluating the bound phenol content and for obtaining more potent extracts in terms of antioxidant activity.
Concerning the determined values, the data shown in Table 5 indicate that rice hulls, regardless of the variety, contain a total phenol content higher than that of other agro-industrial by-products, such as orange peels (1583 mg/100 g), citrus pulp (566 mg/100 g) [30], potato peels (977 mg/100 g) [31], tomato peels (36 mg/100 g) [32], etc. Moreover, both the total phenol content, as well as the p-CA and FA ones, were found to be relatively high compared to those reported in the literature for hulls of Thai rice varieties that ranged from 180 to 219 mg GAE/100 g dry rice hulls, 156 to 390 mg/100 g dry rice hulls, and 14 to 25 mg/100 g dry rice hulls, respectively [9]. Such differences, beyond the biotic and abiotic factors, could also be attributed to the higher efficiency of the 4 mol/L NaOH solution for breaking the bonds between bound phenolic acids and carbohydrates and silicon, assisted by microwaves. The values of the present study are also higher compared to those reported for rice hulls of the Greek variety Axios that were found to range from 346 to 660 mg GAE/100 g upon ultrasound-assisted alkaline hydrolysis carried out with 3.4 mol/L NaOH solution at 80 °C for 110 min [10]. Such a finding was rather expected considering the presented evidence upon comparison for the nine samples. Slightly lower levels (total phenol content; 1966–2790 mg GAE/100 g dry rice hulls, p-CA content; 488–637 mg/100 g dry rice hulls, FA content; 151–204 mg/100 g dry rice hulls), have been reported by Nenadis et al. [3] who examined hulls from four Greek varieties (Gladio, Karolina, Krezo, Scirocco) upon alkaline hydrolysis using 4 mol/L NaOH solution with the aid of a pressure cooker (120 °C, 120 kPa, 2 h), although these results were not derived with an optimum Design of Experiments (DoE). The levels reported in the present study are also higher than those reported by Wanyo et al. [14] (total phenolic content; 124 mg GAE/100 g dry rice hulls) who carried out enzymatic hydrolysis of husks from Thailand rice samples using a cellulase mixture (pH = 5, 50 °C, 24 h). A total phenol content of 199 mg GAE/100 g dry rice hulls has been reported for hulls from rice samples from Korea upon alkaline hydrolysis of bound phenolic compounds using a 4 mol/L NaOH solution with the aid of ultrasounds for 90 min at 40 °C [13]. The authors observed an increase in the recovery of bound phenolic compounds of up to 890 mg GAE/100 g dry rice hulls with a prior heat treatment of the hulls at 140 °C for 1 h.

4. Conclusions

To conclude, an optimized microwave-assisted alkaline hydrolysis combined with ethyl acetate extraction is proposed for the efficient recovery of bound phenolic acids from rice hulls. The short duration of microwave treatment (3.6 min), along with high temperature (155 °C) and solvent:solid ratio (50:1, v/w), were found to favor the release of these valuable compounds and consequently their effective recovery. Such a release was considerably more efficient as evidenced by all tests carried out and the determined levels of p-CA and FA, and significantly faster (~33-fold) compared to an optimum ultrasound-assisted extraction protocol proposed for the same purpose in the literature (average values; TPC: 2995 vs. 1311 mg GAE/100 g dry rice hulls, ADDPH: 3478 vs. 1429 μmol Trolox/100 g dry rice hulls, AABTS: 25,662 vs. 15,016 μmol Trolox/100 g dry rice hulls, ACUPRAC: 12,853 vs. 3542 μmol Trolox/100 g dry rice hulls, p-CA: 926 vs. 614 mg/100 g dry rice hulls, FA: 224 vs. 64 mg/100 g dry rice hulls). Consequently, the hulls from various Greek varieties were found to contain significant amounts of phenolic acids, namely p-CA (564–1269 mg/100 g dry rice hulls) and FA (160–289 mg/100 g dry rice hulls) compared to others of similar or different origin. Thus, the proposed methodology can be a useful tool to pave the way for rice hull valorization as a sustainable source of valuable phenolic acids that could be used as a source of natural antioxidants for novel food applications (high added-value applications). In this way, additional profit for local economies may be obtained.

Author Contributions

Conceptualization, N.N. and I.M.; methodology, investigation, validation: A.K., K.M. and N.N.; data curation, A.K. and N.N.; formal analysis, visualization: A.K. and K.M.; writing—original draft, A.K.; writing—review and editing: all authors; supervision: N.N.; funding acquisition, resources, project administration: I.M. and N.N. All authors have read and agreed to the published version of the manuscript.

Funding

This research was funded by the Hellenic Foundation for Research and Innovation (HFRI) in the frame of the “2nd Call for H.F.R.I.’s Research Projects to Support Faculty Members and Researchers” under grant agreement No. 3308.

Institutional Review Board Statement

Not applicable.

Informed Consent Statement

Not applicable.

Data Availability Statement

The data presented in this study are available on request from the corresponding authors (I.M. and N.N.).

Conflicts of Interest

The authors declare no conflict of interest.

References

  1. Chaudhari, P.R.; Tamrakar, N.; Singh, L.; Tandon, A.; Sharma, D. Rice nutritional and medicinal properties: A review article. J. Pharmacogn. Phytochem. 2018, 7, 150–156. [Google Scholar]
  2. Tan, B.L.; Norhaizan, M.E. Rice By-Products: Phytochemicals and Food Products Application; Springer Nature: Berlin, Germany, 2020. [Google Scholar]
  3. Nenadis, N.; Kyriakoudi, A.; Tsimidou, M.Z. Impact of alkaline or acid digestion to antioxidant activity, phenolic content and composition of rice hull extracts. LWT-Food Sci. Technol. 2013, 54, 207–215. [Google Scholar] [CrossRef]
  4. Butsat, S.; Siriamornpun, S. Antioxidant capacities and phenolic compounds of the husk, bran and endosperm of Thai rice. Food Chem. 2010, 119, 606–613. [Google Scholar] [CrossRef]
  5. Shahidi, F.; Yeo, J.D. Insoluble-bound phenolics in food. Molecules 2016, 21, 1216. [Google Scholar] [CrossRef]
  6. Barberousse, H.; Roiseux, O.; Robert, C.; Paquot, M.; Deroanne, C.; Blecker, C. Analytical methodologies for quantification of ferulic acid and its oligomers. J. Sci. Food Agric. 2008, 88, 1494–1511. [Google Scholar] [CrossRef]
  7. Juhnevica-Radenkova, K.; Kviesis, J.; Moreno, D.A.; Seglina, D.; Vallejo, F.; Valdovska, A.; Radenkovs, V. Highly-efficient release of ferulic acid from agro-industrial by-products via enzymatic hydrolysis with cellulose-degrading enzymes: Part I-The superiority of hydrolytic enzymes versus conventional hydrolysis. Foods 2021, 10, 782. [Google Scholar] [CrossRef]
  8. Butsat, S.; Weerapreeyakul, N.; Siriamornpun, S. Changes in phenolic acids and antioxidant activity in Thai rice husk at five growth stages during grain development. J. Agric. Food Chem. 2009, 57, 4566–4571. [Google Scholar] [CrossRef]
  9. Butsat, S.; Siriamornpun, S. Phenolic acids and antioxidant activities in husk of different Thai rice varieties. Food Sci. Technol. Int. 2010, 16, 329–336. [Google Scholar] [CrossRef]
  10. Vadivel, V.; Brindha, P. Antioxidant property of solvent extract and acid/alkali hydrolysates from rice hulls. Food Biosci. 2015, 11, 85–91. [Google Scholar] [CrossRef]
  11. Jha, A.K.; Sit, N. Extraction of bioactive compounds from plant materials using combination of various novel methods: A Review. Trends Food Sci. Technol. 2022, 119, 579–591. [Google Scholar] [CrossRef]
  12. Irakli, M.; Kleisiaris, F.; Kadoglidou, K.; Katsantonis, D. Optimizing extraction conditions of free and bound phenolic compounds from rice by-products and their antioxidant effects. Foods 2018, 7, 93. [Google Scholar] [CrossRef]
  13. Kim, M.Y.; Yoon, N.; Lee, Y.J.; Woo, K.S.; Kim, H.Y.; Lee, J.; Jeong, H.S. Influence of thermal processing on free and bound forms of phenolics and antioxidant capacity of rice hull (Oryza sativa L.). Prev. Nutr. Food Sci. 2020, 25, 310–318. [Google Scholar] [CrossRef]
  14. Wanyo, P.; Meeso, N.; Siriamornpun, S. Effects of different treatments on the antioxidant properties and phenolic compounds of rice bran and rice husk. Food Chem. 2014, 157, 457–463. [Google Scholar] [CrossRef]
  15. Chiremba, C.; Rooney, L.W.; Beta, T. Microwave-assisted extraction of bound phenolic acids in bran and flour fractions from sorghum and maize cultivars varying in hardness. J. Agric. Food Chem. 2012, 9, 4735–4742. [Google Scholar] [CrossRef]
  16. Moreira, M.M.; Morais, S.; Barros, A.A.; Delerue-Matos, C.; Guido, L.F. A novel application of microwave-assisted extraction of polyphenols from brewer’s spent grain with HPLC-DAD-MS analysis. Anal. Bioanal. Chem. 2012, 403, 1019–1029. [Google Scholar] [CrossRef]
  17. Durović, S.; Nikolić, B.; Luković, N.; Jovanović, J.; Stefanović, A.; Šekuljica, N.; Mijin, D.; Knežević-Jugović, Z. The impact of high-power ultrasound and microwave on the phenolic acid profile and antioxidant activity of the extract from yellow soybean seeds. Ind. Crops Prod. 2018, 122, 223–231. [Google Scholar] [CrossRef]
  18. Jha, P.; Das, A.J.; Deka, S.C. Optimization of ultrasound and microwave assisted extractions of polyphenols from black rice (Oryza sativa cv. Poireton) husk. J. Food Sci. Technol. 2017, 54, 3847–3858. [Google Scholar] [CrossRef]
  19. Frosi, I.; Vallelonga, D.; Colombo, R.; Milanese, C.; Papetti, A. Valorization of rice husk (Oryza sativa L.) as a source of in vitro antiglycative and antioxidant agents. Foods 2023, 12, 529. [Google Scholar] [CrossRef]
  20. Chan, C.-H.; Yusoff, R.; Ngoh, G.-C.; Kung, F.W.-L. Microwave-assisted extractions of active ingredients from plants. J. Chromatogr. A 2011, 1218, 6213–6225. [Google Scholar] [CrossRef]
  21. Re, R.; Pellegrini, N.; Proteggente, A.; Pannala, A.; Yang, M.; Rice-Evans, C. Antioxidant activity applying an improved ABTS radical cation decolorization assay. Free Radic. Biol. Med. 1999, 26, 1231–1237. [Google Scholar] [CrossRef]
  22. Apak, R.; Güçlü, K.; Özyürek, M.; Karademir, S.E. Novel total antioxidant capacity index for dietary polyphenols and vitamins C and E, using their cupric ion reducing capability in the presence of neocuproine: CUPRAC method. J. Agric. Food Chem. 2004, 52, 7970–7981. [Google Scholar] [CrossRef] [PubMed]
  23. Hegde, S.; Kavitha, S.; Varadaraj, M.; Muralikrishna, G. Degradation of cereal bran polysaccharide-phenolic acid complexes by Aspergillus niger CFR 1105. Food Chem. 2006, 96, 14–19. [Google Scholar] [CrossRef]
  24. Wijngaard, H.; Hossain, M.B.; Rai, D.K.; Brunton, N. Techniques to extract bioactive compounds from food by-products of plant origin. Food Res. Int. 2012, 46, 505–513. [Google Scholar] [CrossRef]
  25. Pyrka, I.; Mantzouridou, F.T.; Nenadis, N. Optimization of olive leaves’ thin layer, intermittent near-infrared-drying. Innov. Food Sci. Emerg. Technol. 2023, 84, 103264. [Google Scholar] [CrossRef]
  26. Olszowy-Tomczyk, M. Synergistic, antagonistic and additive antioxidant effects in the binary mixtures. Phytochem. Rev. 2020, 19, 63–103. [Google Scholar] [CrossRef]
  27. Nenadis, N.; Wang, L.-F.; Tsimidou, M.; Zhang, H.-Y. Estimation of scavenging activity of phenolic compounds using the ABTS•+ assay. J. Agric. Food Chem. 2004, 52, 4669–4674. [Google Scholar] [CrossRef]
  28. Nenadis, N.; Tsimidou, M.Z. Assessing the activity of natural food antioxidants. In Oxidation in Foods and Beverages and Antioxidant Applications. Volume 1: Understanding Mechanisms of Oxidation and Antioxidant Activity, 1st ed.; Decker, E.A., Elias, R.J., McClements, D.J., Eds.; Woodhead Publishing: Sawston, UK, 2010; pp. 332–365. [Google Scholar] [CrossRef]
  29. Liazid, A.; Palma, M.; Brigui, J.; Barroso, C.G. Investigation on phenolic compounds stability during microwave-assisted extraction. J. Chromatogr. A 2007, 1140, 29–34. [Google Scholar] [CrossRef]
  30. Castrica, M.; Rebucci, R.; Giromini, C.; Tretola, M.; Cattaneo, D.; Baldi, A. Total phenolic content and antioxidant capacity of agri-food waste and by-products. Ital. J. Anim. Sci. 2019, 18, 336–341. [Google Scholar] [CrossRef]
  31. Makris, D.P.; Boskou, G.; Andrikopoulos, N.K. Polyphenolic content and in vitro antioxidant characteristics of wine industry and other agri-food solid waste extracts. J. Food Compos. Anal. 2007, 20, 125–132. [Google Scholar] [CrossRef]
  32. Martínez-Valverde, I.; Periago, M.J.; Provan, G.; Chesson, A. Phenolic compounds, lycopene and antioxidant activity in commercial varieties of tomato (Lycopersicum esculentum). J. Sci. Food Agric. 2002, 82, 323–330. [Google Scholar] [CrossRef]
Figure 1. Surface plots for total phenol content (AC), ABTS●+ scavenging activity (DF), cupric ion reducing antioxidant capacity (GI), as well as p-coumaric acid content (JL) values affected by duration of microwave-assisted alkaline hydrolysis, temperature, and solvent:solid ratio. In all cases, the third factor was kept constant at its middle level.
Sustainability 15 08425 g001
Table 1. Levels of independent variables in coded and uncoded values used in the experimental design.
SymbolsVariable Level
Coded value 1
−a−10+1+a
Uncoded value 1
Χ1Duration of sonication (min)0.43.58.012.515.6
Χ2Temperature (°C)59.485.0122.5160.0185.6
Χ3Solvent:solid ratio (v/w)60:150:135:120:110:1
1  C o d e d V a l u e = A c t u a l V a l u e ( H i g h L e v e l + L o w L e v e l ) 2 H i g h L e v e l L o w L e v e l 2 .
Table 2. Experimental design for three-factor-five-level CCD and experimental values for the responses of response surface methodology.
RunIndependent VariablesDependent Variables
Duration of Sonication (min) (Χ1)Temperature (°C) (Χ2)Solvent:Solid Ratio (v/w) (Χ3)TPC
(mg GAE/100 g Dry Rice Hulls)
ADPPH
(μmol Trolox/100 g Dry Rice Hulls)
AABTS
(μmol Trolox/100 g Dry Rice Hulls)
ACUPRAC
(μmol Trolox/100 g Dry Rice Hulls)
p-CA
(mg/100 g Dry Rice Hulls)
FA
(mg/100 g Dry Rice Hulls)
112.5160.050.03614 ± 4154261 ± 3835,832 ± 221332,509 ± 3725787 ± 40189 ± 9
23.585.050.01402 ± 1322052 ± 21818,633 ± 2129877 ± 1064614 ± 5878 ± 8
38.0122.535.01447156325,8479435.35647178
48.0122.535.01836157823,0228882.50522140
58.0122.560.02655 ± 2484153 ± 20826,490 ± 220425,428 ± 22271110 ± 39189 ± 23
615.6122.535.01242 ± 552032 ± 21515,893 ± 91621,340 ± 1529662 ± 3896 ± 22
78.0122.510.01560 ± 111524 ± 586928 ± 70410,679 ± 1239850 ± 48101 ± 18
83.585.020.01148 ± 772246 ± 1396709 ± 3529811 ± 380819 ± 2983 ± 7
912.585.050.01334 ± 1012302 ± 16721,257 ± 128415,053 ± 804713 ± 4781 ± 8
108.0122.535.01353169122,45811,83154384
118.0122.535.01339156618,9818514497119
128.0185.635.02857 ± 1952624 ± 14625,348 ± 264439,228 ± 4186827 ± 5197 ± 2
138.0122.535.01507168918,52812,200554101
143.5160.050.03262 ± 3654082 ± 10832,923 ± 240626,720 ± 10961220 ± 43297 ± 14
158.0122.535.01777175622,6329988553156
1612.5160.020.02816 ± 1913538 ± 1812,744 ± 85620,828 ± 1512800 ± 52267 ± 13
170.4122.535.01468 ± 1431754 ± 7514,724 ± 58917,452 ± 1111820 ± 58125 ± 11
183.5160.020.02919 ± 1543477 ± 2913,030 ± 85322,828 ± 7471104 ± 91269 ± 9
1912.585.020.01156 ± 522409 ± 1317722 ± 3649249 ± 920864 ± 4783 ± 14
208.059.435.0826 ± 491156 ± 10010,979 ± 56013,305 ± 1106647 ± 3471 ± 5
All responses are expressed as mean ± s.d. values (n = 5), except for the center points no 3, 4, 10, 11, 13, 15 which were measured once.
Table 3. Analysis of variance of TPC, ADPPH, AABTS, ACUPRAC, p-CA, and FA values.
TPCADPPHAABTSACUPRACp-CAFA
R2 (%)89.6978.5893.5995.7690.8454.45
R2adj (%) 80.4159.2987.8291.9582.6013.46
p-values
Regression0.0010.0590.0000.0000.0000.331
Lack of fit0.0570.0000.4420.0680.0590.038
Χ10.8890.6400.4510.1380.0220.531
Χ20.0000.0030.0000.0000.0030.012
Χ30.0290.0410.0000.0010.5740.714
Χ120.8140.1480.0310.0030.0090.777
Χ220.0680.1500.2760.0000.0100.803
Χ320.0130.0050.0960.0110.0000.342
Χ1Χ20.7700.9240.9020.9100.0050.559
Χ1Χ30.7190.9100.5630.0850.7660.588
Χ2Χ30.5050.3800.0540.2010.0880.820
Table 4. Model equations for TPC, AABTS, ACUPRAC, and p-CA responses.
ModelResponsePolynomial Equation
Coded Value of FactorsActual Value of Factors
ATPCTPC = 1529.47 + 804.50X2 + 250.17X3 + 289.12X32
(2)
TPPC = 3167.91 − 98.18X3 + 1.28X32 (3)
BAABTSAABTS = 21,840.5 + 4713.7X2 + 7420.4X3 − 1871.5X12
(4)
AABTS = −16,101.2 − 92.4X12 (5)
CACUPRACACUPRAC = 10,256.5 + 7504.7X2 + 3386.4X3 + 2522.2X12 + 4951.3X22 + 2047.5X32 (6)ACUPRAC = 63,507.6 − 2551.6X1 − 733.1X2 − 875.7X3 + 124.6X12 + 3.5X22 + 9.1X32 (7)
Dp-CAp-CA = 551.689 − 62.836X1 + 88.207X2 + 72.779X12 + 71.440X22 + 157.331X32 − 110.100X1X2
(8)
p-CA = 1951.03 − 59.41X3 + 3.59X12 + 0.05X22 + 0.70X32 − 0.65X1X2 (9)
Table 5. Optimum values of the duration of microwave-assisted alkaline hydrolysis, temperature, and solvent:solid ratio as well as predicted and experimental response values.
FactorOptimum Actual ValuesPredicted ValuesMean Experimental Values
Duration (min)3.6TPC (mg GAE/100 g dry rice hulls)
29412659 ± 218
Temperature (°C)155AABTS (μmol Trolox/100 g dry rice hulls)
30,37033,543 ± 2268
ACUPRAC (μmol Trolox/100 g dry rice hulls)
Solvent:solid ratio (v/w)50:126,67021,500 ± 1963
p-CA (mg/100 g dry rice hulls)
1130956 ± 49
All responses are expressed as mean ± s.d. values (n = 5).
Table 6. Application of the optimized microwave-assisted alkaline hydrolysis conditions to hull samples of different Greek rice varieties and comparison with an ultrasound-assisted alkaline hydrolysis protocol found in the literature.
VarietyProtocol 1TPC
(mg GAE/100 g Dry Rice Hulls) 2
ADPPH
(μmol Trolox/100 g Dry Rice Hulls) 2
AABTS
(μmol Trolox/100 g Dry Rice Hulls) 2
ACUPRAC
(μmol Trolox/100 g Dry Rice Hulls) 2
p-CA
(mg/100 g Dry
Rice Hulls) 2
FA
(mg/100 g Dry
Rice Hulls) 2
Gladio12832 ± 2993504 ± 19528,625 ± 455013,561 ± 402885 ± 86210 ± 12
21286 ± 131430 ± 5215,700 ± 4013626 ± 127397 ± 375 ± 6
Krezo12683 ± 1583761 ± 6727,980 ± 160914,993 ± 8481026 ± 46289 ± 9
21048 ± 251520 ± 10714,729 ± 7983579 ± 348608 ± 5573 ± 11
Scirocco12621 ± 2303642 ± 10625,438 ± 238112,333 ± 1187885 ± 86286 ± 13
21066 ± 321470 ± 2813,977 ± 20743579 ± 348397 ± 348 ± 2
Karolina-112259 ± 1283218 ± 9324,344 ± 143211,105 ± 696701 ± 10163 ± 7
21070 ± 5411535 ± 31313,834 ± 4284868 ± 439535 ± 4553 ± 6
Karolina-212580 ± 603368 ± 12223,562 ± 48512,947 ± 263711 ± 53160 ± 13
21324 ± 891445 ± 16316,325 ± 13713114 ± 219593 ± 4476 ± 17
Europa12764 ± 2023428 ± 10224,750 ± 133510,842 ± 5261017 ± 17238 ± 11
21176 ± 751374 ± 1615,962 ± 4763833 ± 382834 ± 5883 ± 8
Bravo12267 ± 2063252 ± 12821,191 ± 87110,667 ± 924689 ± 68172 ± 8
21202 ± 1171473 ± 18314,704 ± 5502237 ± 219564 ± 6051 ± 10
Bella12794 ± 2243570 ± 11929,110 ± 61115,318 ± 13931152 ± 18256 ± 4
21029 ± 281124 ± 2313,690 ± 5773711 ± 348756 ± 4452 ± 2
Fino12995 ± 1443560 ± 4825,958 ± 113013,912 ± 9961269 ± 53245 ± 6
21311 ± 481494 ± 15616,221 ± 2903333 ± 219844 ± 7165 ± 2
Statistical analysis 2
t18.1626.4110.9014.985.879.17
Conclusiont > t (critical value)t > t (critical value)t > t (critical value)t > t (critical value)t > t (critical value)t > t (critical value)
1 Protocol 1: Experimental conditions as defined in Table 5 and in Section 3.3. Protocol 2: Experimental conditions of Irakli et al. [12] as described in Section 2.7. 2 Two-tailed paired t-test; t critical value: 2.31.
Disclaimer/Publisher’s Note: The statements, opinions and data contained in all publications are solely those of the individual author(s) and contributor(s) and not of MDPI and/or the editor(s). MDPI and/or the editor(s) disclaim responsibility for any injury to people or property resulting from any ideas, methods, instructions or products referred to in the content.

