Article

An ANFIS-Fuzzy Tree-GA Model for a Hospital’s Electricity Purchasing Decision-Making Process Integrated with Virtual Cost Concept

by
Dimitrios K. Panagiotou
and
Anastasios I. Dounis
*
Department of Biomedical Engineering, University of West Attica, Egaleo Park Campus, 12243 Athens, Greece
*
Author to whom correspondence should be addressed.
Sustainability 2023, 15(10), 8419; https://doi.org/10.3390/su15108419
Submission received: 31 March 2023 / Revised: 18 May 2023 / Accepted: 18 May 2023 / Published: 22 May 2023

Abstract

:
In deregulated electricity markets, accurate load and price prediction play an essential role in the Demand Response (DR) context. Although electrical load and price demonstrate a strong correlation which is not linear, price prediction may be a task much more challenging than load prediction due to several factors. The volatility of electricity price compared to load makes price prediction a complex procedure. To perform purchasing decisions commercial consumers may rely on short term price and load prediction. A system which combines Adaptive Neuro-Fuzzy Systems (ANFIS) which predict Load Marginal Prices (LMPs) and electricity consumption is presented in this study. Furthermore, the Virtual Cost (VC) concept, which is the sum of the products between the predicted hourly consumption values and their respective predicted LMPs is introduced. Virtual Cost is assessed with a Fuzzy Decision Tree (FDT) compared to a threshold set by the customer. If needed, the amount of electrical energy that a healthcare facility must purchase at every hour of the day may be scheduled using Genetic Algorithm (GA) to meet the threshold criterion. This hybrid model proved economically beneficial for the facility, which is of great importance since the saved resources may be utilized to improve its infrastructures or for other purposes with social impact. The novelty of the proposed method is the utilization of ANFIS, Fuzzy Decision Trees and Genetic Algorithms combined as tools to improve the hospital’s energy and economic efficiency, achieving a reduction of the electricity costs up to 21.95 percent. The contribution of the study is to provide a reliable decision-making tool to everyone who participates in the electricity market in order to perform profitable energy scheduling automatically and accurately.

1. Introduction

1.1. General Context and Importance of the Present Study

Due to a combination of socioeconomic, environmental and technological changes, the electric power industry has been reformed drastically in the last decades. The integration of Renewable Energy Sources (RES) and Information and Communication Technologies (ICTs) to the power systems which results to the Smart Grid (SG) implementation, along with the urge to reduce CO2 emissions and the deregulation of electricity markets, underline the significance of accurate price and load predictions. Moreover, the diffusion of ICTs and the digitalization of the electricity industry makes it feasible to obtain accurate predictions, using Artificial Intelligence (AI) and Machine Learning (ML) tools substituting the classical statistic and econometric tools. Additionally, the purchase of electrical energy can be performed automatically in real time, which can be beneficial for the market participants in a Demand Response (DR) context [1]. According to [2]: “Demand Response can be defined as the changes in electricity usage by end-use customers from their normal consumption patterns in response to changes in the price of electricity over time”.
The volatility of the electricity price in comparison to consumption makes the task of accurate price prediction more challenging, since there are multiple factors which affect the results. Concerning the prediction horizons, there are three main categories: Long, medium- and short-term price prediction [3], each one used for different tasks. Long-term price prediction usually refers to a time horizon from months to years and is useful to long term planning and decision making in subjects such the construction site or the power plants’ fuel sources; medium-term applies to few days to months ahead. It is useful for balancing sheet calculations, performing risk management and derivatives pricing. On the other hand, short-term price prediction refers to a time horizon from minutes to some days ahead and applies to everyday routines.
Furthermore, due to the fact that in energy markets electrical energy is traded as a commodity, the accuracy of price prediction is critical to help the market participants take the right bidding decisions. In a price-directed electricity market, the participants’ economic efficiency maximization is heavily dependent on the accuracy of the electricity price prediction because their scheduled operations or bidding strategies are optimized relying on the short-term value of Locational Marginal Pricing (LMP). LMP “Reflect the least cost to service the next increment of demand at a location (bus), consistent with all power system operating constraints” [4]. According to this definition, LMP-based wholesale power market prices vary by location and time. Moreover, LMP markets permit the definition of price and allocation of the transmission system with transparency. Since the impact of marginal congestion and losses in many locations across the grid is reflected upon it, LMP also acts as an accurate marker indicating the location where energy is more valued. Furthermore, the use of LMP can improve DR, due to the increment of the offer caps, resulting in more DR entrance into the market [5]. Because the explanation of billing strategies is not within the scope of the present study, and for simplicity reasons, LMP is assumed to reflect the price of the energy purchased at a certain time and location of the grid, without considering any other components of costs or charges (such as capacity, ancillaries, risk premiums etc.).
Since the demand for hospital services is growing, the hospitals are pushed towards adopting sustainable strategies with positive impact at the same time. The sustainability of the buildings relies on the implementation of solutions and technologies for the preservation of the environment, the economization of natural resources and the reduction of operating costs, while at the same time they meet the needs of the occupants [6].
Hospitals can reduce energy consumption, adopting DR strategies. Due to their social impact, they consist of a complicated yet interesting subject. Their mission is to keep patients and staff in a safe environment, while being functional for the employees who work there [7]. They demand significant amounts of energy for their operation as well as for heating and cooling purposes [8], while operating on 24 h-365 days-a-year basis [9]. Additionally, they have a significant environmental fingerprint, as they consume 10.3% of the total consumed energy of the commercial buildings sector while they only account for 4.8% of the total area of them [10]. DR can improve a building’s energy profile and therefore, its environmental impact [11]. Moreover, hospitals’ complex energy systems must demonstrate enhanced effectiveness and resilience, especially under emergency circumstances, such as natural disasters. Kyriakarakos and Dounis [12] point out the need for an Intelligent Energy Management System (IEMS), capable of offering this effectiveness and resilience. Finally, energy savings will result to financial savings which may be invested in the upgrade and complementation of the medical equipment or hospitality conditions [13], which will result to the enhancement of their economic sustainability and the quality of patient care simultaneously [6].

1.2. Literature Review on Demand Response Approaches

Efficient DR scheduling strategies often rely on utility functions, which represent the comfort or satisfaction level of the users as a function of their energy consumption [14]. Utility functions models mathematically the satisfaction of the customer for a certain power consumption level. From economical aspect, the objective is to obtain the maximum comfort/satisfaction for the consumer while at the same time the electricity cost remains at a minimum level [15]. In Refs. [15,16] for a supposed predetermined budget for the daily power expenses, the consumption pattern is scheduled accordingly.
Alternatively, a detailed modeling of the appliances and their constraints in residential DR approaches allow the customers to guide the DR decisions based on their preferences expressed by discomfort or dissatisfaction [17].
Comfort and discomfort concepts aim to link the user’s satisfaction with the relevant power consumption level and to quantify this relationship. Since they represent behavioral or qualitative aspects, the selection of the respective functions can be a challenging task, while the parameters of the function need to be estimated after the selection of the function’s shape [18].
Another approach relies on handling price and load anticipation integrated together, at the same time slot, in order to satisfy the participants’ expectations. Hence, price forecasting shapes the final load demand curve. In Refs. [18,19] price prediction is combined with the consumer’s load consumption prediction to form the final consumption scheduling. In Ref. [18], dynamic optimization of the load pattern is performed exploiting the integrated load and price anticipation. The optimization takes into account three parameters: First is the load that the customer can reject, second is the similarity of the final optimized load curve to the anticipated one and the third is the user-defined budget. The integration of ICT such as smart energy meters in electricity industry permit the monitoring and purchase of electricity 24/7, using sophisticated AI tools as the model proposed in the present study, minimizing human interference.
Typically, a DR optimization scenario is based in a decision-making process concerning the consumption policy under uncertainty about the real-time prices of power for the given scheduling horizon [14]. It is important for the DR efficiency to minimize these uncertainties. Ref. [20] proposed a chance constrained optimization model based on a stochastic optimization algorithm known as Particle Swarm Optimization (PSO), assessing probabilistically the uncertainties to address the load and price forecasting errors in a home energy management system. In such approaches, the uncertainties are combined with utility functions or detailed household appliance models to perform the DR scheduling [18].
The abovementioned methods are briefly summarized in Table 1:
Based on the above mentioned analysis and the comparison presented in Table 1, one can easily conclude the following:
  • Metaheuristic algorithms provide fast and accurate solutions
  • Load and price anticipation methods can be applied to any type of load and can reduce costs
  • Load and price anticipation methods require minimum interventions from the user
  • Utility function and discomfort index methods rely on subjective concepts
  • Detailed appliances model demand thorough knowledge of every appliance’s behavior which in some cases may not be available
  • Hospitals are major commercial consumers, with high energy use
  • Demand Response approaches can be beneficial for hospitals, since they can improve their sustainability both financially and environmentally
  • None of the abovementioned methods have as an application field a healthcare building or hospital
  • A combination of a heuristic optimization algorithm, a load and price anticipation strategy and a simple decision-making system seems promising for this implementation since it combines the simplicity of the load and price anticipation methods with the accuracy and the agility of a heuristic algorithm, reducing energy costs with minimum user’s intervention.

1.3. Statement and Structure of the Study

The present study proposes an AI model which automatically predicts the electricity prices and the electricity consumption of a hospital for the next 24 h and makes the final decision on the amount of electricity to be purchased every hour of the day, in order to reduce electricity costs without jeopardizing the safety and the comfort of the patients and the staff, using a hybrid model consisting of two ANFIS and a Fuzzy Decision Tree integrated with Genetic Algorithm (GA) as an optimization tool.
AI and ML for load prediction are already in use for three decades now; Artificial Neural Networks (ANNs) demonstrate high capability in complex nonlinear systems approximation [21], while Fuzzy Logic models are able to interpret strict mathematical relationships to IF-THEN statements [22] which are easily understood. Recently, a combination of ANNs and Fuzzy Systems, named Adaptive Neuro-Fuzzy Inference Systems (ANFIS), which exploits the advantages both of ANNs and Fuzzy Systems [23,24] was introduced to perform load predictions. Accurate forecasting of load demand can reduce energy waste and improve energy sustainability [25].
Due to the exceptional nature of electricity as a commodity which cannot be stored, has transportation constraints, and its price is strongly seasonal at different levels, price prediction is more complicated than load prediction. Moreover, in comparison to other commodities, electricity price demonstrates high volatility since it can rise by tens or hundreds of times to its normal value [26].
The novelty of the proposed method is the utilization of ANFIS and Fuzzy Decision Trees as tools to improve the hospital’s energy and economic efficiency. In addition, the contribution of the study is to provide a reliable decision-making tool to everyone who participates in the electricity market in order to perform profitable energy scheduling automatically and accurately.
The present article has the following structure:
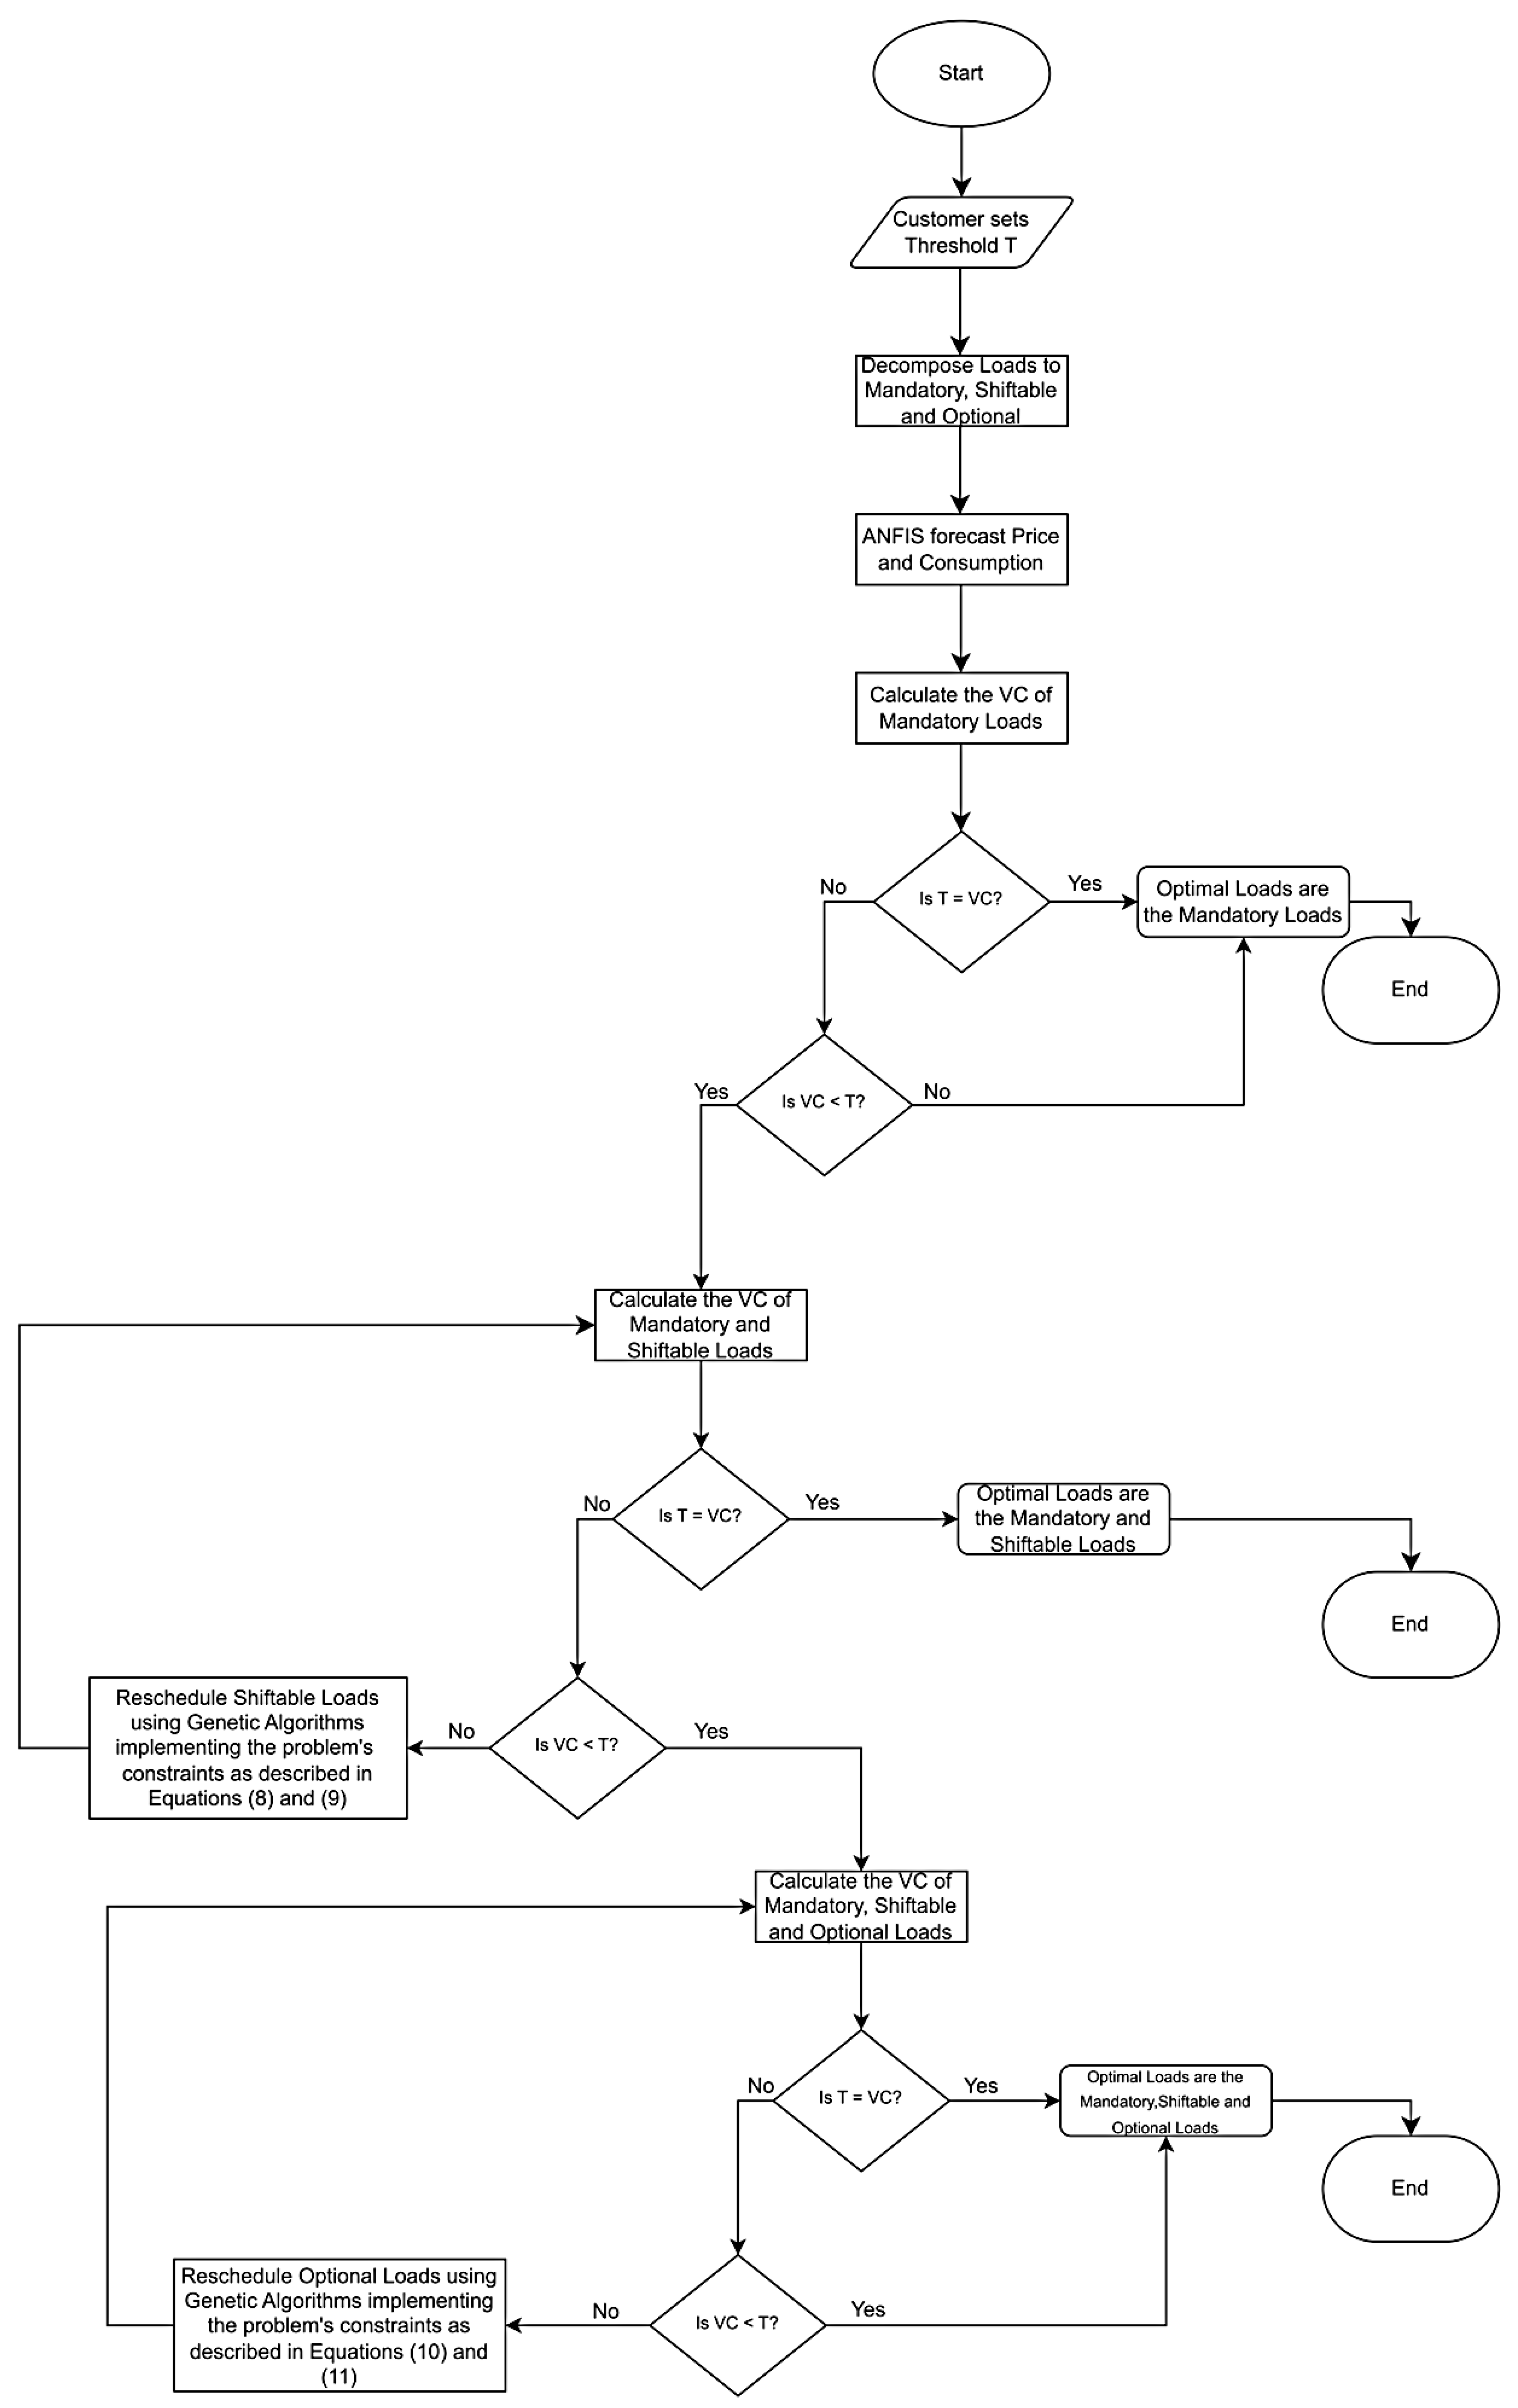
  • In Section 2, the consumption and LMP forecasting models are described in detail. The decision-making inference system is also presented, and the Genetic Algorithm and Virtual Cost concepts are introduced, and the objective functions and the constraints are set, while the electrical loads of the Hospital are divided into Mandatory, Shiftable and Optional. Additionally, the Section 2 contains the presentation of the data sources, the building’s model and specifications, the models’ inputs and the input selection method for the price-predicting model. Finally, a flowchart of the whole process is presented.
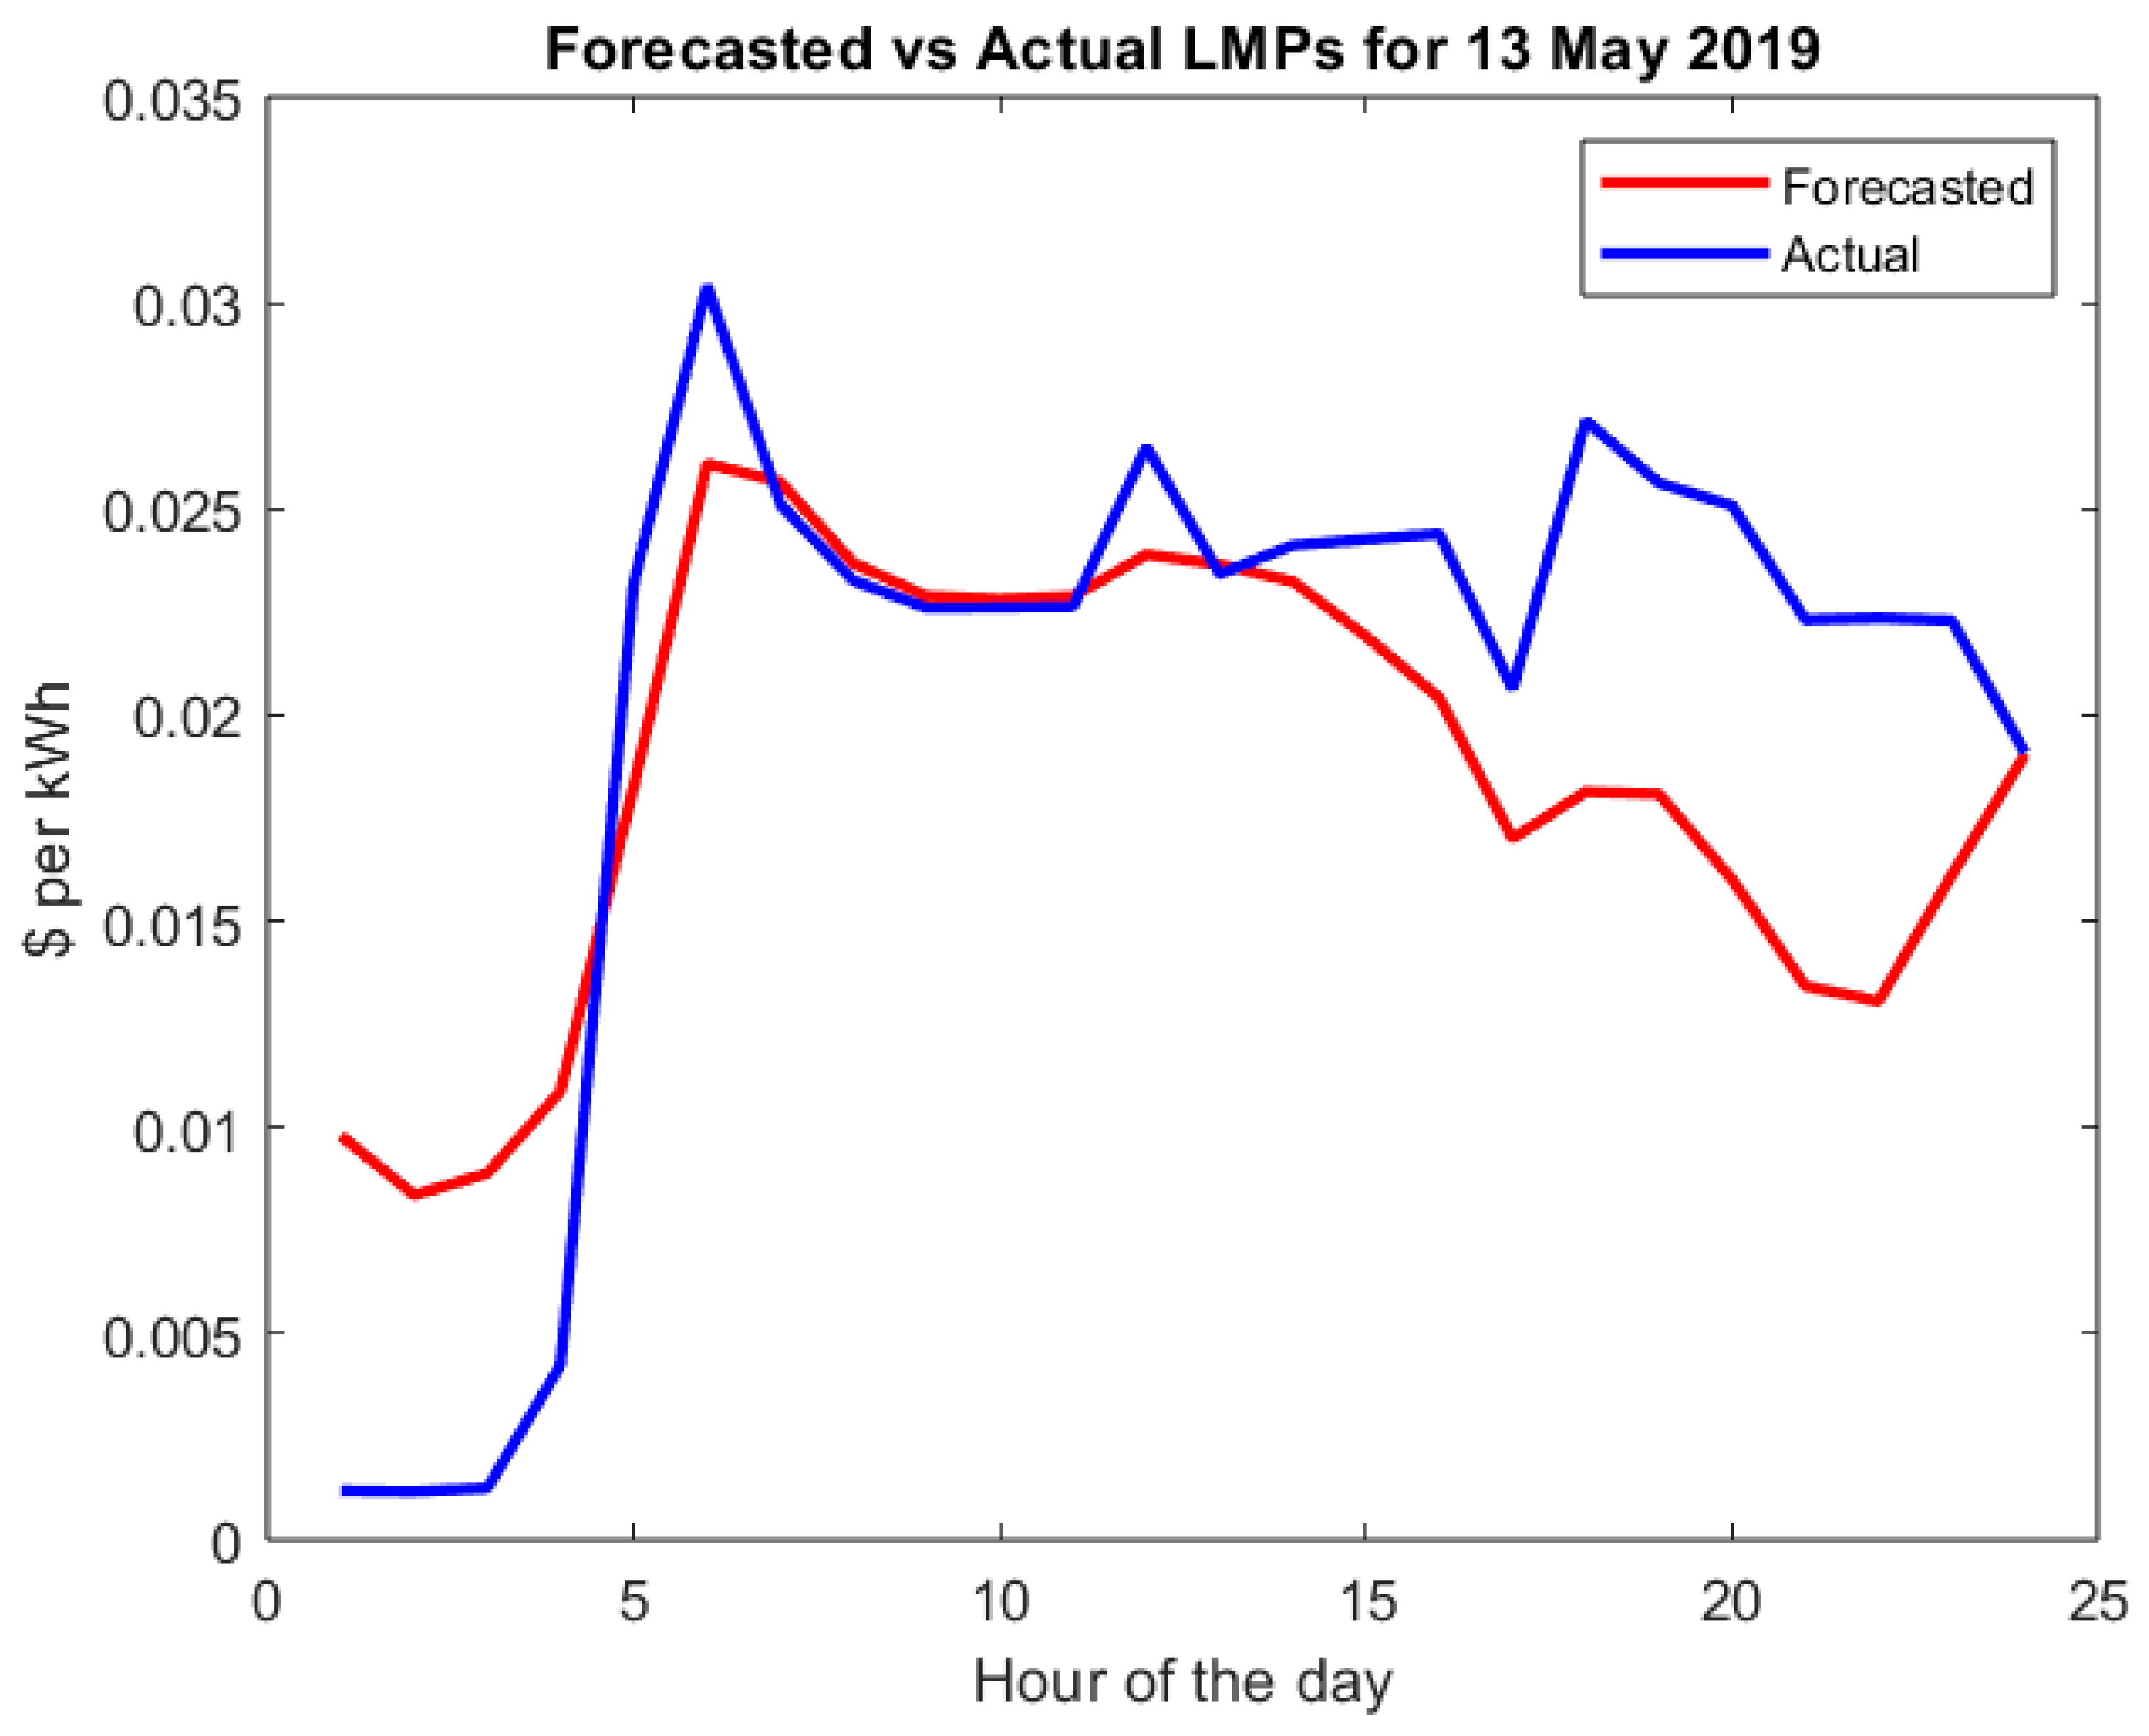
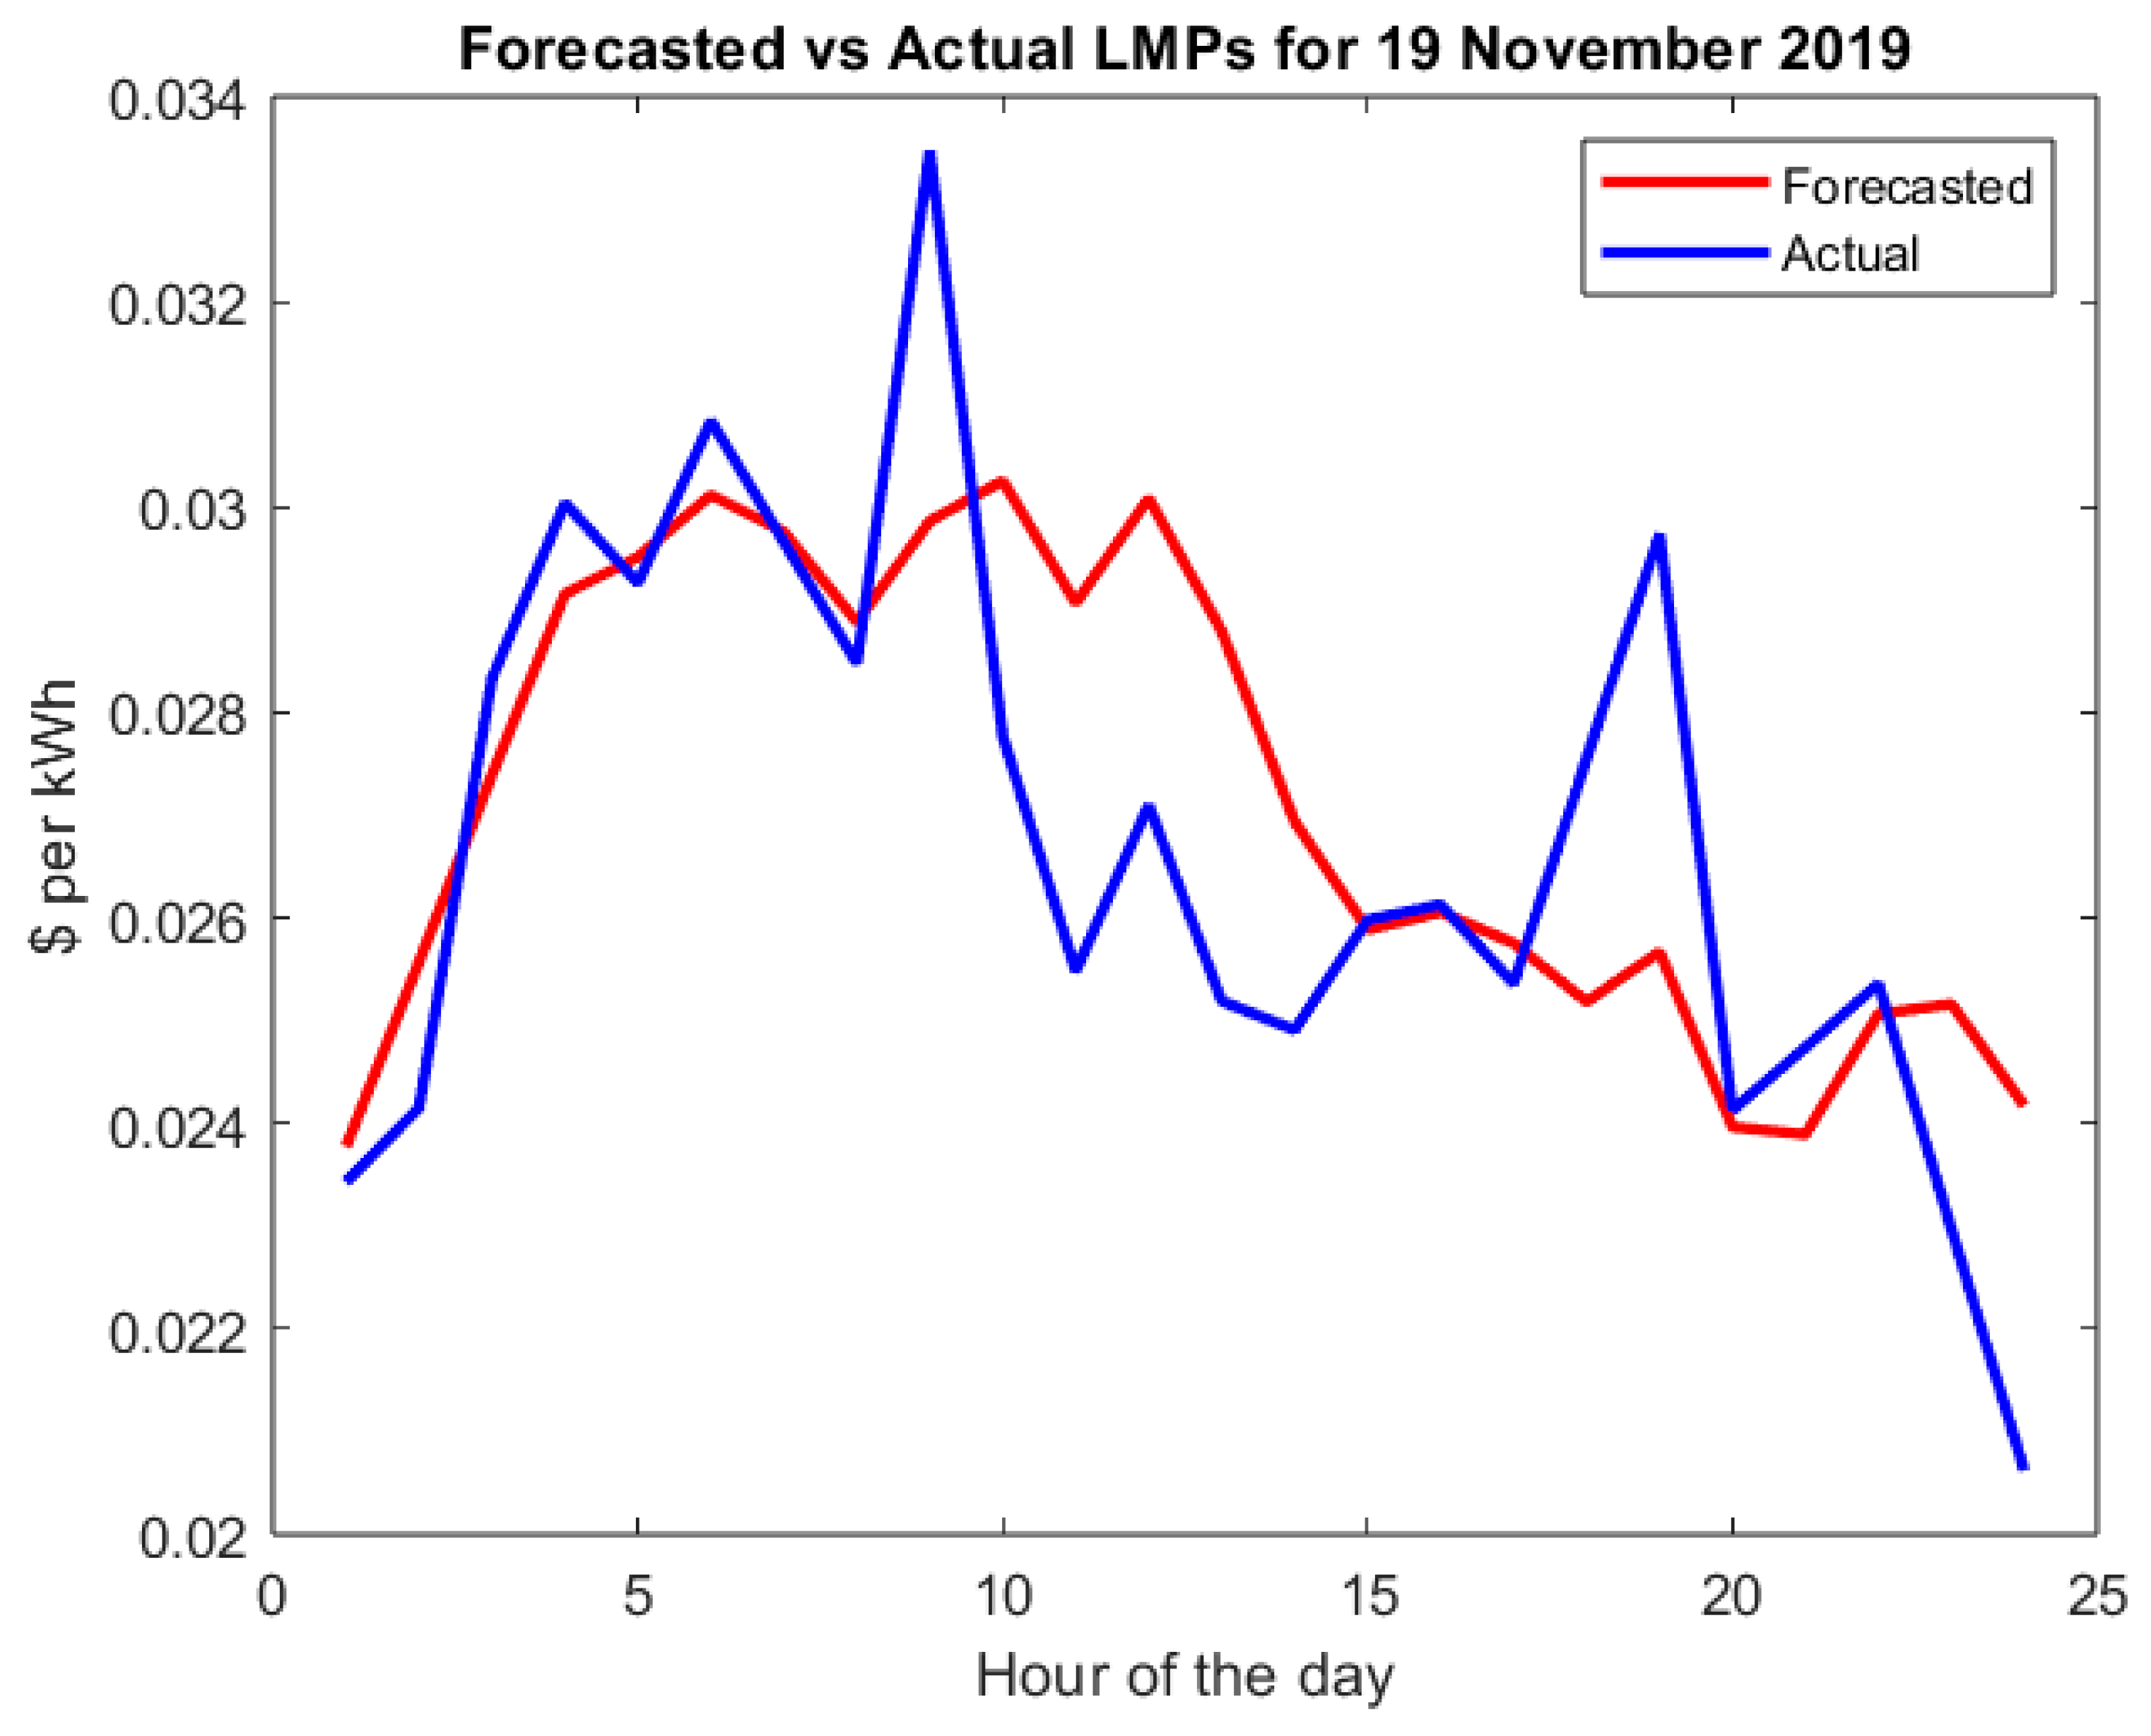
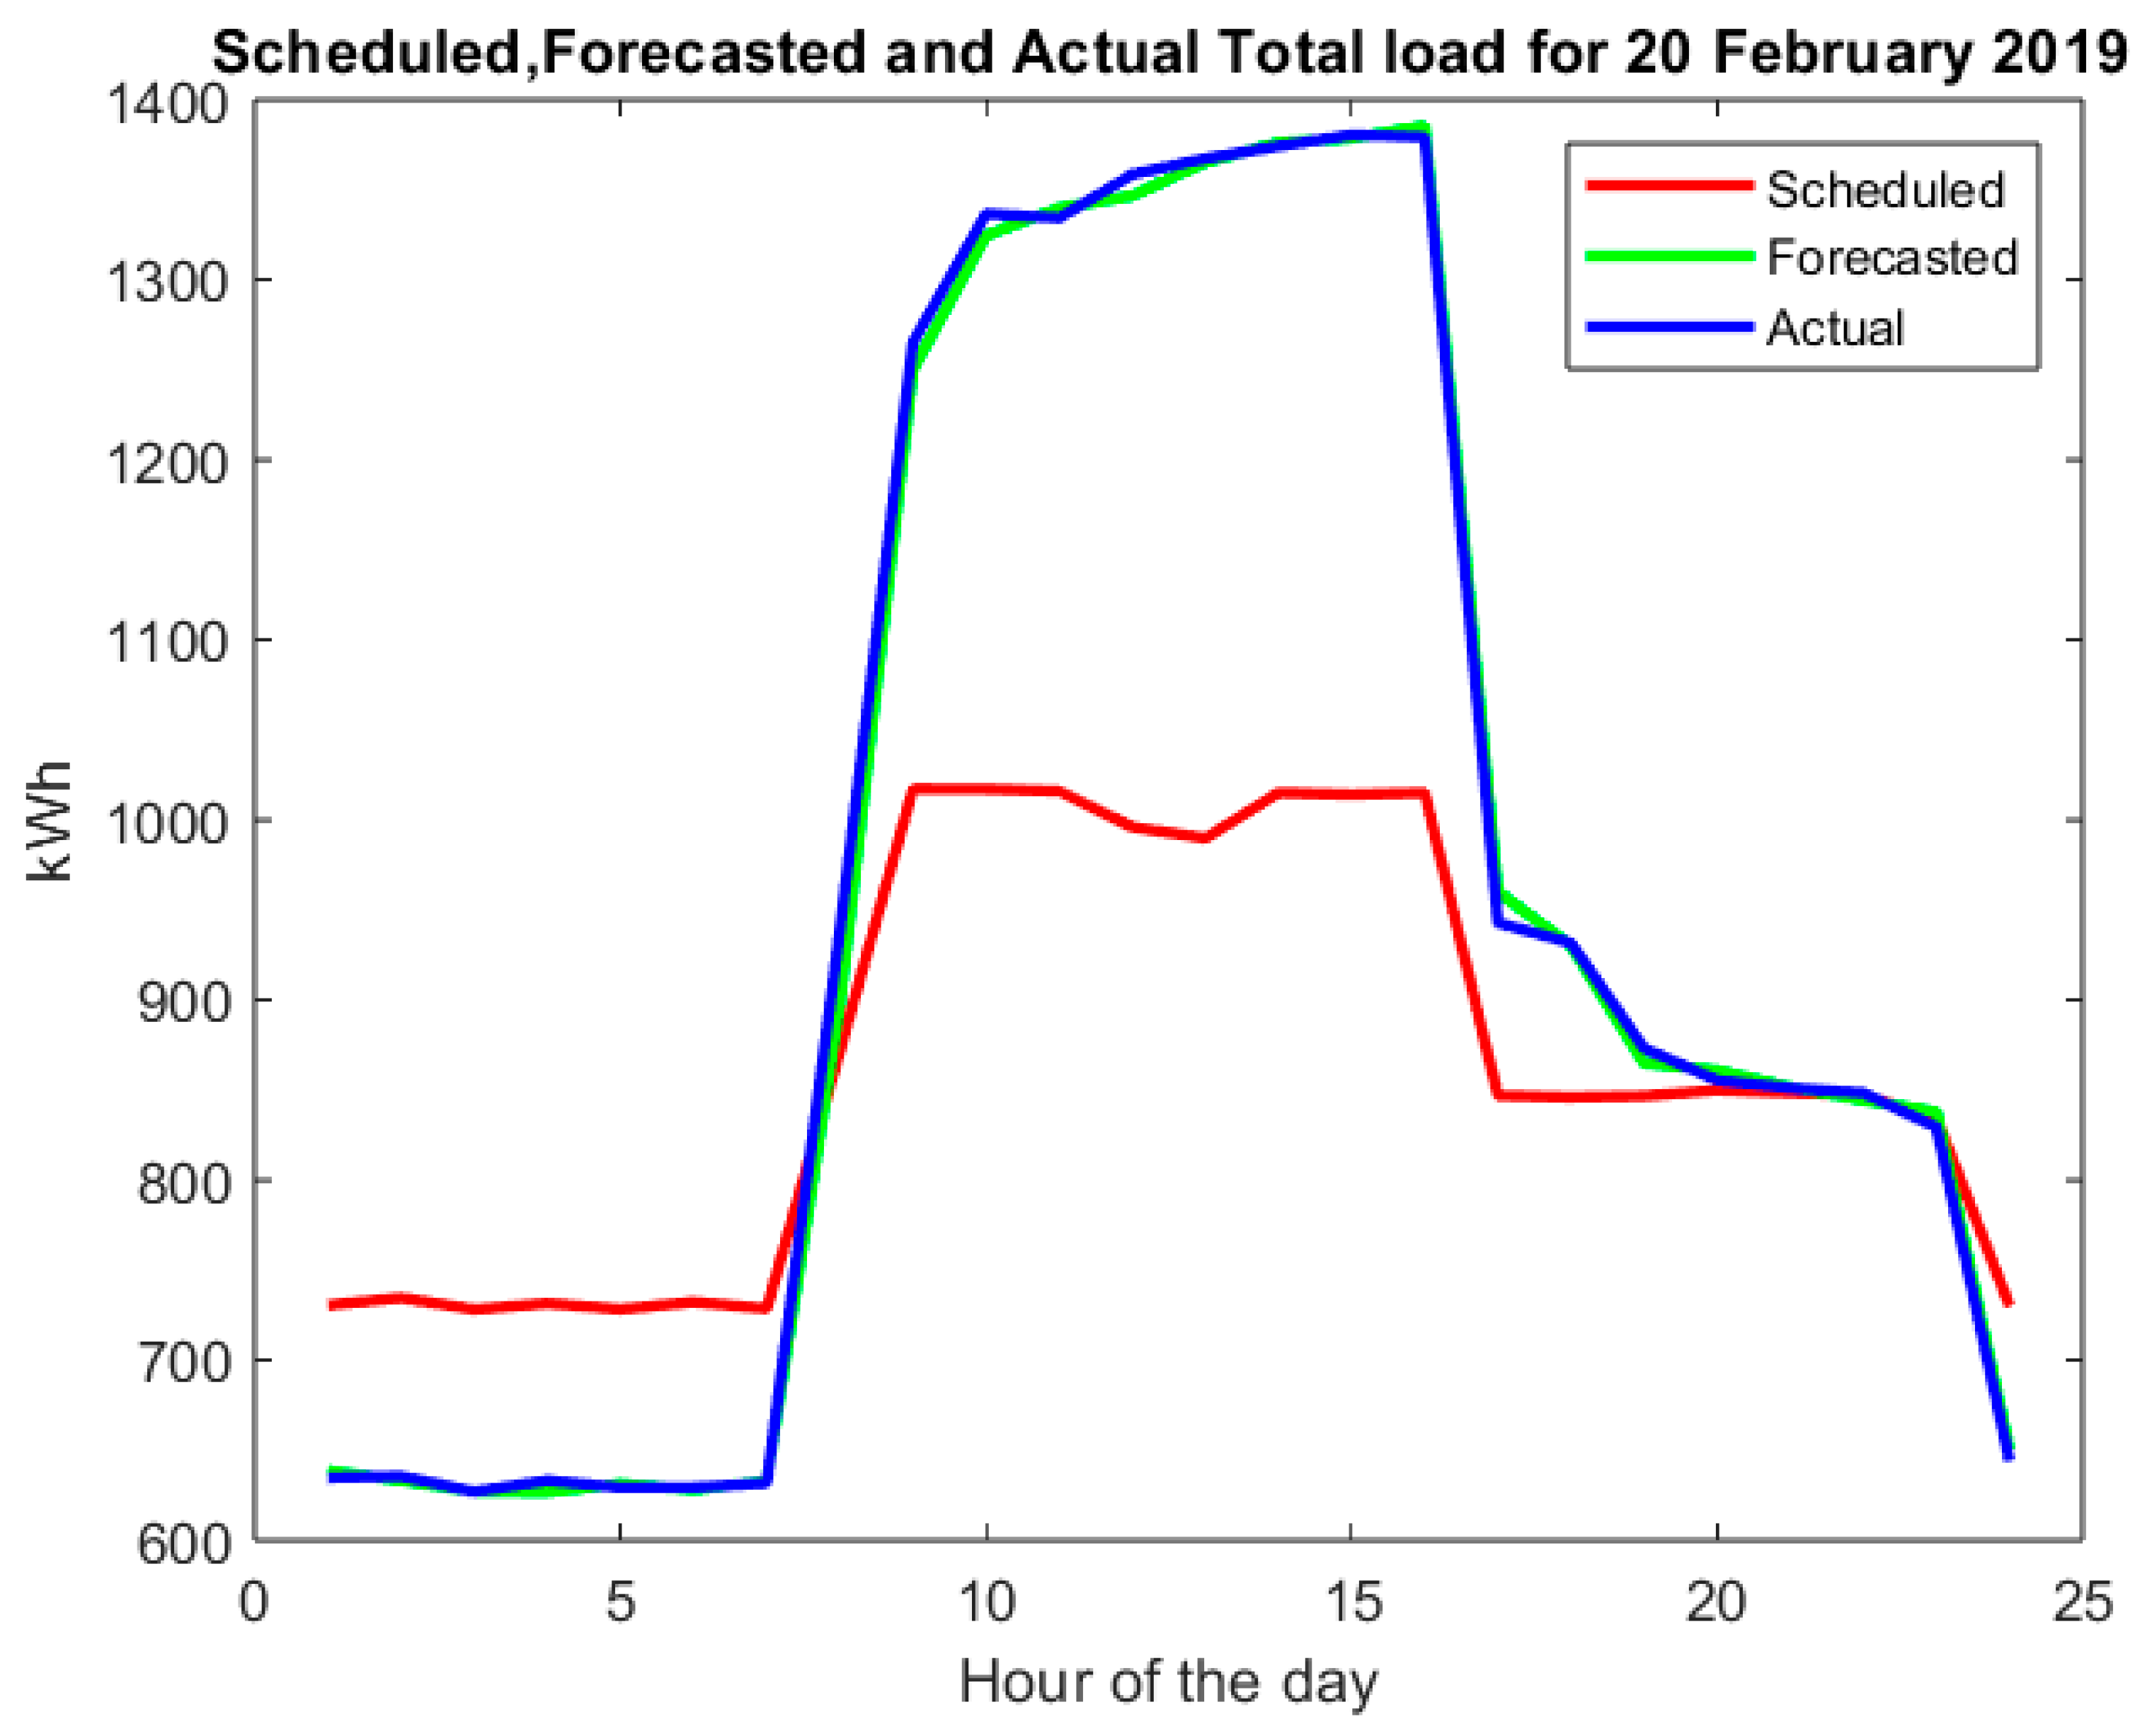
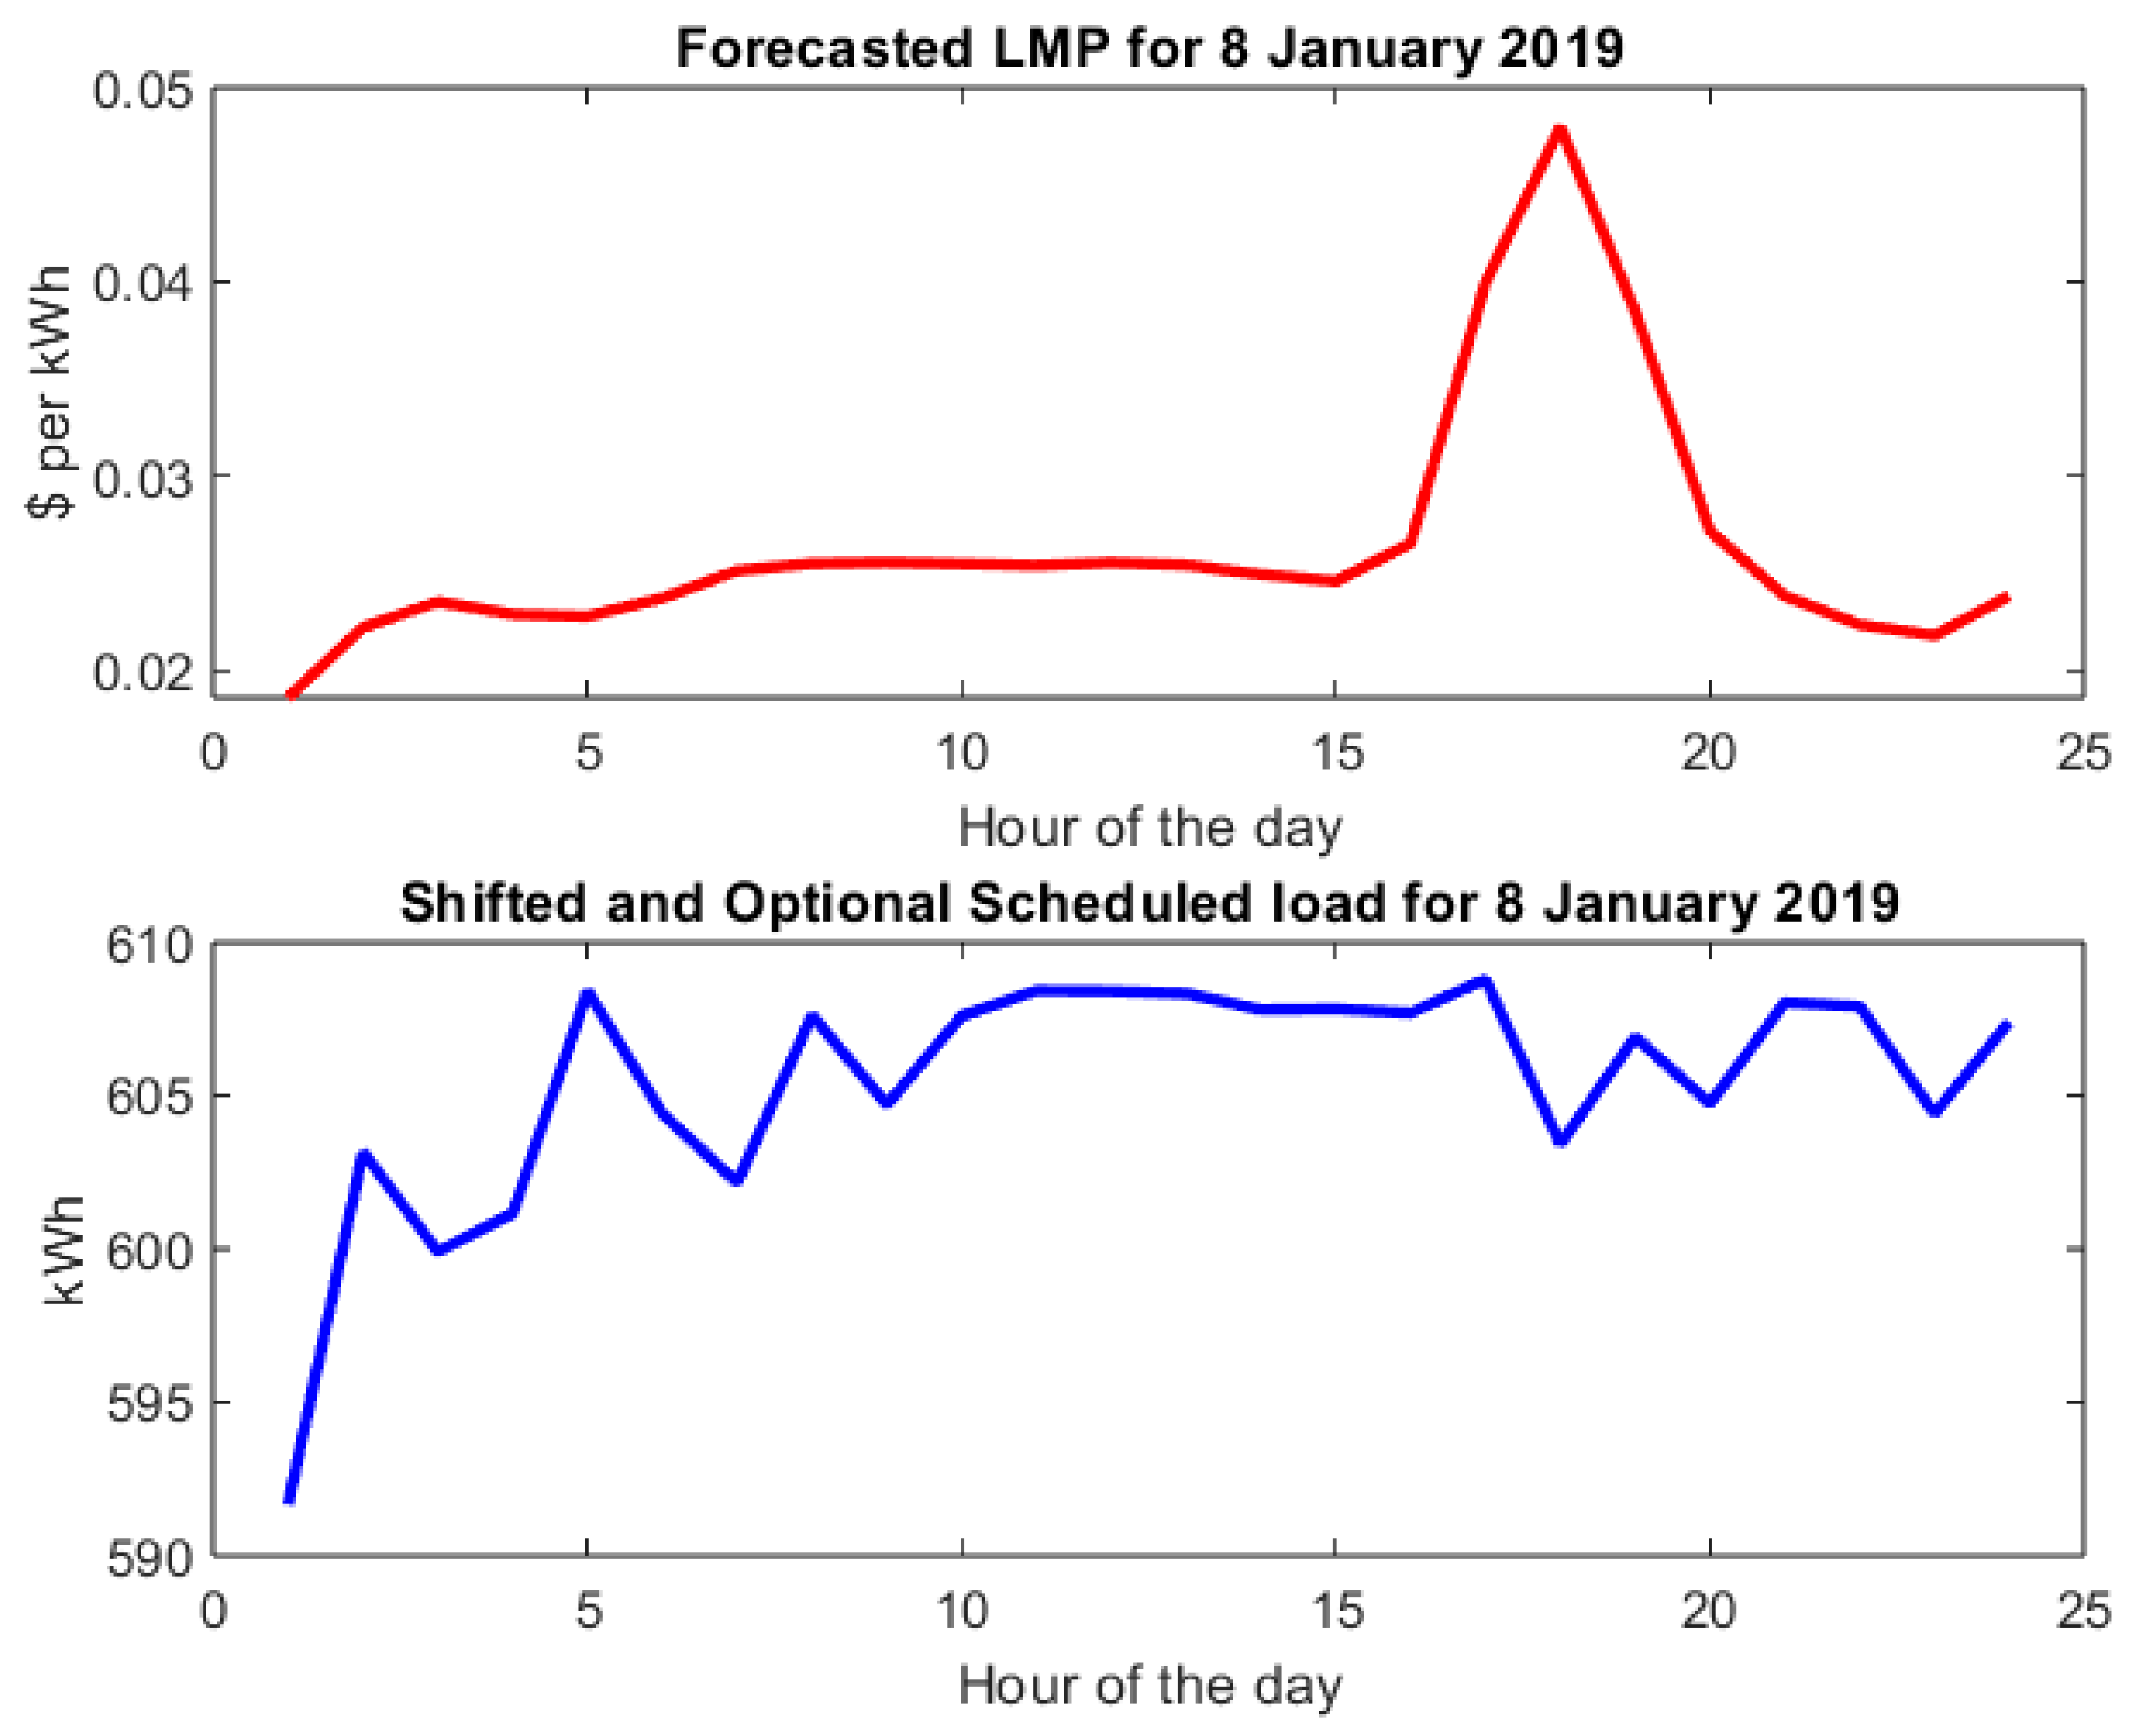
  • In Section 3, the Mean Absolut Percentage Error (MAPE) as metric of the models’ performance is introduced and the models’ accuracy in price and consumption forecasting is evaluated. For visualization purposes, Figures of the forecasted price values against the actual values and Scheduled, Forecasted and Actual (real) total loads for selected days of the year 2019 are presented, followed by a summary and explanation of the presented results and a Figure comparing LMP forecast against the Scheduled loads, in order to explain the system’s behavior. In the Section 3 also, the resulting economic aspect is examined under Section 3.2.
  • In the Section 4, the models’ accuracy is analyzed and suggestions for improvement of the method and further research are made. Accordingly, points that need to be examined in detail are highlighted.
  • The Section 5 gives the summary of the proposed method and the benefits that it may have, while indicating some topics that the future research may focus on.

2. Materials and Methods

2.1. Forecasting Models

Artificial Neural Networks are conceptualized as reasoning models that emulate the mental processes of the human brain. An Artificial Neural Network (ANN) consists of several simple, highly interconnected processors, which are called neurons, just like the human brain neurons. They are connected by links, and every single link is associated with a weight, which indicates the strength of each neuron input. A neural network has the ability to learn through a learning process in which the weights are repeatedly adjusted until a criterion is reached; on most instances, the goal is to achieve an MSE (Mean Square Error) lower than a fixed value within a certain number of iterations known as epochs.
A typical ANN’s structure is depicted in Figure 1.
Adaptive Neuro-Fuzzy Inference System (ANFIS) has a structure similar to ANNs. It is a neural network equal to a Sugeno fuzzy inference system. Sugeno’s fuzzy system can generate fuzzy rules out of the given input-output dataset. These fuzzy rules have a structure like the following:
IF Input1 is A1
AND Input2 is A2
AND Inputi is Am
THEN Output = f (Input1, Input2, …, Inputi)
Where Input1, Input2, , Inputi are the input variables; A1, A2, , Am are the fuzzy sets; and Output is a constant or a linear function of the inputs. When Output is a constant, the fuzzy system is a zero-order Sugeno fuzzy model, and the rule results to a singleton. If Output have the form of a first-order polynomial:
O u t p u t = k 0 + k 1 I n p u t 1 + k 2 I n p u t 2 + + k i I n p u t i
The model is called a first—order Sugeno fuzzy model. Figure 2 illustrates the general structure of the systems used in the present paper.
The advantage of ANFIS in solving problems is that prior knowledge of the rule parameters is not essential because these parameters are learned by the system itself. ANFIS outperform ANNs on complicated, nonlinear and multivariate problems, giving results which are very accurate because of its capability to generalize. Its architecture is not affecting its performance, contrary to ANNs, where its performance is heavily dependent on it.
For the present study, two different ANFIS models were used as predictors. The first ANFIS model is supplied by the consumption of the Hospital for the past 24 h as inputs in order to predict the day’s hourly consumption and the other ANFIS model uses LMPs as inputs in order to predict the next day’s LMPs per hour. In order to reduce the rule base of the ANFIS and avoid computer’s “out of memory” problems due to the complexity of computation, it is important to perform a feature selection between the candidate inputs as well as select as inputs the LMPs with the higher correlation scores.

2.2. Decision-Making Inference System

In human thinking and perception, cognitive uncertainties inherently exist in human thinking and perception. In most, decision tree induction methods do not deal with vagueness and ambiguity which are associated with the cognitive process. Fuzzy Decision Trees (FDTs) use fuzzy evidence to reduce the classification ambiguity. FDTs approximate human thinking in classification knowledge demonstrating robustness when dealing with information which may be imprecise, conflicting or missing [27]. It is well known that FDTs can perform decision-making processes for power system issues. Crisp decision trees are able to provide only YES or NO types of answers while the fuzzy ones can give accurate information about the degree of the target’s fulfilment. In comparison to crisp binary trees, FDTs demonstrate resilience to wrong decisions that may occur in their first nodes and especially in the root of the tree [28]. FDTs use fuzzy logic instead of standard crisp logic at the internal nodes while the final conclusions end up to the final nodes. The simplest fuzzy binary tree is a single node with two successors like the one in Figure 3.
The instance to classify, x is classified through the discrimination function, v :
v : x 0 ; 1 ,   x = x 1 , x 2 , , x n T
For the decision-making process of the study, a simple FDT has been developed with a rule base with two trapezoidal membership functions like these in Figure 4.

2.3. Genetic Algorithms

Genetic Algorithms are a category of stochastic search algorithms imitating Darwin’s natural evolution theory. The basic concept is that a set of candidate solutions represented as binary strings can result to a solution of a problem by applying the following steps:
  • A random initial population, called the chromosomes is generated.
  • A series of new populations are created. At every generation, the individuals are the parents of the next population, known as the offspring. The algorithm performs the mating of the individuals according to the following steps:
    • The fitness of every individual of the current population is evaluated as a possible solution.
    • The selection of candidate parents is based on their fitness.
    • A percentage of the individuals, those who achieved the best fitness, pass on the next generation as elite.
    • The next generation is produced either by mutation of a single parent or by crossover, which is the mating of a pair of parents.
    • The next generation, which includes the children and the elite, replaces the current population.
  • The algorithm stops when one of the stopping criteria is met.
The main idea behind the GA application is that given the price and consumption forecasts on every hour of the day and the constraints of the problem, it will maximize the revenues:
max R e v e n u e s = T i = 1 24 P f o r e c a s t e d i · L f o r e c a s t e d i  
where P f o r e c a s t e d i is the forecasted LMP in U.S. Dollars for the i -th hour of the day and L f o r e c a s t e d i is the forecasted consumption for the respective hour and T is the daily upper budget set by the customer. Optimizing Equation (3) results to L o p t i m a l i , the optimal consumption for the specific hour which results to a beneficiary daily consumption scheduling. All loads are measured in kWh.

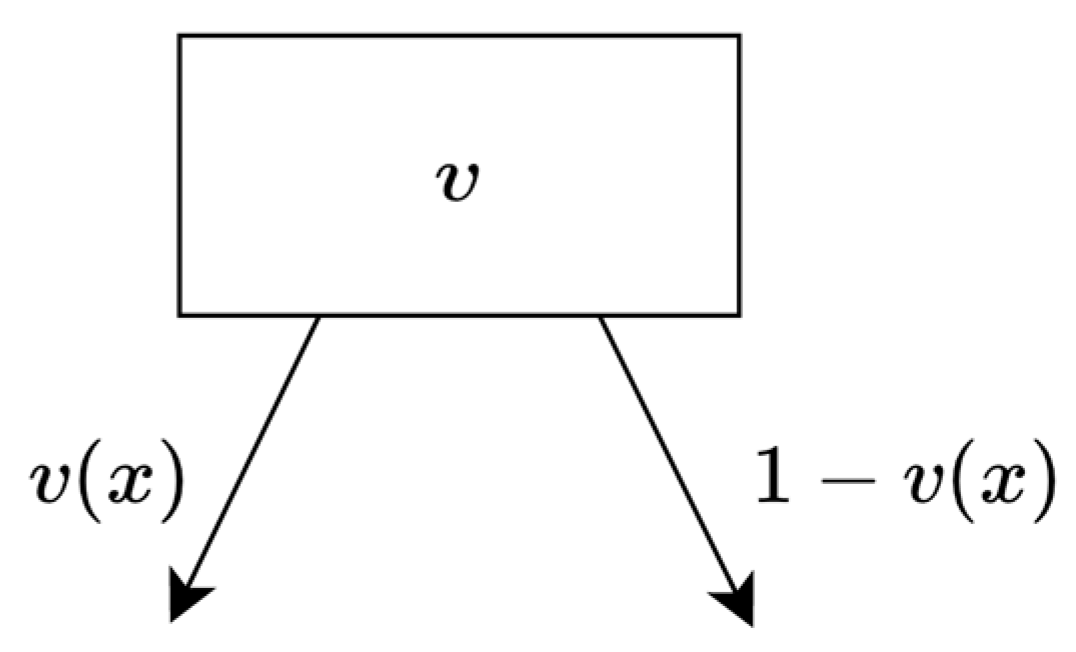
2.4. The Virtual Cost Approach

Alamaniotis et al. [19] introduce the Virtual Cost (VC) concept, which is the daily sum of the product of the hourly price and consumption forecasts:
V C = i = 1 24 P f o r e c a s t e d i · L f o r e c a s t e d i
Furthermore, Ref. [19] suggest Virtual Cost (VC) approach as benchmark for electricity consumption scheduling for smart grids/cities in price-directed electricity markets. According to this approach, the consumer sets a Threshold value T for a day’s expenses. This allows the customer to control his daily budget for electricity purchase. Therefore, Profit or Loss in rule base in Figure 4 can be obtained following the rules:
I f   V C T   T h e n   l o a d   s c h e d u l e   i s   a p p r o v e d  
I f   V C > T   T h e n   r e s c h e d u l e   l o a d
The Load pattern of the hospital can be decomposed in Mandatory (M), Shiftable (S) and Optional (O) loads:
L i = M i + S i + O i
L i is the total load of the i-th hour of the day.
-
Mandatory loads are those who cannot be rescheduled and need to be available at the initial time of scheduling. It evolves tasks of the hospital that cannot take place any other time. For example, operating and emergency rooms, life support, blood storage, and generally loads that need continuous and uninterrupted electricity supply. M i is the mandatory load of the i-th hour of the day.
-
Shiftable loads are those that can be utilized under predefined time intervals and definite hours of operation, but for the purpose of cost reduction and contribution to DR programs, the exact time of their operation is taken by the building’s control center. The time of their operation can be shifted to the next or the previous hour or several hours ahead or behind the scheduled time, depending on their nature. S i is the Shiftable load of the i-th hour of the day. It is easy to understand that concerning the Shiftable loads, the total sum of energy that is forecasted to be consumed on a daily basis, should be finally optimized and purchased. This is a constraint to the problem:
i = 1 24 S f o r e c a s t e d i = i = 1 24 S o p t i m a l i  
where:
0 S o p t i m a l i  
And S f o r e c a s t e d i and S o p t i m a l i are the forecasted and optimal Shiftable load of the i - t h hour of the day.
-
Optional loads are those that may be cancelled without any consequence regarding the operability of the hospital. They are conditionally scheduled and can be expressed in the following form:
i = 1 24 O o p t i m a l i     i = 1 24 O f o r e c a s t e d i  
where:
0   O o p t i m a l i
And O f o r e c a s t e d i and O o p t i m a l i are the forecasted and optimal Optional load of the i - t h hour of the day respectively.
Summarizing, the optimization problem has the form:
min V i r t u a l   C o s t = i = 1 24 P f o r e c a s t e d i · L f o r e c a s t e d i
where:
L f o r e c a s t e d i = M f o r e c a s t e d i + S f o r e c a s t e d i + O f o r e c a s t e d i
s.t.:
M o p t i m a l i = M f o r e c a s t e d i  
i = 1 24 S o p t i m a l i = i = 1 24 S f o r e c a s t e d i  
S o p t i m a l i + O o p t i m a l i i = 1 24 L f o r e c a s t e d i M o p t i m a l i  
M o p t i m a l i , S o p t i m a l i , O o p t i m a l i 0  
When the optimization process ends, the optimal loads will be the finally scheduled loads.

2.5. Methodology

To sum up the abovementioned concepts, a brief description of the method followed in the study is essential.
The U.S. Department of Energy (DOE) has developed in collaboration with the National Renewable Energy Laboratory (NREL) 16 reference building types which represent most commercial buildings for energy modeling analysis. A prototype hospital building model located in New York City [29] was selected and simulated with ENERGYPLUS ver. 22.2.0 simulation software for the years 2017–2020, while LMPs for the same period were collected from NY-ISO [30]. The data collected from the abovementioned source was processed with MATLAB Release 2022b programming and computing software. MATLAB was used for the development of the proposed models and the results’ analysis as well. The building’s general specifications are given in Table 2:
In Figure 5, the shape of the model building is presented:
The building’s load data obtained from the simulation consists of 26,280 hourly samples. The same number of samples was collected for the LMPs. The data were preprocessed removing the outliers and replacing them with rational values representing the linear interpolation of neighboring, nonoutlier values. Finally, the data were divided into two subsets: one for the training process and one for the testing of the ANFIS models with a ratio of 75:25 respectively.
As mentioned above, in the ANFIS model which is designed for the LMP forecasting an input selection must be carried out. Examining samples of the LMP timeseries using partial autocorrelation, where P represents the LMP values, the five most significant lags are selected: P t 1 ,   P t 2 ,   P t 20 ,   P t 21 ,   P t 19 .  Figure 6 shows the partial autocorrelation plot of the samples [32]:
Two ANFIS models were designed: One for the LMP forecasting, with 5 inputs and one for the loads’ forecasting which use the 24 past hourly loads as inputs. The training and testing load samples were decomposed to Mandatory, Shiftable and Optional load samples. The models were trained for the respective samples.
From the testing data sets, a day from every month of the year 2019 was selected. Starting from the Mandatory loads, the VC was tried against the Threshold and the Shiftable and Optional loads were rescheduled with GA with respect to the constraints. The following flowchart in Figure 7 depicts the process.

2.6. Load and Price Data

As mentioned before, the load consumption is predicted via ANFIS models like this in Figure 2. Initially, the total Load (L) timeseries obtained by the building’s simulation is decomposed to Mandatory (M), Shiftable (S) and Optional (O) loads’ timeseries.
L = L 1 , L 2 , L 3 , . , L ν
M = M 1 , M 2 , M 3 , . , M ν
S = S 1 , S 2 , S 3 , . , S ν
O = O 1 , O 2 , O 3 , . , O ν
where:
L = M + S + O
The ANFIS models are trained with Mandatory, Shiftable and Optional datasets. ANFIS accepts the past 24 values of the load as inputs and predicts the next hour’s load as output (Mandatory, Shiftable or Optional). Thus, assuming that in the present hour the mandatory load is M t , ANFIS predicts the next hour’s mandatory load M t + 1 according to Equation (1):
M t + 1 = k 0 + k t 1 M t 1 + k t 2 M t 2 + + k t 23 M t 23
where k 0 , , k 23   the parameters of ANFIS tuned via the training process. Optional and Shiftable loads are also predicted in the same manner.
Price data are also timeseries of Locational Marginal Prices from the NY-ISO. LMPs are real data-not obtained by simulation. Due to electricity price’s nature and the complexity that it demonstrates, it wasn’t feasible to select more than 5 past LMP values as inputs because the rule base would become too large, thus resulting in memory faults. Therefore, using the partial autocorrelation procedure described in Section 2.5, the 5 most significant inputs out of the past 24 price values were selected. Again, the ANFIS model will accept the 5 abovementioned inputs and the output will be the next hour’s LMP. Following the Equation (1), we have:
P t + 1 = k 0 + k t 1 P t 1 + k t 2 P t 2 + k t 19 P t 19 + k t 20 P t 20 + k t 21 P t 21
Concerning the price data, an assumption has been made: LMP reflects the least cost to service, the next increment of demand at a location (bus), consistent with all power system operating constraints, and not the tariff. Since it is not the scope of the study to explain the billing process in depth, in brief, LMPs play the role of the price signals.
The Threshold is set by the customer and represents the upper cost limit that the customer is willing to pay. The customer can also select which loads are Mandatory, Shiftable or Optional, according to the needs of the facility.

3. Results

3.1. Forecasting Models’ Evaluation

The models were trained, and their accuracy was measured using the Mean Absolute Percentage Error (MAPE) metric. MAPE is preferable because it is scale-independent and since the result is in percentage form, it indicates instantly the accuracy of a model. The MAPE formula is given in Equation (20):
M A P E = 1 n i = 1 n y i y ^ i y i  
where y and y ^ denote the observed and the forecasted values, respectively, and n the number of observations.
A day from every month of the year 2019 was selected to evaluate the proposed method. A summary of the results is presented in Table 3:
Summarizing the results, LMP prediction generally has MAPE values significantly larger than the respective MAPE values of the loads. Nevertheless, due to the high volatility of the LMPs, it is expected the model to lack in accuracy. Moreover, the fact that an input selection took place, resulting to loss of information, also impact to the model’s accuracy. It is worth mentioning the case of the sample day on May 13, where the MAPE value is more than 100 percent, indicating a total failure of the model’s ability to accurately predict this day’s LMPs. In Figure 8, the forecasted and the actual MLPs are presented for this day:
Indeed, the LMPs on this date present high fluctuation at the early hours of the day, with a sharp rise of the price within one hour (04.00–05.00), leading to the failure of the ANFIS model to predict accurately. The model fails completely to predict from hours 17.00 to 24.00. On the other hand, in Figure 9, the model predicts rather accurately, resulting to a MAPE value around 5.93 percent. In this sample day, the fluctuation of the LMPs is significantly smaller, limited to 0.021 and 0.034 US $/kWh.
Contrary to LMP prediction, the models developed for load prediction demonstrate robustness. This is easily explainable: Unlike electricity prices, which demonstrate high fluctuation and they rely heavily on several factors which affect them, the load demand is not so flexible, following a seasonal routine. A well-trained ANFIS can easily predict loads, since the electricity demand is not dramatically changing from day to day. Furthermore, the load patterns follow the human routines and needs, and they can be explainable in a straightforward manner. In Figure 10 and Figure 11, the total Scheduled, Forecasted and Actual loads for 20 February and 23 August are presented. Note that the total Scheduled Load (Mandatory, Shifted and Optional) is approximately equal to the actual loads. In February, the Scheduled loads covered 90% of the total demand, while in August the percentage of the total demand covered was 95%. As for the Optional loads, in February 40% were covered while in August, 50% of the Optional loads were covered. In addition, the forecast in August gives a larger MAPE value compared to other sample days. A number of deterministic and non-deterministic factors affect the accuracy of the prediction, such as weather and climate factors, social events, special days (holidays, anniversaries etc.). The sample day in December also gives large MAPE values, but a potential explanation is that the 24th of December is Christmas Eve.
Virtual Cost approach integrates the price and load forecast as a benchmark for the decision-making process. Therefore, LMP forecast, and load scheduling are linked, and the decisions taken are rather simple and straightforward, duplicating human actions: when the price is low and the needs in energy are high, the system purchases energy [19]. When the price is high, the system just covers the necessary loads. This relationship is visualized in Figure 12:

3.2. Revenues

For 9 out of 12 sample days, the proposed method achieved profits. On 23 August, the revenue was 71.75 US Dollars, which corresponds to a 22.95 percentage revenue in comparison to the non-optimized model. In May, despite the fact that the price prediction has a very large MAPE, the system proved to be resilient, achieving a revenue percentage of 7.1%, corresponding to 34.24 US Dollars. In June, the revenue was 8.79 USD (1.27%). It is also interesting that in May, 99% of the total energy needs were covered, while the system achieved to be profitable. In some cases, the GA failed to achieve the solutions by keeping the constraints, resulting in purchasing excessive energy amounts, and, on most occasions the result was to lose money. The sample days of January, October and December had losses. Despite the fact, the losses were relatively small and, concerning the cases of June and July sample days, small revenues were also obtained. Moreover, excessive amounts of energy may be combined with a Battery Energy Storage System (BESS) for arbitrage and ancillary services, reducing the electricity costs [33]. It is important that BESS is already a technology used to facilitate RES deployment, so the proposed approach and the BESS could supplement each other.

4. Discussion

This study presented a model for a price directed market context, proving that accurate load and price predictions in combination with automated decision-making systems integrated with ICT can be feasible and profitable.
More precisely, ANFIS demonstrates high accuracy in load prediction compared to other AI methods, as Panagiotou and Dounis [34] state. Additionally, the decision-making binary fuzzy tree can perform along with GAs in such a way that electricity purchases are made automatically and profitable. A more sophisticated system may consider the hospital’s ability to generate and perform transactions of energy, in a “prosumer”, near-Zero Energy Building context, which implements the use of energy produced with on-site renewable energy generation methods along with arbitrage and ancillary services [33].
Nevertheless, some points need to be studied: In domestic applications, the customer is free to choose the preferable loads and categorize them to Mandatory, Shiftable and Optional, and formulate policies for possible scenarios. A healthcare building must be always prepared to operate under critical conditions demonstrating resilience to extreme conditions. Thus, it is necessary to establish detailed scenarios with a better insight into a hospital’s operation, and a more detailed study of the system’s behavior under critical circumstances [12] is necessary.
Additionally, the impact of the prediction’s errors to the final result should be further researched and analyzed qualitatively and quantitively in order to reduce uncertainties and system failures. It is important to improve the accuracy of price prediction and to develop systems that act proactively in order to prevent deficiencies.
Another matter for research and discussion is the establishment of a proper metric that represents the model’s accuracy and robustness in a clear and unambiguous way. MAPE is a useful metric because it gives a percentage value which is easily understandable and gives an insight for the model’s accuracy. On the contrary, it is not always a clear indicator of a model’s accuracy and robustness. The majority of other available metrics most of the time demand a solid background in statistics and a thorough knowledge of the examined system.

5. Conclusions

ANFIS can predict a hospital’s consumption accurately. It is more difficult to achieve price prediction due to the volatility of the price in the energy industry. However, ANFIS can also give rather accurate results. The combination of predicted loads and price in Virtual Cost context gives to the customer the flexibility to set the amount of money which wants to pay. Nevertheless, it is necessary to set priorities between the loads of the same category and develop strategies that a building’s management system must follow in accordance with its needs. The certain topic is interesting with significant social, environmental and economic impact and raises interesting matters for further study.

Author Contributions

Conceptualization, A.I.D. and D.K.P.; methodology, A.I.D. and D.K.P.; software, D.K.P.; validation, A.I.D. and D.K.P.; formal analysis, A.I.D. and D.K.P.; investigation, A.I.D. and D.K.P.; resources, D.K.P.; data curation, A.I.D. and D.K.P.; writing—original draft preparation, D.K.P.; writing—review and editing, A.I.D. and D.K.P.; visualization, D.K.P.; supervision, A.I.D.; project administration, A.I.D. All authors have read and agreed to the published version of the manuscript.

Funding

This research received no external funding.

Data Availability Statement

Not applicable.

Conflicts of Interest

The authors declare no conflict of interest.

References

  1. Chan, S.; Tsui, K.W.H.; Hou, Y.; Wu, Y.-C. Load/Price Forecasting and Managing Demand Response for Smart Grids. IEEE Signal Process. Mag. 2012, 29, 68–85. [Google Scholar] [CrossRef]
  2. Albadi, M.; El-Saadany, E. A summary of demand response in electricity markets. Electr. Power Syst. Res. 2008, 78, 1989–1996. [Google Scholar] [CrossRef]
  3. Weron, R. Electricity price forecasting: A review of the state-of-the-art with a look into the future. Int. J. Forecast. 2014, 30, 1030–1081. [Google Scholar] [CrossRef]
  4. Singh, H. Transmission Markets, Congestion Management, and Investment. In Competitive Electricity Markets; Global Energy Policy and Economic Series; Elsevier: Amsterdam, The Netherlands, 2008; pp. 141–178. [Google Scholar]
  5. Helman, U. Demand response in the US wholesale markets: Recent trend, new models, and forecasts. In Variable Generation, Flexible Demand; Academic Press: Cambridge, MA, USA, 2021; pp. 211–257. [Google Scholar]
  6. Oliveira, K.B.D.; Oliveira, O.J.D. Making Hospitals Sustainable: Towards Greener, Fairer and More Prosperous Services. Sustainability 2022, 14, 9730. [Google Scholar] [CrossRef]
  7. Squire, M.; Munsamy, M.; Lin, G.; Telukdarie, A.; Igusa, T. Modelling hospital energy and economic costs for COVID-19 infection control interventions. Energy Build 2021, 242, 110948. [Google Scholar] [CrossRef] [PubMed]
  8. Gaspari, J.; Fabbri, K.; Gabrielli, L. A Study on Parametric Design Application to Hospital Retrofitting for Improving Energy Savings and Comfort Conditions. Buildings 2019, 9, 220. [Google Scholar] [CrossRef]
  9. Silvestro, F.; Bagnasco, A.; Lanza, I.; Massucco, S.; Vinci, A. Energy efficient policy and real time energy monitoring in a large hospital facility: A case study. Int. J. Heat Technol. 2017, 35, S221–S227. [Google Scholar] [CrossRef]
  10. Bawaneh, K.; Nezami, F.; Rasheduzzaman, M.; Deken, B. Energy Consumption Analysis and Characterization of Healthcare Facilities in the United States. Energies 2019, 12, 3775. [Google Scholar] [CrossRef]
  11. Cao, L.; Li, Y.; Zhang, J.; Jiang, Y.; Han, Y.; Wei, J. Electrical load prediction of healthcare buildings through single and ensemble learning. Energy Rep. 2020, 6, 2751–2767. [Google Scholar] [CrossRef]
  12. Kyriakarakos, G.; Dounis, A. Intelligent Management of Distributed Energy Resources for Increased Resilience and Environmental Sustainability of Hospitals. Sustainability 2020, 12, 7379. [Google Scholar] [CrossRef]
  13. University of Cambridge. NHS Energy Efficiency Fund Final Report; Department of Health, University of Cambridge: Cambridge, UK, 2015. [Google Scholar]
  14. Deng, R.; Yang, Z.; Chow, M.A.C.J. A Survey on Demand Response in Smart Grids: Mathematical Models and Approaches. IEEE Trans. Ind. Inform. 2015, 11, 570–582. [Google Scholar] [CrossRef]
  15. Ogunjuyigbe, A.; Ayodele, T.; Akinola, O. User satisfaction-induced demand side load management in residential buildings with user budget constraint. Appl. Energy 2017, 187, 352–366. [Google Scholar] [CrossRef]
  16. Mohajeryami, S.; Moghaddam, I.; Doostan, M.; Vatani, B.; Schwarz, P. A novel economic model for price-based demand response. Electr. Power Syst. Res. 2016, 135, 1–9. [Google Scholar] [CrossRef]
  17. Javadi, M.; Nezhad, A.; Nardelli, P.; Gough, M.; Lotfi, M.; Santos, S.; Catalão, J. Self-scheduling model for home energy management systems considering the end-users discomfort index within price-based demand response programs. Sustain. Cities Soc. 2021, 68, 102792. [Google Scholar] [CrossRef]
  18. Alamaniotis, M.; Gatsis, N.; Tsoukalas, L. Virtual Budget: Integration of electricity load and price anticipation for load morphing in price-directed energy utilization. Electr. Power Syst. Res. 2018, 158, 284–296. [Google Scholar] [CrossRef]
  19. Alamaniotis, M.; Tsoukalas, L.H.; Bourbakis, N. Virtual Cost Approach: Electricity Consumption Scheduling for Smart Grids/Cities in Price-Directed Electricity Markets. In Proceedings of the IISA 2014, the 5th International Conference on Information, Intelligence, Systems and Applications, Chania, Greece, 7–9 July 2014. [Google Scholar]
  20. Huang, Y.; Wang, L.; Guo, W.; Kang, Q.; Wu, Q. Chance Constrained Optimization in a Home Energy Management System. IEEE Trans. Smart Grid 2018, 9, 252–260. [Google Scholar] [CrossRef]
  21. Srinivasan, D.; Liew, A.; Chang, C. A neural network short-term load forecaster. Electr. Power Syst. Res. 1994, 28, 227–234. [Google Scholar] [CrossRef]
  22. Ranaweera, D.; Hubele, N.; Karady, G. Fuzzy logic for short term load forecasting. Electr. Power Energy Syst. 1996, 18, 215–222. [Google Scholar] [CrossRef]
  23. Pan, G.; Dong, H.; Nouroddin, M. Applying ANFIS and LSSVM Models for the Estimation of Biochar Aromaticity. Int. J. Chem. Eng. 2022, 2022, 5639203. [Google Scholar] [CrossRef]
  24. Negnevitsky, M. Artificial Intelligence—A Guide to Intelligent Systems, Greek ed.; Tziola: Thessaloniki, Greece, 2017. [Google Scholar]
  25. Choi, E.; Cho, S.; Kim, D. Power Demand Forecasting using Long Short-Term Memory (LSTM) Deep-Learning Model for Monitoring Energy Sustainability. Sustainability 2020, 12, 1109. [Google Scholar] [CrossRef]
  26. Negnevitsky, M.; Mandal, P.; Srivastava, A. Machine Learning Applications for Load, Price and Wind Power Prediction in Power Systems. In Proceedings of the 15th International Conference on Intelligent System Applications to Power Systems, Curitiba, Brazil, 8–12 November 2009. [Google Scholar]
  27. Yuan, Y.; Shaw, M.J. Induction of fuzzy decision trees. Fuzzy Sets Syst. 1995, 69, 125–139. [Google Scholar] [CrossRef]
  28. Boyen, X.P.; Wehenkel, L. Fuzzy Decision Tree Induction for Power System Security Assesment. In Proceedings of the IFAC Proceedings Volumes, Cancún, Mexico, 6–8 December 1995. [Google Scholar]
  29. U.S. Office of Energy Efficiency & Renewable Energy. Prototype Building Models, Building Energy Codes Program. U.S. Office of Energy Efficiency & Renewable Energy. Available online: https://www.energycodes.gov/prototype-building-models#ASHRAE (accessed on 24 April 2023).
  30. New York Independent System Operator. Available online: https://www.nyiso.com/ (accessed on 30 March 2023).
  31. ANSI/ASHRAE Standard 169-2013; Climatic Data for Building Design Standards. ASHRAE: Peachtree Corners, GA, USA, 2013.
  32. Panagiotou, D.K.; Dounis, A.I. Electricity Price Prediction for Hospitals Using a Hybrid ANFIS-FIS Model. In Proceedings of the 5th International Conference on Energy and Environment (ICEE), Porto, Portugal, 2–3 June 2022. [Google Scholar]
  33. Mustafa, B.M.; Keatley, P.; Huang, Y.; Agbonaye, O.; Ademulegun, O.O.; Hewitt, N. Evaluation of a battery energy storage system in hospitals for arbitrage and ancillary services. J. Energy Storage 2021, 43, 103183. [Google Scholar] [CrossRef]
  34. Panagiotou, D.K.; Dounis, A.I. Comparison of Hospital Building’s Energy Consumption Prediction Using Artificial Neural Networks, ANFIS, and LSTM Network. Energies 2022, 15, 6453. [Google Scholar] [CrossRef]
Figure 1. General Structure of a feedforward ANN.
Sustainability 15 08419 g001
Figure 2. General Structure of the TSK ANFIS model used in the present paper.
Sustainability 15 08419 g002
Figure 3. A single node with two successors as the simplest fuzzy binary tree.
Sustainability 15 08419 g003
Figure 4. The rule base of the FDT.
Sustainability 15 08419 g004
Figure 5. The shape of the model building.
Sustainability 15 08419 g005
Figure 6. The partial autocorrelation plot.
Sustainability 15 08419 g006
Figure 7. The flowchart of the process.
Sustainability 15 08419 g007
Figure 8. Forecasted versus Actual LMPs for 13 May 2019.
Sustainability 15 08419 g008
Figure 9. Forecasted versus Actual LMPs for 19 November 2019.
Sustainability 15 08419 g009
Figure 10. Scheduled, Forecasted and Actual Total load for 20 February 2019.
Sustainability 15 08419 g010
Figure 11. Scheduled, Forecasted and Actual Total load for 23 August 2019.
Sustainability 15 08419 g011
Figure 12. The relationship between price and scheduled loads. When the price peaks, the scheduled loads decline. In the period 10.00–16.00 the price is low, so the scheduled loads are high.
Sustainability 15 08419 g012
Table 1. Tabular presentation of the reviewed methods.
Author(s)Optimization ToolScheduling
Strategy
Application
Field
Major
Findings
Ogunjuyigbe, Ayodele and Akinola
[15]
Genetic
Algorithm
(GA)
Utility
Function
Residential
Building
The algorithm successfully maximized the user’s achieved satisfaction and minimized the cost per unit satisfaction.
Mohajeryami et al.
[16]
Overlapping Generations (OLG)Utility
Function
HouseholdsIn both scenarios examined, reduction of cost occurred.
Javadi et al. [17]Epsilon-constraint techniqueDiscomfort IndexHouseholdsA daily bill reduction is confirmed, verifying the effectiveness of the Home Energy Management Systems (HEMS). The installation of energy storage devices and their optimal operation by HEMS can also decrease additionally the consumer’s bill.
Alamaniotis, Gatsis and Tsoukalas [18]Second-order cone programming (SOCP)Load and price anticipationAny type of loadThe consumer’s intervention in the process is minimal, limited to the evaluation of up to three parameters: The amount of energy that the consumer is willing to cancel, the amount of load that may be shifted and the maximum amount that the consumer is willing to pay.
Alamaniotis, Tsoukalas and
Bourbakis
[19]
Linear optimizationLoad and price anticipationSmart grids/citiesThe virtual cost approach requires minimum user intervention and mimics the human interaction to price signals. This approach is able to reduce the real cost of electricity in an automated manner.
Huang et al.
[20]
Improved Particle Swarm Optimization (PSO)Detailed house appliances modelHouseholdsHeuristic-based evolutionary algorithms can provide a fast and almost optimum solution.
Table 2. General specifications of the prototype building.
Comments
VintageNew Construction
LocationZone 4A: New York, NY, USA
(Mixed Humid)
Selected climate based on ASHRAE Standard 169-2013 [31]
Available fuel typesGas, electricity
Building type
(Principal building function)
Healthcare
Building prototypeHospital
Total floor area including basement22,436.18 m2241,410 sq. feet
Number of floors5 plus basement
Table 3. Summary of predictions’ evaluation for one day from every month of the year 2019.
8
January
20
February
11
March
24
April
13
May
18
June
2
July
23
August
17
September
9
October
19
November
24
December
LMP
MAPE (%)
10.9511.5910.6425.36100.599.909.8812.4713.610.155.937.14
Mandatory load
MAPE (%)
0.600.600.600.600.600.600.604.210.600.600.609.34
Shiftable
load
MAPE (%)
1.231.201.481.631.923.531.765.462.061.731.225.35
Optional
load
MAPE (%)
0.690.670.620.610.620.600.602.120.600.620.716.35
Total
load
MAPE (%)
0.220.220.220.070.230.330.381.090.120.160.214.46
The Mandatory and Shiftable loads were totally coveredSustainability 15 08419 i001Sustainability 15 08419 i001Sustainability 15 08419 i001Sustainability 15 08419 i001Sustainability 15 08419 i001Sustainability 15 08419 i001Sustainability 15 08419 i001Sustainability 15 08419 i001Sustainability 15 08419 i001Sustainability 15 08419 i001Sustainability 15 08419 i001Sustainability 15 08419 i001
Percentage of Optional loads covered with the VC approach
(%)
2204053098222223503920554243
Percentage of the total energy needs of the hospital covered with the VC approach (%)11990928399118118959011792128
Revenue
(US $)
−32.23169.42130.56100.9334.248.7920.1971.75101.77−26.09101.16−14.77
Revenue
Percentage
(%)
−42018.4721.337.11.272.5122.9521.02−6.9115.77−4
Disclaimer/Publisher’s Note: The statements, opinions and data contained in all publications are solely those of the individual author(s) and contributor(s) and not of MDPI and/or the editor(s). MDPI and/or the editor(s) disclaim responsibility for any injury to people or property resulting from any ideas, methods, instructions or products referred to in the content.

