1. Introduction
Businesses have been exposed to various challenges during the global pandemic, and their responses to this disruption have impacted their resilience as well as their chances of overcoming this crisis. On the other hand, the financially vulnerable groups in society are disproportionately affected by economic downturns such as the COVID-19 pandemic. Therefore, it is important for businesses to recognise this when creating new business models for sustainable corporate management. By understanding the characteristics, needs and experiences of these vulnerable groups, companies can create more inclusive business models that are better equipped to address the challenges posed by the pandemic. This includes providing financial products and services tailored to the specific needs of vulnerable groups, such as low-cost and accessible banking services, as well as increasing access to social protection programmes and digital financial services [
1,
2]. In addition, companies should consider the impacts of their business models on vulnerable groups, such as the potential for increased debt burden or the risk of financial exclusion. Taking these considerations into account can help to ensure that new business models are both sustainable and equitable [
3,
4]. Furthermore, more and more businesses consider environmental, social and governance (ESG) factors for their business investment and sustainability [
5]. The characteristics of the financially vulnerable groups impacted by COVID-19 are related to firms and social responsibility in several ways. First, businesses have an ethical responsibility to ensure that these individuals are not left behind during the recovery period. Second, businesses should be aware of the risks posed by increased social inequality and consider how their decisions and actions may contribute to this problem. Furthermore, businesses include NGOs, as they need a solid foundation of business features to support their operations in order to grow and prosper securely. In this context, it is necessary to understand what exactly financial vulnerability means.
Financial vulnerability has long been a research topic. Previous studies have attempted to identify the demographic and personal characteristics of vulnerable groups, such as gender, age, family type, employment type, work sectors, education level, housing tenure, work status, marital status and so on [
6,
7,
8,
9,
10,
11]. Some other pieces of the literature have attempted to relate financial vulnerability to external economic shocks, for example, income shock due to unemployment, or that under-employment causes cash inflow reduction. In some cases, this has even resulted in adverse effects on household food access [
12]. On the other hand, the pandemic shock to household spending has been mixed: (1) on the one hand, spending on personal protective products such as masks and disinfectants has increased, while (2) household spending on other non-necessities has decreased [
13]. People have also suffered wealth shock as they have been forced to run down their savings [
14]. Meanwhile, some researchers focused on internal factors such as the financial literacy of individuals. They further examined whether financial literacy had a different impact on financial fragility based on psychological (financial confidence), economic (wealth) and social (race) factors [
15]. It can be seen that there are various factors that determine financial vulnerability. However, research works covering these have been scattered. Therefore, the first objective of this study is to identify such factors, via a literature survey, especially those caused by new-normal styles of living and working during COVID-19 that could intertwine with other determinants to affect an individual’s financial vulnerability.
On the other hand, it is clear that the characteristics of financially vulnerable groups are important, as they help businesses to shape new business models that are sustainable, meet corporate social responsibility goals and achieve several targets of the first goal of the United Nations’ SDGs. Therefore, this warrants conducting a survey to obtain an understanding of the characteristics of financially vulnerable groups. The second objective of this study is to develop survey items to assess financial vulnerability and its factors once they are identified.
Finally, it is noted that the results of the survey can be used to evaluate the effectiveness of existing social responsibility initiatives of the collaborative NGOs (the NGOs are as follows: (1) Investor and Financial Education Council (
www.ifec.org.hk accessed on 15 March 2023) and (2) Healthy Budgeting Family Debt Counselling Centre from Tung Wah Group of Hospitals (
http://www.tungwahcsd.org/en/our-services/youth-and-family-services/specialized-counselling-services/HBFDCC/introduction accessed on 15 March 2023)) of this research project and enlighten/inform them on how to better meet the needs of vulnerable populations. The third objective of this study is to provide a complete set of descriptive statistics that would help future researchers to examine and/or develop a financial vulnerability model.
The objectives of this paper are summarised below:
- (1)
To identify factors, via a literature review, especially those caused by new-normal styles of living and working during COVID-19 that could intertwine with other determinants to affect an individual’s financial vulnerability;
- (2)
To develop survey items to assess financial vulnerability and its factors;
- (3)
To provide a complete set of descriptive statistics that would help future researchers to examine and/or develop a financial vulnerability model.
The remaining parts of this paper will be described below. A literature review will be conducted in
Section 2 on financial vulnerability with the aim of identifying survey items to assess the determinants of personal finance difficulties, particularly the new factors brought on by COVID-19′s new-normal ways of living and working that may interact with other causes. The research design and methodology will be described in
Section 3.
Section 4 will present and discuss the results of the survey and
Section 5 will provide a summary and conclusions of the present study.
2. Literature Review
As mentioned in
Section 1, there are various factors that determine financial vulnerability. Until the work of Van Aardt et al., there had not been a heuristic financial vulnerability model that incorporated the key factors leading to financial vulnerability, such as income fragility, expenditure, saving/income, consumption and debt [
16].
However, Van Aardt et al.’s paper [
16] was published more than 10 years ago. Some of the factors might be worth revisiting in light of the significant changes in social and economic conditions, as well as the rapid growth of technology, such as the accessibility of credit and financial innovation products, the rise in the popularity of online financial products, etc. In particular, beginning in December 2019, the COVID-19 outbreak has spread globally. Since the first case was confirmed in January 2020 in Hong Kong, citizens have experienced financial difficulties despite numerous acts of government financial assistance to alleviate the hardship [
17]. Citizens in Hong Kong have experienced depression, anxiety and post-traumatic stress disorder during the pandemic [
18,
19], and all three of these mental health symptoms have increased significantly when compared to the pre-COVID-19 period of 2016–2017 [
20].
Financial hardship leads to financial vulnerability. People with financial vulnerability are particularly prone to various social and economic changes, such as the outbreak of a pandemic and subsequent economic downturns. Therefore, it is necessary to conduct a survey to identify external social and economic factors, such as those brought on by COVID-19, as well as internal factors, such as financial literacy and personal financial behaviours. In fact, the factors identified can be mapped onto the cause–effect chain of financial vulnerability of Van Aardt et al. [
16], either as new external factors (i.e., the pandemic), internal factors (i.e., financial literacy and addiction to digital technology) or a “new version” of existing variables. These are new factors related to the current pandemic and developing technological advancement (i.e., digitalisation of the economy), which in turn are bringing about new living and working styles as well as financial behavioural change (i.e., changes in financial behaviour). These factors are reviewed below.
2.1. Change in Financial Conditions Due to Pandemic
The first factor relates to a change in financial conditions due to the pandemic. COVID-19 induced economic uncertainty [
21]. The consequence has been that it has led to various shocks and they have impacted personal financial conditions such as lower asset values and wealth, increased cash outflows and lower cash inflows [
6,
7,
9]. Roll and Despard [
9] used a single-item survey to invite respondents to report whether their financial condition has changed since the start of the COVID-19 pandemic. Similar items with a Likert scale were deployed in this survey. Given that Hong Kong has adopted a zero-COVID-19 policy, how the people in Hong Kong have been experiencing these pandemic-induced economic shocks and their impact on financial vulnerability deserve closer investigation. Therefore, the present study adds value by acquiring a more in-depth understanding of how cash inflows/outflows and asset value changed between the time before the pandemic and at the time of seeking counselling.
2.2. Exposure to Digitised Financial Services and Related Push Marketing
The second factor concerns the digitisation of the economy. Over the last 10 years, technology has made tremendous advancements especially in the area of online marketing. People have grown accustomed to various online services. The existing literature acknowledges that there is a research gap in understanding how personal consumption, financial and credit behaviour may change in relation to a development in digital technology and digital society [
22,
23]. Attitudes, awareness and adoption are the issues requiring more investigation [
22,
23,
24].
2.3. Financial Management Ability
The third factor covers financial management ability. Financial management ability in the present study involves two aspects: (1) financial literacy and (2) addiction to digital technology. As it is believed that improving financial literacy would equip people to deal with financial shocks and reduce the likelihood of making financial mistakes [
25], minimising the negative impact of behavioural biases [
26], financial literacy has been regarded as one of the key internal factors that relates to financial vulnerability. Digital technology has transformed the way in which corporations do business. As buying goods and services online has become so much easier nowadays, the development in internet technology may also have an impact on people’s consumption levels. People frequently engage in compulsive buying, which is defined as shopping without a purpose and without any kind of planning [
27]. Spinella et al.’s research showed a link between financial behaviour and addiction to online shopping [
27]. Financial literacy had an impact on online buying addiction, according to recent research. According to Lam and Lam [
28], those who are financially literate are less likely to be addicted to online purchasing. Additionally, people who worry a lot about money are more prone to develop a shopping addiction [
29]. However, there is little evidence on how important a person’s financial situation is for developing an addiction to internet buying [
28].
2.4. Variables for Change in Financial Behaviours
The fourth factor encompasses several personal financial behaviours. Financial behaviour is considered to be the particular household behavioural actions related to money management [
30,
31]. In the literature, a variety of behavioural dimensions have been put forth, including cash management, credit management and retirement planning [
32,
33]. In the present study, we focus on the following four financial behaviours: earning, spending, investment and debt. The above newly identified factors are mapped onto the cause–effect chain of financial vulnerability of Van Aardt et al.’s model [
16] as described in Ma et al. [
34].
2.5. Financial Vulnerability
The fifth factor is financial vulnerability. In the present study, it is assumed that financial vulnerability is dependent on the four factors reviewed above (i.e.,
Section 2.1,
Section 2.2,
Section 2.3, and
Section 2.4). Financial vulnerability refers to an individual’s capacity to cope with an adverse financial condition or the perceived feeling of being in a financially unstable situation, representing an early indicator of financial stress [
35,
36,
37]. The financial vulnerability of over-indebted people or households is typically assessed using the debt/service ratio (“DSR”) as defined by the share of debt payments to income above a given threshold [
23,
38,
39].
3. Research Design and Methodology
To achieve this research objective, the target population for this research mainly comprised local individuals with financial problems, such as those who were unable to cope with adverse financial conditions or were having difficulties, including an inability to fulfil bill payments, loan repayments or meet their financial commitments, a perceived feeling of being in a financially unstable situation or a combination of these factors. These research subjects furnished us with the required information and data.
It is not easy to locate and access Hong Kong people with personal financial problems because they may not be willing to disclose their situation to others. Additionally, the same people may not be willing to disclose how various factors affect their financial decision-making, behaviour and ability to deal with their financial problems. The Healthy Budgeting Family Debt Counselling Centre from Tung Wah Group of Hospitals (the “Centre”) offers a comparative advantage in accessing local cases with personal financial problems being helped and counselled by the Centre. The Centre was set up in 2003. It aims to help individuals and families who are in debt, as well as to answer enquiries about debt settlement and financial management including assistance in applying for bankruptcy and debt relief planning. Individuals and families facing debt problems are their service recipients. They are the ideal financially vulnerable groups for this study.
Having identified the target population, the following describes how we gathered the data that were relevant for the present study. In gathering the data, we considered the following steps before analysing the data:
- (I)
The research objective was to provide the characteristics of financially vulnerable groups. More specifically, the following five characteristics were identified. They are as follows:
- (A)
Change in financial conditions due to the pandemic;
- (B)
Exposure to digitised financial services and related push marketing;
- (C)
Financial management ability;
- (D)
Change in financial behaviours;
- (E)
Financial vulnerability—measured using debt/service ratio.
- (II)
Having identified the characteristics of the financially vulnerable groups, survey questions were developed accordingly. A questionnaire with 28 questions in 6 sections was developed by making reference to the relevant literature [
6,
8,
9,
10,
14,
23,
28,
39]. The questionnaire was reviewed by the Centre and we took on board the local financial education authority expert’s opinions to ensure its content validity and ethical considerations to suit the Hong Kong situation.
- (III)
The data were obtained via surveys. The target respondents were those that had sought help from the Centre. Since the outbreak of COVID-19 in Hong Kong, the Centre in 2020 has encountered an increasing number of new callers seeking debt counselling services. Hence, they were the ideal financially vulnerable groups for this study.
- (IV)
During the survey period from September to November 2021, a total of 338 valid responses were collected from local individuals seeking counselling or similar services from the Centre. Given that the Centre only handles around 500–600 cases every year, the collected responses represent a significant population size. The margin of error is within ±3.53% with a 95% confidence level to support our understanding of the target group to achieve our study aims and objectives.
Because of the case availability and cost effectiveness, a convenience sampling procedure was deployed to draw from the accessible population who had been seeking counselling services from the Centre. Users of other centres of the Tung Wah Group of Hospitals receiving similar services such as gambling counselling, addiction prevention and treatment, employment support and crisis intervention were also included. Finally, Cronbach’s alpha test was performed on the collected data to check the data reliability and internal consistency. The test was applied to see whether the multiple-question Likert scale surveys in this research were reliable. The acceptable threshold for internal consistency was considered to be 0.7 [
40].
The results in
Table 1 indicate that Cronbach’s alpha ranged from 0.816 to 0.964, exceeding the threshold and thus demonstrating sufficient internal consistency.
4. Results and Discussion
This section starts by illustrating the respondents’ profile by presenting the related demographic data. They are shown in
Table 2.
The percentage of respondents that was male was 55.6%. The age of the respondents spanned across different age groups, with the biggest group being between the age of 41 and 45, constituting 13% of the segment population. The minimum and maximum ages of the respondents were 17 and 78, respectively. Single and married respondents both represented roughly 40% of the total respondents, while the remaining 20% were widowed/divorced/separated people. A total of 63% of the respondents had had a secondary-level education or below while 37% had had a tertiary education of an associate degree/higher diploma or above.
The percentages of the respondents that were employed or self-employed were 50.0% and 5.2%, respectively. This left 44.8% of the respondents without employment, with them being unemployed, retired, housewives or students. Among those in employment, over 50% worked in public administration, with 32.5% in social and personal services and retail, and 19.8% in accommodation and food services. A total of 71.9% of the respondents resided in rented flats/public housing while 25.9% lived in self-owned or family-owned flats. The remaining 3% lived at friend’s places, quarters or even on the street as a homeless person.
The questionnaire responses collected information on the respondents’ personal characteristics (including financial conditions, financial literacy level, addiction to digital technology and changes in financial behaviour in various aspects) via self-estimation questions and covered various socio-economic changes (including the outbreak of the pandemic and digitisation of the economy). The relevant statistics are presented here.
4.1. Change in Financial Conditions Due to Pandemic
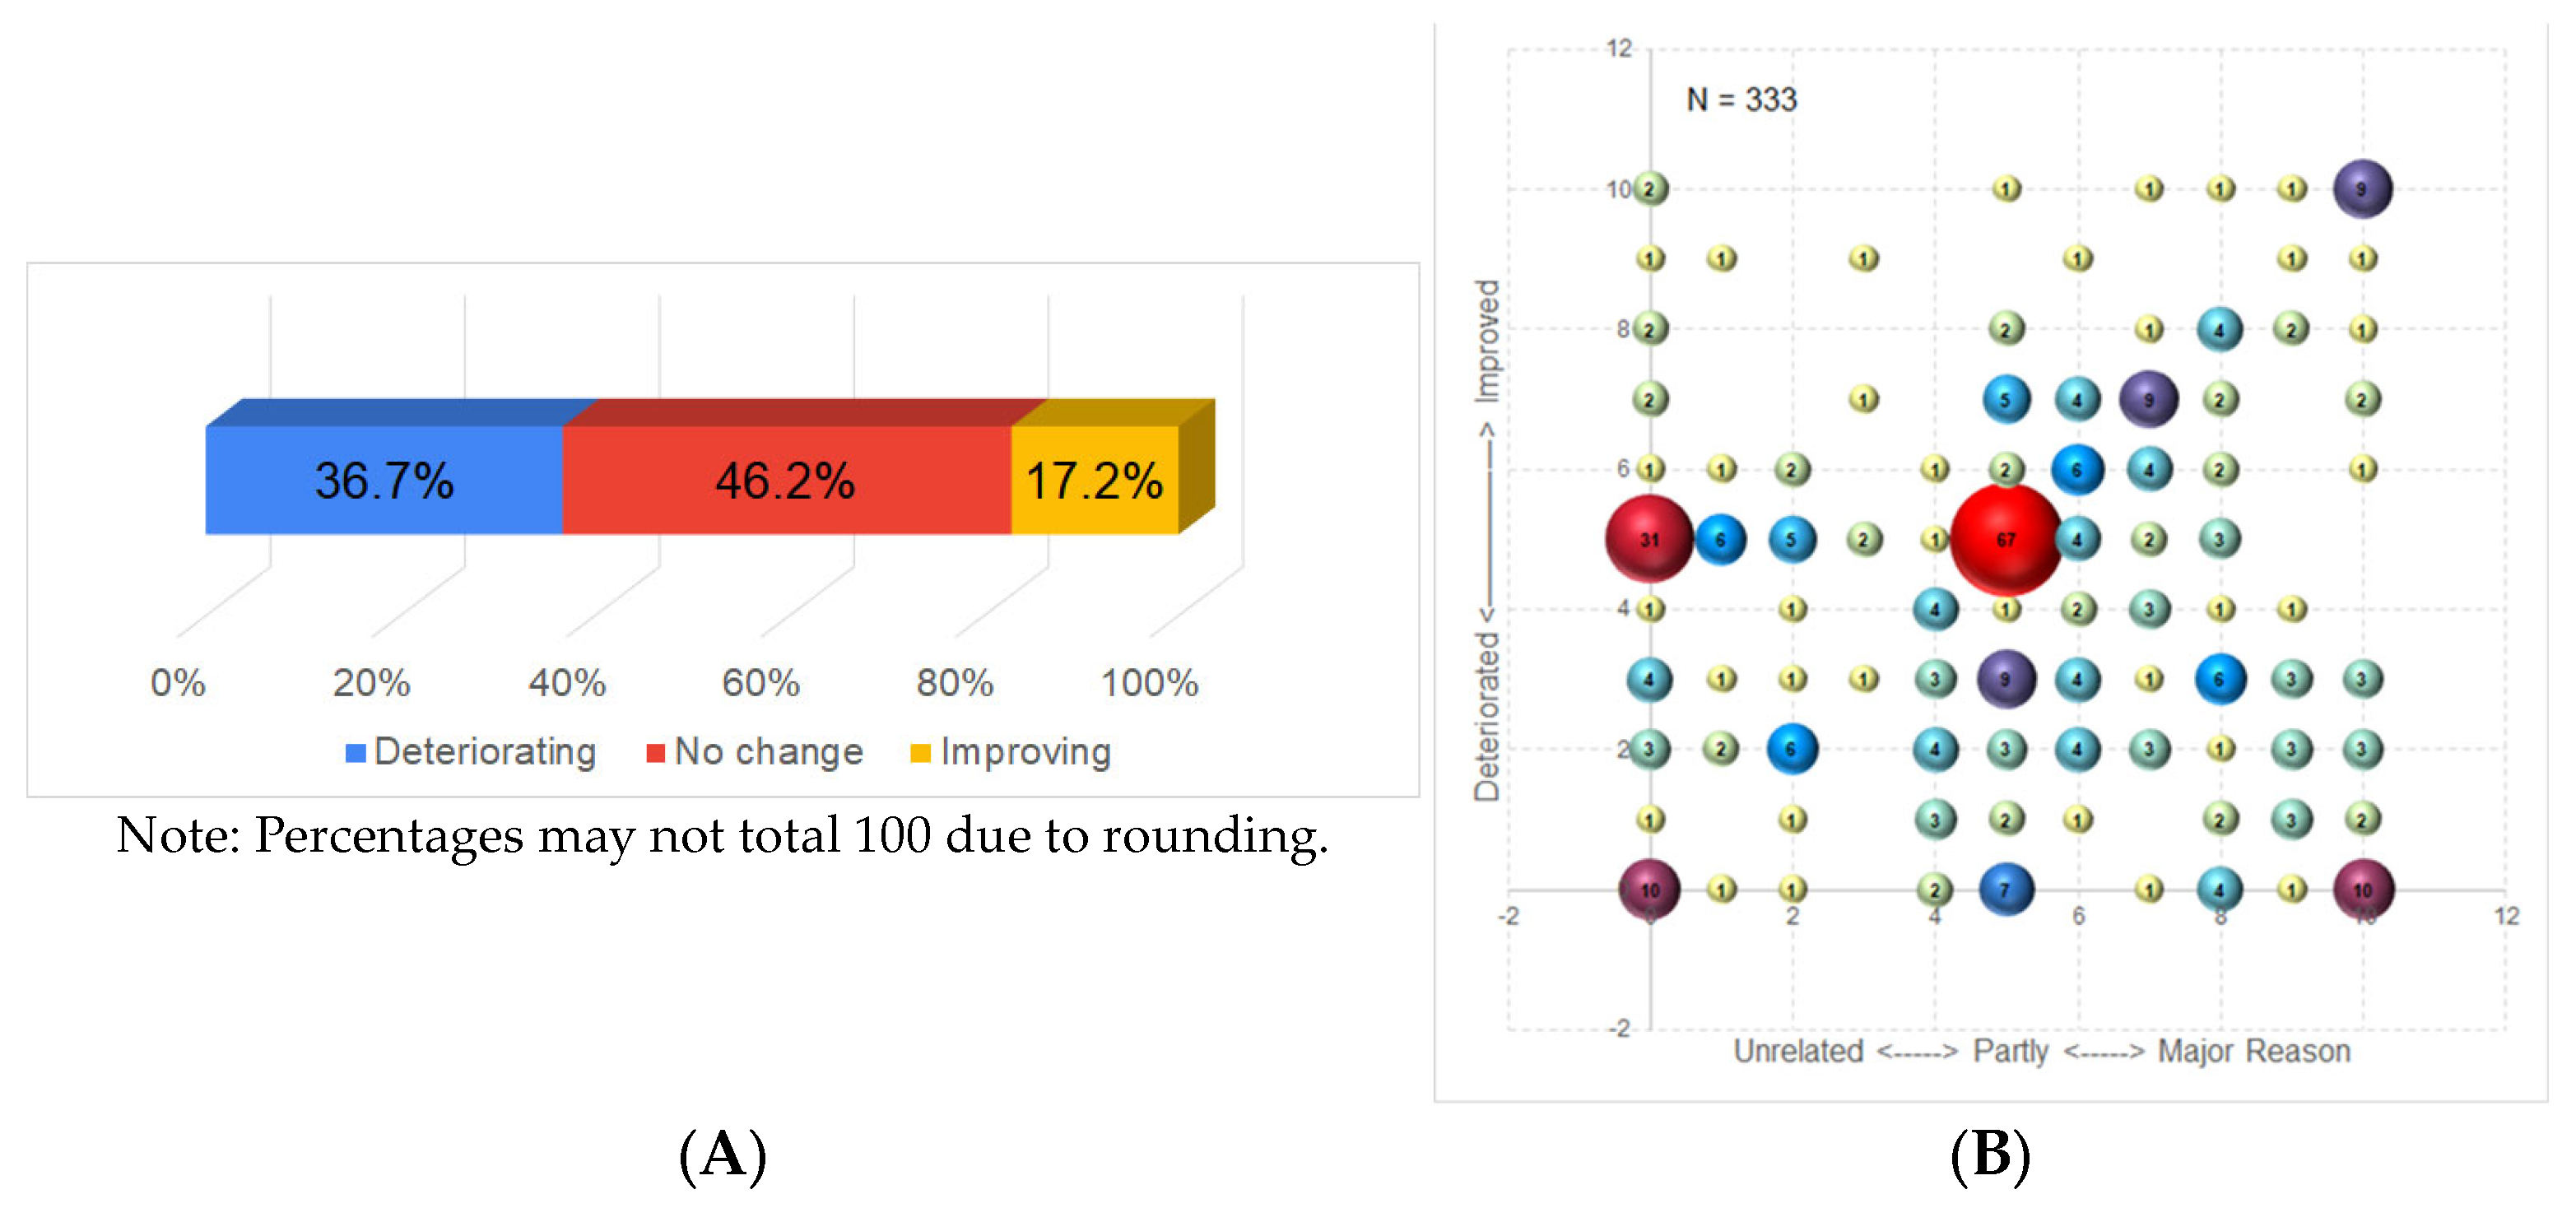
Pandemic-related impact was measured using a self-assessed question on how the respondents’ financial conditions changed after the COVID-19 pandemic outbreak on a 3-category scale (most of the questions in the survey were on an 11-point Likert scale. To facilitate discussion, we aggregated the 0 to 10 scale responses (i.e., 0, 1, 2, …, 10) into a 3-category scale (i.e., 0~3, 4~6 and 7~10, respectively) to provide a broader picture of the received responses). The results shown in
Figure 1A capture that 36.7% of the respondents reported worsening financial conditions after the pandemic outbreak. Only 17.2% of the respondents reported an improvement in their financial condition.
The perceived impact of the COVID-19 pandemic on the self-reported changes in financial conditions were analysed and are shown in
Figure 1B. The volume of the spheres,
Figure 1B, represents the percentages of the received responses. Also, the larger the sphere the darker the colour. For example, the largest sphere at the centre of the diagram is shown in red and the smallest sphere is shown in yellow. Aside from the two largest bubbles in the diagram, which indicate that the respondents’ financial conditions had not changed, there are several notable medium-sized bubbles. The first two bubbles at the bottom of the graph show that 10 respondents claimed that their deteriorating financial conditions were unrelated to COVID-19. At the same time, an equal number of respondents claimed that COVID-19 was the major reason for their deteriorating financial conditions. The third bubble in the top-right corner represents the nine respondents who claimed that COVID-19 was the major reason for their improving financial conditions. Yet, if we were to divide the diagram into four quadrants centred at (5, 5), we can see that a considerable number of the respondents attributed their worsening financial conditions to COVID-19, with the bottom-right quadrant containing the highest number of respondents.
Financially vulnerable groups are those who were already financially struggling before the pandemic or those who were disproportionately affected by the pandemic’s economic impact. These groups include low-income households, small businesses and disadvantaged communities. Businesses that cater to these groups need to understand their specific needs, challenges and barriers to success.
In creating business models for financially vulnerable groups during the pandemic, businesses may need to consider offering more flexible payment plans, discounts or low-cost products or services. They may also need to pivot or adjust their business models to fit new market conditions and prioritise more essential goods and services. Additionally, businesses may need to collaborate with other businesses or government agencies to create social programmes and support services for vulnerable individuals and households.
Overall, businesses must take an empathetic and strategic approach when creating business models for financially vulnerable groups during the pandemic. They must consider the unique challenges and risks facing these groups due to the pandemic’s economic impact and develop solutions that help support them through these difficult times.
4.2. Exposure to Digitised Financial Services and Related Push Marketing
The second variable involves two aspects: (A) usage frequency of digital services in general and (B) level of detail in reading e-marketing messages. For the first aspect, we asked whether the respondents were aware of the seven digitised financial services in the survey:
- (1)
Internet banking services (e.g., internet banking, mobile banking, virtual banking)
- (2)
Electronic payment services (e.g., O-e-pay, WeChat Pay, Alipay, etc.)
- (3)
Online shopping (e.g., shopping sites, online supermarkets/stores, etc.)
- (4)
Online entertainment services/gaming platforms (e.g., online games, movie sites, etc.)
- (5)
Online gambling platforms (e.g., bookmakers’ websites or mobile apps, etc.)
- (6)
Investment apps (e.g., stocks/forex/virtual currency)
- (7)
Online lending channels (e.g., finance companies’ websites or mobile apps, etc.)
Among the 7 digital financial services in the survey, shown in
Figure 2, the respondents were slightly more aware of the first 4 (>80%) than the last 3 (<80%). The first four services are (i) online banking, (ii) e-payment, (iii) e-shopping and (iv) online entertainment services/gaming platforms.
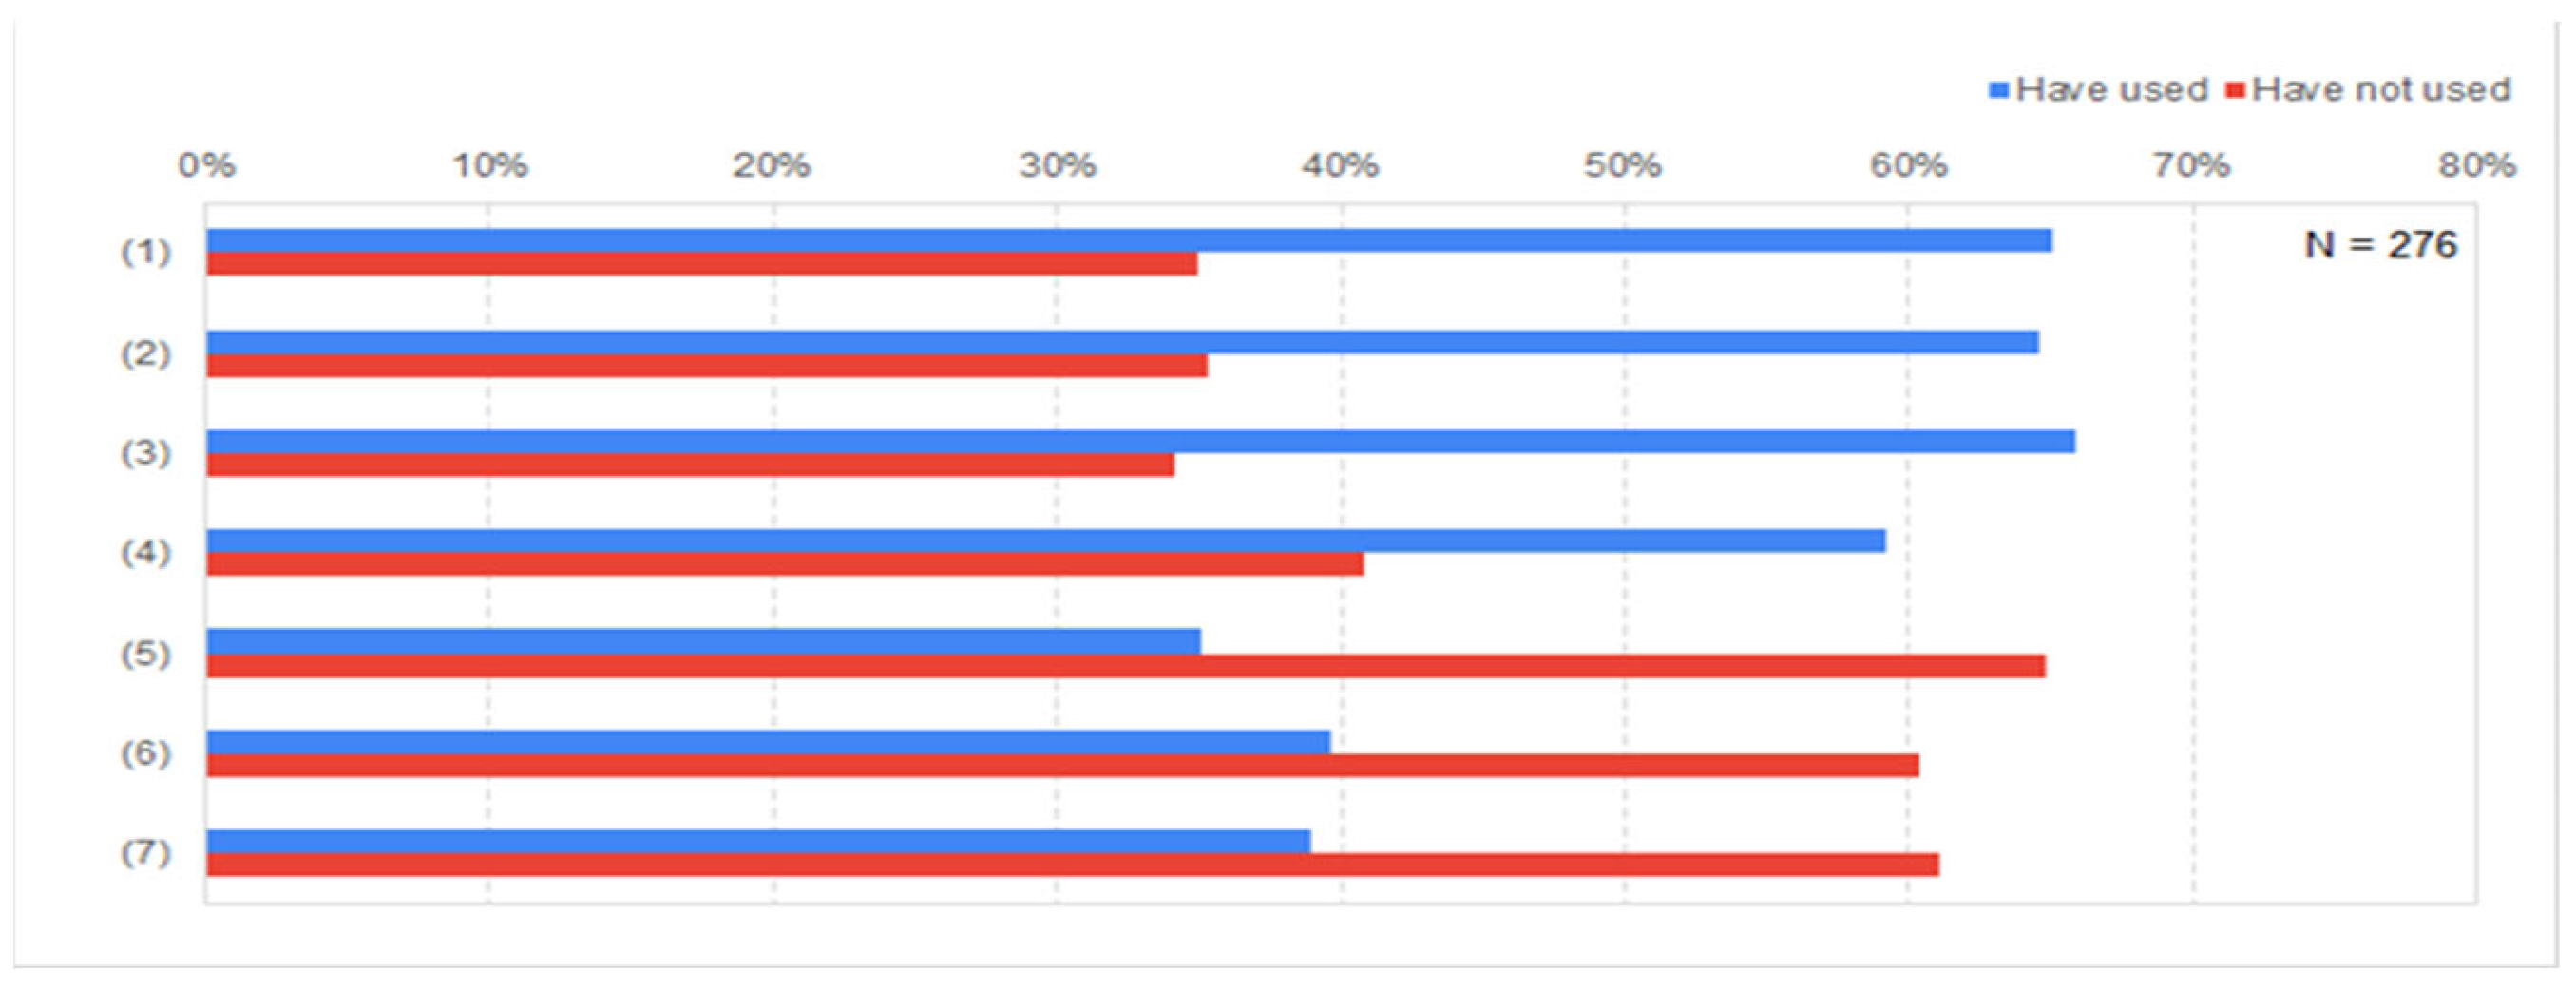
For those who were aware of digital services,
Figure 3 shows that the more people who were aware of the services, the more of them who would actually use them. For example, the more respondents who were aware of the first 4 surveyed services, the more likely that our respondents (around 60%) would have indicated that they would use those services.
Finally, for those who answered that they had used the services, we asked whether the respondents had increased or decreased their usage frequency in the most recent three years (more specifically, we asked the respondents whether they had changed their frequency of using digital financial services before the launch of the Hong Kong SAR Government’s Consumption Voucher Scheme) using a three-category scale, focusing on those who were aware of and had used these services.
Question: in the past three years and before the launch of the Government’s consumption vouchers, have you used the following digital services and changed your frequency usage in each of the seven types of service?
The results shown in
Figure 4 indicate that over 50% of the respondents did increase their usage of these 2 more common services: (i) online banking and (ii) e-payment.
For the second aspect—level of detail in reading e-marketing messages—we asked whether the respondents were aware of the information regarding digitised services relating to three main categories:
- (1)
Promotion of personal loan/credit card/investment services;
- (2)
Publicity and promotion of online gaming/gambling/entertainment services;
- (3)
Information about new investment opportunities (e.g., virtual currencies, investment tips/suggestions posted on social media or online discussion forums).
We can see in
Figure 5 that, on average, 58.5% of the respondents were aware of the information. For those respondents who indicated that they were aware of such digitised services, we further posed the following question.
Question: in the last three years, have you noticed the following digitised information and read the information carefully?
The question asks whether or not they had read the information in detail. Using a 3-category scale, the result indicates that, on average, around 1/3 of those respondents only studied the information briefly and around 50% of the respondents ignored the information (as shown in
Figure 6), especially information related to investment.
It appears that exposure to digitised financial services and related marketing can have both positive and negative effects on business models for financially vulnerable groups.
On the positive side, digitisation can help to expand access to financial services and products, which can benefit individuals and small businesses in vulnerable communities. Digital platforms can also provide increased transparency, as well as reduced transaction costs and greater convenience, which can make financial products and services more accessible and appealing to vulnerable populations.
On the negative side, however, exposure to push marketing can lead to over-indebtedness and financial exclusion, particularly for those with limited financial literacy or who are financially vulnerable. In particular, some studies have suggested that financial service providers may use push marketing to target individuals and groups who are already in financial distress, which can exacerbate existing inequalities.
Overall, it appears that exposure to digitised financial services and related push marketing can influence business models for financially vulnerable groups in complex ways. While digitisation can help to expand access to financial services and products, it is important for businesses to be aware of the potential risks associated with push marketing and to seek to mitigate these risks when developing their models. This may include providing greater financial literacy training or developing more responsible marketing practices.
4.3. Financial Management Ability
The third variable is related to financial management ability. It is divided into two aspects: (1) financial literacy and (2) addiction to digital technology. It is expected that the higher the financial literacy of the respondents, the better the financial management ability will be. Additionally, it is anticipated that the respondents’ financial management ability will be hampered by their incapacity to resist temptation (i.e., addiction to digital technology). For the first aspect, a financial literacy scale developed by Australian Unity was applied to measure the respondents’ financial literacy. On a 0 to 10 scale, the average scores of 8 different behavioural attitudes listed below were calculated and are shown in
Table 3 in descending order:
- (1)
Consider affordability before purchase;
- (2)
Saving is better than expenditure;
- (3)
Do not exceed the credit card limit;
- (4)
Balance expenditure and saving well;
- (5)
Always pay bills on time;
- (6)
Sufficient money to pay minimum amount of credit card statements;
- (7)
Set aside part of my salary for saving;
- (8)
Plan my weekly or monthly expenditure.
Table 3.
Average scores of financial management ability of the eight behaviours.
Table 3.
Average scores of financial management ability of the eight behaviours.
| Rank | Behaviour | Question #/Score |
|---|
| 1 | Consider affordability before purchase | (1): 7.31 |
| 2 * | Do not exceed the credit card limit | (3): 7.18 |
| 3 | Always pay the bill on time | (5): 6.60 |
| 4 | Saving is better than expenditure | (2): 6.08 |
| 5 | Sufficient money to pay min. amount of credit card statements | (6): 5.79 |
| 6 | I plan my weekly or monthly expenditure | (8): 5.16 |
| 7 | Balance expenditure and saving well | (4): 4.81 |
| 8 | I set aside part of my salary for saving | (7): 4.77 |
Using a 3-category scale as shown in
Figure 7, 3 behaviours stood out with more than 55% of the respondents agreeing that (1) they would consider whether they could afford the spendings before they spent, (2) they would not overspend their credit limit and (3) they would pay their bills on time (in the questionnaire, the questions were asked in reverse order. Here, we re-scaled the score to align with the other questions such that a high score indicates a higher level of financial literacy). Among the eight behaviours relating to financial literacy, two showed the worst outcomes. One of them was the respondents’ lack of action in setting aside part of their salaries for saving. The other was the result showing that the respondents did not balance expenditure and saving well. Overall, the financial literacy of the respondents was shown to be just above average, with an average score of 5.96 in 8 questions.
For the second aspect of addiction to digital technology, we further divided it into two measures. In Measure 1, we measured respondents’ behaviour to test whether they were addicted to digital technology. Using the 0 to 10 scale, the average scores of 7 different behaviours relating to digital service usage are listed below. The average scores are shown in
Table 4 in descending order.
- (1)
I often think of it/them;
- (2)
It improves my mood;
- (3)
I use it too often and that adversely affects my daily duties (work or study);
- (4)
I feel I need to use it more to have the same pleasure as in the past;
- (5)
I have tried to use it less, but have not been successful;
- (6)
I feel uncomfortable if I cannot use it for some reason;
- (7)
I use it too often and that affects my normal life.
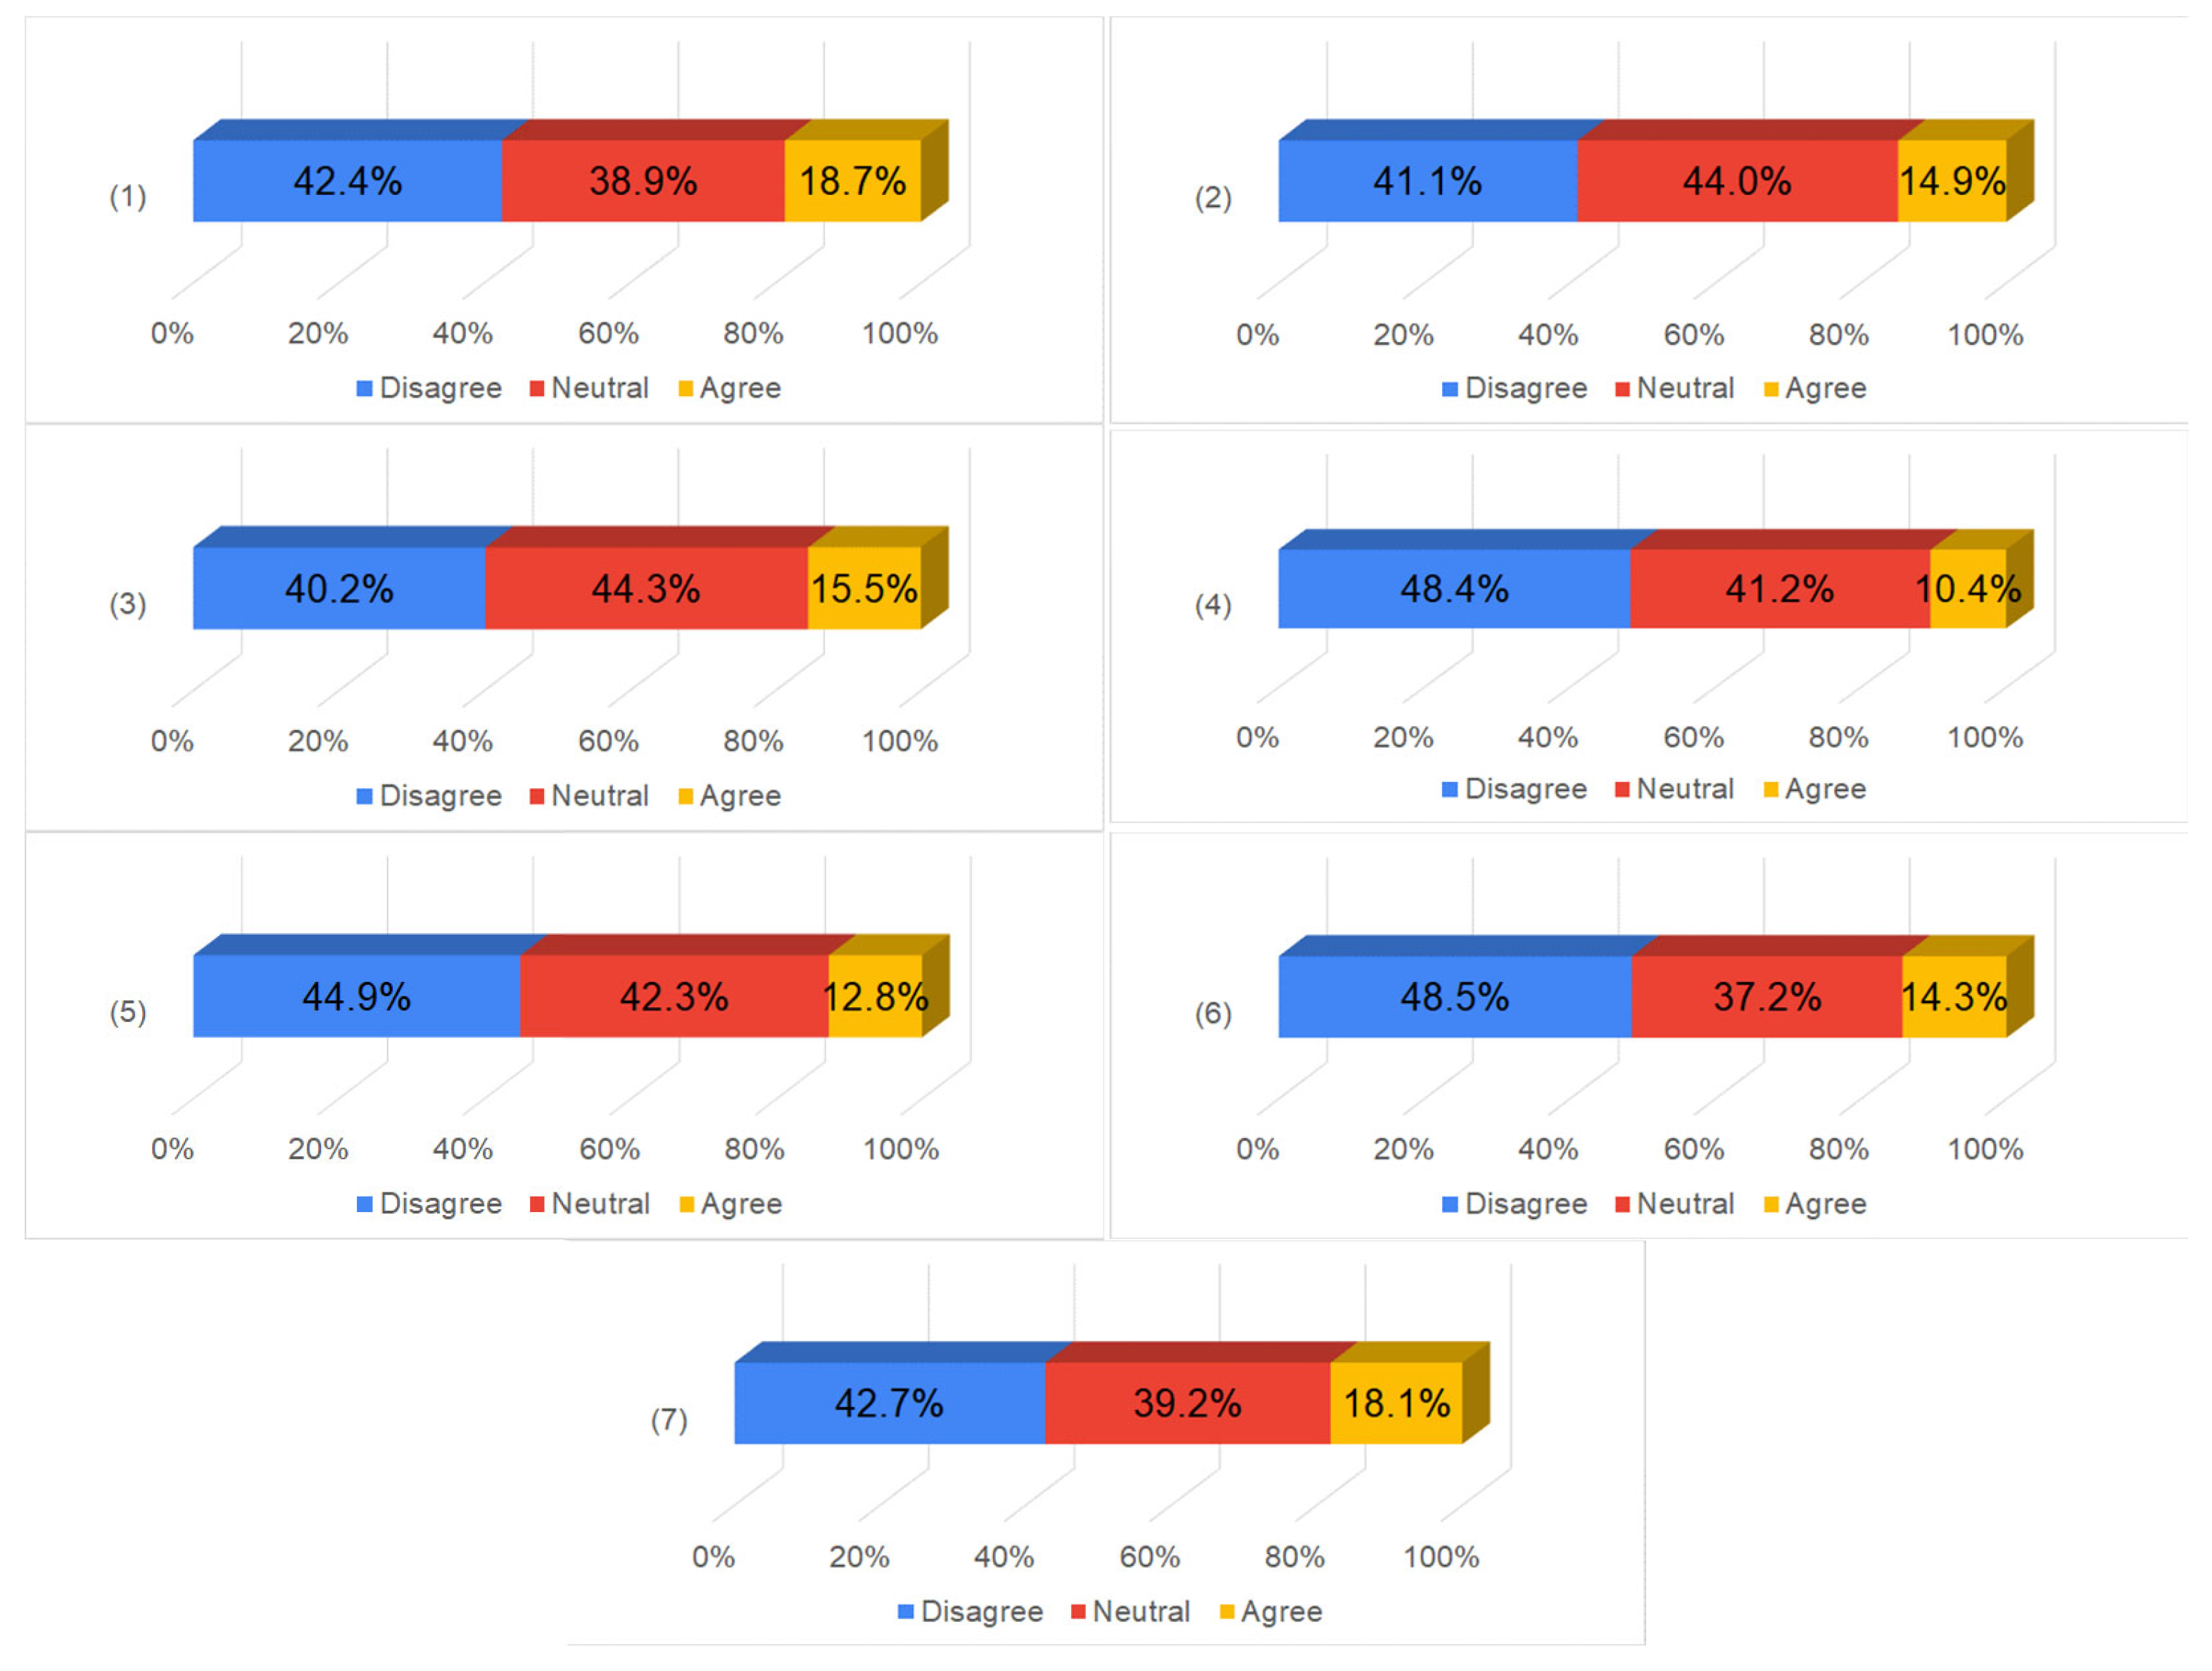
Using a three-category scale as shown in
Figure 8, respondents were more inclined to disagree with the suggestions that they were addicted to digital technology. This result is a contrast to the result of the behaviours related to financial literacy. Nevertheless, the two behaviours that the respondents most disagreed with were as follows: (1) I feel I need to use it more to have the same pleasure as in the past and (2) I feel uncomfortable if I cannot use it for some reason.
In Measure 2, we measured whether a respondent was addicted to digital technology by measuring the respondents’ usage frequency and per month duration usage of digital financial services. The results are shown in
Figure 9 with around 28.7% of the respondents using digital services several times a week. Among the respondents, these were regarded as the most frequent users. On a per month basis, the percentage of respondents classified as frequent users decreases gradually as the identified usage time increases up to 60 h per month. However, it is noted that 7.9% of the respondents reported spending more than 60 h per month participating in digital technology consumption. This translates to around one quarter of the frequent users spending a significant amount of time using digital financial services. Excluding those who claimed that they did not spend any time online, the average duration per month was 16.91 h.
The financial management abilities of vulnerable individuals can have an impact on the creation of business models that aim to serve financially vulnerable groups in several ways. For example, if a significant portion of the target population lacks financial management skills, it may be necessary for a company to invest in financial education initiatives to help individuals to build their financial literacy skills. Additionally, if the target population has irregular income streams or lacks access to traditional financial services, a company may need to develop new business models, products or services that are tailored to the specific needs and circumstances of the target population.
The financial management abilities of vulnerable individuals can also influence the risks associated with serving these groups. For example, if a large proportion of the target population has a history of defaults or late payments, a company may need to adjust its credit or risk assessment policies to manage these risks effectively.
In summary, understanding the financial management abilities of vulnerable individuals is important in developing effective business models for financially vulnerable groups. By developing targeted initiatives and products that address the specific financial needs and challenges of the target population, companies can create sustainable business models that benefit both the target population and the company.
4.4. Variables for Change in Financial Behaviours
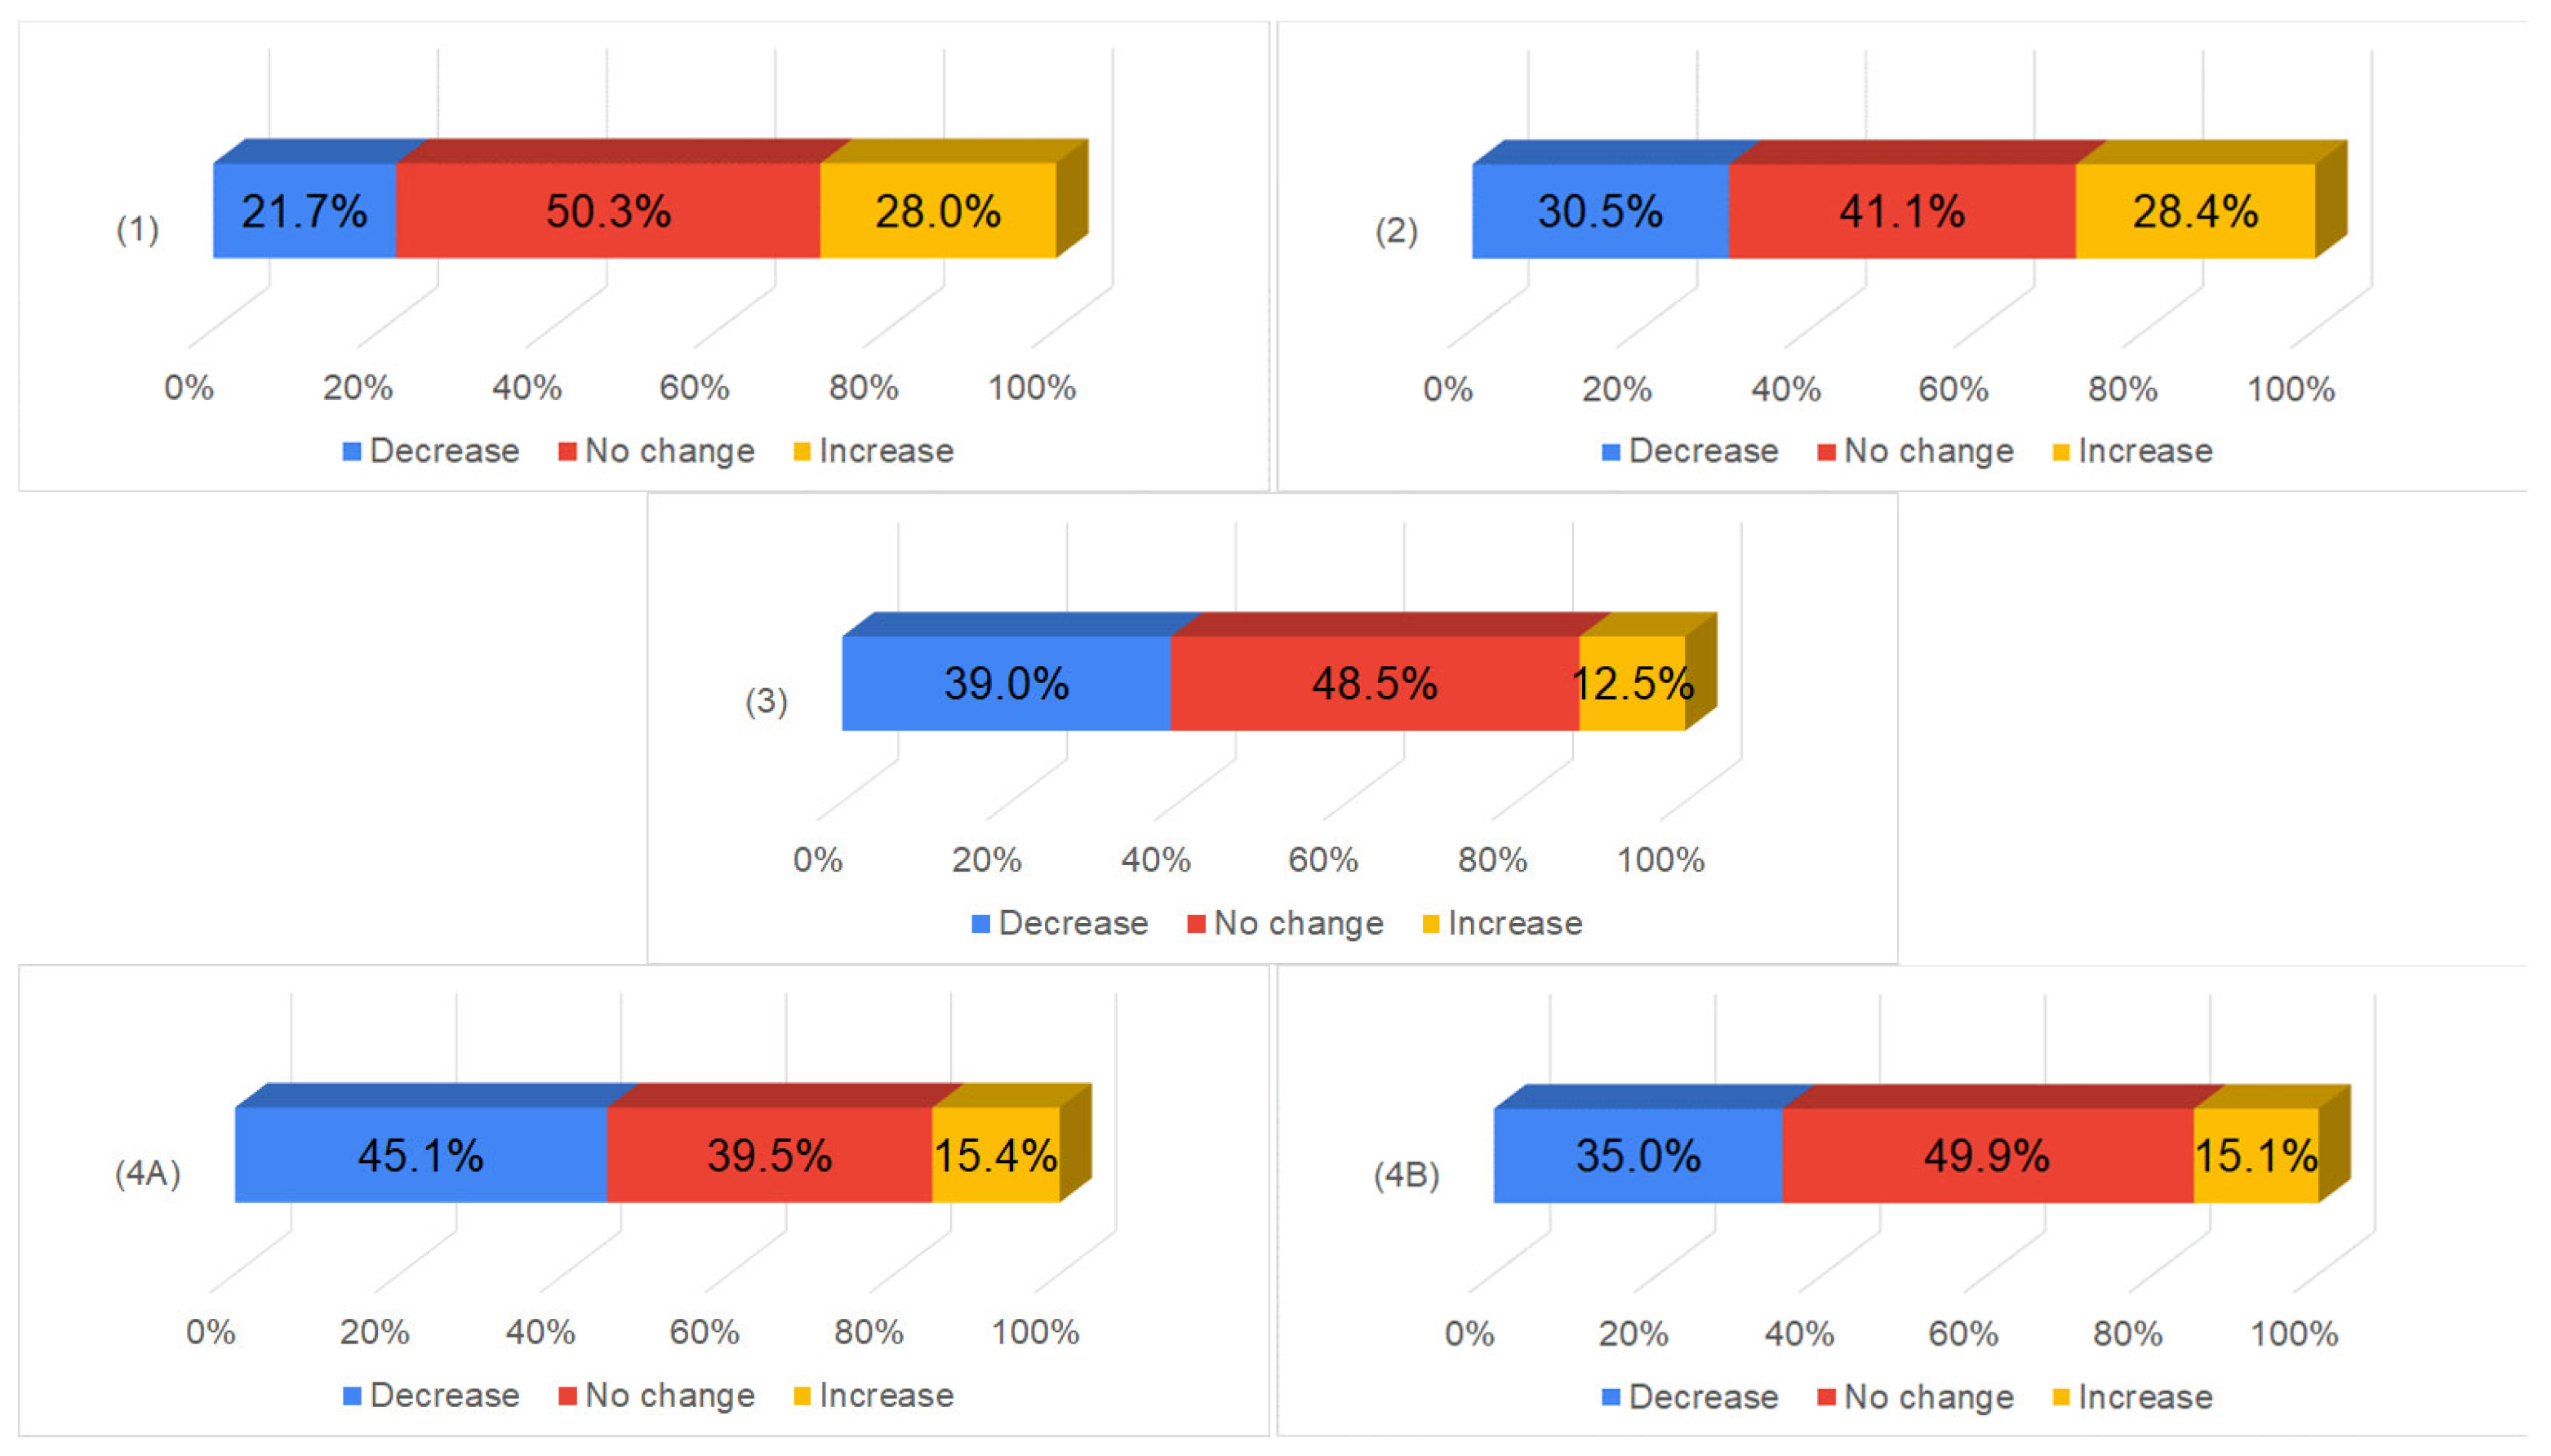
The final set of variables aimed to measure whether the respondents had experienced changes in their financial behaviours from four aspects: (1) income-related earning behaviour, (2) spending-related behaviour, (3) investment-related behaviour and (4) debt-related behaviour. The behavioural change was measured on whether the respondents would increase or decrease the frequency of the related activities in the respective aspects. For example, for income-related earning, we asked the respondents whether they had looked for more/a reduction in work as they wished, working overtime/reducing hours, applying for social benefits, selling assets, etc. For spending-related behaviour, we asked the respondents whether they had increased/decreased their consumption. For investment-related behaviour, we asked the respondents whether they had increased/decreased their amount/frequency of investments and for debt-related behaviour, we asked whether the respondents had increased/decreased their (A) amount and (B) frequency of borrowing, respectively.
Using a three-category scale as shown in
Figure 10, we witnessed changes in respondents’ behaviours, as more respondents indicated that they were more active in seeking income-related activities and less active in seeking expense-related activities. It was also observed that more respondents reduced their frequency in investment, borrowing and debt repayment.
We also conducted a follow-up by posing questions on whether any of the following reasons (these questions also correspond to the factors that this research aims to investigate) caused the changes in their behaviour:
- (1)
COVID-19;
- (2)
The emergence of the digital economy;
- (3)
Personal financial management skills;
- (4)
The frequency of using online services for financial management, shopping, entertainment and payment.
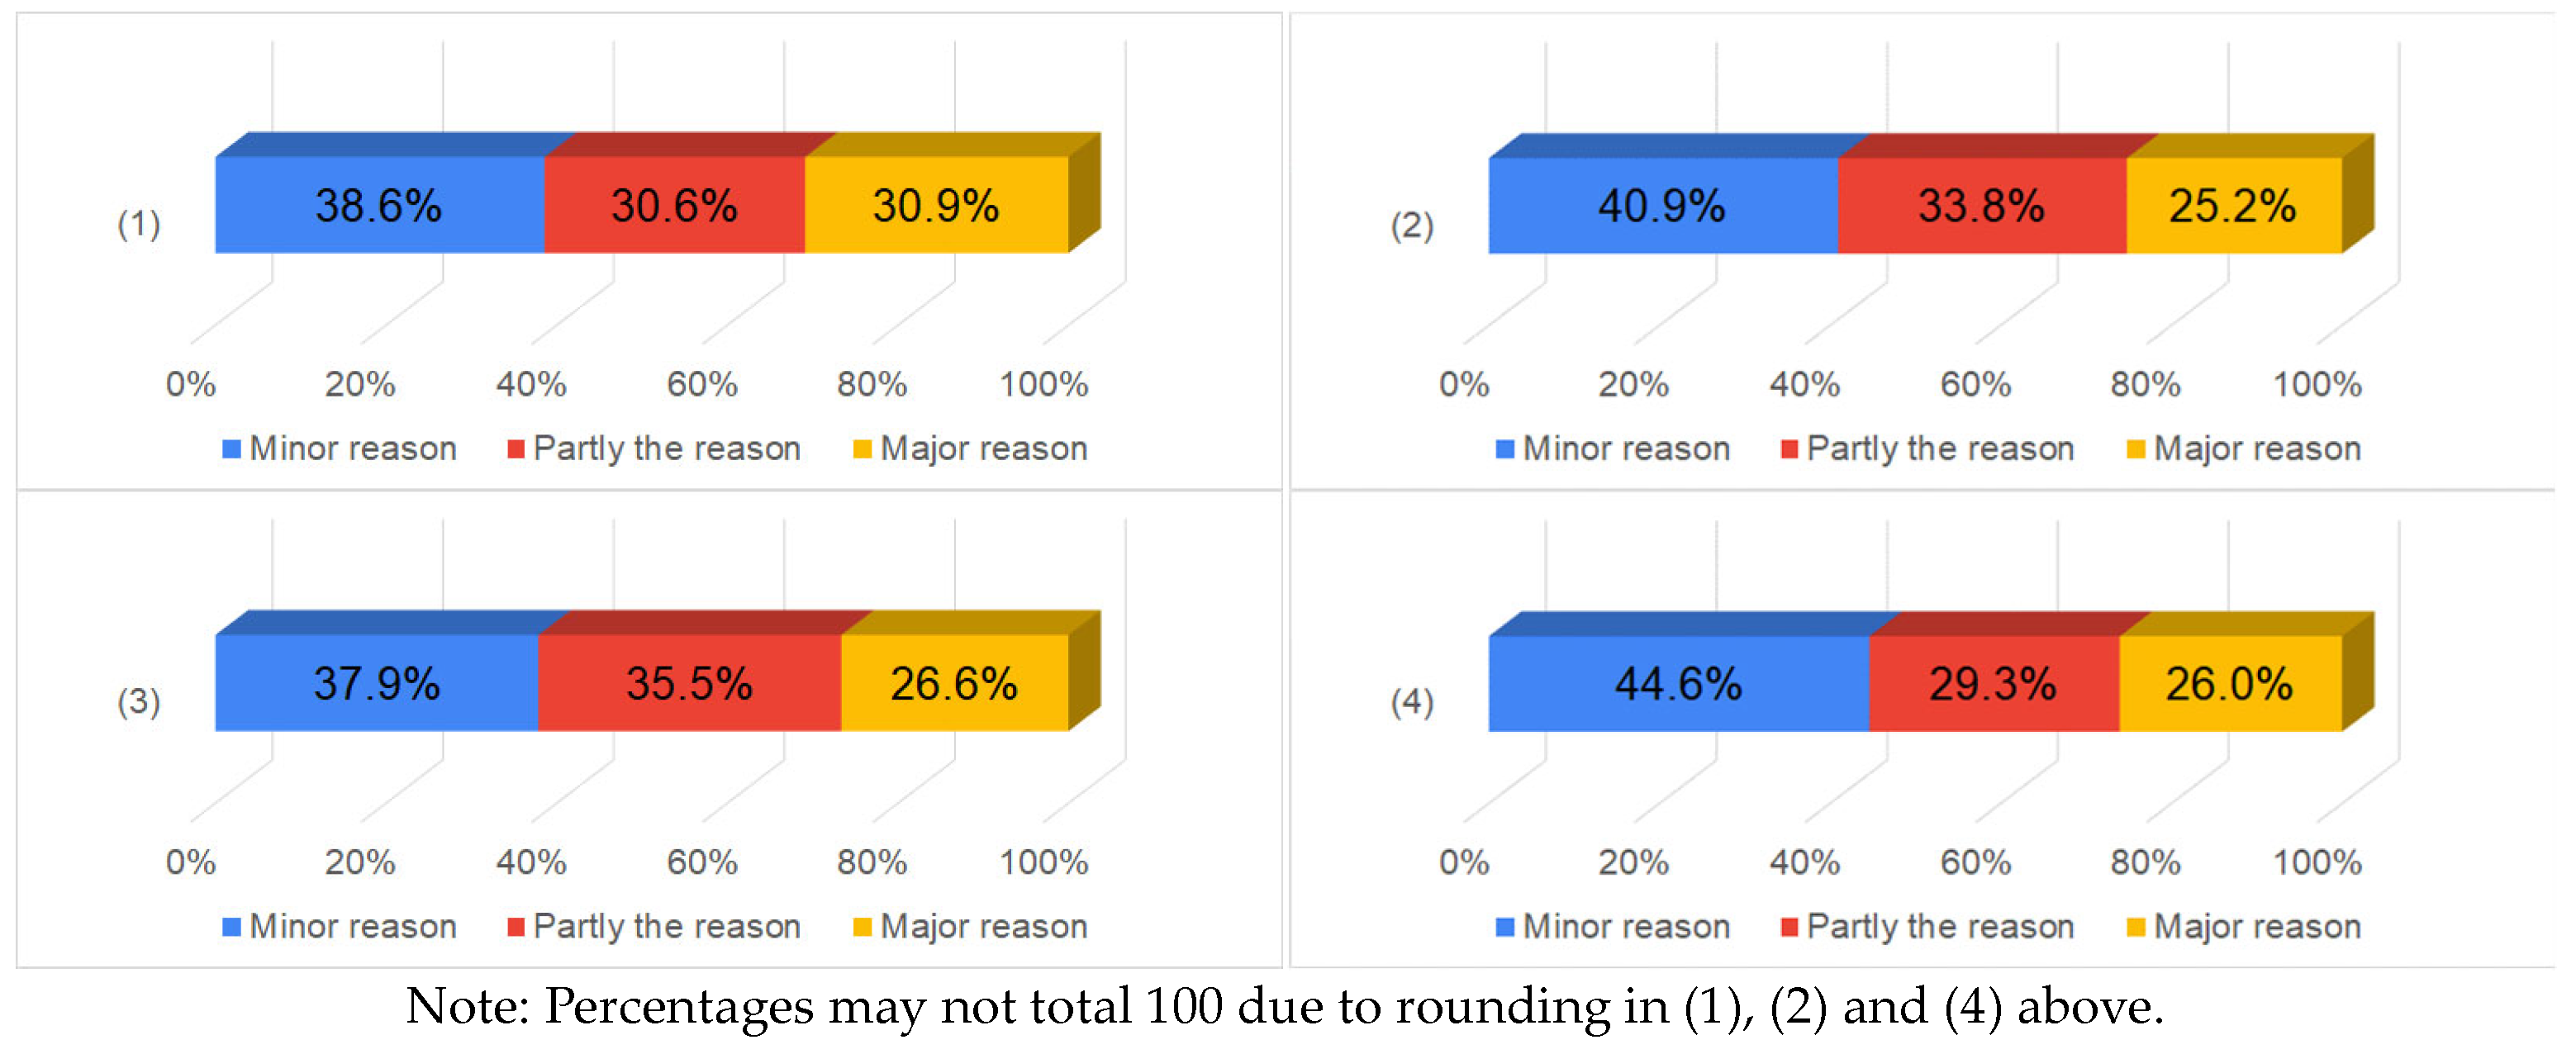
Using a three-category scale as shown in
Figure 11, respondents attributed the causes for their behavioural changes to COVID-19, personal financial management skills, the emergence of the digital economy and the frequency of using online services in descending order.
The results of the changes in financial behaviour may have a significant impact on the success of business models that aim to serve financially vulnerable groups. For example, if financial behaviours change in a way that leads to increased savings or more responsible spending, it could create new opportunities for companies to offer savings products or financial education services that meet the changing needs of the target population.
On the other hand, if financial behaviours change in a way that increases the risk of defaults or late payments, it could create challenges for companies that provide credit to financially vulnerable groups. In this case, companies may need to adjust their credit policies or risk assessment methods to manage risks effectively.
In addition to changes in financial behaviour, other external factors such as economic instability or changes in government policies can also have a significant impact on the success of business models for financially vulnerable groups.
Overall, companies that serve financially vulnerable groups need to stay agile and responsive to changes in financial behaviour and external factors to develop effective business models that meet the evolving needs of the target population while managing risks effectively.
4.5. Financial Vulnerability
Financial vulnerability in this study was measured using the debt/service ratio (“DSR”). Both debt and service are classified as factors to be assessed and “managed” from the respondents’ perspective. Debt is defined as the total amount of monetary obligations, including monthly rent, interest payments and family expenses, that the respondents feel that they have difficulties in honouring. Meanwhile, service is defined as the monthly income or earnings. The higher the debt/service ratio, the more financially vulnerable the respondents will likely be.
Since this research follows other mainstream research and cites DSR as the indicator of over-indebtedness, it is crucial to look into the relevant factors that cause vulnerable group(s) in our population to fall into financial difficulties. Those respondents without income (e.g., unemployed, retired), totalling 75 cases, were not included in the following analysis because their DSR ratio will have been undefined. Additionally, there were 96 cases which did not indicate any monetary value relating to the monthly obligations that the respondents had difficulties honouring; therefore, their ratios will be zero.
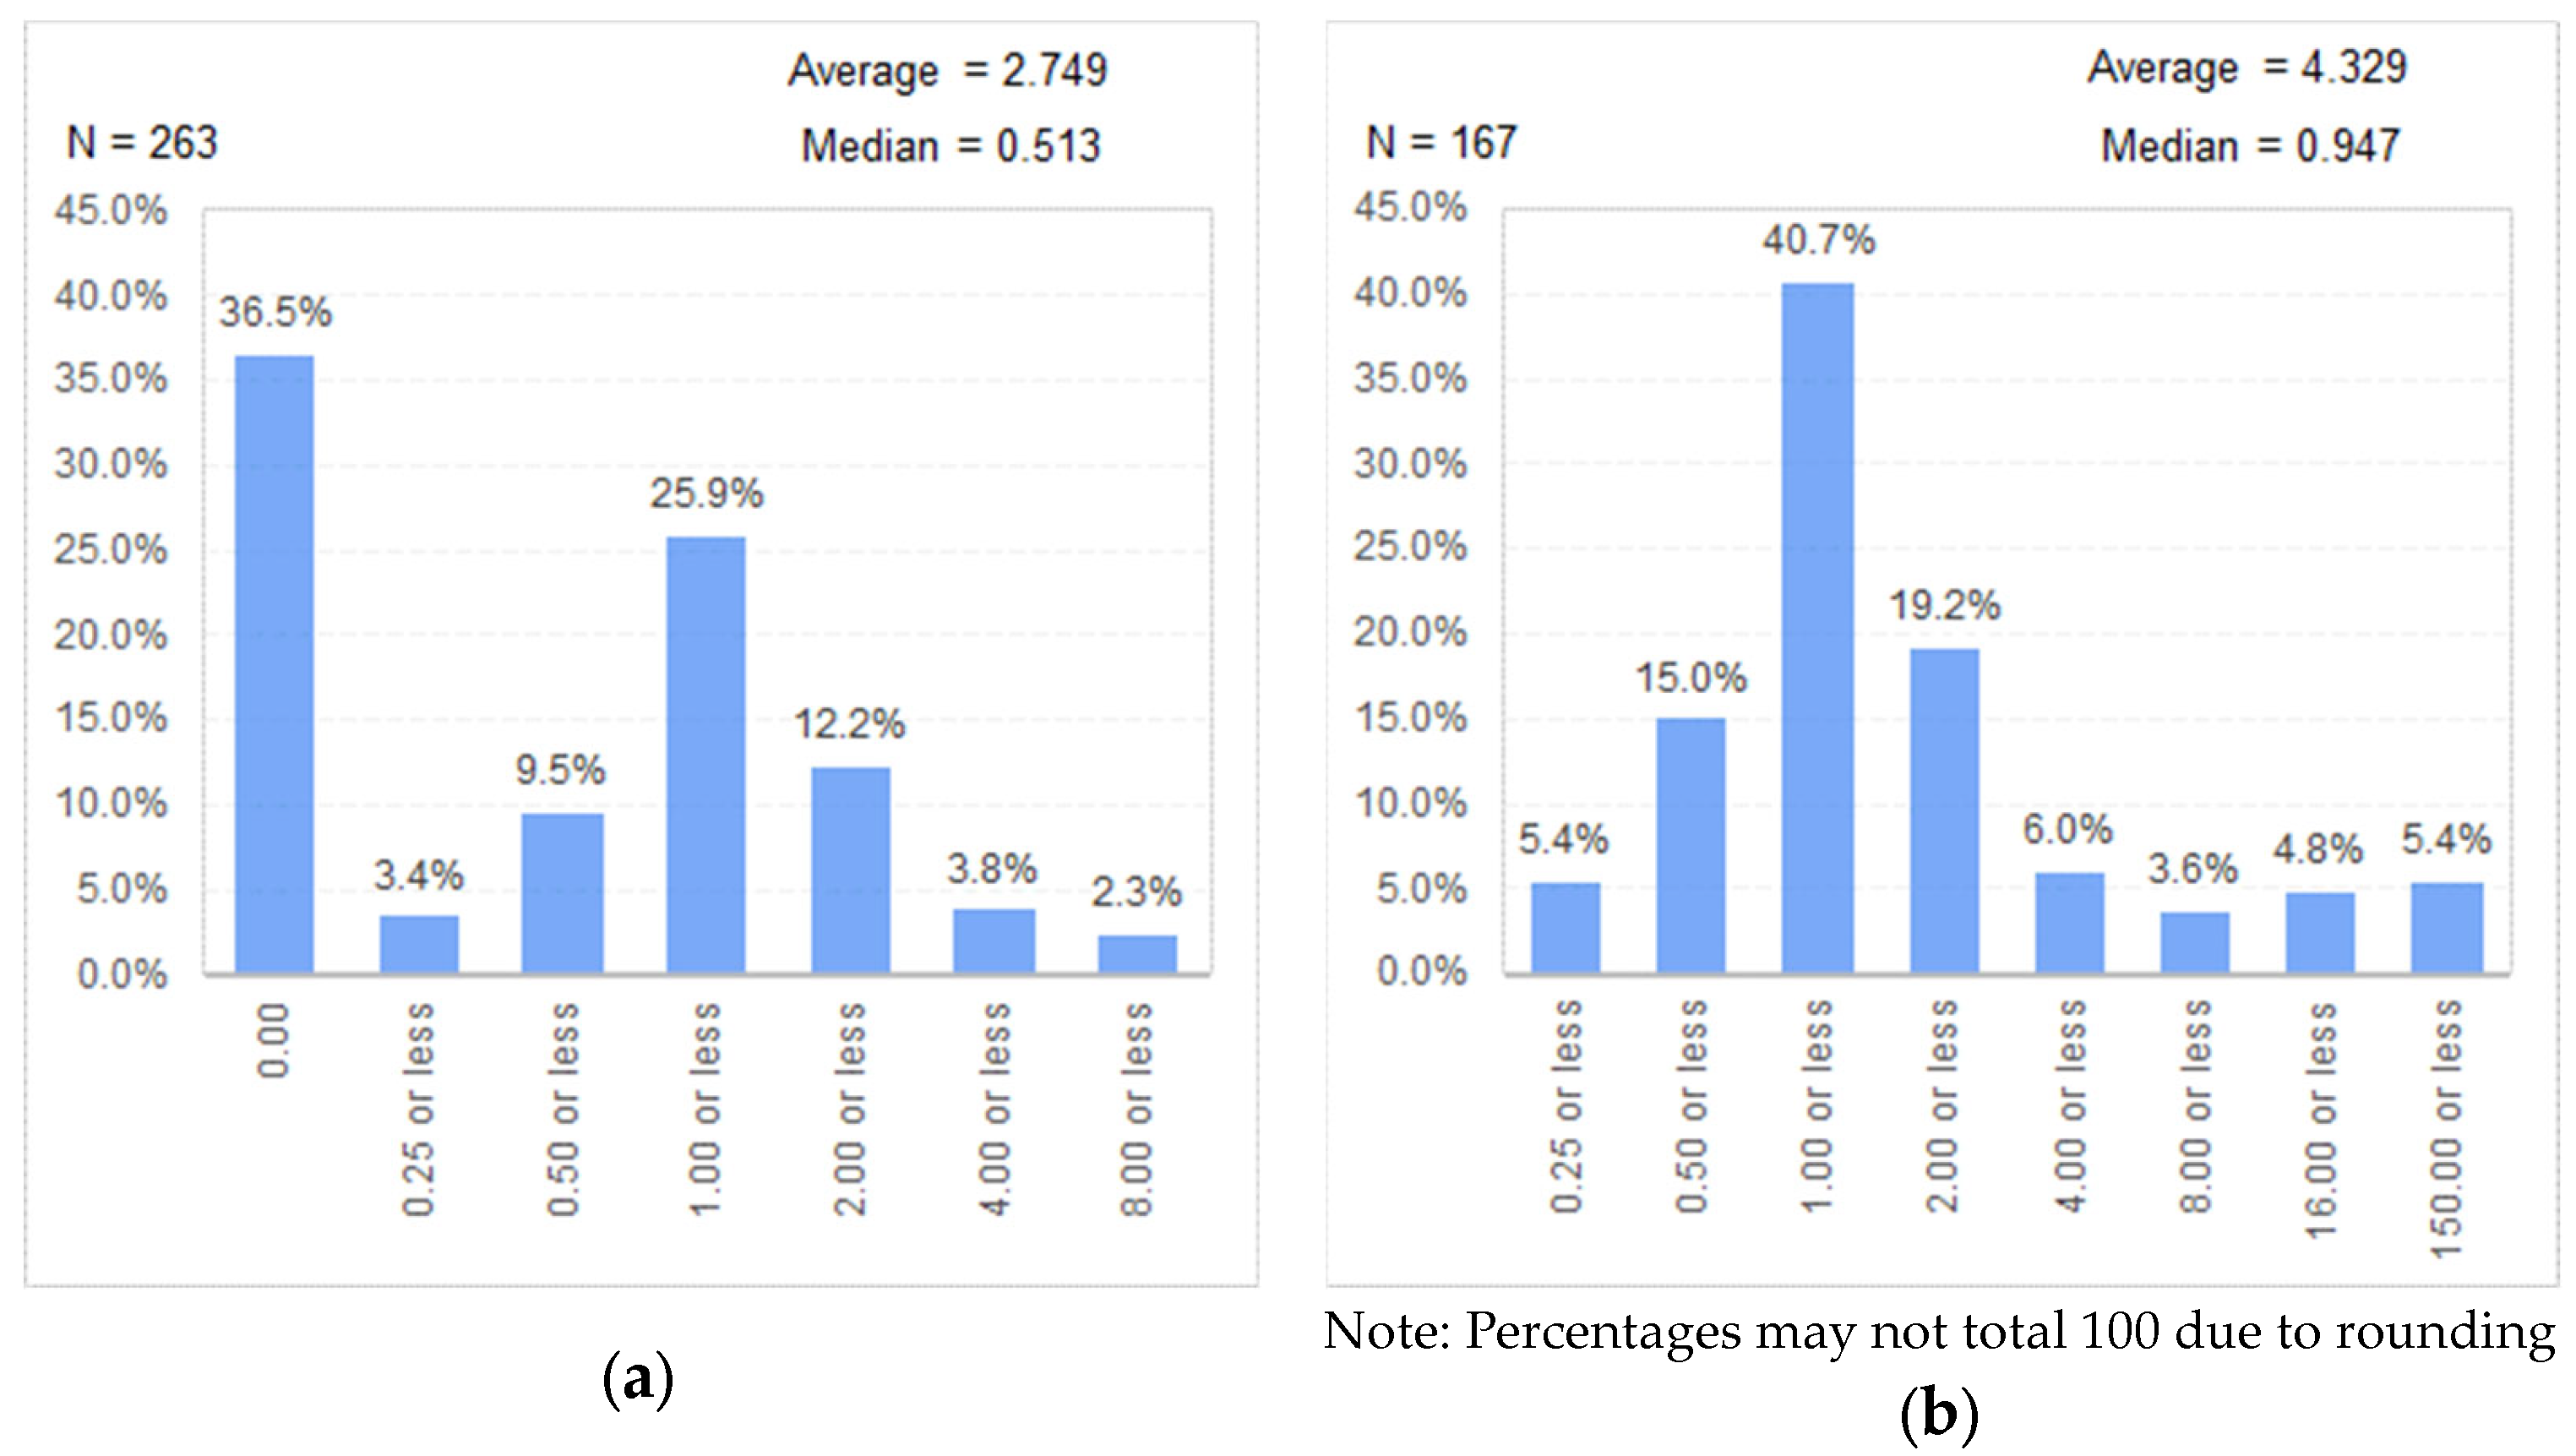
The number of respondents, the average and the median of the debt/service ratio are shown in
Table 5. Expectedly, the average and median are lower when the 96 “DRS = zero” cases are included. A debt/service ratio of greater than 1 is critical as it implies that the respondents’ monthly incomes are not sufficient to fulfil their monthly obligations. This will likely lead to respondents suffering from deteriorating financial conditions and will subsequently lead to a need to resort to borrowing to make ends meet. In our survey, 80 respondents (i.e., around a quarter of our surveyed respondents) reported that their debt/service ratio was 1 or above.
The histograms of the debt/service ratio including or excluding the DSR = zero cases are shown in
Figure 12a and
Figure 12b, respectively.
One way that businesses can create business models that are beneficial to financially vulnerable groups is by designing products and services that are accessible and affordable to them. This may involve offering flexible payment plans, low or no-interest loans or other financial instruments that can help vulnerable individuals to manage their debt effectively. Businesses can also consider offering financial education and literacy programmes to help consumers to better understand their financial options, make informed decisions and manage their debt responsibly. This can help individuals to avoid taking on too much debt or falling into financial difficulties, which can ultimately benefit both the individual and the business.
5. Summary and Conclusions
Understanding the characteristics, needs and experiences of financially vulnerable groups is important for businesses and NGOs when they create new business models for sustainable corporate management as they help businesses to develop products and services that are tailored to their needs and lessen the potential of increased debt burden or the risk of financial exclusion. In particular, during COVID-19, financially vulnerable groups were the worst hit as they were disproportionately affected by economic downturns induced by the pandemic.
This paper has successfully identified factors, via a literature review, especially those caused by new-normal styles of living and working during COVID-19 that could intertwine with other determinants to affect an individual’s financial vulnerability. A questionnaire with survey items to assess financial vulnerability and its factors was developed. The questionnaire was reviewed by the collaborative NGOs and we took on board the local financial education expert’s opinions to ensure its content validity and ethical considerations to suit the Hong Kong situation. Although the present work does not provide empirical investigation, this paper contributes to the understanding of financially vulnerable groups by presenting a complete set of descriptive statistics impacted by COVID-19 and other factors, as discussed with the collaborative NGOs. This set of descriptive statistics would help future researchers to examine and/or develop a financial vulnerability model.
From September to November 2021, 338 valid responses were collected from local residents seeking counselling or similar services from the Centre. They represent a significant population size to support our study because they account for roughly 60% of the total number of cases received by the Centre each year. Demographically, 56% of the respondents were male and 63% received education up to secondary school level. The age of respondents ranged across different age groups and peaked at 13% with age between 41 and 45 years old. A total of 71.9% of the respondents lived in rented flats/public housing flats. Both employed and unemployed respondents were likely to have financial problems. Respondents had a median debt/service ratio of 0.513, which represents an unsustainable level of debt as the commonly understood unsustainable debt level threshold is at or above 0.3 or 0.5. Around ¼ of the surveyed respondents reported that their debt/service ratio was 1 or even higher, indicating obvious difficulties in meeting financial obligations.
A total of 36.7% of the respondents reported that their financial conditions worsened after the outbreak of the COVID-19 pandemic. Digital technology has advanced tremendously over the last 10 years and has changed the way that many businesses conduct their business. Among the respondents, more than 80% were aware of 4 digital services (banking, e-payment, e-shopping and online entertainment/gambling platforms) and 60% adopted these services. A total of 50% of the adopters of online banking and e-payment services had increased their usage of such services in the past 3 years. On average, 58.5% of the respondents were aware of information on digitised services relating to (1) online loans/credit cards, (2) games, gambling and entertainment and (3) investment opportunities. One third of these respondents had studied the relevant information in detail.
Based on the financial literacy scale developed by Australian Unity, the respondents’ financial literacy was just above average with the average score in 8 questions being 5.96 out of 10. The respondents’ addiction to digital services was not considered to be too serious, as the average score is 3.68 out of 10 in 7 questions. The average usage duration of digital services per month was 16.91 h. A total of 7.9% of the respondents usually spent more than 60 h per month on digital usage. Regarding the changes in financial behaviour, around 30% of our respondents were more active in seeking more income and achieving less expenditure. A total of 39% of these respondents reduced their investment activities, while 15% of them increased their debt borrowing/repaying activities.
Given the tremendous social and economic changes that have occurred, as well as technological advancements, this study has successfully characterised the financially vulnerable groups in terms of five key factors: (1) changes in financial conditions due to the COVID-19 pandemic; (2) exposure to digitised financial services and related push marketing; (3) financial management ability; (4) changes in financial behaviour and (5) financial vulnerability as measured using the debt/service ratio. The presented results provide a solid empirical set of data that will aid in the examination and development of a heuristic financial vulnerability model that incorporates the key factors that contribute to it. Businesses and NGOs can refer to the findings here when they create new business models that are sustainable, meet corporate social responsibility goals and achieve several targets of the first goal of the United Nations’ SDGs.


