
Numerical Simulation of Ground Subsidence Response Conditional on Geothermal Exploitation in a Karst Reservoir Area of North China
Abstract
:1. Introduction
2. Study Area
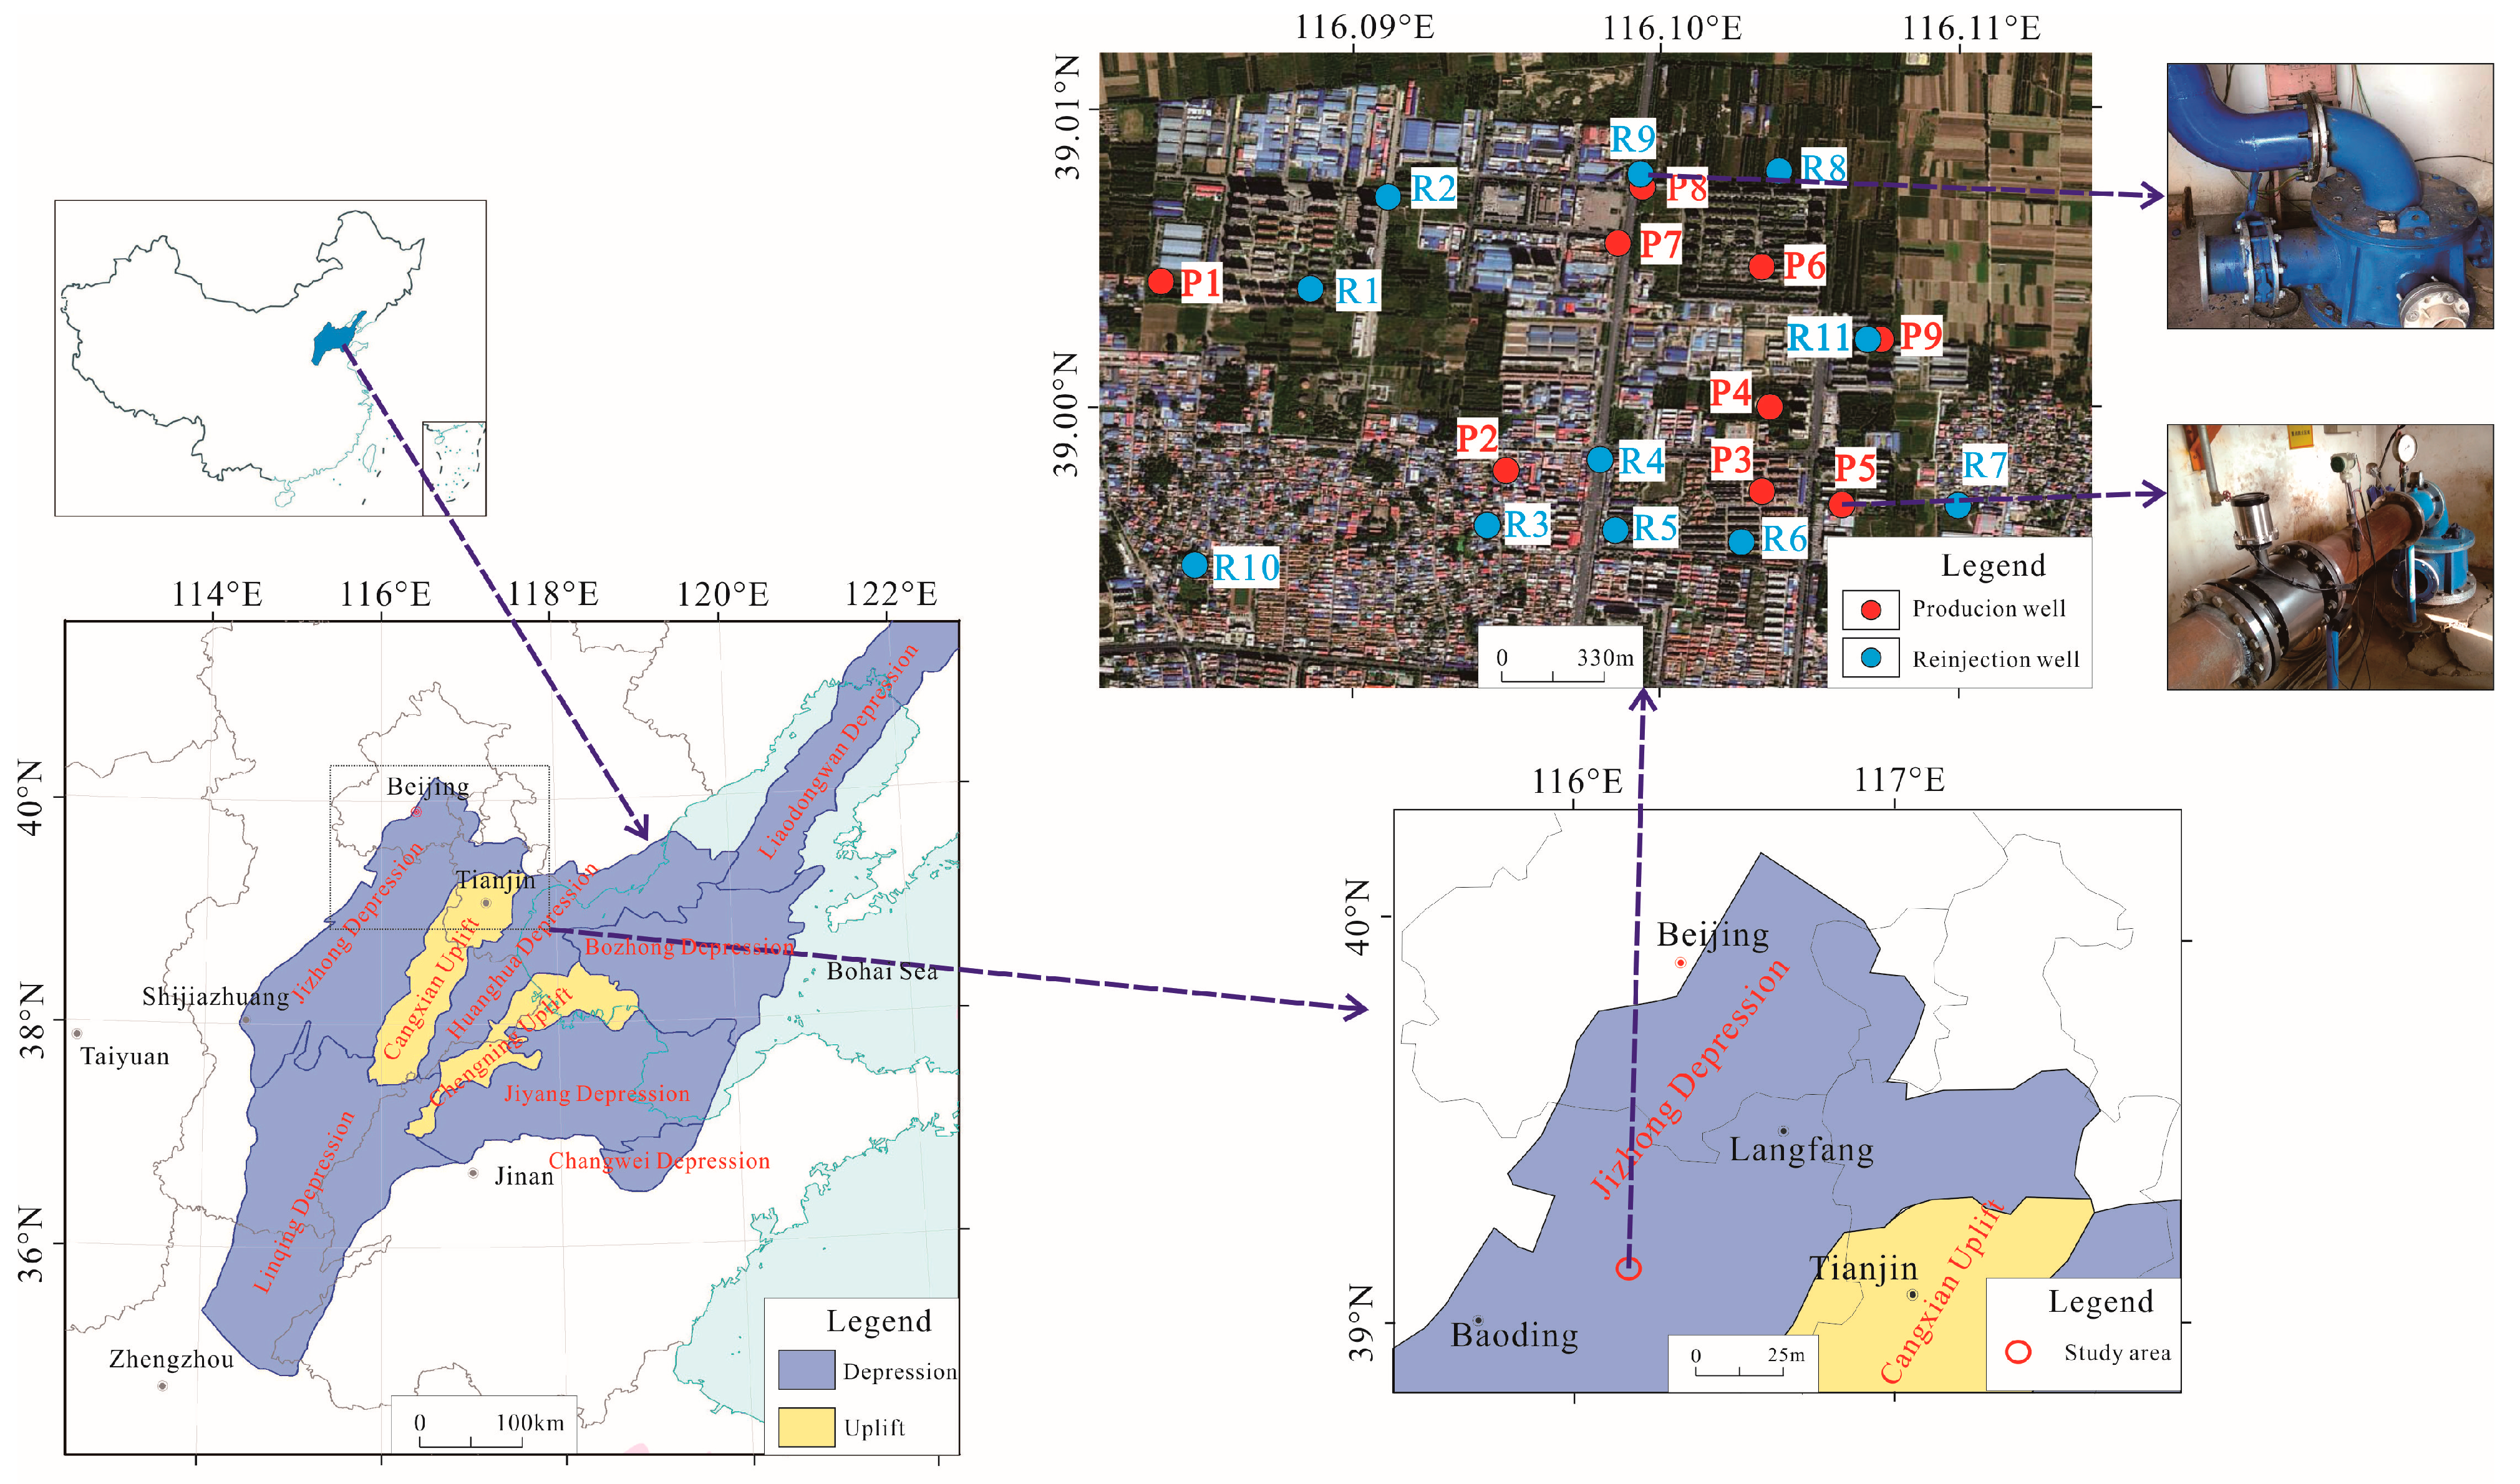
2.1. Location
2.2. Geological and Hydrogeological Background
3. Material and Methods
3.1. Coupling Software and Mathematical Model
- (1)
- Fluid flow
- (2)
- Porous matrix deformation
3.2. 3D Geological Model
3.3. Setting of Boundary Conditions and Initial Conditions
3.4. Experiment and Model Parameter Acquisition
4. Results and Discussion
4.1. Jxw Geothermal Reservoir
4.2. Nm Geothermal Reservoir
4.3. Analysis
5. Conclusions
Author Contributions
Funding
Institutional Review Board Statement
Informed Consent Statement
Data Availability Statement
Acknowledgments
Conflicts of Interest
References
- Liu, F.; Fu, P.; Mellors, R.J.; Plummer, M.A.; Ali, S.T.; Reinisch, E.C.; Liu, Q.; Feigl, K.L. Inferring geothermal reservoir processes at the Raft River geothermal field, Idaho, USA, through modeling InSAR-measured surface deformation. J. Geophys. Res. Solid Earth 2018, 123, 3645–3666. [Google Scholar] [CrossRef]
- Parks, M.; Sigmundsson, F.; Sigurðsson, Ó.; Hooper, A.; Hreinsdóttir, S.; Ófeigsson, B.; Michalczewska, K. Deformation due to geothermal exploitation at Reykjanes, Iceland. J. Volcanol. Geoth. Res. 2018, 391, 106438. [Google Scholar] [CrossRef]
- Duan, Z.; Pang, Z.; Wang, X. Sustainability evaluation of limestone geothermal reservoirs with extended production histories in Beijing and Tianjin, China. Geothermics 2011, 40, 125–135. [Google Scholar] [CrossRef]
- Zhang, Y.; Xiang, W.; Liu, G.; Wang, X.; Zhang, R.; Zhang, X.; Tong, J.; Yuan, H.; Zhang, C. Geodetic imaging of ground deformation and reservoir parameters at the Yangbajing Geothermal Field, Tibet, China. Geophys. J. Int. 2023, 234, 379–394. [Google Scholar] [CrossRef]
- Li, Q.; Han, Y.; Liu, X.; Ansari, U.; Cheng, Y.; Yan, C. Hydrate as a by-product in CO2 leakage during the long-term sub-seabed sequestration and its role in preventing further leakage. Environ. Sci. Pollut. R. 2022, 29, 77737–77754. [Google Scholar] [CrossRef] [PubMed]
- Li, Q.; Wu, J. Factors affecting the lower limit of the safe mud weight window for drilling operation in hydrate-bearing sediments in the Northern South China Sea. Geomech. Geophys. Geo-Energy Geo-Resour. 2022, 8, 82. [Google Scholar] [CrossRef]
- Ma, F.; Wang, G.; Zhang, W.; Zhu, X.; Zhang, H.; Sun, Z. Study on the influence mechanism of the ancient buried hill geothermal exploitation on land subsidence. Geol. China 2021, 48, 40–51. [Google Scholar]
- Montanari, D.; Minissale, A.; Doveri, M.; Gola, G.; Trumpy, E.; Santilano, A.; Manzella, A. Geothermal resources within carbonate reservoirs in western Sicily (Italy): A review. Earth-Sci. Rev. 2017, 169, 180–201. [Google Scholar] [CrossRef]
- Goldscheider, N.; Mádl-Szőnyi, J.; Erőss, A.; Schill, E. Review: Thermal water resources in carbonate rock aquifers. Hydrogeol. J. 2010, 18, 1303–1318. [Google Scholar] [CrossRef]
- Pang, Z.; Kong, Y.; Pang, J.; Hu, S.; Wang, J. Geothermal resources and development in Xiongan New Area. Bull. Chin. Acad. Sci. 2017, 32, 1224–1230. [Google Scholar]
- Wang, G.; Lin, W. Main hydro-geothermal systems and their genetic models in China. Acta Geol. Sin. 2020, 94, 1923–1937. [Google Scholar]
- Kong, Y.; Pang, Z.; Pang, J.; Wang, Y.; Yang, F. Stable isotopes of deep groundwater in the Xiongxian geothermal field. Procedia Earth Planet. Sci. 2017, 17, 512–515. [Google Scholar] [CrossRef]
- Kong, Y.; Pang, Z.; Pang, J.; Li, J.; Lyu, M.; Pan, S. Fault-affected fluid circulation revealed by hydrochemistry and isotopes in a large-scale utilized geothermal reservoir. Geofluids 2020, 2020, 2604025. [Google Scholar] [CrossRef]
- Yao, Y.; Jia, X.; Li, S.; Zhang, J.; Song, J.; Yang, T.; Yue, D. Heat flow determination of Archean strata under the karst thermal reservoir of D01 well in Xiong’an New Area. Geol. China 2022, 49, 1723–1731. [Google Scholar]
- Kong, Y.; Pang, Z.; Shao, H.; Hu, S.; Kolditz, O. Recent studies on hydrothermal systems in China: A review. Geotherm. Energy 2014, 2, 19. [Google Scholar] [CrossRef]
- Yue, G.; Wang, G.; Ma, F.; Zhang, W.; Yang, Z. The thermal state and geothermal energy accumulation mechanism in the Xiong’an New Area, China. Energ. Explor. Exploit. 2019, 37, 1039–1052. [Google Scholar]
- Wang, Z.; Zhang, C.; Jiang, G.; Wang, Y.; Hu, S. Effect of different exploitation schemes on production performance from the carbonate reservoir: A case study in Xiong’an new area. J. Clean. Prod. 2021, 314, 128050. [Google Scholar] [CrossRef]
- Liu, H.; Wang, H.; Lei, H.; Zhang, L.; Bai, M.; Zhou, L. Numerical modeling of thermal breakthrough induced by geothermal production in fractured granite. J. Rock Mech. Geotech. Eng. 2020, 12, 900–916. [Google Scholar] [CrossRef]
- Bai, L. Experimental Analysis of Rock Biot Coefficient and Engineering Application of Geological Disposal of Carbon Dioxide. Master’s Thesis, Jilin University, Changchun, China, 2016. [Google Scholar]
- Li, Y.; Zhang, B.; Xing, Y.; Wang, G. Fragmentation law of carbonate rocks under different confining pressure in Gaoyuzhuang Formation, Gaoyang geothermal field, Xiong’an New Area. Geol. China 2021. Available online: https://kns.cnki.net/kcms/detail/11.1167.P.20210419.1328.006.html (accessed on 19 April 2021).
- Ma, S.; Wang, X.; Ma, X.; Cao, X. Experimental study on mechanical characters of Neogene weak cementation rock. Yellow River 2016, 38, 121–124. [Google Scholar]
- Li, H.; Xiao, G.; Yang, J.; Zhao, C.; Xiao, Y. Precise identification of land-subsiding layers and reconstruction of subsidence process in Tianjin Binhai New Area. Geol. Bull. China 2016, 35, 1646–1652. [Google Scholar]


| Well Type | Well Number | Well Depth (m) | Bottom Boundary Depth of Stratum (m) | Exposed Stratum Thickness (m) | ||||
|---|---|---|---|---|---|---|---|---|
| Q | Nm | Jxw | Q | Nm | Jxw | |||
| Producing well | P1 | 1580 | 364.52 | 850 | 1580 | 364.52 | 485.48 | 730 |
| P2 | 1301 | 390.3 | 990 | 1301 | 390.3 | 599.7 | 311 | |
| P3 | 1286 | 312.5 | 1042 | 1286 | 312.5 | 729.5 | 244 | |
| P4 | 1600 | 402 | 1070 | 1600 | 402 | 668 | 530 | |
| P5 | 1506.4 | 405 | 1072 | 1506.4 | 405 | 667 | 434.4 | |
| P6 | 1250 | 397.7 | 1065 | 1250 | 397.7 | 667.3 | 185 | |
| P7 | 1506 | 305.3 | 930.43 | 1506 | 305.3 | 625.13 | 575.57 | |
| P8 | 1693.5 | 322 | 931 | 1693.5 | 322 | 609 | 762.5 | |
| P9 | 1500 | 405 | 1052 | 1500 | 405 | 647 | 448 | |
| Reinjection well | R1 | 1068.93 | 332.5 | 932.3 | 1068.93 | 332.5 | 599.8 | 136.63 |
| R2 | 1500 | 299.9 | 990.35 | 1500 | 299.9 | 690.45 | 509.65 | |
| R3 | 1028 | 400 | 999 | 1028 | 400 | 599 | 29 | |
| R4 | 1070 | 390.5 | 1011 | 1070 | 390.5 | 620.5 | 59 | |
| R5 | 1201.8 | 392 | 1030 | 1201.8 | 392 | 638 | 171.8 | |
| R6 | 1284.57 | 398.5 | 1085 | 1284.57 | 398.5 | 686.5 | 199.57 | |
| R7 | 1501.01 | 398 | 1043.2 | 1501.01 | 398 | 645.2 | 457.81 | |
| R8 | 1500 | 419.44 | 992.11 | 1500 | 419.44 | 572.67 | 507.89 | |
| R9 | 1506 | 318.5 | 948.05 | 1506 | 318.5 | 629.55 | 557.95 | |
| R10 | 1500 | 425.25 | 980.26 | 1500 | 425.25 | 555.01 | 519.74 | |
| R11 | 1717.54 | 403.69 | 1268.3 | 1717.54 | 403.69 | 864.61 | 449.24 | |
| Geothermal Well | Exposed Thickness (m) | Reservoir Thickness Ratio (%) | Crack Rate (%) | Permeability (mD) | Water Flow Rate (m3/h) | Water Flow Rate per Unit Thickness (m3/(h·m)) | Water Temperature (°C) |
|---|---|---|---|---|---|---|---|
| P4 well | 172.89 | 32.62 | 4.89 | 2.2 | 135.6 | 20.67 | 65 |
| Rock Mechanical Parameters | Sample 1 | Sample 2 | Sample 3 | Sample 4 | Sample 5 | Sample 6 |
|---|---|---|---|---|---|---|
| Confining pressure (MPa) | 5.0 | 10.0 | 15.0 | 2.481 | 7.501 | 20 |
| Compressive strength (MPa) | 342.615 | 380.962 | 412.960 | 341.753 | 428.439 | 507.428 |
| Elastic modulus (GPa) | 49.784 | 46.951 | 51.137 | 47.111 | 52.793 | 53.837 |
| Stratum | Density (kg/m3) | Elastic Modulus (MPa) | Poisson’s Ratio | Biot Coefficient | Porosity | Permeability (mD) |
|---|---|---|---|---|---|---|
| Q | 2000 | 500 | 0.35 | — | — | — |
| Nm | 2300 | 1500 | 0.3 | 0.8 | 0.1 | 1 |
| Jxw-1 | 2600 | 20,000 | 0.27 | 0.6 | 0.05 | 2.2 |
| Jxw-2 | 2800 | 50,000 | 0.25 | — | — | — |
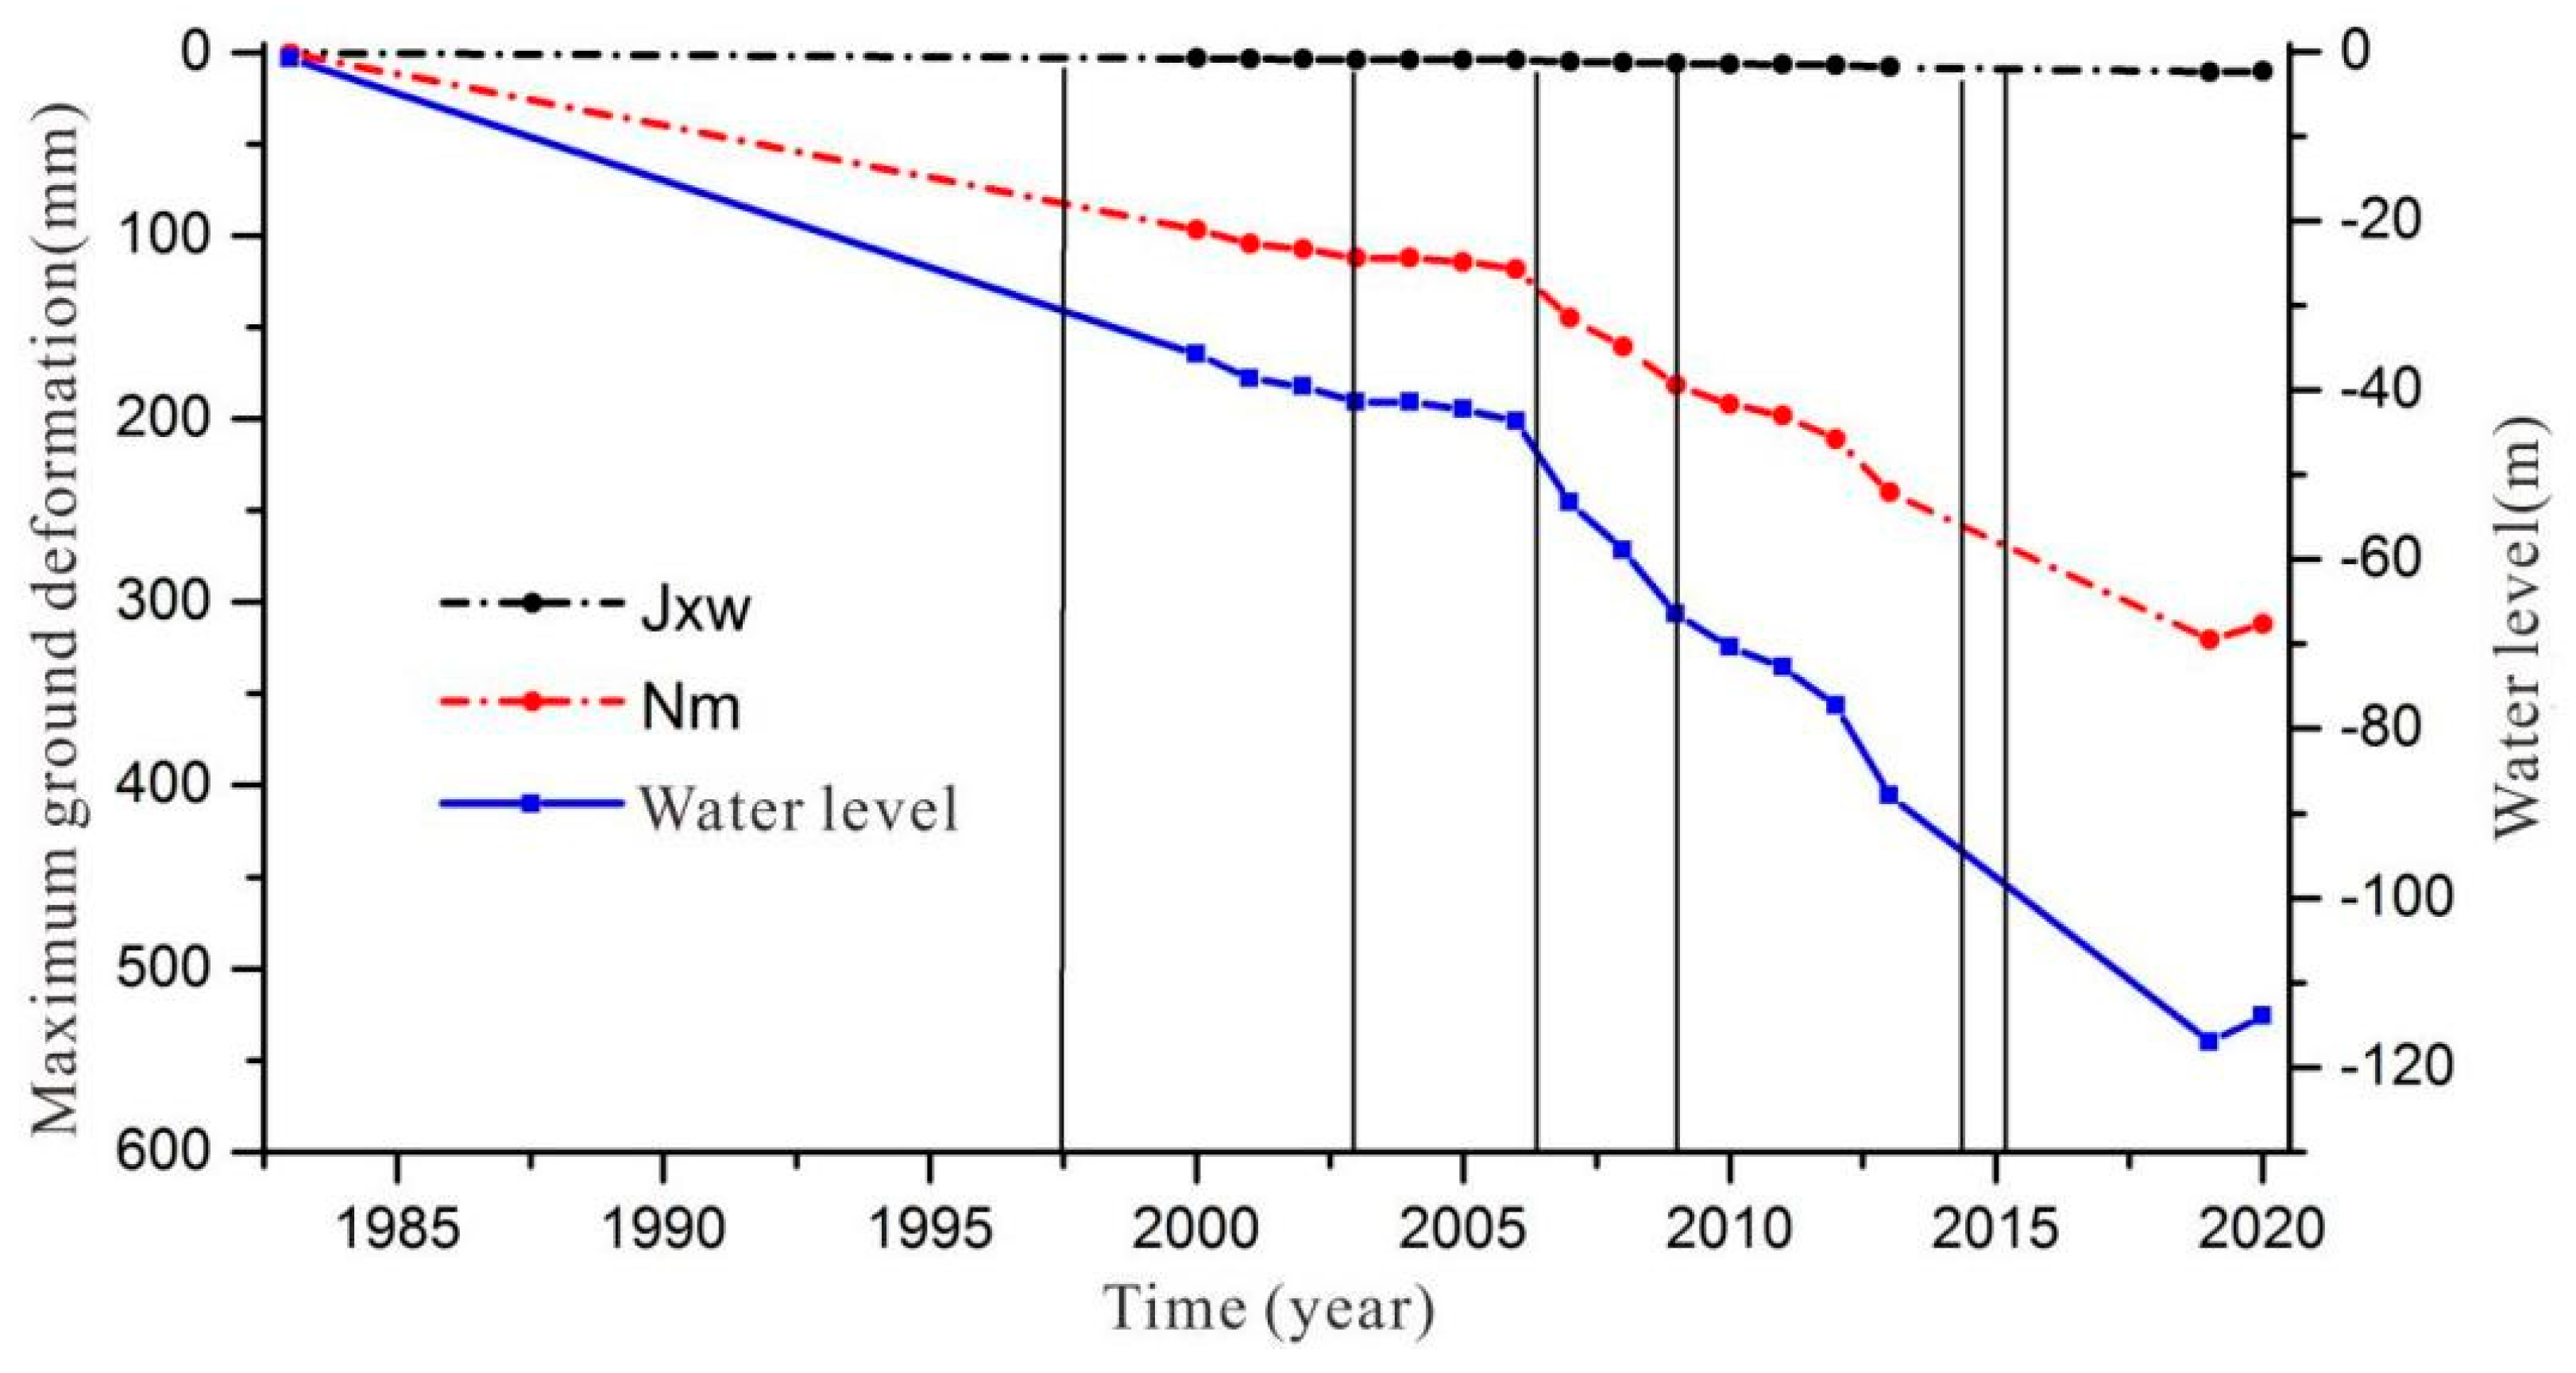
| Number | Year | Water Level (m) | Drawdown (m) | Maximum Ground Subsidence Caused by Water Level Drop (mm) | Annual Average Value of Maximum Ground Subsidence Caused by Water Level Drop (mm/a) | ||
|---|---|---|---|---|---|---|---|
| Jxw | Nm | Jxw | Nm | ||||
| 1 | 1983 | −0.75 | 0 | 0 | 0 | ||
| 2 | 2000 | −35.8 | 35.05 | 3.2 | 96.8 | 0.12 (2000–2006) | 3.6 (2000–2006) |
| 3 | 2001 | −38.6 | 37.85 | 3.4 | 104.5 | ||
| 4 | 2002 | −39.6 | 38.85 | 3.5 | 107.3 | ||
| 5 | 2003 | −41.4 | 40.65 | 3.7 | 112.2 | ||
| 6 | 2004 | −41.4 | 40.65 | 3.7 | 112.2 | ||
| 7 | 2005 | −42.2 | 41.45 | 3.8 | 114.4 | ||
| 8 | 2006 | −43.7 | 42.95 | 3.9 | 118.3 | ||
| 9 | 2007 | −53.3 | 52.55 | 4.7 | 145.2 | 0.6 (2006–2010) | 18.4 (2006–2010) |
| 10 | 2008 | −58.9 | 58.15 | 5.3 | 160.6 | ||
| 11 | 2009 | −66.5 | 65.75 | 5.9 | 181.5 | ||
| 12 | 2010 | −70.4 | 69.65 | 6.3 | 191.9 | ||
| 13 | 2011 | −72.7 | 71.95 | 6.5 | 198.5 | 0.53 (2010–2013) | 16.1 (2010–2013) |
| 14 | 2012 | −77.3 | 76.55 | 6.9 | 211.1 | ||
| 15 | 2013 | −87.9 | 87.15 | 7.9 | 240.3 | ||
| 16 | 2019 | −117.0 | 116.25 | 10.5 | 320.5 | −0.3 (2019–2020) | −8.3 (2019–2020) |
| 17 | 2020 | −114.0 | 113.25 | 10.2 | 312.2 | ||
Disclaimer/Publisher’s Note: The statements, opinions and data contained in all publications are solely those of the individual author(s) and contributor(s) and not of MDPI and/or the editor(s). MDPI and/or the editor(s) disclaim responsibility for any injury to people or property resulting from any ideas, methods, instructions or products referred to in the content. |
© 2023 by the authors. Licensee MDPI, Basel, Switzerland. This article is an open access article distributed under the terms and conditions of the Creative Commons Attribution (CC BY) license (https://creativecommons.org/licenses/by/4.0/).
Share and Cite
Yao, Y.; Li, S.; Jia, X.; Song, J.; Yue, D.; Zhang, Q.; Xiang, H. Numerical Simulation of Ground Subsidence Response Conditional on Geothermal Exploitation in a Karst Reservoir Area of North China. Sustainability 2023, 15, 8089. https://doi.org/10.3390/su15108089
Yao Y, Li S, Jia X, Song J, Yue D, Zhang Q, Xiang H. Numerical Simulation of Ground Subsidence Response Conditional on Geothermal Exploitation in a Karst Reservoir Area of North China. Sustainability. 2023; 15(10):8089. https://doi.org/10.3390/su15108089
Chicago/Turabian StyleYao, Yahui, Shengtao Li, Xiaofeng Jia, Jian Song, Dongdong Yue, Qiuxia Zhang, and Hong Xiang. 2023. "Numerical Simulation of Ground Subsidence Response Conditional on Geothermal Exploitation in a Karst Reservoir Area of North China" Sustainability 15, no. 10: 8089. https://doi.org/10.3390/su15108089