Article

The Effect of Social Capital and Organizational Health on Competitive Advantages of Culinary and Craft SMEs in Samarinda City

Department of Management, Master of Science in Management Study Program, Faculty of Economics and Business, Padjadjaran University, Bandung 40115, Indonesia
*
Author to whom correspondence should be addressed.
Sustainability 2023, 15(10), 7945; https://doi.org/10.3390/su15107945
Submission received: 6 March 2023 / Revised: 23 April 2023 / Accepted: 3 May 2023 / Published: 12 May 2023
(This article belongs to the Special Issue SMEs, Entrepreneurial Firms and Sustainability: Theory and Practice)

Abstract

:
Samarinda City was appointed as a buffer for the new capital city of Indonesia through culinary and craft SMEs. Culinary and craft SMEs are believed to be the drivers in accelerating the achievement of Sustainable Development Goals (SDG), which are part of the strategy of the Provincial Government of East Kalimantan. Even so, 72% of the problems culinary and craft SMEs face in Samarinda City are related to competitive advantages. Culinary and craft SMEs in Samarinda City are still constrained by competitive disadvantage, especially in the non-substitutable resource aspect. This study aimed to analyze the effect of organizational capital and health on competitive advantage, especially in the era of post-COVID-19 economic recovery through the creative economy. This study used a survey method with a quantitative approach. The analysis techniques used were descriptive analysis and factor analysis using structural equation modeling with item parceling. The subjects of this study were SMEs in the culinary and craft sub-sector in Samarinda City (N = 365 SMEs). This study found that social capital and organizational health positively and significantly affect competitive advantage, both partially and simultaneously. Surprisingly, the dimension of work culture and climate s not suitable for modeling the impact of social capital and organizational health on the competitive advantage of culinary and craft SMEs in Samarinda City. This research is expected to contribute theoretically to developing a new model to achieve optimal competitive advantage through social capital and health organizations. This research is expected to strengthen the people’s economy to achieve SDGs through SMEs, especially for Samarinda City, a buffer for the new capital city of the Republic of Indonesia and post-COVID-19 economic recovery through the creative economy.

1. Introduction

The 74th United Nations General Assembly resolution stipulated 2021 as the International Creative Economy Year for Sustainable Development. The creative economy is believed to be an effective solution that can be reached by the community in the framework of economic recovery in this decade, especially during the post-Covid19 pandemic. The creative economy is one of the fastest-growing sectors in the global economy and has a positive impact on regional and state income growth, opens access to new jobs, and increases national foreign exchange in the context of economic recovery [1,2,3]. Judging from the benefits from the economic aspect, the creative economy through small and medium enterprises (SMEs) opens more expansive opportunities for all countries to increase their regional income, which has implications for accelerating the achievement of the sustainable development goals (SDGs) [3]. SMEs play a critical role in SDGs because SMEs contribute up to 45% of total employment and up to 33% of gross domestic product (GDP) in developing market economies [1,4].
East Kalimantan is one of the locations in the spotlight as the location of the SDGs in Indonesia [5]. Especially in 2019, East Kalimantan was appointed by the Indonesia Government as the location for the new capital of Indonesia [6]. The new capital is planned to be located in parts of North Penajam Paser Regency and Kutai Kartanegara Regency. Samarinda City was appointed as a support for the new capital and a partner in the creative economy [7] sector through SMEs [2]. Preliminary interviews were conducted with the Samarinda City Government Office of Industry, Cooperatives, and SMEs to visualize the potential of Samarinda City through SMEs, especially after the appointment of Samarinda City as a buffer for Indonesia’s new capital. Samarinda City Government is trying to accelerate development in the creative economy sector through SMEs. This acceleration is based on the policy direction of the East Kalimantan Provincial Government in developing the economy based on the SDGs, which emphasizes community economic development in the creative economy sector and does not depend on the oil, gas, and coal sectors. Currently, the number of creative economy SMEs in the culinary sector is 1084 units, and 104 units in crafts [8].
Preliminary interviews were conducted with the Samarinda City and East Kalimantan Government of Industry, Cooperatives, and SMEs to examine the problems culinary and craft SMEs faced in Samarinda City. The problem faced by 80% of culinary and craft SMEs in Samarinda City has to do with competitive advantage. Competitive advantage is a condition that allows an organization, including an SME, to carry out its operational and business activities with higher quality or more efficiency than its competitors [9,10,11]. One foundation of competitive advantage is understanding the resources owned by an organization such as a company. Another foundation of competitive advantage is using a resource-based view (RBV) with unique characteristics, such as the four pillars of VRIN, interpreted as valuable, rare, inimitable, and non-substitutable, possessed by an organization that has a competitive advantage [11,12]. Previous works in the literature stated that testing competitive advantage in RBV with the dominant VRIN framework was carried out in large-scale organizations [11,13,14,15,16,17]. Therefore, it is necessary to test competitive advantage more specifically in small-scale companies such as SMEs [13,14,17]. In addition, testing competitive advantage cannot be generalized because each region has different challenges, such as social challenges, especially in developing countries [18]. It further strengthens the opening of new opportunities for research related to the competitive advantages of culinary and craft SMEs in Samarinda City.
Based on this explanation, a preliminary survey was carried out to gain an overview of the competitive advantages of the culinary and craft SMEs in Samarinda City. The preliminary survey involved 60 culinary and craft SMEs in Samarinda City. The items in the preliminary survey were adopted from previous studies and adapted to the construct and research subjects [19]. Most culinary and craft SMEs in Samarinda City still do not optimally utilize resources properly. The preliminary survey indicated that 72% of culinary and craft SMEs in Samarinda City still do not have an optimal competitive advantage. Almost every culinary and craft SME in Samarinda City has problems in every aspect of competitive advantage. Culinary and craft SMEs in Samarinda City still have not achieved the target of ownership of competitive advantage, which is above 80% as set by the Office of Industry, Cooperative, and SMEs of the Samarinda City Government. The low percentage of ownership among culinary and craft SMEs in Samarinda City causes the need to increase the competitive advantage of SMEs immediately. Differences in the results of the preliminary survey with the information provided by relevant government sources are thought to be influenced by time. A report was submitted by the relevant government in 2021, while the preliminary survey was conducted in 2022. This indicated an increase in the competitive advantage of culinary and craft SMEs in Samarinda City.
Based on the explanation above, some factors are needed to achieve an optimal competitive advantage, especially for culinary and craft SMEs in Samarinda City. Organizational health is one factor that affects competitive advantage [19,20]. Organizational health was chosen as a factor to establish the competitive advantage in SMEs because organizational health is of low cost [21] which can still be afforded by SMEs with a small portfolio and a flat organizational structure [22]. Analysis of organizational health related to competitive advantage is very urgent given the state of the economy, which is still recovering from the COVID-19 pandemic [2] and making efforts at the the local government level to accelerate achievement of the sustainable development goals [5]. SMEs need factors that are low-cost and easy to implement. Organizational health refers to an organization’s ability to carry out internal alignment, execute strategy, and renew the organization [23]. Organizational health has an essential role in competitive advantage [21]. Implicitly, organizational health that focuses on internal alignment, implementation quality, and coordination and control contributes to competitive advantage because organizational health’s three main focus points are generally related to human resource practices [20]. There is still a lack of research discussing organizational health [19], especially among SMEs in Asia that tend to have a flat portfolio and organizational structure, so the situation is very dilemmatic regarding the role and use of human resources [22]. Hence, further research is needed regarding organizational health in small-scale organizations such as SMEs.
The preliminary survey was carried out to gain an overview of the organizational health of culinary and craft SMEs in Samarinda City. The items in the preliminary survey were adopted from previous studies and adapted to the construct and research subjects. The preliminary survey adopted a pre-existing survey that was then adjusted to the conditions of SMEs by looking at the construct of the definition of organizational health [19]. Each dimension contains a construct that is briefly applied to identify the organizational health problems of culinary and craft SMEs in Samarinda City on the surface.
The preliminary survey regarding the organizational health of the culinary and craft SMEs in Samarinda City indicated that it was not optimal and sufficient. Among culinary and craft SMEs, 76.7% are still unaware of the importance of organizational health, indicating that these SMEs still do not have organizational health in the elite category. The culinary and craft SMEs in Samarinda City are still vulnerable because they have not been able to execute strategies, especially in coordination and control. In addition, the ability to update the organization, especially in external orientation, such as paying attention to customer satisfaction and responsiveness to competitors, is still meager and not optimal.
Organizations, including SMEs, still rarely think about organizational health because various factors influence it. One of them is social support [24,25]. Social support for an organization implicitly provides a function of building a healthy organization, which is a form of social capital [24]. Social capital is defined as actual and potential resources embedded in, available through, and derived from a network of relationships owned by individuals or social units consisting of three dimensions: relational, structural, and cognitive [26]. Social capital is urgently needed for SMEs seeking to establish a competitive advantage in today’s complex and dynamic business environment mainly because of the effects of the COVID-19 pandemic [27]. By building solid relationships with their stakeholders, SMEs can establish competitive advantage in a VRIN framework that can help them grow and succeed [28]. Several previous empirical studies have measured social capital based on structural dimensions through the form or type of network [29,30]. Still, other empirical research shows that the three dimensions have the essence of influence that should be considered [31,32,33,34]. In the context of SMEs in Samarinda City, social capital is interpreted as a partnership originating from a network of relationships owned by individuals or social units. The low social capital of the culinary and craft SMEs in Samarinda City is highlighted by the only 16.5%, or around 196 out of 1188, SMEs that have social capital through network engagement through partnerships. Only about 17% of the 196 SMEs in culinary and craft sectors have earned trust and commitment to sustainably developing SMEs in Samarinda City. SMEs’ coaching is a continuous process, where the coaching results cannot be seen quickly. The government’s development of SMEs has been inconsistent, so it cannot create the optimal returns that SMEs should be able to achieve [8].
Based on the data above, it can be said that there is no longer any reason for Samarinda City to increase its competitive advantage [8] through social capital and organizational health. The urgency of this research emphasizes that culinary and craft SMEs in Samarinda City need to immediately improve their competitive advantage because Samarinda City’s task is to support the new capital city of the Republic of Indonesia through SMEs as the buffer zone of the community’s economy. In addition, East Kalimantan is highlighted as a location for sustainable development goals [5] to make the provincial capital immediately improve and increase its leading creative economic sector commodities [3,6].
The limited literature in this field is underlined by the fact that there is still no specific literature related to competitive advantage, organizational health, and social capital in Samarinda City, both in the form of related official reports and empirical research. Meanwhile, several empirical studies conducted abroad show that organizational health positively influences the organization’s competitive advantage. In addition, empirical research about competitive advantage and organizational health in small organizations such as SMEs is rare [11,13,14,16,17,19], especially in Asia [20]. Research related to social capital on competitive advantage is still incomplete. It is because competitive advantage cannot be generalized from one region to another. After all, each region has social challenges, especially regions in developing countries [35].
This research aimed to study and analyze the social capital, organizational health, and competitive advantage of culinary and craft SMEs in Samarinda City. The results showed that social capital and organizational health positively affect the competitive advantage of culinary and craft SMEs in Samarinda City simultaneously and partially. The contributions of this research consist of theoretical and practical contributions. The theoretical contribution of this research is the discovery of modeling to achieve a competitive advantage for culinary and craft SMEs in Samarinda City. It has implications for accelerating the achievement of competitive advantage for culinary and craft SMEs in Samarinda City when Samarinda City must become a buffer for the new capital of the Republic of Indonesia through the people’s economy and realizing sustainable development goals through the creative economy.

2. Theoretical Framework
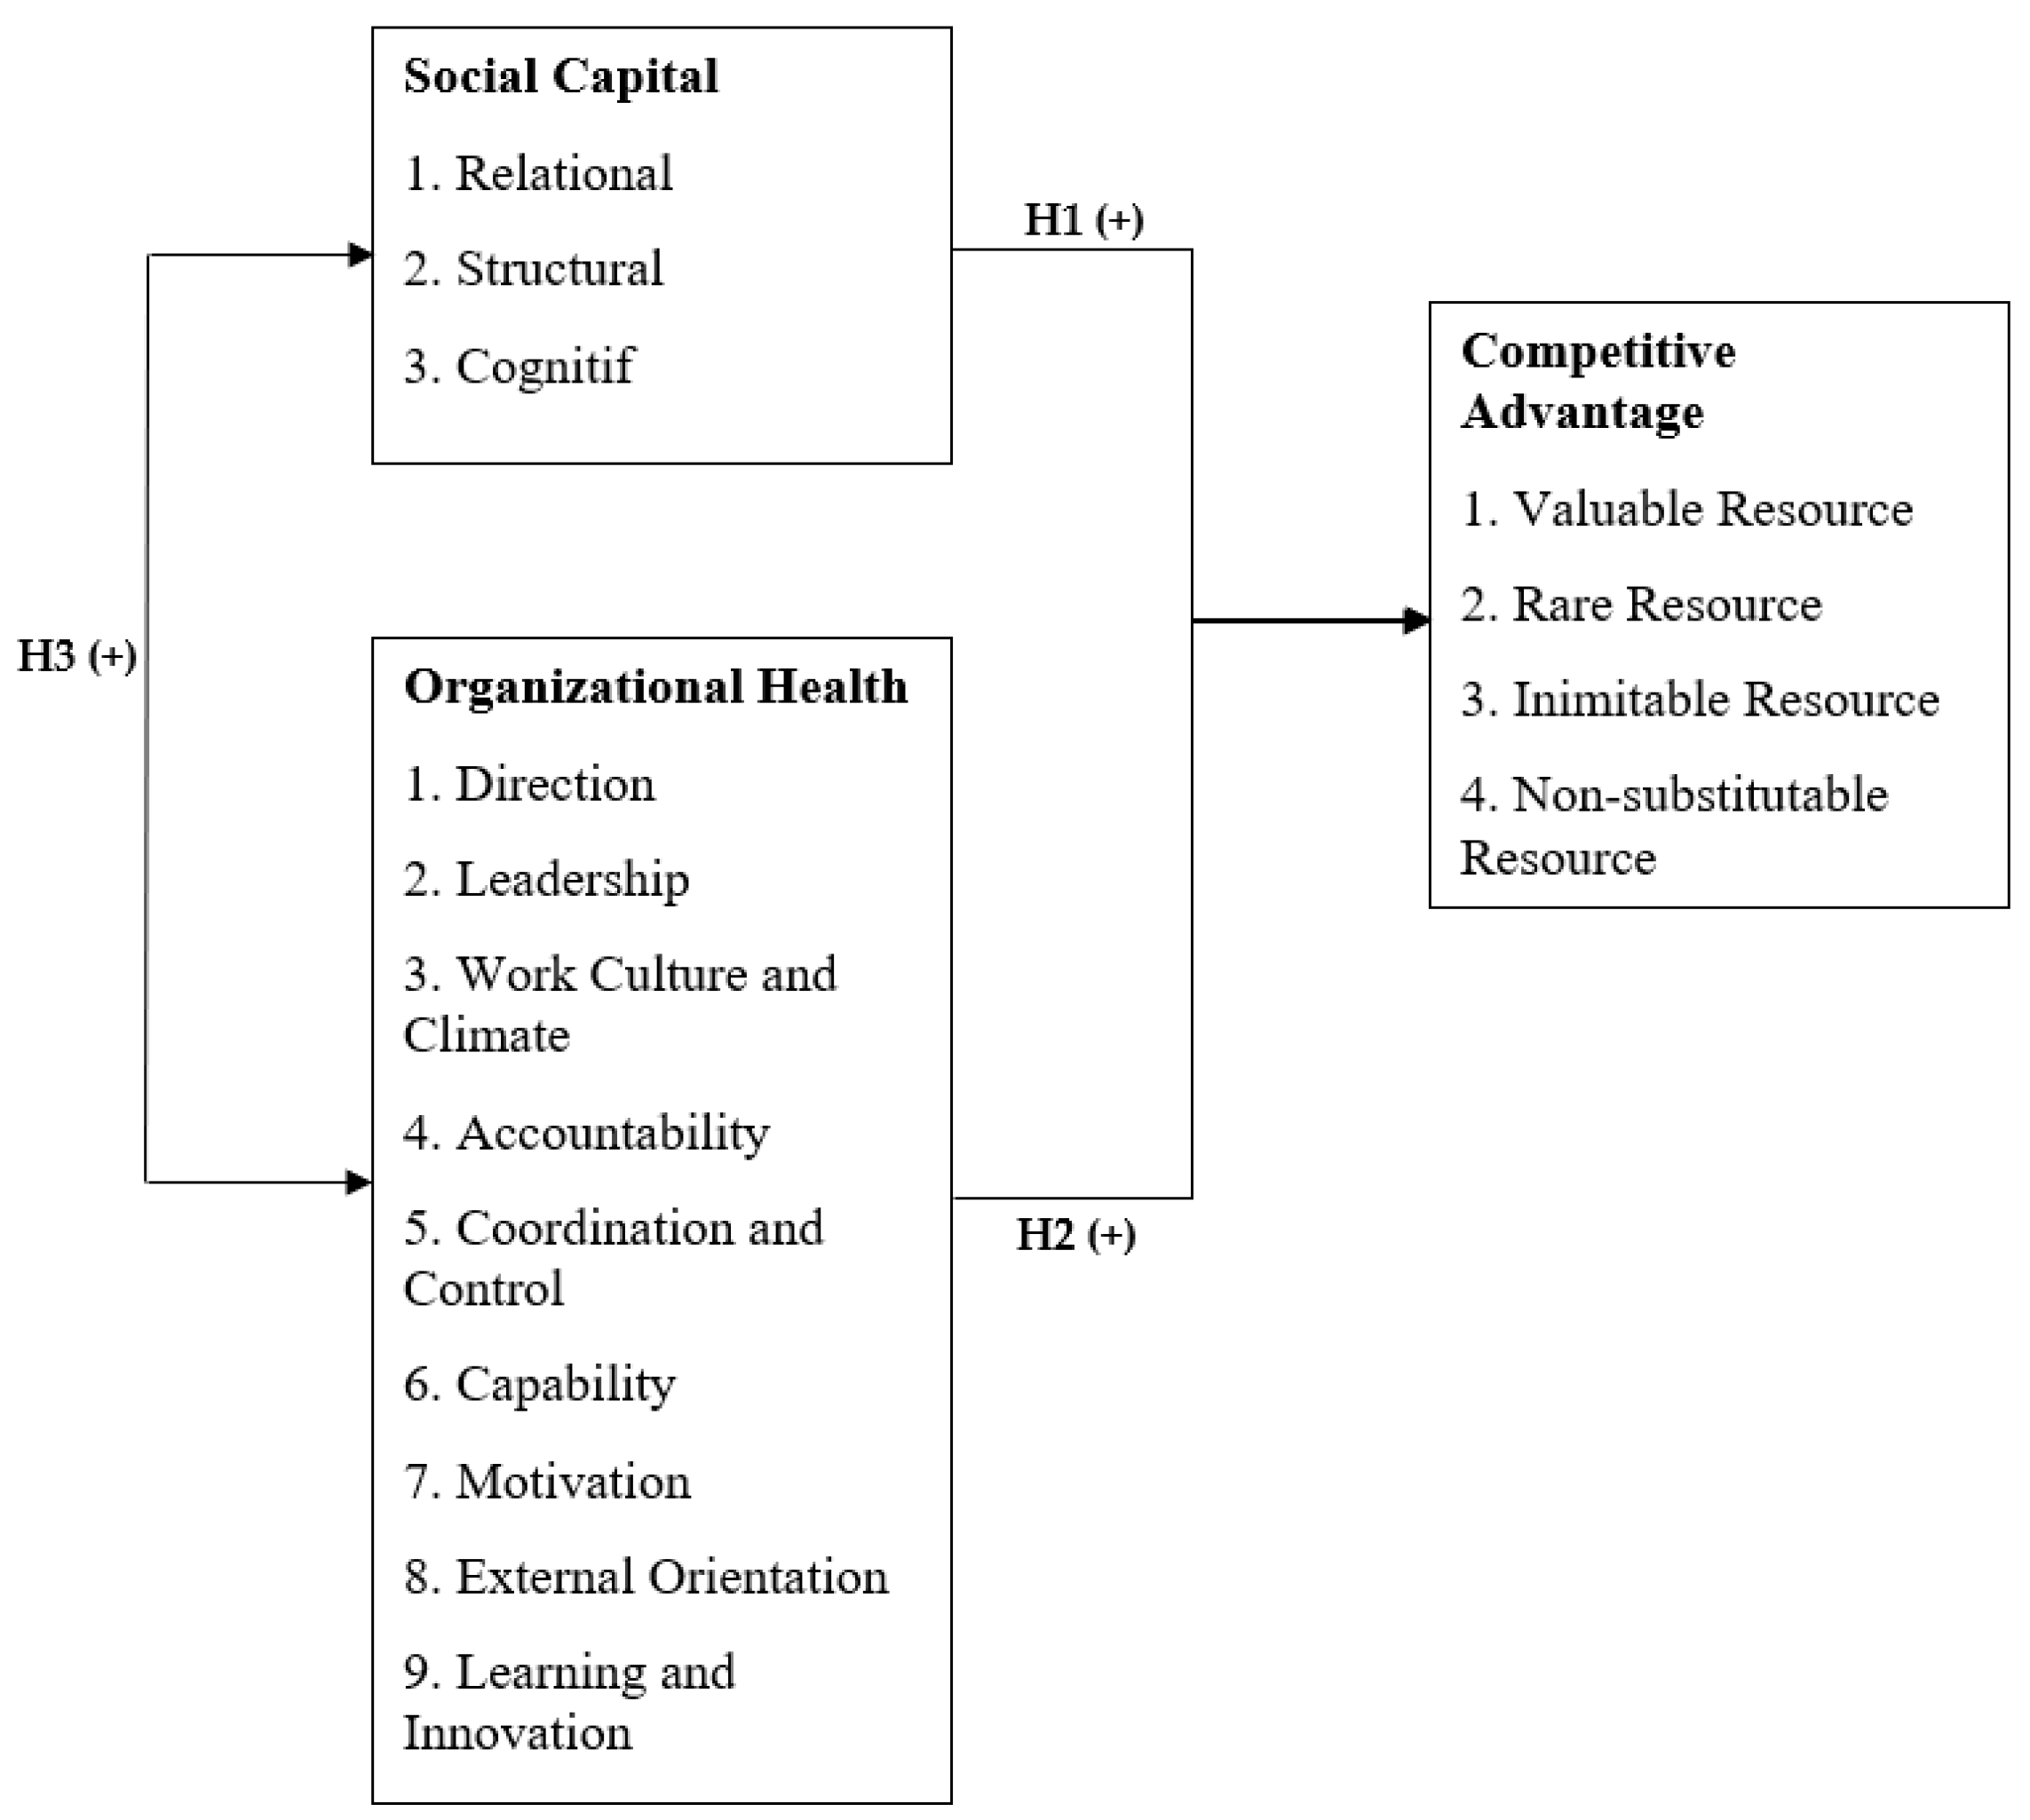
The theory that underlies this research is a classical theory that states that competitive advantage is influenced by social capital [26,35] and organizational health [23]. Nevertheless, the latest empirical research has also shown that competitive advantage is influenced by social capital [28,31,34,36,37,38] and organizational health [19,20,21,37] separately. Social capital affects competitive advantage by opening access to a resource that is valuable, rare, inimitable, and non-substitutable [28,35]. Not only social capital but competitive advantage is also influenced by organizational health [19,20,21,37]. Organizational health affects competitive advantage because the three main points of organizational health are internal alignment, execution, and renewal or improvement relating to human resource management in the internal organization [19,20]. It also allows organizations to grow and improve quickly [21].

2.1. Social Capital

Social capital is a broad and complex term related to social resources, relationships, network influences, and supporting systems that form partnerships [30]. Social capital is defined as the amount of the actual and potential resources embedded in, available through, and originating from the network of relationships owned by individuals or social units [29]. Social capital exceeds physical and human capital [29].
According to the previous literature, social capital must be analyzed using three dimensions. These dimensions are relational, structural, and cognitive dimensions [26]. The relational dimension is related to the characteristics of personal relationships developed by the owner or manager or company through the history of their interactions in building partnerships that give rise to reciprocal relations between one party and another party in their social interaction [31]. The primary indicators of this dimension are trust and mutual relationship, which refers to the company’s belief that other actors in the network will not act opportunistically [26,35].
The structural dimension refers to the network of partnership relationships owned by the company, which aims to include social interactions produced in the network, focusing on the properties of the social system and the network of relationships as a whole [26]. The central aspect is the network density and the strength of each relationship [31]. Network density consists of bonding social capital, bridging social capital, and linking social capital [26].
Bonding social capital is a close and intimate relationship in a smaller social circle, including relationships with friends, family, and other relatives. It is considered adequate as a social and emotional resource [30,39], in contrast to bridging social capital, where the bond or relationship is weaker because it involves heterogeneous social groups. Bridging social capital relates to individuals and groups of various similarities between people not necessarily known personally. It is primarily associated with more significant corporations and organizations [39]. Bridging social capital is essential for economic progress regarding financial assistance [40] and education to transfer knowledge for empowering human resources [41]. Linking social capital refers to the norms of respect. According to mutual trust, the network of relations on social capital connects people who interact throughout the gradient of power or explicit, formal, or institutionalized authority in society. Thus, linking social capital demands the ability of individuals or groups to interact with groups who do not have great similarities in the sociodemographic sense. Linking social capital refers to the type of weak bond that allows the use of resources, ideas, and information from formal institutions outside the community (for example, government institutions, research centers, and banks) and connects to open networks [29].
The third dimension of social capital is the cognitive dimension. The cognitive dimension is related to resources that provide mutual representation, interpretation, and meaning systems among parties in the partnership network. The cognitive dimension in social capital can be seen through the creation of values from the shared understanding between the organization in a network manifested through a common goal to produce a shared culture. The owner and manager, especially in SMEs, must complete their trust, common goals, and culture by exploring new relationships with agents outside their current networks [31].
Based on the explanation above, it can be seen that in the context of SMEs, the term social capital has more familiarity with the term “partnership”. This study analyzes social capital using the theory of Nahapiet and Ghoshal (1998) as a grand theory and is developed and adapted to existing research. This research produces social capital in SME construction as resources in the social environment initially formed through reciprocal relationships that create trust between parties as a partnership. The forms of social capital are bonding social capital, bridging social capital, and linking social capital, which produces a shared understanding between parties in the network manifested as a common goal and culture. The ownership of SME social capital is characterized by three dimensions, namely relational, measured through reciprocal relationships and trust, then the structural dimension, which looks at the form of social capital, and cognitive, which is measured through understanding and is manifested as shared goals and shared culture.
Social capital exceeds physical and human capital [42]. Social capital provides many benefits to an organization’s owner, drive, or manager through resources built into their relationship and can create a competitive advantage over their competitors [35]. The results of other, previous studies show that social capital is an essential variable because intellectual capital will be weak without social capital [38]. The same results are also shown in other studies stating that the accumulation of social capital owned in a company has a positive and significant indirect influence on the competitive advantage of a company [34]. Social capital development is a serious concern for SME owners and managers in the creative culture industry. It is because social capital is not only related to market sensitivity, but also because it is mainly related to the success of the company and survival in the creative culture sector [43].
Social capital can create competitive advantage directly and indirectly [34,38]. It is shown in previous studies stating that the accumulation of social capital owned in a company has a positive, significant, and indirect influence on competitive advantage in a company [34]. Social capital can create a competitive advantage through intellectual capital. Social capital is essential because intellectual capital will be weak without social capital [38].
Hypothesis 1 (H1). 
Social capital positively and significantly affects competitive advantage.

2.2. Organizational Health

Organizational health is defined as a form of culture, climate, and practice creating an environment that promotes employee health and safety [44]. Organizational health is also defined as a complete state of operation without obstacles from all formal, informal, primary, and auxiliary organizational processes [45]. In addition, the previous literature shows that a healthy organization is an organization that emphasizes and cares about the development of management processes and practices and recognizes the right to intervene in all systems throughout the organization, thus contributing to overall performance [25]. Another study states that organizational health is the ability of the organization to carry out alignment, execution, and renewal or improvement to show high performance in the long term [23].
Specific organizational health can be grouped into three clusters and nine dimensions. The first cluster is internal harmony, measured through a clear common goal between an organization and its employee. The dimensions of this cluster are direction, leadership, and culture and work climate. The direction dimension is measured through vision, clarity of strategy, and employee involvement. The leadership dimension is measured through authoritative leadership, consultative leadership, leadership support, and challenging leadership. At the same time, the dimension of work culture and climate is measured through openness, fair internal competition, operational discipline, and entrepreneurial creativity. The second cluster is the quality of implementation, consisting of four dimensions: accountability, coordination and control, capability, and motivation. Accountability is measured by clarifying roles, employee performance, compatibility of rewards with performance, and a sense of ownership. The dimension of coordination and control is measured by evaluating employee performance, operational management, financial management, and compliance with applicable regulations. Measurement of the capability dimension consists of talent acquisition, talent development, business process-based expertise, and the use of resources from outside parties. Even so, the indicators contained in social capital will overlap if all indicators in the capability dimension are used, especially with matters relating to third parties or outside parties. Because of this, in this study, the indicators of the capability dimension used are talent acquisition and talent development. The motivational dimension is measured through inspirational leaders, career opportunities, and financial incentives. The third cluster is the renewal capacity, consisting of two dimensions: external orientation and learning through innovation. The external orientation dimension can be measured by focusing on customer satisfaction and competitive insight. The dimension of learning through innovation is measured through top-down innovation, bottom-up innovation, knowledge sharing, and capturing ideas from outside the organization [23].
From the explanation above, it can be seen that every theory states that organizational health has sliced dimensions and indicators that are almost similar. An SME, as a form of organization with a smaller portfolio, can take measurements of the health of its organization based on three clusters and nine dimensions with indicators adapted to the size of the portfolio and more flat organizational structure [22,23]. The adoption of these measurements is due to the measurements offered by Keller and Price [23] in more detail, which are complete and easy to understand. The questionnaire was also adapted to Beckhard’s theory to make it more understandable [25]. The dimension of direction is measured by a joint vision, the clarity of strategy, and employee involvement, where a series of indicators is related to the internal organization, not the external parties of the organization with outsiders. So, there is no overlapping with a shared purpose on the social capital indicators that have been discussed in the previous subsection. In the leadership dimension, the measurement through the type of leadership itself is applied. The culture and work climate indicators appear to conflict with those proposed to measure the cognitive dimension of social capital. The thing to note is that organizational health emphasizes the internal elements of the organization, in contrast to social capital, which emphasizes external aspects of the organization [36]. In the dimension of accountability, the comprehensive indicator offered can be used, as well as indicators in the coordination and control dimensions that are most likely to be practiced by the same person because of the very flat organizational structure. In the capability dimension, the indicator of the use of resources from outsiders is not used because it has been contained in the measurement of social capital, where resource assistance from outsiders is included. In the update capacity cluster, the external orientation dimension does not fully use the indicators offered because of overlapping with social capital related to partnerships and stakeholders. Therefore, the indicators used focus on customers and competitive insights to obtain information about competitors that allow it to be superior. In the learning innovation dimension, the indicator of sharing knowledge and capturing ideas from outside is part of social capital’s cognitive dimension. It does not need to be measured again because it has already been utilized.
A genuinely healthy organization is an organization that strategically integrates employee welfare into its business goals and strengthens through established practices in leadership support, learning culture, healthy quality work, and human resource management practice that is person friendly. It implicitly informs that organizational health affects competitive advantage. Organizational health focuses on internal harmony, quality of implementation, coordination, and control as tools that contribute to competitive advantage because the main focus of organizational health is human resource practices [19,20].
Hypothesis 2 (H2). 
Organizational health positively and significantly affects competitive advantage.

2.3. Competitive Advantage

Competitive advantage is defined as a condition that allows an organization, including an SME, to carry out operational and business activities with higher or more efficient quality than its competitors. in that context, emphasizing customer relationships at a lower cost is the primary key to differentiation to determine competitive advantage. However, according to some previous studies in the literature, it was found that competitive advantage is related to producing cheaper products for customers rather than providing final quality
This study uses Barney’s theory as a grand theory and approaches competitive advantage at the strategic level using the resource-based view (RBV) within the VRIN framework. VRIN is interpreted as a resource that is valuable, rare, difficult to imitate, and hard to replace [10,12]. RBV focuses on internal analysis, such as company ownership of various resources and capabilities that allow companies to develop differently [46,47,48]. Competitive advantages and organizational performance depend on specific resource ownership with unique characteristics such as VRIN [12].
A valuable resource is defined as the organization’s core competency; if developed from within and will be more sustainable than those acquired through imitation. The organization’s valuable resources lie in its ability to neutralize threats and exploit opportunities that arise in the business environment. The valuable resource is about the power of companies to design and implement strategies that improve their efficiency and effectiveness. It is important to emphasize that the value of resources must be estimated in the context of the company’s strategy and the specific environment where the company operates. This dimension indicates that the organization focuses on the future and the existence of gap management [19]. A rare resource in the VRIN framework implies that the organization has a resource that competitors have difficulty accessing. The rare resource can be knowledge and expertise embedded in organizational competencies. It ensures the company’s survival and enables it to achieve competitive parity in its industry. It also indicates the organization’s functional, technical, and core competencies. It is authentic and can be seen from the causal ambiguity built deliberately, making the core competencies impossible. The characteristics and operation of the components remain invisible and blurred, making this competence complicated to be understood or replicated by other competitors [49]. Indicators of the rare resource are internal capabilities and competency development in the organization [19]. The fourth dimension is a non-substitutable resource. It means the resource cannot be replaced. The resource is codified competencies in companies unique to the position, function, and domain that are more important in harmony with product value chains, processes, and services [50]. The time and effort needed to build unique competencies make it difficult to be replaced by other related competencies by both the company itself and competitors. The indicators of this non-substitutable resource are unique competencies, unique products, and unique marketing plans [19].
Hypothesis 3 (H3). 
Social capital and organizational health positively and significantly affect competitive advantage.
Based on the above explanation about the relationship social capital and organizational health have with the competitive advantage of SMEs, a conceptual framework can be derived—see Figure 1 in this regard.
The purpose of the proposed framework that considers competitive advantage as being affected by social capital and organizational health is likely to provide a structured approach for understanding and leveraging these two essential factors in achieving a competitive advantage. By incorporating social capital and organizational health into a framework for understanding competitive advantage, organizations can gain a more comprehensive view of the factors influencing their ability to compete effectively in the market. Specifically, the framework can help organizations identify areas to leverage their social capital and improve their organizational health to achieve a competitive advantage.

3. Materials and Methods

3.1. Method

This research used a survey method with a quantitative approach. The technique used in this study was the structural equation modeling (SEM) analysis technique. The data processing technique used the CB-SEM method with computational software Amos version 26 and IBM SPSS version 25 and sought to provide the most appropriate structural model based on robust theoretical analysis. The indicators offered in the initial research allowed changes to present a more precise model by eliminating some of the indicators provided when testing the causal relationship in each construct [51]. The aim was to obtain a suitable structural model.

3.2. Population and Sample

The population in this study included culinary and craft SMEs in Samarinda City. Samarinda City was appointed because, apart from being the capital of East Kalimantan Province, Samarinda City was also lined up as a buffer for the new capital of the Republic of Indonesia [6]. Culinary and craft SMEs in Samarinda City were chosen because these two sub-sectors have the most potential [52,53] for achieving sustainable development goals through the creative economy sector [3]. It is because culinary and craft SMEs have great potential to produce leading export commodities and the highest source of regional income in Samarinda City after the oil, gas, and coal sectors [52]. There are 1084 culinary SMEs and 104 craft SMEs in Samarinda City. The sampling technique formulas (S) in this study used the Isaac and Michael formula with 1 degree of freedom (d = 5% = 0.05). λ 2 (chi-square) depends on the degree of freedom (if df = 1, then λ 2 = 3.841), N is the total population, P is the true probability (P = 0.5), and Q is the false probability (Q = 0.5) [54,55].
S = λ 2 · N · P · Q d 2 N 1 + λ 2 · P · Q
Determination of culinary and craft SME samples was carried out separately. The results for culinary SMEs were 283 samples, and for craft SMEs, 82 samples. Then, the two sample groups were added up, so the total sample used in this study was 365. Sample selection used a convenience random sampling technique in which research data collection came from a set of available respondents [55]. Respondents to this study were SME owners, because SME owners were seen as the ones who best understood the managerial level of SMEs [56].

3.3. Data Collection

Data collection techniques in this study used a survey method, and the research instrument used a questionnaire. Questionnaires were distributed online in Google Forms to respondents using links on social media, such as Whatsapp and Instagram. Because of the time and distance limitations, the research used Whatsapp and Instagram to distribute the questionnaire. WhatsApp and Instagram are two of the most popular social media platforms, with millions of users worldwide [57], including the owners of culinary and craft SMEs in Samarinda City. They help reach a large and diverse audience quickly and easily. In addition, compared to traditional methods of data collection, such as paper-based surveys or in-person interviews, distributing questionnaires via WhatsApp and Instagram is a cost-effective option. It does not require printing materials or paying for postage, and the time and effort required to distribute the survey are minimal. Distributing questionnaires through Whatsapp and Instagram can lead to a higher response rate and faster data collection. WhatsApp and Instagram are user-friendly platforms that most people are familiar with. Respondents will likely find it easy to navigate the questionnaire and provide accurate answers. Respondents may feel more comfortable answering sensitive questions honestly when they can do so anonymously via WhatsApp or Instagram [58].
The steps for distributing the questionnaire were to collect sample contacts based on information from the Department of Industry, Cooperatives, SMEs, the Government of Samarinda City, and East Kalimantan Province in September 2022. Double-checking using Google, Instagram, Whatsapp, and the website of each SME was conducted in September 2022. The samples chosen were SMEs in the culinary and craft sub-sectors in Samarinda City. Then, two-way communication was carried out to explain this research’s purpose to the respondents from October 2022 through November 2022. Questionnaires were created in December 2022 and distributed online until February 2023. The subsequent data exporting, sorting, and processing steps were conducted in February 2023. The detailed timeframe regarding the distribution of the questionnaire is presented in Table 1.
The questionnaire contained 54 items, including 14 items related to social capital, 28 to organizational health, and 12 to competitive advantage. The questionnaire was adopted from previous empirical research. Resources in the social environment were initially formed through reciprocal relationships that created trust between [26,31] parties as a partnership with its configuration [26,29], resulting in a shared understanding between parties in the network manifested as a shared goal and culture [26,31]. Social capital was analyzed through different dimensions, namely relational, structural, and cognitive [26,31,33]. The relational dimension was measured through trust and reciprocal relationships proposed in previous empirical research [31]. The structural dimension was measured by its configuration: bonding social capital, bridging social capital, and linking social capital [29]. Shared goals and shared cultures were selected to measure the cognitive dimension [31].
Organizational health is the organization’s ability to carry out alignment, execution, and renewal or improvement to show high performance in the long term. We adopted the theory that Keller and Price (2011) proposed to measure organizational health [24] and adapted the measurement presented by McKinsey and Company, which contains nine dimensions [21,23]. The measure of direction dimension uses clarity strategy, shared visions, and employee involvement. Leadership measurement uses four types: authoritative leadership, consultative leadership, supportive leadership, and challenging leadership. Work culture and climate were measured by four indicators: open and trusting, internally competitive, operationally disciplined, and creative and entrepreneurial. Accountability was analyzed through role clarity, performance contracts, consequence management, and personal ownership [21]. The dimension of coordination and control has five indicators in the grand theory [21,23], but in this research, we used three indicators: people management review, operational management, and financial management [21]. We did not use risk management indicators in this research because of the worry of overlap with other indicator-related risks, such as financial management and professional standards, which control the financial resources and compliance with laws and regulations. It makes it possible to overlap in the context of SMEs with smaller sizes, resources, and portfolios [22]. Besides that, the worry coincides with the management gap in competitive advantage. The capability dimension was measured by talent acquisition and talent development [21]. We did not use outsourced expertise because of its indicated overlap with shared culture in social capital. This research used inspirational leaders and career opportunities as indicators to measure the motivation dimension [21,23]. A meaningful value indicator is dubious for use in the SME case [59] because its size and structure are relatively small and flat [22]. In the SME context, rewards and recognition tend to be about financial rewards and career opportunities [59]. Therefore, it is represented in indicators that this research used. The learning and innovation dimension was measured through top-down innovation, in which the leader is the leading actor, and bottom-up innovation, which is the key to open learning through innovation [21]. We did not use knowledge sharing because it relates to external parties, so it overlaps with the cognitive dimension in social capital. It is explained in advance that one advantage of social capital for SMEs is access to knowledge [42,60].
Competitive advantage includes the organization’s tangible and intangible resources within valuable, rare, inimitable, and non-substitutable resources [11,12]. The competitive advantage measurement uses Barney’s grand theory. The questionnaire was adapted from previous empirical research [19]. Valuable resources were measured through future business-related competencies and competency gap management. Rare resources were indicated by specific industry, technical, and functional competencies owned by SMEs. Inimitable resources were analyzed through unique competencies, insurmountable internal capabilities, and robust competency build-up. Non-substitutable resources were measured through unique products and unique marketing plans [12,19].
The questionnaire used closed statements. The assessment uses a Likert scale with a score of 1–5: strongly disagree, disagree, moderately agree, agree, and strongly agree. In this study, variables were operationalized to identify each variable through its operational definition, dimensions, indicators, and references, which became the basis for each item included in the questionnaire. It aimed to avoid ambiguity. The variable operationalization table can be seen in Table 2 and the items of questionnaire are available on Appendix A.

4. Results

This research measured social capital, organizational health, and competitive advantage at the organizational level. The demographic information in this study was the composition of SMEs based on the type and location of SMEs. In this study, 365 SMEs participated. They consisted of 283 culinary SMEs and 82 craft SMEs spread across all sub-districts in Samarinda City. Details are shown in Table 3.
Table 3 presents demographic data on the respondents. Most respondents were men with an average age of 35 to 50 years and a high school education level. This research also captured data on the superior products of culinary and craft SMEs in Samarinda City. Among the SMEs’ main products, 25% was Amplang (fish crackers typical of Samarinda City), 12% fried chicken and duck, 11% seafood, 6% coffee, and 4% soup. At the same time, the rest included tempeh, tofu, porridge, fried rice, fried noodles, and other snacks, which averaged less than 9%. Meanwhile, craft SMEs were also dominated by products that carried elements of local culture. Craft SMEs in Samarinda City consist of 27% typical Samarinda weaving crafts, 24% wood, bamboo, and rattan crafts, 23% Kalimantan bead crafts, 12% flower crafts, and another 14% consisting of metal, glass, and batik crafts.
Before the CB-SEM analysis, a descriptive analysis was conducted to see the data distribution obtained. The results of the descriptive analysis are interpreted in Table 4.
Table 4 includes calculations of the maximum value, minimum value, standard deviation, and average. The mean of social capital was 2.505, and S.D was 0.653. The average score tended to be close to 2 and was considered 2. It shows that culinary and craft SMEs in Samarinda City have a relatively low social capital tendency. The mean of organizational health was 3.462, and S.D was 0.799. Here, the mean was close to 3 and considered as 3. It indicates that culinary and craft SMEs in Samarinda City can carry out internal alignment, execute strategies, and implement internal reforms. The average competitive advantage value was 3.355, and the standard deviation was 0.799. The average value was close to 3 and considered as 3. It means that the competitive advantage of culinary and craft SMEs in Samarinda City is moderate. It implies that culinary and craft SMEs in Samarinda City have several advantages over their competitors, but there is still room for improvement. SMEs with moderate levels of competitive advantage may be able to compete effectively in their respective markets. Still, they may face challenges in gaining a larger market share or fending off new entrants.
A more detailed description of the descriptive statistics of the respondents’ answers is presented in Table 5.
Each variable and its construct-forming indicators was tested in the SEM analysis step. This study examined the effect of social capital (SC) and organizational health (OH) on competitive advantage (CA). Social capital consists of three dimensions, namely relational (REL), structural (STR), and cognitive (COG). Organizational health (OH) has nine dimensions, namely direction (DIR), leadership (LED), work culture and climate (C), accountability (AC), control coordination (CC), capability, motivation (MOT), external orientation (EO), and learning and innovation (LI). Meanwhile, competitive advantage has four dimensions, namely valuable (V), rare (R), inimitable (I), and non-substitutable (N). In SEM analysis, a bias test was carried out using Harman’s single factor method to measure common method variance. Using Harman’s single factor test, the majority of the variance could be explained by one factor. The value of a good Harman’s single factor test must be below 50% [61,62]. In this study, Harman’s single factor test was carried out with a variance proportion of 41.9%. These results indicate that the overall item (single factor) in constructing the construct did not occur in common method biases, which cause errors or errors in measuring and testing data. Therefore, CMB could be neglected.
After confirming that each item (single factor) was unbiased, SEM analysis was required first, namely by considering sample size, data normality, outlier-free, and multicollinearity-free. Based on the results obtained, it was determined that the SEM assumptions were fulfilled, as seen in Table 6.
As indicated in Table 6, it can be seen that all of the assumptions in testing using SEM were fulfilled. The next step was confirmatory factor analysis of the data. In this study, factor analysis was carried out using indicators that had been parceled before. Parceling uses a composite score of items that include the same component. For example, component-1 in the relational dimension of the social capital variable in this study contained six items, so the composite score was obtained from the composite score of the six items. The composite score in this study used the average of each item on one dimension for parceling [63,64]. The differences in the models before and after parceling can be seen in Figure 2.
After the item-parceling was carried out, the next step was confirmatory factor analysis (CFA), which was carried out to see whether the construct on each variable was confirmed as a supporting factor for each variable or not. After that, validity and reliability tests were carried out. Validity and reliability tests were carried out so that this research could represent the actual situation in the field. CFA is commonly used to examine the underlying latent constructs or dimensions of a given set of observed variables. The lower limit for the valid magnitude of the loading factor is equal to 0.5 [51,61]. Based on the validity test using IBM AMOS, all indicators were declared valid, as shown in Table 7.
Table 7 confirms that the overall construct of latent variables was valid. After carrying out the validity test, a reliability test was carried out with a construct reliability (C.R) value of ≥0.70 and AVE ≥ 0.50 The results of the reliability test are presented in Table 8.
In the next step, modeling was carried out by compiling a path diagram, shown in Figure 3.
After the path diagram was prepared, the next step was organizing the conversion of the path diagram into a structural equation. Obtained results are illustrated in Table 9.
After compiling the structural equation, the input matrix involved covariance and correlation matrices. The estimated model used was the maximum likelihood estimate. The maximum likelihood estimate was fulfilled, assuming that the minimum data set cardinality equaled 200. In this study, the data set cardinality was equal to 365. The next step was to evaluate the feasibility by testing the whole model’s fit. The fit of the model to the data was evaluated using the goodness of fit indices (GoFI) measurement. GoFI is divided into three groups: absolute fit indices, incremental fit indices, and parsimonious fit indices. The results of the model fit validation thanks to goodness of fit application are presented in Table 10.
As Table 10 confirms, the CMIN/df, RMSEA, and AGFI values still did not fit. Therefore, a model modification was made. Model modification was carried out by looking at the recommended modification indices and correlating errors so that a fit model was finally obtained [65]. The effects of these modifications are illustrated in Figure 4 and Table 11.
From the respecification of the model, the Goodness of Fit is obtained, as shown in Table 11.
Based on the modifications made to the model, it can be seen that the model as a whole was declared fit. Although several indices were still within the “marginal fit” criteria, several other indices were declared fit. Therefore, the model is feasible to use. Model modification is performed by correlating the errors in the variables and eliminating items in the construct that do not match the model. Surprisingly, the dimension of work culture and climate (C) was unsuitable for establishing a fit model of the culinary and craft SMEs’ organizational health (OH) in Samarinda City. Therefore, the respecification of the model was carried out to produce a statistically fit model.
Before testing the hypothesis, a non-response bias test was carried out using the Common Latent Factor (CLF) in Amos, where the difference in the regression weights in the CLF model and the non-CLF model was compared. The lowest value of the difference in standardized regression weight must be <0.2 [66]. The results of the bias test with CLF are interpreted in Table 12.
The next step was hypothesis testing. Hypothesis testing was carried out using a structural model fit analysis with test criteria: The hypothesis is accepted if the critical ratio (C.R) value is >1.65 and p-value is <0.05. The hypothesis test measures the partial effect between the variables of social capital and organizational health. Test measures are presented in Table 13.
Based on the results of hypothesis testing, it was determined that social capital (SC) has a positive and significant effect on competitive advantage (CA), so Hypothesis 1 is accepted. It can be seen that the C.R value was above 1.65, at 4.245, and the p-value was 0.000. Thus, every unitary increase in social capital has an effect of 0.464. Organizational health (OH) has a positive and significant effect on competitive advantage (CA), so Hypothesis 2 is accepted. It can be seen that the C.R value was above 1.65, at 6.442, and the p-value was 0.000. Thus, with every unitary increase in organizational health, competitive advantage increases by 0.531.
Testing the hypothesis related to the effect of social capital and organizational health simultaneously was carried out by looking at the R-square value in the AMOS output. See Table 14 provides this information.
Based on the table, it can be seen that the R-Square value of exogenous latent variables, namely social capital and organizational health, had an effect of 95.6% on endogenous latent variables, namely competitive advantage. Additionally, the remaining 4.4% was explained by other variables outside this study. Thus, Hypothesis 3 is accepted. It can be concluded that:
Hypothesis 1 is accepted. 
Social capital has a positive and significant effect on competitive advantage.
Hypothesis 2 is accepted. 
Organizational health has a positive and significant effect on competitive advantage.
Hypothesis 3 is accepted. 
Social capital and organizational health influence a competitive advantage simultaneously.

5. Discussion

The results of hypothesis testing show that social capital has a positive and significant effect on the competitive advantage of the culinary and craft SMEs in Samarinda City. Social capital consisting of three dimensions, namely relational, structural, and cognitive, shows its influence toward competitive advantage in the VRIN framework, namely resources that are valuable, rare, inimitable, and non-substitutable. The effect of social capital on competitive advantage in the culinary and craft SMEs in Samarinda City implicitly explains that factors originating from outside the organization’s scope have a positive and significant effect on the realization of competitive advantage. Social capital that prioritizes the quality of SME relationships with their partners to form several network configurations that manifest shared goals and culture is considered to be an important factor for SMEs, which usually comprise organizations with a small portfolio for competitive advantage realization. Compared to previous research, which stated that network configuration has no significant effect on social capital modeling [31], in this study, network configuration affected social capital modeling. The effect of the configuration on modeling social capital follows previous empirical research that specifically examined the structure of social capital [29], especially in SMEs in the creative economy sector [67], to achieve competitive advantage [68]. As mentioned in previous research on social capital, which is expected to use three dimensions, relational, structural, and cognitive [29], in this study, these three dimensions had a positive and significant influence in modeling social capital for competitive advantage. This fact justifies the results of previous empirical research stating that social capital, directly and indirectly, influences competitive advantage [34,36,38].
The results of hypothesis testing indicate that organizational health has a positive and significant effect on competitive advantage. Organizational health in measuring the competitive advantage of the culinary and crafts SMEs in Samarinda City focuses on dimensions related to the internal organization, in this case, the internal SMEs themselves. These dimensions include direction, leadership, accountability, coordination and control, capability, motivation, external orientation, and learning and innovation, which were proposed by Keller and Price in previous literature [23]. The eight dimensions focus on internal SMEs. The culinary and craft SMEs in Samarinda City show that internal strengths, such as a high organizational health index, can create the competitive advantage within the VRIN framework. These results are consistent with previous empirical research, which states that organizational health affects competitive advantage.
Surprisingly, the dimension of work culture and climate did not fit the previously proposed structural model, so the model was respecified by eliminating the work culture and climate factor. Compared with previous empirical research, a similarity was found. Previous empirical research stated that work culture could not directly influence competitive advantage [68]. Even so, there seems to be a controversy about why a positive work climate is unsuitable for modeling organizational health to competitive advantage. It can be compared to recent research, including work climate modeling for competitive advantage. Compared to previous studies, which stated that work climate significantly affected competitive advantage [69,70,71], this study found no significant effect. Implicitly, another variable that moderates or intervenes in organizational health variables that contain work culture and climate factors is required [72]. It is why work culture climate factors were not appropriate for inclusion in the structural model.
Nevertheless, the other eight dimensions seem relevant in this regard. In other words, organizational health positively and significantly affects competitive advantage, especially in the culinary and craft SMEs in Samarinda City. It reinforces the justification of previous empirical research, which states that organizational health positively and significantly affects competitive advantage [37,73,74].
Social capital and organizational health have a simultaneous positive and significant effect on competitive advantage. The culinary and craft SMEs in Samarinda City need these two important factors to achieve competitive advantage. By combining three dimensions, namely relational, structural, and cognitive, as essential dimensions in social capital and eight main dimensions of organizational health, namely direction, leadership, accountability, coordination and control, capability, motivation, external orientation, and learning and innovation, they can realize competitive advantage at the strategic level according to four main VRIN dimensions.
Based on this, it can be implicitly translated that building a competitive advantage for the culinary and craft SMEs in Samarinda City requires the utilization of external and internal aspects. Social capital is an external aspect that can be acquired by the culinary and craft SMEs in Samarinda City. It focuses on the quality of an SME relationship with its partners and forms a particular network configuration that manifests shared goals and culture. If it is built to be more robust, competitive advantage can be maximized. Likewise, on the internal aspect where organizational health as a whole pays attention to alignment, execution, control, improvement, and learning to create the competitive advantage in the long term, this implicitly shows that organizational health is a long-term investment to encourage SMEs to achieve competitive advantage. The simultaneous effect of social capital and organizational health on the competitive advantage of the culinary and craft SMEs in Samarinda City is the novelty of research. The positive and significant effect of social capital and organizational health on the competitive advantage raises the creative economy phenomenon where SMEs are the backbone of the creative economy to build a people’s economy, especially in the buffer zone of the new capital of Indonesia: Samarinda City.

6. Conclusions

The results of this study explicitly answer the research objectives, which aimed to analyze the influence of social capital, organizational health, and competitive advantage partially and simultaneously. Based on the results and analysis discussed, several conclusions can be drawn regarding the effect of social capital and organizational health on the competitive advantage of the culinary and craft SMEs in Samarinda City. Social capital has a partially positive and significant effect on the competitive advantage of the culinary and craft SMEs in Samarinda City. Implicitly, external factors are needed, such as SME networks formed with partners that involve outsiders; in this context, it is social capital. All dimensions of social capital consisting of relational, structural, and cognitive are factors that are suitable for forming social capital in realizing competitive advantage.
Organizational health has a partially positive and significant effect on the competitive advantage of the culinary and craft SMEs in Samarinda City. Improving organizational health will increase competitive advantage for the culinary and craft SMEs in Samarinda City. The effect of organizational health on the competitive advantage of the culinary and craft SMEs in Samarinda City shows that SMEs need internal aspects of internal alignment, strategy execution, and internal renewal to be able to realize competitive advantage. Organizational health, which consists of nine dimensions, namely direction, leadership, work culture and climate, accountability, control and coordination, capability, motivation, external orientation, and learning and innovation, is surprisingly not very suitable for the model offered in the case of the culinary and craft SMEs in Samarinda City. One of the fundamental conclusions of the paper was that the work culture and climate dimension was inappropriate, so it was eliminated from the model. This indicates the need for additional variables as moderators or interventions between organizational health and competitive advantage, as revealed in previous empirical research. However, the other eight dimensions were appropriate and showed better influence.
Social capital and organizational health have a positive and significant effect on competitive advantage. Therefore, it is necessary to optimally increase social capital and organizational health so that the culinary and craft SMEs in Samarinda City can realize competitive advantage.

6.1. Theoretical Implication

This study adds to the body of knowledge by providing an explanatory mechanism for linking social capital, organizational health, and competitive advantage in the context of SMEs engaged in creative economic sectors such as the culinary and craft subsectors. Furthermore, this study contributes to the literature because it considers the influence of various variables, such as social capital and organizational health, that can trigger the competitive advantage of SMEs during the post-COVID-19 pandemic economic recovery and the sustainable era. The current study advances the classic theories of social capital, organizational health, and competitive advantage within the VRIN framework. This research incorporated the grand theory of social capital and organizational health, describing how and why social capital and organizational health can shape optimal competitive advantage. The study’s results confirm that social capital and organizational health positively affect competitive advantage.

6.2. Practical Implication

SMEs can benefit from investing in social capital by building solid relationships with their customers, suppliers, and other stakeholders. By cultivating trust and reciprocal relationships, SMEs can establish a reputation for reliability and honesty to help them achieve a competitive advantage. To build social capital, SMEs should develop strong relationships with key stakeholders. That may involve attending industry events and conferences, participating in online forums and social media groups, and engaging in collaborative projects with other businesses.
SMEs prioritizing organizational health are more likely to achieve competitive advantage. By achieving adequate internal alignment, proper execution, and continuous internal updates, SMEs can improve their overall health and resilience. That may include offering training programs, providing rigorous feedback and recognition, and coaching and teamwork training in their execution.
SMEs that can establish and maintain a competitive advantage are more likely to succeed in a crowded marketplace. By focusing on their strengths and differentiating themselves from their competitors, SMEs can attract and retain customers and increase their market share. To establish a competitive advantage, SMEs should develop a strong value proposition that differentiates them from their competitors. SMEs can leverage their social capital and organizational health to support their competitive advantage by building strong relationships with key stakeholders and creating a positive work environment that fosters innovation and creativity.

6.3. Policy Implication

The implications of the competitive advantage of culinary and craft SMEs for sustainable development goals (SDGs) can be significant. By increasing their competitive advantage, SMEs can contribute to achieving the SDGs, which aim to promote sustainable economic, social, and environmental development. The competitive advantage of SMEs has led to decent economic growth following SDG8. In addition, achieving a competitive advantage for SMEs can create local economic development. By supporting local producers and suppliers, culinary and craft SMEs can contribute to SDG 11 to make inclusive cities and human settlements safe, resilient, and sustainable [1,3]. Culinary and craft SMEs in Samarinda City also have the potential to become actors in cultural preservation. Most of the superior products of culinary and craft SMEs are dominated by culinary and handicrafts that carry elements of Kalimantan culture. This also contributes to SDG 4.
Thus, policymakers and stakeholders should consider promoting policies and strategies that support the growth and development of these SMEs, because they can contribute to achieving the SDGs [3]. The strategy that can be utilized is to increase social capital and organizational health. Social capital figures tend to be low, which raises criticism and questions. So far, partnerships implemented specifically by stakeholders have been running effectively. Stakeholders and related policymakers need to review and re-evaluate the extent to which social capital offered by institutions has been applied. The organizational health of culinary and craft SMEs in Samarinda City is capable, but work culture and climate do not influence organizational health properly to create a competitive advantage. However, there has been no official report regarding the organizational health of stakeholders. Therefore, further attention is needed regarding organizational health, especially during the economic recovery following the COVID-19 pandemic.

6.4. Limitations and Future Research

This study has some limitations in terms of its analysis of the influence of social capital and organizational health on the competitive advantage of culinary and craft SMEs in Samarinda City. In this study, the subject was used as a unified entity because, according to the Office of Industry, Cooperatives, and SMEs of East Kalimantan Provincial Government, culinary and craft SMEs are commodities that have the potential to be exported despite a lack of complete data on each subject. Moreover, the total population of SMEs in the craft subsector was only 104 units, which did not meet the criteria for the SEM assumptions. Therefore, this study combined two entities, namely culinary and craft SMEs, as a single subject. The merger of the two entities was carried out to meet the SEM assumption criteria.
Second, eliminating the work culture and climate dimension from the measurement of organizational health in the SME realm is surprising and allows for debate. Still, empirical research states that work culture in SMEs cannot work alone with regard to the influence on competitive advantage [72]. The study thus testifies to the need to apply other variables for moderating and intervening purposes. Future research is expected to analyze the effect of social capital and organizational health on competitive advantage with the subject of culinary and craft SMEs separately. That will allow for the addition of other variables.
Moreover, in this research, one of the factors was eliminated, namely the work culture and climate dimension in the respecification of the structural model. Therefore, it is necessary to conduct further modeling analysis to assess the suitability of work culture and climate factors as organizational health variables that influence competitive advantage. This will allow other variables to intervene or moderate in realizing competitive advantage.
Third, the limited literature on organizational health and competitive advantage makes it difficult to determine operational variables, especially in the SME context. Even so, the lack of literature can be an opportunity for this research to become the latest research, especially in the context of SMEs in Southeast Asian regions such as Samarinda City in Indonesia, which are still rarely studied. Further research is suggested to develop this research model by adding several variables that moderate or intervene or use a different theory to develop the most effective model for achieving competitive advantage for SMEs.

Author Contributions

F.W. contributed to the design of the concept and the content of the manuscript, literature research, data processing with software, and manuscript preparation. I.S. and W.O.Z.M. contributed to supervise research and review the manuscript. All authors have read and agreed to the published version of the manuscript.

Funding

This research was funded by Padjadjaran University.

Institutional Review Board Statement

This research received approval from Master of Science in Management Study Program at Padjadjaran University regarding ethical feasibility.

Informed Consent Statement

Not applicable.

Data Availability Statement

Not applicablle.

Acknowledgments

The authors thank Padjadjaran University for financial support.

Conflicts of Interest

The authors declare no conflict of interest.

Appendix A

Social Capital
We exchange information with our partners.
Our partners are partners we really trust.
Our partners always assist when we need it.
We always maintain good communication with our partners.
We try to fulfil our partner’s request as a form of remuneration.
Our relationship with our partners is very close to the personal level.
Those who help with our business activities are mostly friends or family.
Those who help our business activities are mostly acquaintances, volunteers, or private institutions.
Those that help our business activities are mostly government offices or banks.
We understand that our partnership relationship has a common goal.
We understand we share the same ambitions as our partners.
We understand the needs of our partners.
We understand that our partnership relationship results in shared rules, values, or norms.
We understand that our partners have business practices similar to ours.
Organizational Health
We have a purpose for why this SME was founded.
We communicate every direction of our business strategy to employees as clearly as possible.
We involve employees in decision-making.
Leadership in this SME emphasizes hierarchy to get work done.
Leadership in this SME involves employees in carrying out tasks.
The leadership in this SME seeks to build a positive environment characterized by a mutually supportive team.
Leaders challenge employees to dare to accept challenging assignments.
We seek to create openness in employees to encourage honesty.
Employees compete fairly.
We have strict oversight to enforce standards of conduct on all employees.
Employee creativity is not limited to supporting innovation.
Employees have roles according to their abilities.
Our evaluation shows that employees have successfully completed tasks according to their roles.
Employees get rewards according to their performance.
There is a personal relationship between employees and SME based on responsibility.
We conduct employee performance evaluations consistently.
We consistently evaluate the achievement of operational targets.
We have consistent control over the use of financial resources.
We evaluate compliance with laws or regulations that apply consistently.
We put employees in the right position.
Employees receive adequate training consistently.
Leaders seek to inspire their employees.
We provide opportunities for employees to carry out higher duties.
We can provide financial bonuses to their employees.
We focus on customer satisfaction.
We are observant in the face of competition with competitors.
The leader plays an essential role in learning to create innovation.
Follower participation plays a vital role in learning to create innovation.
Competitive Advantage
We already have preparations to deal with changes related to competition in the future.
We have management anticipate changes in strategy for business activities for the next 3 years.
We have an organizational structure.
Employees play a role according to their position in the organizational structure.
We have technical competence in our business activities.
We have specific competencies related to our business activities.
We have product characteristics that are difficult for competitors to imitate.
We have in-house capabilities to resolve issues quickly.
We are competent in building organizations to get bigger.
We have unique product that competitors do not know how to make it.
We have a unique product that is difficult to be replaced by competitors.
We have unique marketing techniques.

References

  1. Joffe, A.; Newbigin, J.; Larasati, D. How Governments Could Better Engage with the Working Practices of the 21st Century Creative Economy; Asian Development Bank: Mandaluyong, Philippines, 2022; pp. 49–64. [Google Scholar]
  2. Štreimikienė, D.; Kačerauskas, T. The creative economy and sustainable development: The Baltic States. Sustain. Dev. 2020, 28, 1632–1641. [Google Scholar] [CrossRef]
  3. Sobir, R. Micro-, Small and Medium-Sized Enterprises (MSMEs) and Their Role in Achieving the Sustainable Development Goals; Department of Economic and Social Affairs: New York, NY, USA, 2022; pp. 11–26. [Google Scholar]
  4. Sato, Y. Development of Small and Medium Enterprises in the ASEAN Economies, in Beyond 2015: ASEAN-Japan Strategic Partnership for Democracy, Peace, and Prosperity in Southeast Asia; Japan Center for International Exchange: Tokyo, Japan, 2013; pp. 154–181. [Google Scholar]
  5. Bappenas, G.G. Capacity Development for Development Planners in East Kalimantan to Support the Accelaration of SDGs; The Government of Indonesia & GGGI: Jakarta, Indonesia, 2022. [Google Scholar]
  6. Washington, J.; Hasibuan, S. ‘Like We Don’t Exist’: Indigenous Fear Indonesia New Capital Plan. In Indigenous Right; Aljazeera: Doha, Qatar, 2023. [Google Scholar]
  7. Sya’rawie, M.M. New capital project: 53 developers compete over Palaran. In Infrastructure News; PwC: Jakarta, Indonesia, 2021. [Google Scholar]
  8. Timur, D.U.P.K. Laporan Kinerja Instansi pemerintah (LKj-IP) Tahun 2020; Disperindagkop UKM Provinsi Kalimantan Timur: Samarinda, Indonesia, 2020; pp. 1–65. [Google Scholar]
  9. Kiyabo, K.; Isaga, N. Strategic entrepreneurship, competitive advantage, and SMEs’ performance in the welding industry in Tanzania. J. Glob. Entrep. Res. 2019, 9, 62. [Google Scholar] [CrossRef]
  10. Khan, K.U.; Xuehe, Z.; Atlas, F.; Khan, F. The impact of dominant logic and competitive intensity on SMEs performance: A case from China. J. Innov. Knowl. 2018, 4, 1–11. [Google Scholar] [CrossRef]
  11. Barney, J.B.; Mackey, A. Text and metatext in the resource-based view. Hum. Resour. Manag. J. 2016, 26, 369–378. [Google Scholar] [CrossRef]
  12. Barney, J.B. Strategic Factor Markets: Expectations, Luck, and Business Strategy. Manag. Sci. 1986, 32, 1231–1241. [Google Scholar] [CrossRef]
  13. Dejardin, M.; Raposo, M.L.; Ferreira, J.J.; Fernandes, C.I.; Veiga, P.M.; Farinha, L. The impact of dynamic capabilities on SME performance during COVID-19. Rev. Manag. Sci. 2022, 1–27. [Google Scholar] [CrossRef]
  14. Ferreira, J.J.; Fernandes, C.I.; Ferreira, F.A. To be or not to be digital, that is the question: Firm innovation and performance. J. Bus. Res. 2018, 101, 583–590. [Google Scholar] [CrossRef]
  15. Kraaijenbrink, J.; Spender, J.-C.; Groen, A.J. The Resource-Based View: A Review and Assessment of Its Critiques. J. Manag. 2009, 36, 349–372. [Google Scholar] [CrossRef]
  16. Nakos, G.; Dimitratos, P.; Elbanna, S. The mediating role of alliances in the international market orientation-performance relationship of smes. Int. Bus. Rev. 2018, 28, 603–612. [Google Scholar] [CrossRef]
  17. Singh, S.K. Del Giudice, Big data analytics, dynamic capabilities and firm performance. Manag. Decis. 2019, 57, 1729–1733. [Google Scholar] [CrossRef]
  18. Haseeb, M.; Hussain, H.I.; Kot, S.; Androniceanu, A.; Jermsittiparsert, K. Role of Social and Technological Challenges in Achieving a Sustainable Competitive Advantage and Sustainable Business Performance. Sustainability 2019, 11, 3811. [Google Scholar] [CrossRef]
  19. Nair, H.A.P.; Kumar, D.; Ramalu, S.S. Organizational Health: Delineation, Constructs and Development of a Measurement Model. Asian Soc. Sci. 2014, 10, 145–157. [Google Scholar] [CrossRef]
  20. Panneerselvam, S.; Raya, R. The healthy organization construct: A review and research agenda. Indian J Occup Environ Med. 2013, 17, 89–93. [Google Scholar] [CrossRef] [PubMed]
  21. Gagnon, C.; John, E.; Theunissen, R. Organizational Health: A Fast Track to Performance Improvement. People & Organizational Performance. 2017. Available online: https://www.mckinsey.com/capabilities/people-and-organizational-performance/our-insights/organizational-health-a-fast-track-to-performance-improvement (accessed on 12 February 2023).
  22. Wee, J.C.N.; Chua, A.Y.K. The peculiarities of knowledge management processes in SMEs: The case of Singapore. J. Knowl. Manag. 2013, 17, 958–972. [Google Scholar] [CrossRef]
  23. Keller, S.; Price, C. Beyond Performance: How Great Organizations Build Ultimate Competitive Advantage; John Wiley & Sons: New York, NY, USA, 2011. [Google Scholar]
  24. DeJoy, D.M.; Wilson, M.G.; Vandenberg, R.; McGrath-Higgins, A.L.; Griffin-Blake, C.S. Assessing the impact of healthy work organization intervention. J. Occup. Organ. Psychol. 2010, 83, 139–165. [Google Scholar] [CrossRef]
  25. Beckhard, R. The Healthy Organization. In Organization Development; Schein, E.H., Ed.; John Wiley and Sons: San Francisco, CA, USA, 2006; pp. 950–953. [Google Scholar]
  26. Nahapiet, J.; Ghoshal, S. Social Capital, Intellectual Capital, and the Organizational Advantage. Acad. Manag. Rev. 1998, 23, 242–266. [Google Scholar] [CrossRef]
  27. Priyono, A.; Moin, A.; Putri, V.N.A.O. Identifying Digital Transformation Paths in the Business Model of SMEs during the COVID-19 Pandemic. J. Open Innov. Technol. Mark. Complex 2020, 6, 104. [Google Scholar] [CrossRef]
  28. Ye, Y.; Yang, L.; Huo, B.; Zhao, X. The impact of supply chain social capital on supply chain performance: A longitudinal analysis. J. Bus. Ind. Mark. 2023, 38, 1176–1190. [Google Scholar] [CrossRef]
  29. Cofré-Bravo, G.; Klerkx, L.; Engler, A. Combinations of bonding, bridging, and linking social capital for farm innovation: How farmers configure different support networks. J. Rural. Stud. 2019, 69, 53–64. [Google Scholar] [CrossRef]
  30. Salehi, A.; Ehrlich, C.; Kendall, E.; Sav, A. Bonding and bridging social capital in the recovery of severe mental illness: A synthesis of qualitative research. J. Ment. Health 2019, 28, 331–339. [Google Scholar] [CrossRef]
  31. Rodrigo-Alarcón, J.; García-Villaverde, P.M.; Ruiz-Ortega, M.J.; Parra-Requena, G. From social capital to entrepreneurial orientation: The mediating role of dynamic capabilities. Eur. Manag. J. 2018, 36, 195–209. [Google Scholar] [CrossRef]
  32. Cappiello, G.; Giordani, F.; Visentin, M. Social capital and its effect on networked firm innovation and competitiveness. Ind. Mark. Manag. 2020, 89, 422–430. [Google Scholar] [CrossRef]
  33. Koka, B.R.; Prescott, J.E. Strategic alliances as social capital: A multidimensional view. Strateg. Manag. J. 2002, 23, 795–816. [Google Scholar] [CrossRef]
  34. Hsu, B.-X.; Chen, Y.-M. Industrial policy, social capital, human capital, and firm-level competitive advantage. Int. Entrep. Manag. J. 2019, 15, 883–903. [Google Scholar] [CrossRef]
  35. Tsai, W.; Ghoshal, S. Social Capital and Value Creation: The Role of Intrafirm Networks. Acad. Manag. J. 1998, 41, 464–476. [Google Scholar] [CrossRef]
  36. Tang, L.; Bai, Z.; Ji, K.; Zhu, Y.; Chen, R. Correlations of external social capital in social organizations providing integrated eldercare services with medical care in China. BMC Health Serv. Res. 2022, 22, 101. [Google Scholar] [CrossRef] [PubMed]
  37. Alashkar, A.S.; Al-Kasasbeh, M.M. The effect of organizational health on the employee performance in the extractive industries. Manag. Sci. Lett. 2022, 12, 229–236. [Google Scholar] [CrossRef]
  38. Liu, C.-H. Creating competitive advantage: Linking perspectives of organization learning, innovation behavior and intellectual capital. Int. J. Hosp. Manag. 2017, 66, 13–23. [Google Scholar] [CrossRef]
  39. Simons, M.; Lataster, J.; Reijnders, J.; Peeters, S.; Janssens, M.; Jacobs, N. Bonding personal social capital as an ingredient for positive aging and mental well-being. A study among a sample of Dutch elderly. Aging Ment. Health 2020, 24, 2034–2042. [Google Scholar] [CrossRef]
  40. Zhang, S.; Anderson, S.G.; Zhan, M. The Differentiated Impact of Bridging and Bonding Social Capital on Economic Well-Being: An Individual Level Perspective. J. Sociol. Soc. Welf. 2011, 38, 119–142. [Google Scholar] [CrossRef]
  41. Chen, X.; Stanton, B.; Gong, J.; Fang, X.; Li, X. Personal Social Capital Scale: An instrument for health and behavioral research. Health Educ. Res. 2008, 24, 306–317. [Google Scholar] [CrossRef] [PubMed]
  42. Coleman, J.S. Social Capital in the Creation of Human Capital. Am. J. Sociol. 1988, 94, S95–S120. [Google Scholar] [CrossRef]
  43. Martínez-Pérez, Á.; García-Villaverde, P.M.; Elche, D. The mediating effect of ambidextrous knowledge strategy between social capital and innovation of cultural tourism clusters firms. Int. J. Contemp. Hosp. Manag. 2016, 28, 1484–1507. [Google Scholar] [CrossRef]
  44. Lowe, G.S.; Schellenberg, G.; Shannon, H.S. Correlates of employees’ perceptions of a healthy work environment. Am. J. Health Promot. 2003, 17, 390–399. [Google Scholar] [CrossRef]
  45. Xenidis, Y.; Theocharous, K. Organizational Health: Definition and Assessment. Procedia Eng. 2014, 85, 562–570. [Google Scholar] [CrossRef]
  46. Distanont, A.; Khongmalai, O. The role of innovation in creating a competitive advantage. Kasetsart J. Soc. Sci. 2018, 41, 15–21. [Google Scholar] [CrossRef]
  47. Tookanlou, P.B.; Wong, H. Determining the optimal customization levels, lead times, and inventory positioning in vertical product differentiation. Int. J. Prod. Econ. 2020, 221, 107479. [Google Scholar] [CrossRef]
  48. Javidan, M. Core competence: What does it mean in practice? Long Range Plan. 1998, 31, 60–71. [Google Scholar] [CrossRef]
  49. Teece, D.J.; Pisano, G.; Shuen, A. Dynamic capabilities and strategic management. Strateg. Manag. J. 1997, 18, 509–533. [Google Scholar] [CrossRef]
  50. Zander, U.; Kogut, B. Knowledge and the Speed of the Transfer and Imitation of Organizational Capabilities: An Empirical Test. Organ. Sci. 1995, 6, 76–92. [Google Scholar] [CrossRef]
  51. Hair, J.F.; Gabriel, M.L.D.S.; Patel, V.K. AMOS Covariance-Based Structural Equation Modeling (CB-SEM): Guidelines on Its Application as a Marketing Research Tool. Rev. Bras. De Mark. 2014, 13, 44–55. [Google Scholar] [CrossRef]
  52. Kaltim, D.d.U. Tahun 2020, Ekspor UKM Kaltim Tembus Rp428,2 Miliar; Disperindagkop dan UKM Kaltim: Samarinda, Indonesia, 2021; Available online: https://www.kaltimprov.go.id/berita/tahun-2020-ekspor-ukm-kaltim-tembus-rp4282-miliar (accessed on 25 September 2022).
  53. Ma’ruf, H. Kuliner dan Fashion Penopang Ekraf di Samarinda. 2022. Available online: https://kaltimpost.jawapos.com/kolom-pembaca/08/11/2022/kuliner-dan-fashion-penopang-ekraf-di-samarinda (accessed on 9 October 2022).
  54. Sugiyono. Metode Penelitian Kualitatif dan Kuantitatif (RnD). 2018: Alfabeta. Available online: https://cvalfabeta.com/product/metode-penelitian-kuantitatif-kualitatif-dan-rd-mpkk/ (accessed on 11 October 2022).
  55. Sedgwick, P. Convenience sampling. BMJ 2013, 347, f6304. [Google Scholar] [CrossRef]
  56. Albalushi, K.I.; Naqshbandi, M.M. Factors Affecting Success and Survival of Small and Medium Enterprises in the Middle East. Knowledge 2022, 2, 525–538. [Google Scholar] [CrossRef]
  57. Kepios. The World’s Most Used Social Platform. 2023. Available online: https://datareportal.com/social-media-users (accessed on 2 February 2023).
  58. Aziz, N.D.; Nawawi, A.H.; Ariff, N.R.M. Survey on Facility Managers Perception through Instant Message via Whatsapp Application. Environ. Behav. Proc. J. 2018, 3. [Google Scholar] [CrossRef]
  59. Kankisingi, G.M.; Dhliwayo, S. Rewards and Innovation Performance in Manufacturing Small and Medium Enterprises (SMEs). Sustainability 2022, 14, 1737. [Google Scholar] [CrossRef]
  60. Strese, S.; Keller, M.; Flatten, T.C.; Brettel, M. CEOs’ Passion for Inventing and Radical Innovations in SMEs: The Moderating Effect of Shared Vision. J. Small Bus. Manag. 2018, 56, 435–452. [Google Scholar] [CrossRef]
  61. Sharma, R.; Yetton, P.; Crawford, J. Estimating the Effect of Common Method Variance: The Method—Method Pair Technique with an Illustration from TAM Research. Manag. Inf. Syst. Q. 2009, 33, 473. [Google Scholar] [CrossRef]
  62. Podsakoff, P.M.; MacKenzie, S.B.; Lee, J.-Y.; Podsakoff, N.P. Common method biases in behavioral research: A critical review of the literature and recommended remedies. J. Appl. Psychol. 2003, 88, 879–903. [Google Scholar] [CrossRef]
  63. Bandalos, D.L. The Effects of Item Parceling on Goodness-of-Fit and Parameter Estimate Bias in Structural Equation Modeling. Struct. Equ. Model. A Multidiscip. J. 2002, 9, 78–102. [Google Scholar] [CrossRef]
  64. Widhiarso, W. Mengakomodasi Efek Metode dalam Pengujian Validitas Konstruk Melalui Analisis Faktor Konfirmatori. Psikol. J. Psikol. 2017, 1, 37. [Google Scholar] [CrossRef]
  65. Hanike, Y.; Damirah, D. Modifikasi Model Analisis Structural Equation Model (Sem) pada Reaksi Pasar di Perusahaan Bursa Efek Indonesia Melalui Modification Indices. Mat. Dan Pembelajaran 2018, 6, 127. [Google Scholar] [CrossRef]
  66. Afthanorhan, A.; Awang, Z.; Majid, N.A.; Foziah, H.; Ismail, I.; Halbusi, H.A.; Tehseen, S. Gain More Insight from Common Latent Factor in Structural Equation Modeling. J. Phys. Conf. Ser. 2021, 1793, 012030. [Google Scholar] [CrossRef]
  67. Pongtanalert, K.; Assarut, N. Entrepreneur Mindset, Social Capital and Adaptive Capacity for Tourism SME Resilience and Transformation during the COVID-19 Pandemic. Sustainability 2022, 14, 12675. [Google Scholar] [CrossRef]
  68. Rondi, E.; Debellis, F.; De Massis, A.; Garzoni, A. Bonding and bridging social capital in family firm internationalization. Sinergie Ital. J. Manag. 2020, 38, 113–131. [Google Scholar] [CrossRef]
  69. Yong, J.Y.; Yusliza, M.Y.; Ramayah, T.; Chiappetta Jabbour, C.J.; Sehnem, S.; Mani, V. Pathways towards sustainability in manufacturing organizations: Empirical evidence on the role of green human resource management. Bus. Strategy Environ. 2020, 29, 212–228. [Google Scholar] [CrossRef]
  70. Wang, C.-H. How organizational green culture influences green performance and competitive advantage. J. Manuf. Technol. Manag. 2019, 30, 666–683. [Google Scholar] [CrossRef]
  71. Waheed, A.; Miao, X.; Waheed, S.; Ahmad, N.; Majeed, A. How New HRM Practices, Organizational Innovation, and Innovative Climate Affect the Innovation Performance in the IT Industry: A Moderated-Mediation Analysis. Sustainability 2019, 11, 621. [Google Scholar] [CrossRef]
  72. Jardon, C.M.; Martínez-Cobas, X. Leadership and Organizational Culture in the Sustainability of Subsistence Small Businesses: An Intellectual Capital Based View. Sustainability 2019, 11, 3491. [Google Scholar] [CrossRef]
  73. Sharma, S.; Sharma, S.K. Probing the Links Between Team Resilience, Competitive Advantage, and Organizational Effectiveness: Evidence from Information Technology Industry. Bus. Perspect. Res. 2020, 8, 289–307. [Google Scholar] [CrossRef]
  74. AlHamad, A.; Alshurideh, M.; Alomari, K.; Al Kurdi, B.; Alzoubi, H.; Hamouche, S.; Al-Hawary, S. The effect of electronic human resources management on organizational health of telecommunications companies in Jordan. Int. J. Data Netw. Sci. 2022, 6, 429–438. [Google Scholar] [CrossRef]
Figure 1. Conceptual Framework.
Sustainability 15 07945 g001
Figure 2. Illustration of the differences in models before and after item-parceling: (a) model before item-parceling; (b) model after item-parceling.
Sustainability 15 07945 g002
Figure 3. Path Diagram.
Sustainability 15 07945 g003
Figure 4. Structural Model After Modification Indices.
Sustainability 15 07945 g004
Table 1. The Questionnaire Distribution Timeframe.
ActivitiesSeptember-22October-22November-22December-22January-23February-23
Sample contacts collected
Double-checking the contacts
Two-way communication with the contacts
The questionnaire created
The questionnaire distributed
The responses exported
The responses sorted
Data processed
Table 2. Variable Operationalization.
VariableDefinitionDimensionIndicatorConstructItem NumberReferences of The Questionnaire
Social CapitalResources in the social environment were initially formed through reciprocal relationships that created trust between [26,31] parties as a partnership with its configuration [26,29], resulting in a shared understanding between parties in the network manifested as a shared goal and culture [26,31].1. Relationala. TrustSME has a relationship with a very high level of trust with its partners.1, 2, 3[31]
b. Reciprocal relationship SME and its partners have a very high reciprocal relationship.4, 5, 6[31]
2. Structurala. Bonding Social CapitalSME partnership ties are solid and dominated by family or friends.7[29]
b. Bridging Social CapitalThe private sector very strongly dominates SME partnership ties.8[29]
c. Linking Social CapitalThe government and banks very strongly dominate SME partnership ties.9[29]
3. Cognitivea. Shared GoalsSME understands that its partnership relationship has a common goal.10, 11, 12[31]
b. Shared CultureSME understands that its partnership relationship results in a shared culture.13, 14[31]
Organizational HealthOrganizational health is the ability of the organization to carry out alignment, execution, and renewal or improvement to show high performance in the long term [23].1. Directiona. Clarity StrategySME has clear organizational goals.15[21]
b. Shared VisionsSME communicates the direction of the organization to all of its employees.16[21]
c. Employee InvolvementSME involves employees in decision-making.17[21]
2. Leadershipa. Authoritative LeadershipLeadership emphasizes hierarchy to get the job done. 18[21]
b. Consultative LeadershipLeadership involves employees in carrying out tasks.19[21]
c. Supportive LeadershipLeadership builds a positive environment characterized by a mutually supportive team.20[21]
d. Challenging LeadershipLeadership challenges employees to dare to accept challenging assignments.21[21]
3. Work Culture and Climate a. Open and TrustingSME transparency encourages honesty.22[21]
b. Internally CompetitiveThere is a climate of healthy competition among employees.23[21]
c. Operationally DisciplinedSME has strict oversight to enforce standards of conduct.24[21]
d. Creative and EntrepreneurialEmployee creativity is not limited to supporting innovation.25[21]
4. Accountabilitya. Roles Claritya. There is appropriateness of roles and abilities of employees.26[21]
b. Performance Contractsb. SME evaluation shows that employees have completed tasks according to their roles.27[21]
c. Consequence Managementc. There is compatibility of employee compensation and performance.28[21]
d. Personal OwnershipSME assesses that there is a sense of belonging owned by employees.29[21]
5. Coordination and Controla. People Management ReviewSME conducts employee performance evaluations consistently.30[21]
b. Operational ManagementSME evaluates the achievement of operational targets.31[21]
c. Financial ManagementSME has consistent control over the use of financial resources.32[21]
d. Professional StandardsSME evaluates compliance with laws or regulations that apply consistently.33[21]
6. Capabilitya. Talent AcquisitionSME puts employees in the right position.34[21]
b. Talent DevelopmentThere is consistently adequate training for employees.35[21]
7. Motivationa. Inspirational LeadersThe leader seeks to inspire their employees.36[21]
b. Career OpportunitiesSME provides opportunities for employees to carry out higher duties.37[21]
c. Financial IncentivesSME can provide financial rewards.38[21]
8. External Orientation a. Customer FocusSME focuses on customer satisfaction.39[21]
b. Competitive InsightsSME has the competitive insight to face competition with competitors.40[21]
9. Learning and Innovationa. Top-down innovationLeader plays an essential role in learning to create innovation.41[21]
b. Bottom-up innovationFollower participation plays a vital role in learning to create innovation.42[21]
Competitive AdvantageCompetitive advantage is the ability to analyze the organization’s tangible and intangible resources internally within the framework of valuable, rare, inimitable, and non-substitutable resources [11,12].1. Valuablea. Future business-related competenciesSME understands changes related to future competition.43[19]
b. Competency gap managementSME has managed to anticipate changes in strategy for business activities for the next three years.44[19]
2. Rarea. Specific industry competenciesIn practice, employee roles differ based on the organizational structure.45[19]
b. Specific technical competenciesSME has a set of technical competencies in their business activities.46, 47[19]
c. Specific functional competenciesSME has specific industry competencies related to their business activities.48[19]
3. Inimitablea. Unique competenciesSME has product characteristics that are difficult for competitors to imitate.49[19]
b. Insurmountable internal capabilitiesSME has internal capabilities to solve problems quickly.50[19]
c. Robust competency build-upSME is competent in building organizations.51[19]
4. Non-Substitutablea. Unique ProductSME has unique products that competitors cannot replace.52, 53[19]
b. Unique marketing plansSME has a unique marketing technique.54[19]
Table 3. Demographic Info of Respondents Based on SME Location.
Culinary SMEs (N)Proportion (%)Craft SMEs (N)Proportion (%)
SexMale16959.723947.56
Female11440.284352.44
Age<354114.491214.63
35–5020572.442935.37
>503713.074150.00
EducationElementary School-Junior High School93.1856.10
High School23783.756781.71
Bachelor’s Degree-Doctoral Degree3713.071012.20
LocationSamarinda Ilir3311.6644.88
Samarinda Utara3311.661417.07
Samarinda Ulu3913.781315.85
Sungai Kunjang 3713.0767.32
Samarinda Seberang176.011619.51
Palaran165.6567.32
Sambutan3110.9533.66
Sungai Pinang4014.1367.32
Samarinda Kota144.95910.98
Loa Janan Ilir238.1356.10
Table 4. Descriptive Analysis.
VariableNMinimumMaximumMeanStd. Deviation
Social Capital3651.1223.5892.5050.653
Organizational Health3651.2814.5833.4620.799
Competitive Advantage3651.4794.7713.3550.799
Table 5. Descriptive Statistics of Respondents’ Answers.
VariableDimensionItemsSumMeanS.D **Likert Scale Points
1.Prop. *2.Prop. *3.Prop. *4.Prop. *5.Prop. *
Social CapitalRelationalWe exchange information with our partners.11673.200.98246.6%5515.1%13035.6%13737.5%195.2%
Our partners are partners we really trust.10352.841.215815.9%8723.8%11832.3%6116.7%4111.2%
Our partners always assist when we need it.9942.721.055114.0%10328.2%11732.1%8423.0%102.7%
We always maintain good communication with our partners.9042.481.077921.6%10428.5%12233.4%4913.4%113.0%
We try to fulfill our partner’s request as a form of remuneration.7081.940.9514640.0%12133.2%7620.8%184.9%41.1%
Our relationship with our partners is very close to the personal level.6111.670.8820756.7%8222.5%6417.5%123.3%00.0%
StructuralThose who help with our business activities are mostly friends or family.13533.711.23287.7%4211.5%5214.2%13035.6%11331.0%
Those who help our business activities are mostly acquaintances, volunteers, or private institutions.7131.950.9614439.5%12434.0%7019.2%246.6%30.8%
Those that help our business activities are mostly government offices or banks.5871.610.8421759.5%8423.0%5414.8%102.7%00.0%
CognitiveWe understand that our partnership relationship has a common goal.12593.451.13287.7%4512.3%8623.6%14740.3%5916.2%
We understand we share the same ambitions as our partners.10732.941.184712.9%9225.2%9526.0%9826.8%339.0%
We understand the needs of our partners.9632.641.064712.9%13436.7%10929.9%5414.8%215.8%
We understand that our partnership relationship results in shared rules, values, or norms.8172.241.009927.1%12734.8%9626.3%3910.7%41.1%
We understand that our partners have business practices similar to ours.6811.870.9416144.1%11531.5%6918.9%174.7%30.8%
Organizational HealthDirectionWe have a purpose for why this SME was founded.13503.701.0130.8%4913.4%9225.2%13236.2%8924.4%
We communicate every direction of our business strategy to employees as clearly as possible.12023.291.183710.1%4111.2%12935.3%9425.8%6417.5%
We involve employees in decision-making.12523.431.19287.7%5013.7%10328.2%10528.8%7921.6%
LeadershipLeadership in this SME emphasizes hierarchy to get work done.14053.851.09113.0%369.9%7520.5%11832.3%12534.2%
Leadership in this SME involves employees in carrying out tasks.12943.550.97133.6%318.5%12032.9%14640.0%5515.1%
The leadership in this SME seeks to build a positive environment characterized by a mutually supportive team.12463.411.06195.2%4412.1%13035.6%11130.4%6116.7%
Leaders challenge employees to dare to accept challenging assignments.12423.401.26297.9%6317.3%9826.8%8222.5%9325.5%
Work Culture and ClimateWe seek to create openness in employees to encourage honesty.14323.921.0030.8%349.3%7620.8%12734.8%12534.2%
Employees compete fairly.12353.381.12154.1%7520.5%9726.6%11130.4%6718.4%
We have strict oversight to enforce standards of conduct on all employees.11593.181.12287.7%7119.5%12133.2%9927.1%4612.6%
Employee creativity is not limited to supporting innovation.12183.341.24308.2%6517.8%10428.5%8423.0%8222.5%
AccountabilityEmployees have roles according to their abilities.14704.031.0020.5%328.8%7019.2%11130.4%15041.1%
Our evaluation shows that employees have successfully completed tasks according to their roles.12623.461.13246.6%4412.1%10829.6%11932.6%7019.2%
Employees get rewards according to their performance.11813.241.17287.7%7620.8%9927.1%10629.0%5615.3%
There is a personal relationship between employees and SME based on responsibility.11803.231.294512.3%5916.2%10227.9%8423.0%7520.5%
Coordination and ControlWe conduct employee performance evaluations consistently.15374.210.9430.8%236.3%4412.1%11932.6%17648.2%
We consistently evaluate the achievement of operational targets.13583.721.12226.0%318.5%7019.2%14640.0%9626.3%
We have consistent control over the use of financial resources.12123.321.253710.1%5916.2%9425.8%10027.4%7520.5%
We evaluate compliance with laws or regulations that apply consistently.9332.561.339927.1%9826.8%8021.9%4211.5%4612.6%
CapabilityWe put employees in the right position.15644.281.0551.4%349.3%339.0%7320.0%22060.3%
Employees receive adequate training consistently.9292.551.118423.0%8222.5%12434.0%6618.1%92.5%
MotivationLeaders seek to inspire their employees.15194.161.0151.4%297.9%4311.8%11331.0%17547.9%
We provide opportunities for employees to carry out higher duties.12643.461.314211.5%4512.3%7721.1%10428.5%9726.6%
We can provide financial bonuses to their employees.9462.591.3811431.2%7219.7%6517.8%7721.1%3710.1%
External OrientationWe focus on customer satisfaction.15974.380.9451.4%154.1%4311.8%7721.1%22561.6%
We are observant in the face of competition with competitors.9532.611.147320.0%10929.9%7821.4%9726.6%82.2%
Learning and InnovationThe leader plays an essential role in learning to create innovation.15534.250.9871.9%164.4%5114.0%9425.8%19754.0%
Follower participation plays a vital role in learning to create innovation.9782.681.146217.0%10829.6%9826.8%7921.6%184.9%
Competitive AdvantageValuable ResourceWe already have preparations to deal with changes related to competition in the future.15524.250.8910.3%164.4%5715.6%10729.3%18450.4%
We have management anticipate changes in strategy for business activities for the next 3 years.10672.921.305515.1%9726.6%9726.6%5314.5%6317.3%
Rare ResourceWe have an organizational structure.15024.120.9810.3%267.1%7219.7%9726.6%16946.3%
Employees play a role according to their position in the organizational structure.13103.591.11195.2%4512.3%8021.9%14439.5%7721.1%
We have technical competence in our business activities.13023.571.18133.6%6217.0%10227.9%8122.2%10729.3%
Inimitable ResourceWe have specific competencies related to our business activities.14133.871.25246.6%349.3%6718.4%8021.9%16043.8%
We have product characteristics that are difficult for competitors to imitate.12563.440.9920.5%7019.2%11732.1%11732.1%5916.2%
We have in-house capabilities to resolve issues quickly.11823.241.21339.0%6918.9%10528.8%9425.8%6417.5%
We are competent in building organizations to get bigger.11223.071.15369.9%7921.6%11531.5%9225.2%4311.8%
Non-Substitutable ResourceWe have unique product that competitors do not know how to make it. 12453.411.22195.2%8623.6%7119.5%10428.5%8523.3%
We have a unique product that is difficult to be replaced by competitors.10422.851.368122.2%6918.9%9124.9%7019.2%5414.8%
We have unique marketing techniques.7982.191.2715341.9%8423.0%5414.8%5515.1%195.2%
* Prop.: Proportion, ** S.D: Standard Deviation.
Table 6. SEM Assumptions.
AssumptionsResultsConclusion
Sample Size365 samplesFulfilled
Normality TestMultivariate normality 1.627 (<1.96 for research at level 0.05), and Kolmogorov–Smirnov normality test 0.073 (>0.05)Fulfilled
Outlier-FreeThere is data with a Mahalanobis distance of 32.084, but this distance can still be tolerated because multivariate normality is fulfilled. Fulfilled
Multicollinearity TestMulticollinearity test tolerance value > 0.10, 0.229, and VIF value < 10.0, 4.364 on collinearity statistics.Fulfilled
Source: Processed Primary Data (2023).
Table 7. Factor Validity Test Results.
VariableVariable ConstructSLF *Criteria
Social CapitalCOG ← SC0.899Valid
STR ← SC0.839Valid
REL ← SC0.906Valid
Organizational HealthDIR ← OH0.905Valid
LED ← OH0.910Valid
C ← OH0.862Valid
AC ← OH0.919Valid
CC ← OH0.919Valid
CAP ← OH0.881Valid
MOT ← OH0.891Valid
EO ← OH0.856Valid
LI ← OH0.836Valid
Competitive AdvantageV ← CA0.808Valid
R ← CA0.878Valid
I ← CA0.880Valid
N ← CA0.742Valid
* SLF: Standardized Loading Factor. Source: Processed Primary Data (2023).
Table 8. Factor Reliability Test Results.
VariableC.RAVECriteria
Social CapitalCOG ← SC0.899Reliable
Organizational HealthLI ← OH0.836Reliable
Competitive AdvantageN ← CA0.742Reliable
Source: Processed Primary Data (2023).
Table 9. Structural Equation of Path Diagram Conversion.
Social CapitalOrganizational HealthCompetitive Advantage
REL = λ1 SC + ε1
STR = λ1 SC + ε2
COG = λ1 SC + ε3
DIR = λ1 OH + ε4
LED = λ1 OH + ε5
C = λ1 OH + ε6
AC = λ1 OH + ε7
CC = λ1 OH + ε8
CAP = λ1 OH + ε9
MOT = λ1 OH + ε10
EO = λ1 OH + ε11
V = λ1 CA + ε13
R = λ1 CA + ε14
I = λ1 CA + ε15
N = λ1 CA + ε16
LI = λ1 OH + ε12
Table 10. Goodness of Fit Index in the First Modeling.
GoFICut of ValueValueCriteria
CMIN/DF1.00 ≤ CMIN/df ≤ 3.005.606Unfit
Goodness of Fit Index (GFI)≥0.800.843Fit
Root Mean Square (RMS)≤0.050.022Fit
Root Mean Square Error of Approximation (RMSEA)0.05 ≤ RMSEA ≤ 0.080.112Unfit
Adjusted Goodness of Fit Index (AGFI)≥0.900.789Unfit
Normal Fit Index (NFI)≥0.900.923Fit
Tucker–Lewis Index (TLI)≥0.800.935Fit
Comparative Fit Index (CFI)≥0.900.935Fit
Incremental Fit Index ≥0.900.936Fit
Parsimony Fit Measure (PNFI)0.50–1.000.777Fit
Parsimonious Goodness of Fit Index (PGFI)0.50–1.000.626Fit
Table 11. Goodness of Fit After Modification Indices.
GoFICut of ValueValueCriteria
CMIN/DF1.00 ≤ CMIN/df ≤ 3.003.316Marginal Fit
Goodness of Fit Index (GFI)≥0.800.926Fit
Root Mean Square (RMR)≤0.050.015Fit
Root Mean Square Error of Approximation (RMSEA)0.05 ≤ RMSEA ≤ 0.080.080Fit
Adjusted Goodness of Fit Index (AGFI)≥0.900.876Marginal Fit
Normal Fit Index (NFI)≥0.900.965Fit
Tucker-Lewis Index (TLI)≥0.800.963Fit
Comparative Fit Index (CFI)≥0.900.975Fit
Incremental Fit Index ≥0.900.975Fit
Parsimony Fit Measure (PNFI)0.50–1.000.661Fit
Parsimonious Goodness of Fit Index (PGFI)0.50–1.000.555Fit
Table 12. Difference in Value of Standardized Regression Weight.
VariableStandardized Regression WeightNON-CLFCLFΔ
REL ← SC0.90410.096
Social CapitalSTR ← SC0.8461.0160.170
COG ← SC0.9110.9440.033
Organizational HealthDIR ← OH0.92810.072
LED ← OH0.9031.1020.199
C ← OH0.9241.0890.165
AC ← OH0.9191.1060.187
CAP ← OH0.8801.0630.183
MOT ← OH0.9151.0420.127
EO ← OH0.8561.0020.146
LI ← OH0.8711.070.199
Competitive AdvantageV ← CA0.80710.193
R ← CA0.8791.0380.159
I ← CA0.8590.9830.124
N ← CA0.7140.9050.191
Table 13. Hypothesis Test of the Partial Effect of Social Capital and Organizational Health on Competitive Advantage.
HypothesisC.RValueCriteria
Hypothesis 14.2450.000Accepted
Hypothesis 26.4420.000Accepted
Table 14. Hypothesis Test of the Simultaneous Effect of Social Capital and Organizational Health on Competitive Advantage.
VariableR-Square
Competitive Advantage (CA)0.956
Disclaimer/Publisher’s Note: The statements, opinions and data contained in all publications are solely those of the individual author(s) and contributor(s) and not of MDPI and/or the editor(s). MDPI and/or the editor(s) disclaim responsibility for any injury to people or property resulting from any ideas, methods, instructions or products referred to in the content.

