Article

Storage Time Detection of Torreya grandis Kernels Using Near Infrared Spectroscopy

1
College of Optical, Mechanical and Electrical Engineering, Zhejiang A&F University, Hangzhou 311300, China
2
College of Chemical and Material Engineering, Zhejiang A&F University, Hangzhou 311300, China
*
Author to whom correspondence should be addressed.
Sustainability 2023, 15(10), 7757; https://doi.org/10.3390/su15107757
Submission received: 9 April 2023 / Revised: 4 May 2023 / Accepted: 8 May 2023 / Published: 9 May 2023
(This article belongs to the Special Issue Sustainable Technology in Agricultural Engineering)

Abstract

:
To achieve the rapid identification of Torreya grandis kernels (T. grandis kernels) with different storage times, the near infrared spectra of 300 T. grandis kernels with storage times of 4~9 months were collected. The collected spectral data were modeled, analyzed, and compared using unsupervised and supervised classification methods to determine the optimal rapid identification model for T. grandis kernels with different storage times. The results indicated that principal component analysis (PCA) after derivative processing enabled the visualization of spectral differences and achieved basic detection of samples with different storage times under unsupervised classification. However, it was unable to differentiate samples with storage times of 4~5 and 8~9 months. For supervised classification, the classification accuracy of support vector machine (SVM) modeling was found to be 97.33%. However, it still could not detect the samples with a storage time of 8~9 months. The classification accuracy of linear discriminant analysis after principal component analysis (PCA-DA) was found to be 99.33%, which enabled the detection of T. grandis kernels with different storage times. This research showed that near-infrared spectroscopy technology could be used to achieve the rapid detection of T. grandis kernels with different storage times.

1. Introduction

Torreya grandis are mainly distributed in the Kuaiji’s mountain and Tianmu mountain regions of Zhejiang Province, the Huangshan region of Anhui Province, the mountainous region of southern Fujian Province, the northeastern region of Jiangxi Province, and the western region of Hunan Province, China [1]. T. grandis kernels contain a range of nutrient-rich and medicinally valuable components, including protein, vitamins, flavonoids, and oleic acid [2]. T. grandis kernels are highly sought after for their rich nutrients and unique taste [3]. During the storage of T. grandis kernels, nutrients are lost as time goes by, and prolonged storage could accelerate the loss of moisture and even lead to quality problems such as oxidation and decay, which could affect the internal quality and taste of T. grandis kernels [4]. Chemical indicators of T. grandis kernels such as moisture, protein, and fat show significant differences with different storage times [5]. T. grandis kernels have a high value as both a food and medicinal herb [6]. T. grandis kernels contain relatively rich fat and protein, and are extremely prone to dampness, breeding bacteria, and other harmful microorganisms, resulting in Torreya mildew and long insects. In addition, T. grandis kernels in the shell are much shorter than those that are unshelled. Because T. grandis kernels have no outer shell to protect them, and their flesh is in direct contact with the air, they are more prone to mildew and can only be kept for about 3~9 months. The detection of storage time for T. grandis kernels was deemed necessary in order to ensure their quality and safety, and to prevent resource wastage resulting from expired T. grandis kernels [7]. This could help producers better control the storage time of the chestnuts [8]. Therefore, the detection of the storage time of T. grandis kernels is of great significance.
The traditional methods of testing the storage time of nuts include observation of appearance of the appearance of nuts, if there is deterioration, discoloration, or they are moth-eaten and other problems, it indicates that they have expired or the quality has declined and should not be eaten. Listening to their sound can also be used: shaking the nuts and listening to the sound they make [9]. If the sound is crisp and resounding, it indicates good quality; otherwise, it indicates low quality. The smell of the nuts can also be an indicator. If there is a musty or spoiled odor, etc., it indicates that the nut has expired and should not be eaten. the taste the taste of nuts is also an indicator: if they feel too hard, soft, greasy taste, or other problems, such as spoilage or being moth-eaten. These methods, while simple, are not accurate enough to ensure accurate nut storage times.
The near-infrared spectroscopy technology, as a fast and non-destructive detection technique, could analyze samples without damaging them. Therefore, there is no need to use harmful chemicals or treat samples, effectively reducing environmental pollution. This technology could perform analyses in a short time that does not consume a large amount of energy, thus reducing the environmental burden. Currently, near-infrared spectroscopy detection technology has been widely applied in research on storage time and quality detection of various types of foods [10]. Vis/NIR spectroscopy was employed to evaluate the quality changes in walnut kernels with different storage times. In the study. the spectral information was preprocessed using second-order derivatives and it was demonstrated that the PLSR processing had promising potential for distinguishing between spoiled and fresh walnut kernels stored for different periods, achieving an accuracy of 87%. This finding suggests that Vis/NIR spectroscopy could be an effective method for detecting quality changes in walnut kernels over time [11]. In a previous study, NIR hyperspectral imaging was employed to distinguish between Spanish and Chinese pine nut varieties. After applying SIMCA modeling, a model identification accuracy ranging from 84% to 100% was achieved [12]. NIR spectroscopy was used to collect wheat samples from 2007–2012 for the determination of their storage time. The results of the study showed that the SIMCA classification method could accurately classify adjacent years up to 97.05% using a dichotomous classification approach [13]. The above results demonstrate the feasibility of using NIR spectroscopy for the rapid detection of T. grandis kernels with different storage times.
The present study was conducted on T. grandis kernels in Zhejiang Province. NIR spectroscopy was utilized to develop models for the discriminative analysis of T. grandis kernels with different storage times. This study is of great importance to improvement in the quality of T. grandis kernels and standardizing the development of the relevant industries. This experiment aimed to determine the storage time of T. grandis kernels in a sustainable manner, reducing resource consumption and environmental damage, ensuring the sustainability of resources and the environment for future generations, protecting and restoring natural ecosystems, and maintaining ecological balance.

2. Materials and Methods

2.1. Sample Preparation

T. grandis kernels used in the experiment were purchased from local farmers in Zhandai Village, Zhuji City, Zhejiang Province, China, and they were harvested at the end of September 2021. Fifty T. grandis kernel samples were randomly selected every month from February to June 2022, and a total of 300 samples were collected. The shell was manually removed and the T. grandis kernels were ground into powder with a mortar. Prior to storage, the T. grandis kernels needed to be stored in a damp-resistant, ventilated, and sealed package to prevent moisture and odor intrusion. The temperature was kept between 8 °C and 15 °C. High temperature could cause the T. grandis kernels to degrade, while low temperature could cause the T. grandis kernels to become moist, which would affect the quality of the T. grandis kernels. In order to prevent T. grandis kernels from losing water, some desiccant, such as silica gel, was put in a sealed bag to absorb moisture. These samples were stored for 4~9 months, after which they were taken out for spectral data collection.

2.2. Acquisition of Spectral Data

The test instrument used in this study was a SmartEye 1700 portable NIR spectrometer (FireEye Golden Eye Co., Hangzhou, China). The instrument had a wavelength range from 1000 to 1650 nm, with a sampling interval of 1 nm. The light source was a double integrated vacuum tungsten lamp (Rays Lighting Co., Huizhou, China), and the detector was a 128-line source uncooled In Ga As diode array. During the acquisition of the spectra, the laboratory temperature was maintained at 23 °C, and the humidity was maintained at 55%. The portable NIR spectrometer was preheated for 30 min before spectral acquisition to ensure the accuracy of the NIR spectrum. Diffuse reflectance was used in this experiment, and a 100% Spectralon TM standard whiteboard was used as a background. The average number of scans was set to 50, and integration time was set to 12.7 ms with a resolution of 8 cm −1. The ground T. grandis kernel samples were placed in the sampling window area, and were taken while ensuring that the light source illuminated the samples vertically. The spectra were collected three times for each sample at different locations and averaged to minimize experimental errors that may be caused by improper handling.

2.3. Classification Model Building

2.3.1. Principal Component Analysis (PCA)

Principal component analysis (PCA) is a common method used for dimensionality reduction of high-dimensional data [9]. The spectral data are normalized and feature vectors are extracted through PCA [14]. The most significant principal components are selected to remove redundancies and noise from the spectral data [15]. The PCA model is an unsupervised classification method and does not require sample delineation [16]. The spectral data of T. grandis kernels with different storage time were pre-processed using the Normalization, 1-Der, 2-Der, Baseline, and standard normal variate (SNV) methods. Then, the principal PCA modeling based on pre-processed data was established to differentiate between the different storage times of T. grandis kernels.

2.3.2. Support Vector Machine (SVM)

The support vector machine (SVM) is capable of effectively classifying data in high-dimensional spaces, capturing key samples and weeding out a large number of redundant samples [17]. It is widely used in statistical classification and regression analysis due to its simple algorithms and good performance [18]. As a type of supervised classification, SVM requires selecting training samples [19]. Kennard–Stone (K–S) and SPXY sampling are common methods used for sample classification [20]. Since only spectral data were used to analyze the storage times of T. grandis kernels, the K–S classification method was chosen in this study, and was based on the difference in euclidean distance between spectra, and the sample with the largest euclidean distance was divided into the calibration set. Compared with the random classification method, it effectively improves the homogeneity of the sample distribution [21]. The collected spectral data of T. grandis kernels were divided into calibration and validation sets at a ratio of 3:1 using the K–S classification method. Four kernel tricks including linear, polynomial, RBF, and sigmoid kernels were used for constructing SVM models. After selecting the kernel trick, various preprocessing methods were applied to improve the accuracy of the classification model.

2.3.3. Linear Discriminant Analysis after Principal Component Analysis (PCA-DA)

Linear discriminant analysis (LDA) is used to project high-dimensional spectral data into a low-dimensional space, with similar data clustered together and dissimilar data separated [22]. LDA is a supervised classification method that aims to achieve a classification effect by projecting data points of the same category closer together in the projection space [23]. However, LDA has limitations in terms of the number of variables, which cannot be higher than the sample size. Therefore, to overcome this limitation, dimension reduction through PCA was used. LDA has three modeling methods: linear, quadratic, and Mahalanobis. To identify the optimal model for the detection of different storage times of T. grandis kernels, the spectral data were first subjected to dimension reduction using PCA to select the main components, then the LDA was applied to the spectral data.

3. Results and Discussion

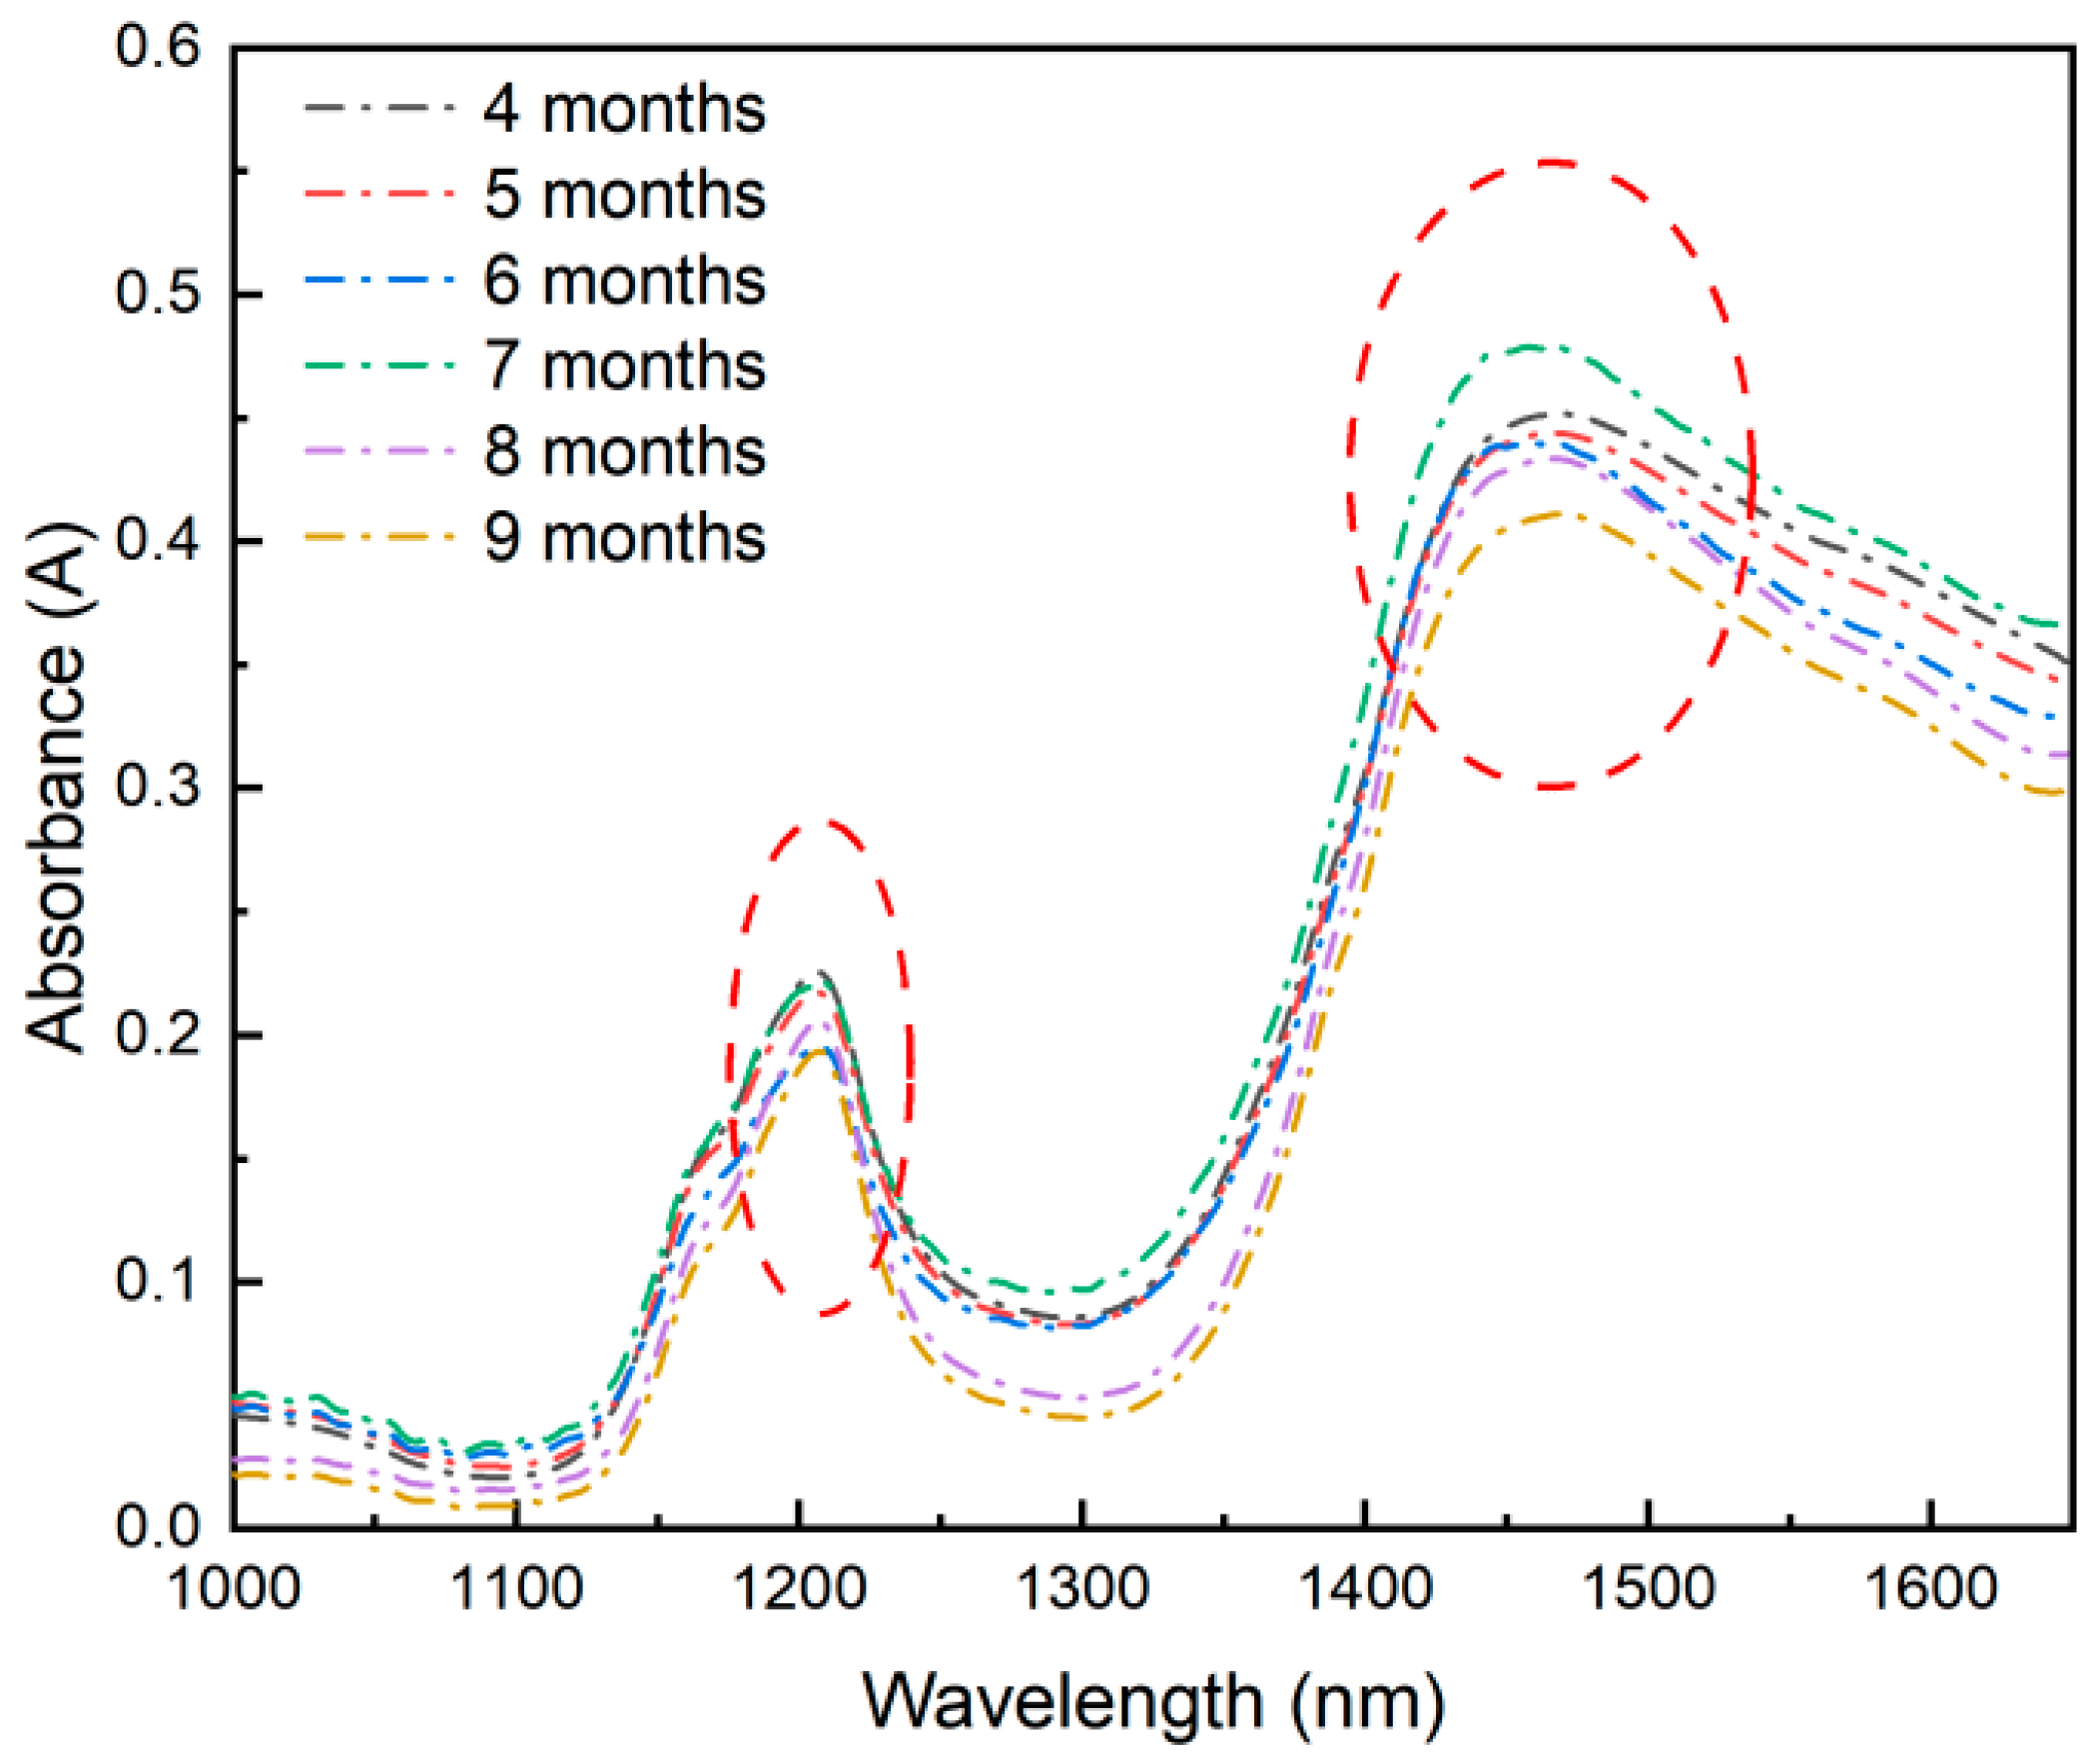
3.1. Near-Infrared Spectral Analysis

The average spectra of T. grandis kernels samples stored for 4~9 months are presented in Figure 1. With a spectral interval ranging from around 1000 to 1600 nm, a peak at 1200 nm represented the fat in T. grandis kernels [24]. The absorbance of the NIR spectra decreased rapidly when the storage time increased from around 7 to 9 months, which was possibly due to the decrease in unsaturated fatty acid caused by long storage time. The peak at 1450 nm represented the protein in T. grandis kernels [25]. Its absorbance decreased uniformly with increasing storage time, indicating a relatively uniform reduction in protein. In general, the absorbance of NIR spectra of T. grandis kernels decreased gradually with increasing storage time. However, the differences between NIR spectral curves of T. grandis kernels with different storage times were not significant. Thus, distinguishing T. grandis kernels at different storage times solely from the spectra was difficult, and it was necessary to use chemometric software to analyze and process the spectral data to establish a detection model of T. grandis kernels with different storage times.

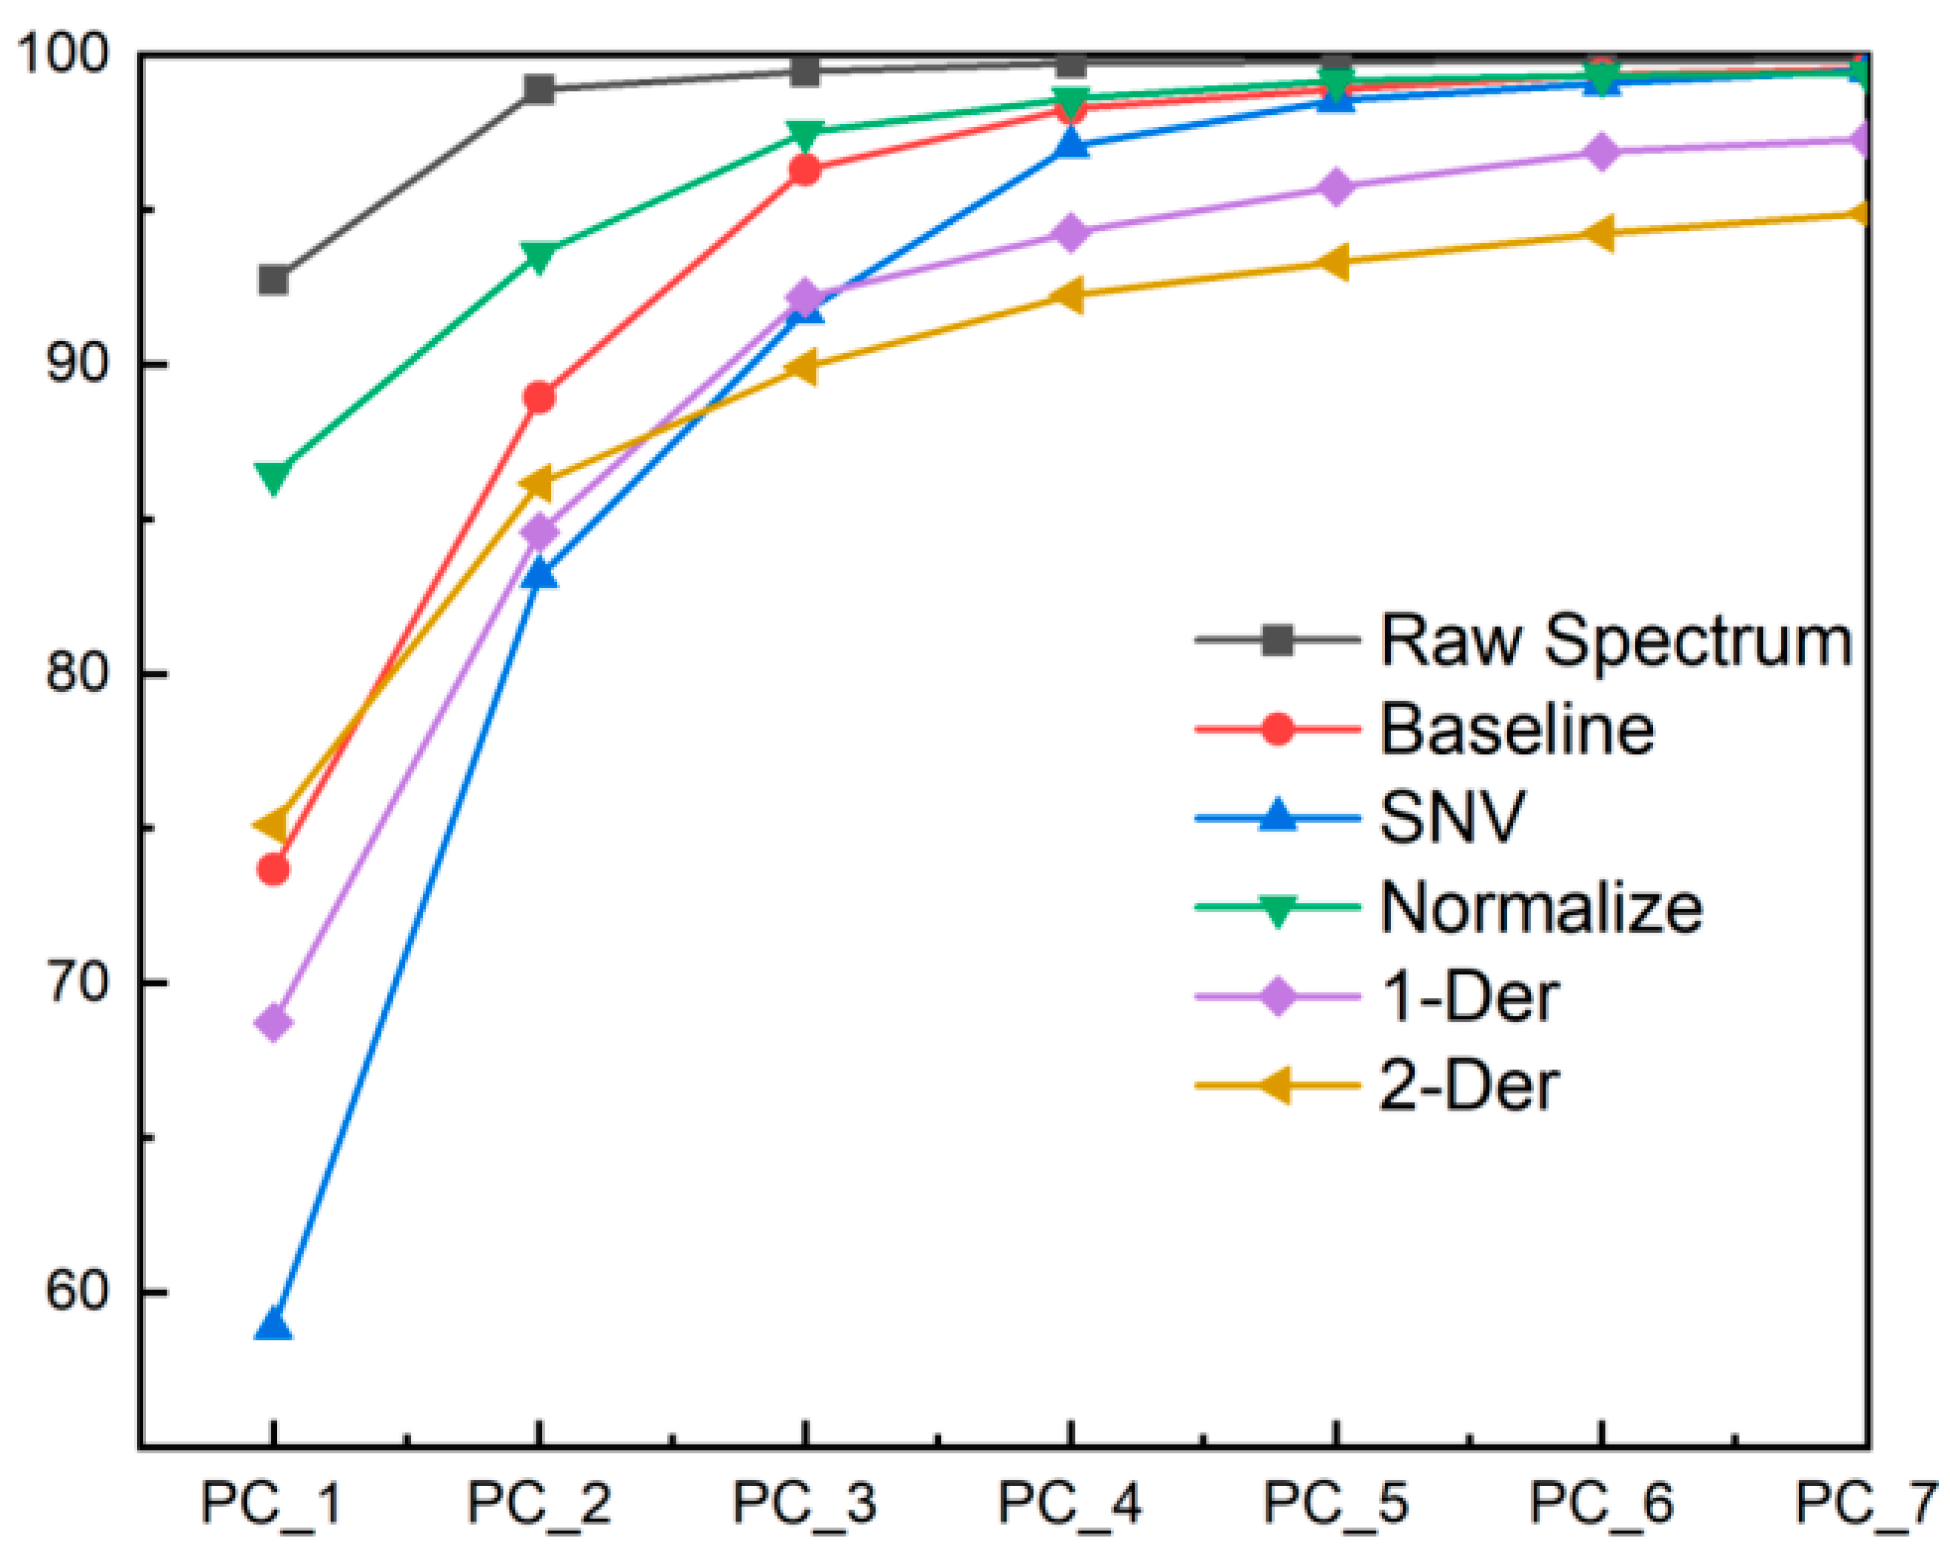
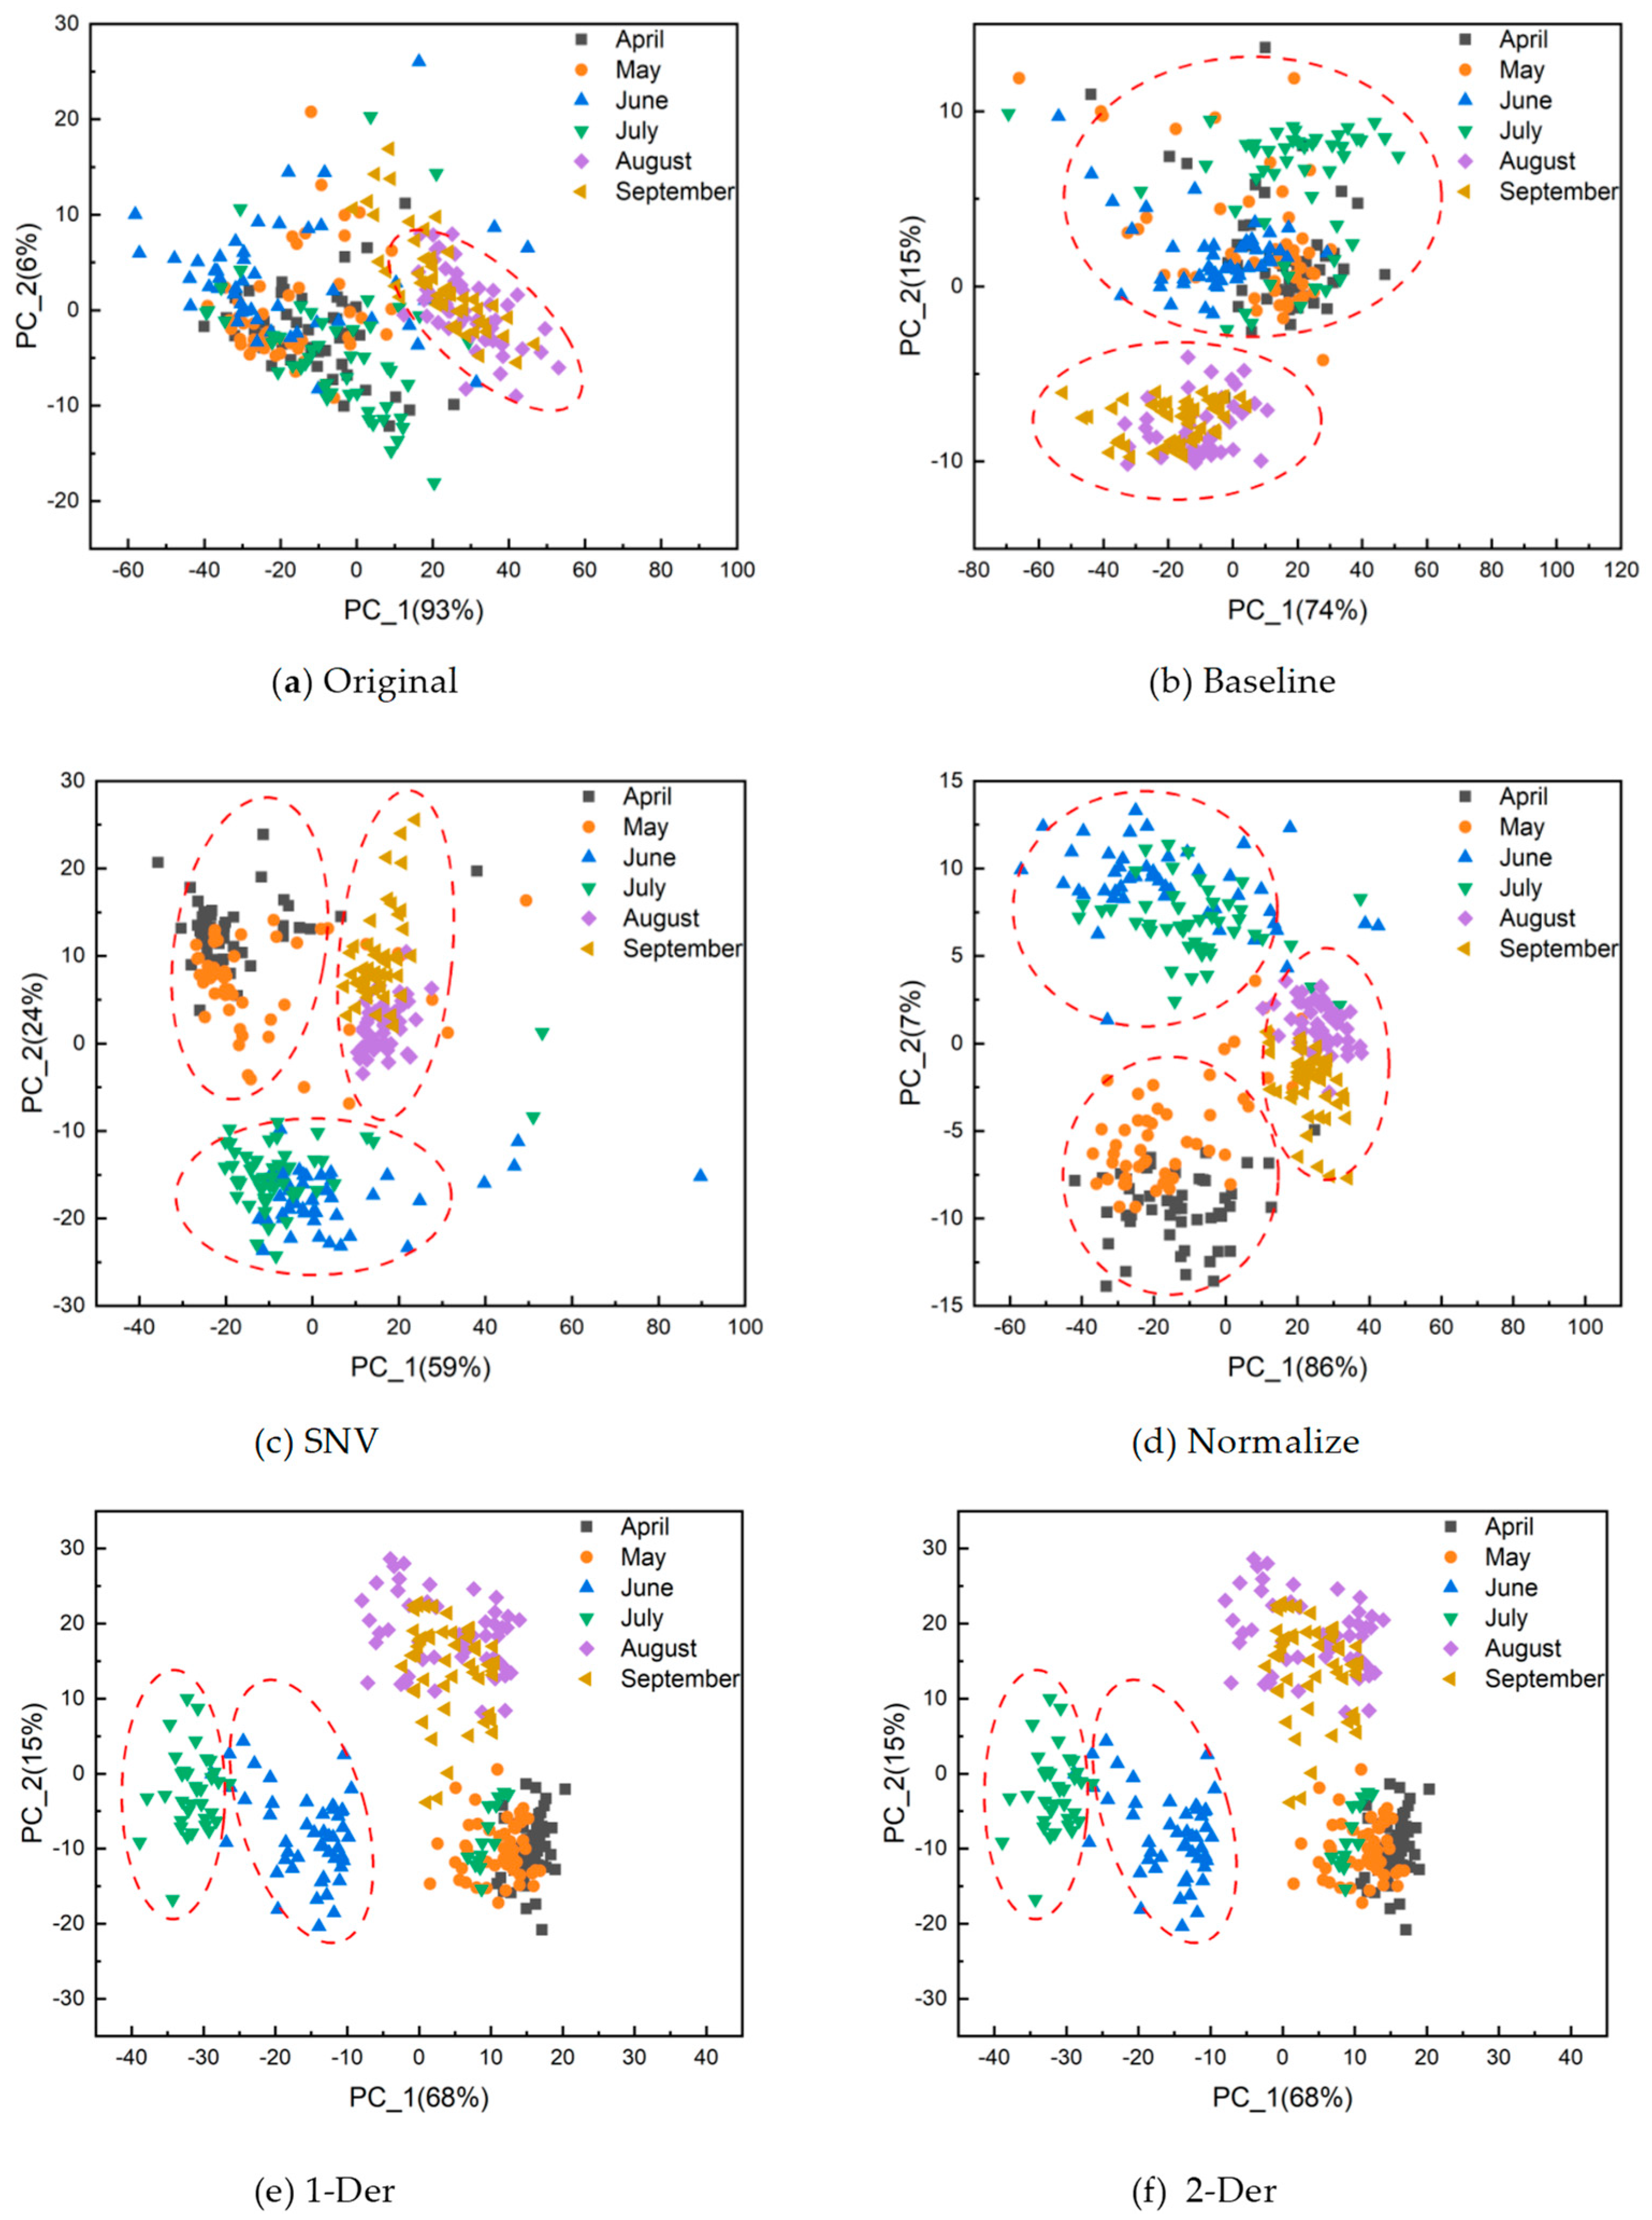
3.2. Principal Component Analysis (PCA) Model

Dimension reduction was performed on the near-infrared spectral data of T. grandis kernels, and the cumulative contribution rate of the principal components was depicted in Figure 2. It was found that the first seven principal components contained almost all of the information of the samples. In addition, the contribution rates of the original spectrum and pre-processed spectra for the first two principal components exceeded 80%. Although PC3 and PC4 could have been used for visualization purposes, in our general data analysis, the majority of the data variance was already explained by PC1 and PC2.
The first and second principal components were used for plotting the results of the PCA, and the classification results are presented in Figure 3. Almost all of the T. grandis kernel samples were mixed together, making it difficult to discriminate according to the original spectrum (Figure 3a). However, the samples with storage times of 8~9 months were more cohesive, indicating that spectral differences were more evident when T. grandis kernels were stored for 8~9 months. After Baseline processing (Figure 3b), the classification results were not significantly improved, and only two storage periods (4~7 months and 8~9 months) could be distinguished. After standard normal variate (SNV) (Figure 3c) and Normalize (Figure 3d) preprocessing, although some samples with a storage time of five months were slightly adulterated with a storage time of 8~9 months, the storage times of samples were divided into three different sets of 4~5 months, 6~7 months, and 8~9 months. The best results were obtained after 1-Der (Figure 3e) and 2-Der (Figure 3f) processing, and the storage times of samples were divided into four different sets of 4~5 months, 6 months, 7 months, and 8~9 months.
The results showed that the PCA model with spectral preprocessing was only able to divide T. grandis kernel samples into four different sets of 4~5 months, 6 months, 7 months, and 8~9 months. It was impossible to distinguish samples with storage times of four and five months, and eight and nine months. In general, the differentiation results obtained by PCA alone could only achieve partial storage time distinction. To improve the classification accuracy of the samples with storage times of 4~5 months and 8~9 months, SVM and LDA models were established to obtain better results. Visible/near-infrared (Vis/NIR) spectroscopy was used to rapidly determine the storage time of Fuji apples. The raw spectral data and SNR feature values were analyzed using PCA, and the apple samples were successfully differentiated using PCA and SNR spectra. Therefore, Vis/NIR spectroscopy is effective for the rapid discrimination of the storage time of Fuji apples [26]. NIR spectroscopy was also used to discriminate the authenticity of extra virgin olive oil (EVOO). PCA and redundancy analysis (RDA) techniques were used to qualitatively or quantitatively verify the authenticity of olive oil, predicting the percentage of EVOO in mixed oil or pure EVOO. The results showed the potential of RDA factors for predicting and classifying, significantly improving the calibration and validation results obtained from the PCA factors [27].

3.3. Support Vector Machine (SVM) Model

The support vector machine (SVM) models for T. grandis kernels were developed using four kernel tricks: linear, polynomial, RBF, and sigmoid kernels. The SVM models were established by the 180 original spectra samples which were obtained from the calibration set, and the models were validated using 120 samples which were obtained from the validation set. The results of these models are shown in Table 1. It can be seen that the SVM models with polynomial, RBF, and Sigmoid kernels had classification accuracies of less than 50%, while that of the linear kernel had a classification accuracy of more than 80%, which indicates a better classification accuracy for T. grandis kernel samples. Therefore, the linear kernel was chosen as the modeling approach for support SVM.
The classification results of the SVM model under different preprocessing methods are presented in Table 2. After undergoing MSC processing, little change was shown in the model’s classification accuracy compared to the original spectrum, indicating that the SVM classification was not affected by this preprocessing method. However, after Normalize and Baseline preprocessing, the model’s classification accuracy improved by more than 90%. The best classification results were obtained after 1-Der preprocessing, with the model’s training accuracy, validation accuracy, and prediction accuracies being 98.89%, 97.50%, and 97.33%, respectively. The spectra after 1-Der preprocessing eliminated irrelevant variables’ interference and retained the feature variables, leading to a significant improvement in the classification accuracy.
The confusion matrix depicting the SVM model classification results was presented in Figure 4. Compared with that of PCA model, the prediction result of the SVM model was significant improved. For the samples with a storage time of 4~5 months, only one sample with a storage time of 5 months was misclassified as having a storage time of 4 months. For the samples with a storage time of 8~9 months, only three samples with a storage time of 8 months were misclassified as a storage time of 9 months, and four samples with a storage time of 9 months were misclassified as having a storage time of 8 months. All of the other samples with different storage times were correctly classified. In general, the classification accuracy of the SVM model after 1-Der preprocessing was 97.33%. This model exhibited good classification of T. grandis kernels for all storage times for 4~7 months except for 8 and 9 months. The NIR spectra of four types of bamboo shoots were compared using NIR reflectance technology. It was found that the SVM model with second derivative treatment performed the best. The combination of NIR spectra and the SVM method provides a fast and non-destructive method for the classification of bamboo shoot species [28]. A portable NIR sensor was used to predict the freshness of eggs. The spectral data obtained were processed using different preprocessing methods, and the SVM prediction model was utilized to classify fresh and stale eggs with an accuracy of 87.0% [29].

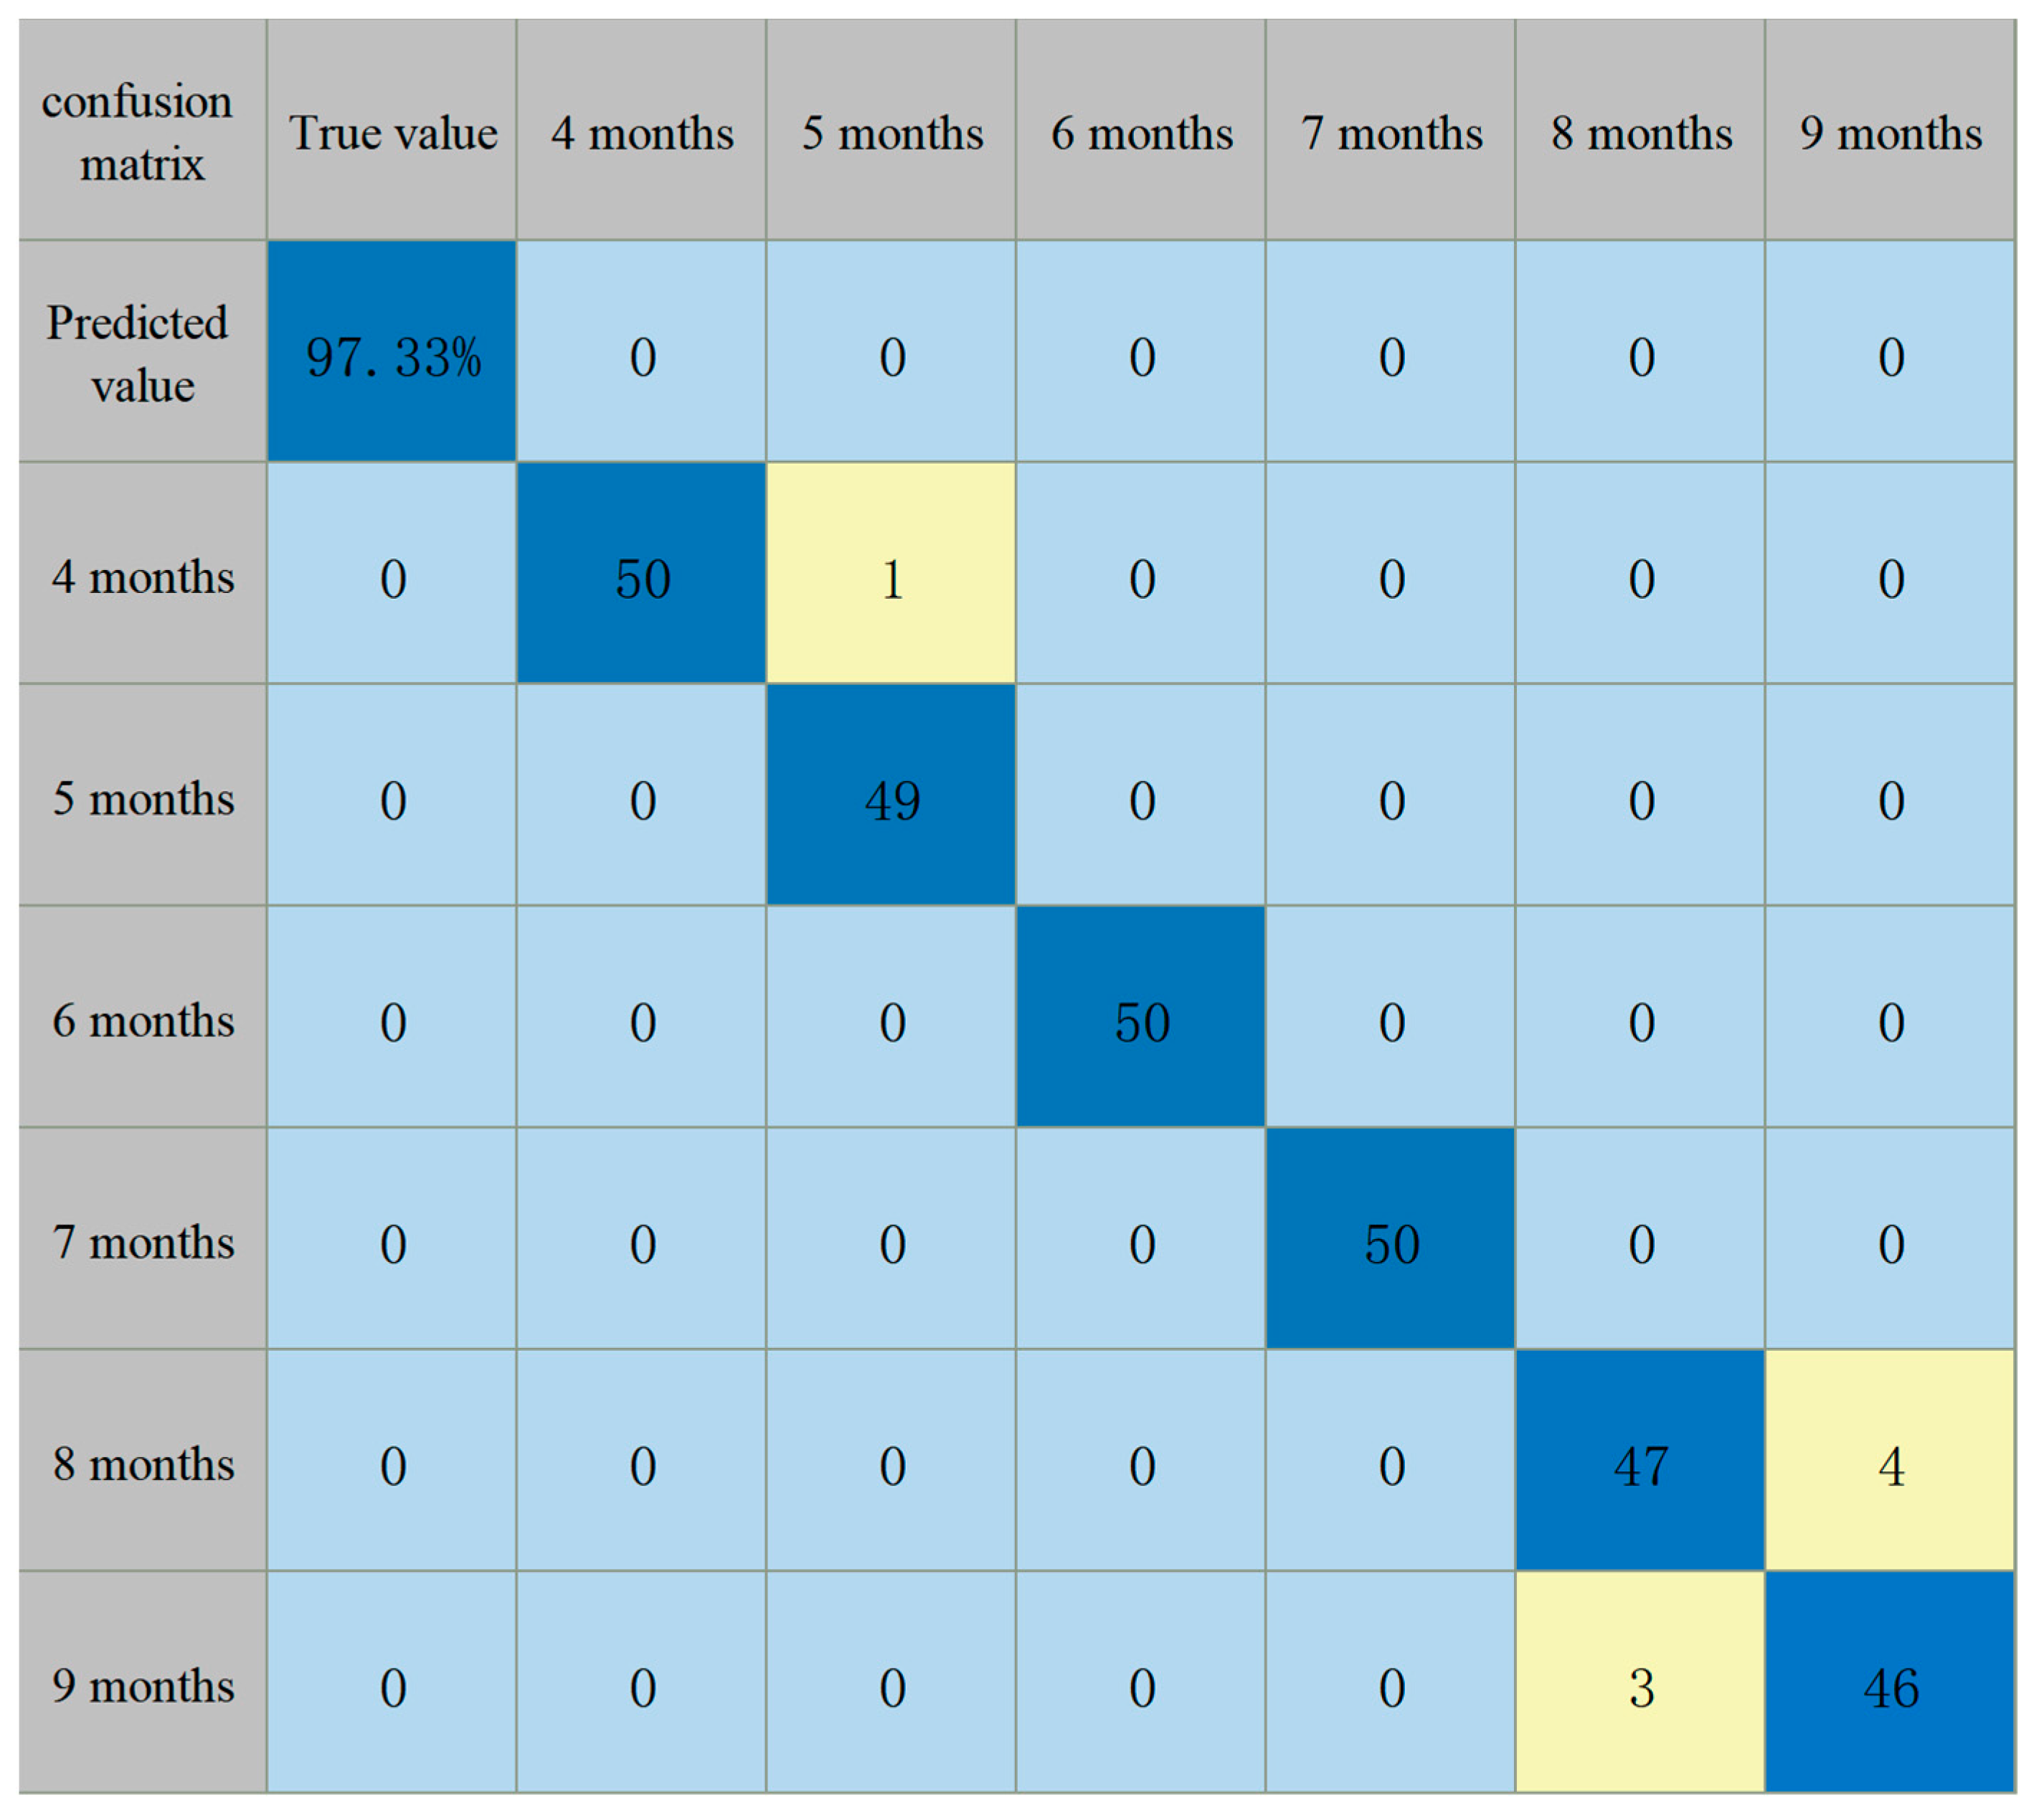
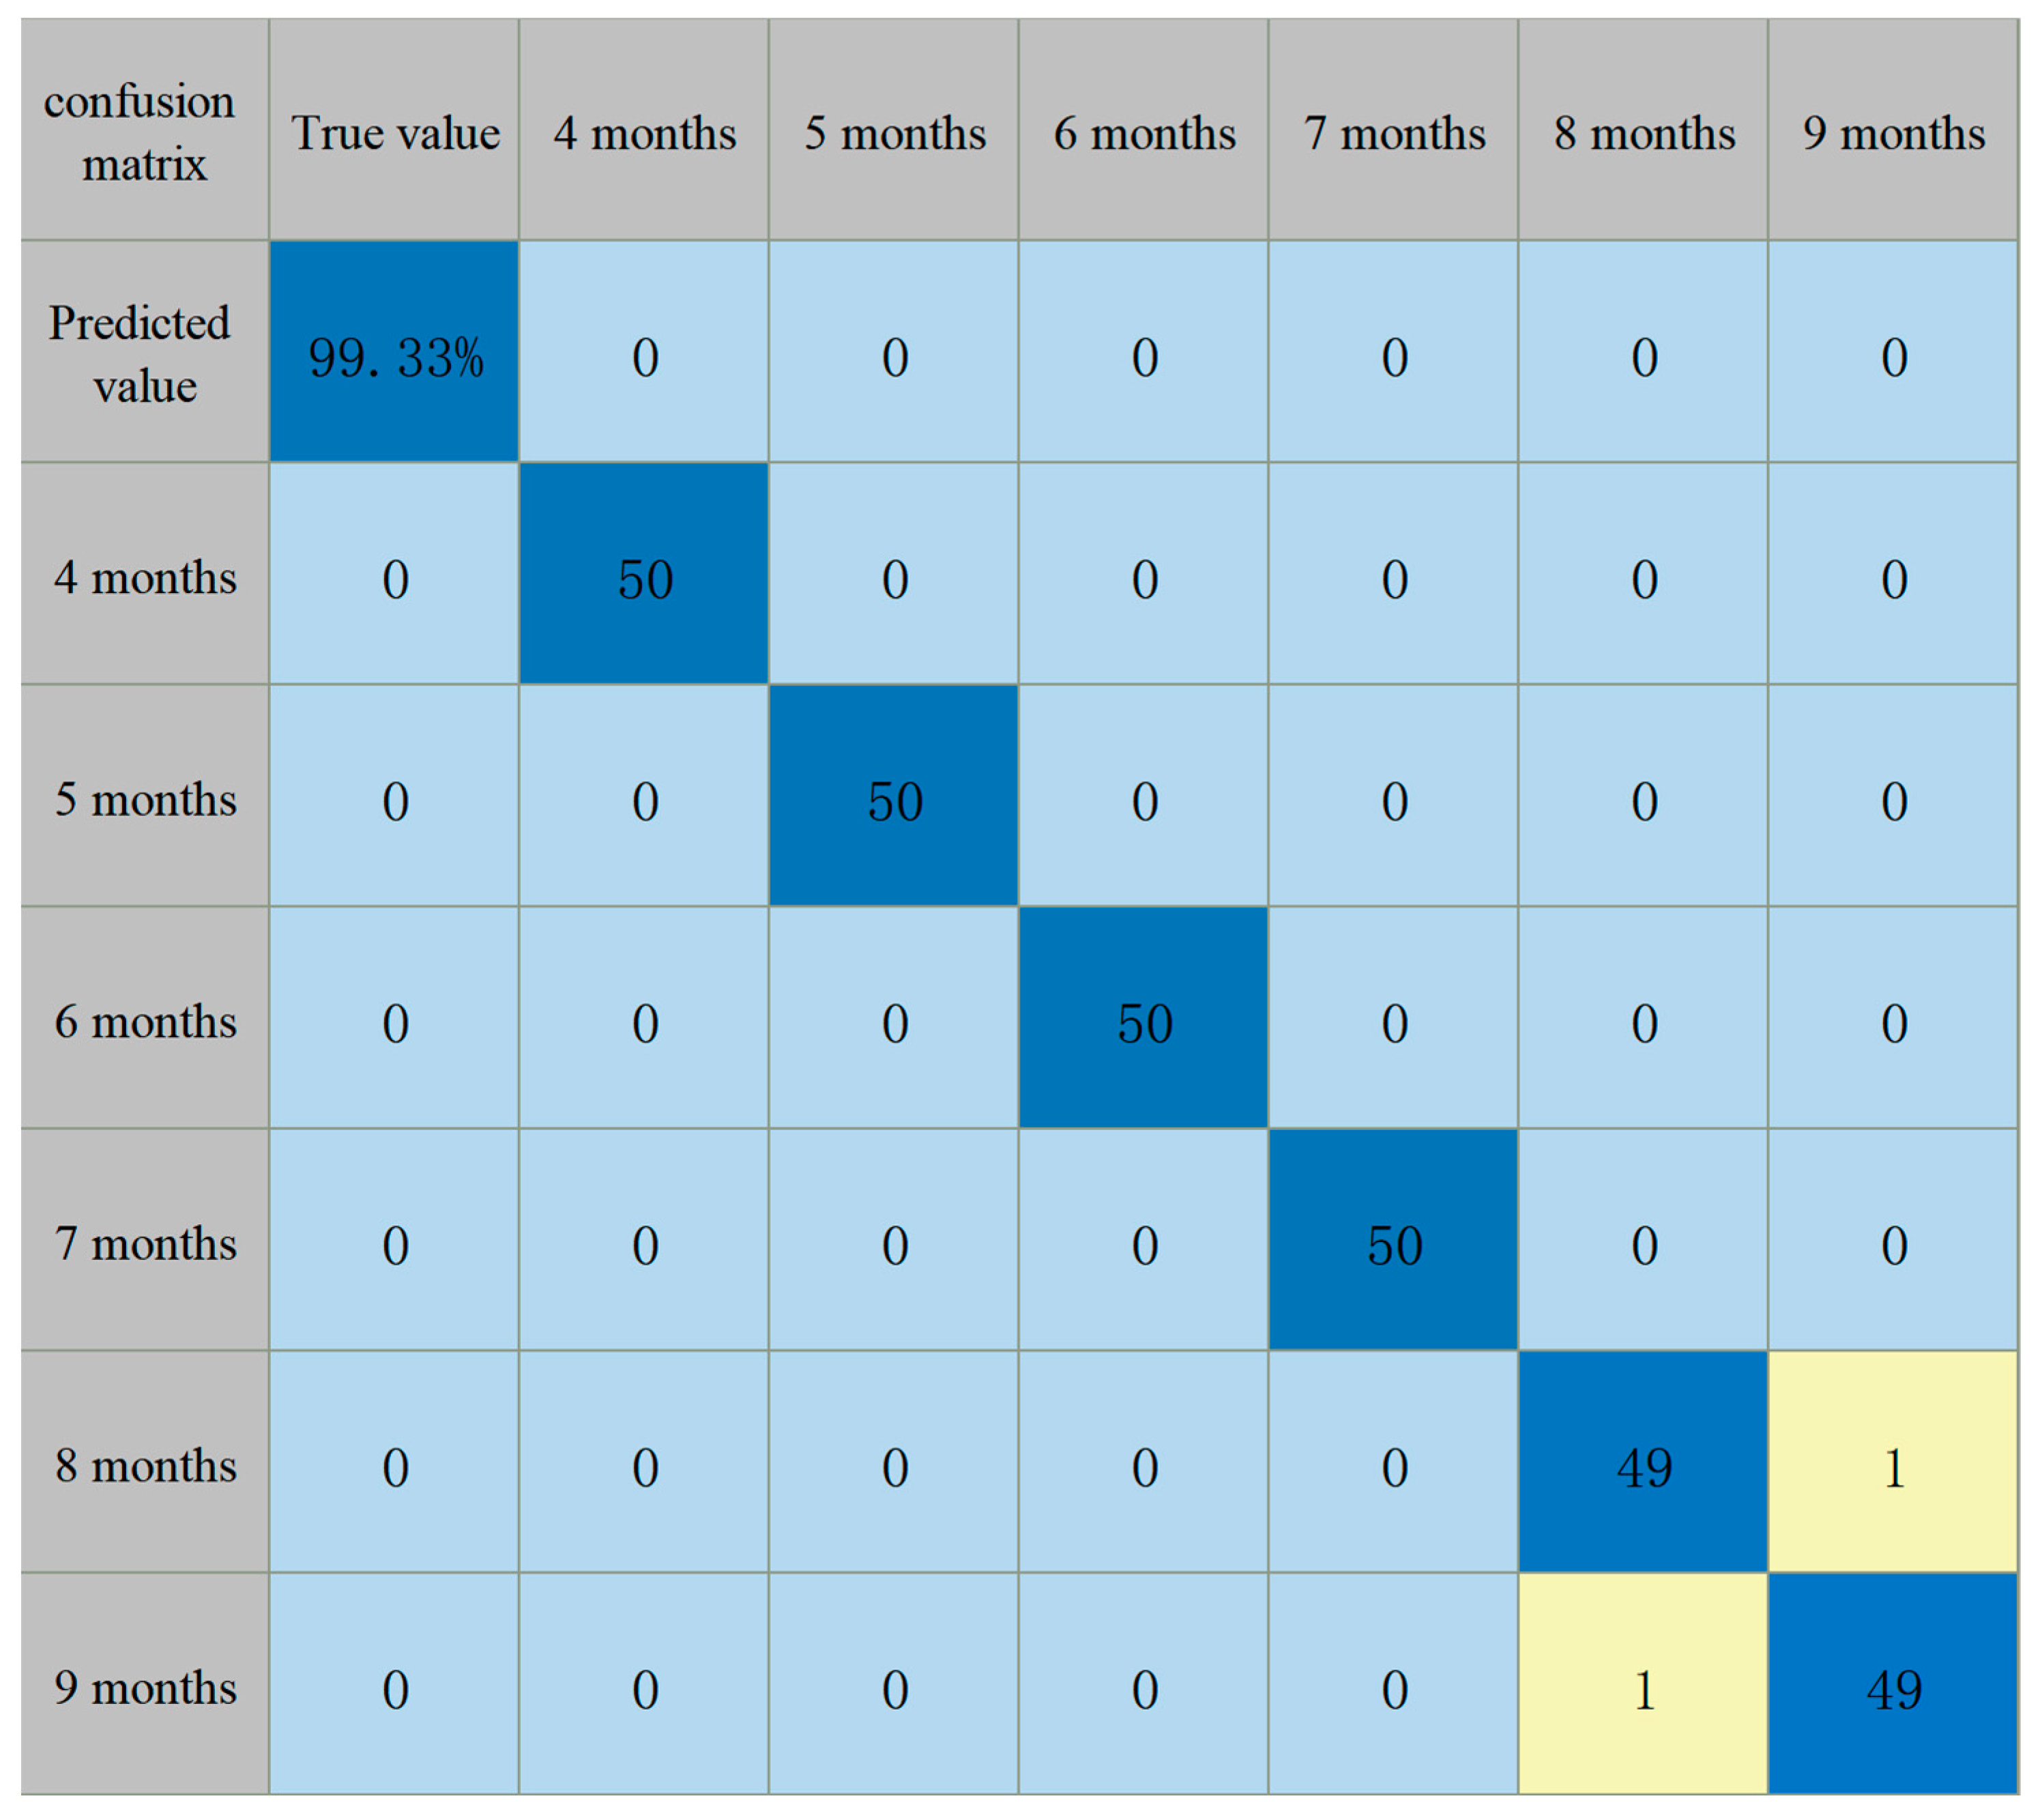
3.4. Linear Discriminant Analysis after PCA (PCA-DA) Model

In the PCA combined with linear discriminant analysis (PCA-DA) method, the spectral data must undergo PCA due to the limitation of the algorithm of LDA. As shown in Figure 2, the first seven principal components of the original spectrum contained almost all of the effective information of the spectrum. Thus, the default principal component number was set to 7 in this study. Setting the maximum principal component number too large could cause overfitting, while setting it too small could cause the loss of spectral information. The linear, quadratic, and Mahalanobis methods were employed to model the principal component score data of the original spectrum, and the classification results are presented in Table 3. The classification accuracy of the calibration set by the quadratic method was the highest, reaching 95%, and the classification accuracy of the prediction set was 90.83%. The classification accuracy of the prediction set of the other two modeling methods was less than 90%. Therefore, comprehensively taking into account the classification effect of the calibration set and the prediction set, the quadratic method was used to establish the discriminant model in the subsequent LDA.
The classification accuracy of LDA with different storage times of T. grandis kernels did not reach 100%. Therefore, the PCA-DA models were established after spectrum preprocessing, and the classification accuracy is shown in Table 4. It can be seen that the accuracy of the PCA-DA model decreased after Baseline and Normalize preprocessing. In particular, the classification accuracy of the validation set decreased from 90.83% to 81.67~82.50%. This indicates that the preprocessing method, which has an optimizing and screening effect on NIR spectral data, was not suitable for the principal component classification data obtained after PCA. Although the classification accuracy of the calibration set increased by 2.22% after SNV preprocessing, the classification accuracy of the validation set decreased by 8.33%. The classification accuracy of PCA-DA model after derivative preprocessing was the best, with the accuracy of the calibration set and validation set both being higher than 96%.
The confusion matrix depicting the optimal PCA-DA model classification results is presented in Figure 5. The accuracy rates of the calibration and validation sets were 100% and 98.33%, respectively. Only two samples in the validation set were misclassified. One sample with a storage time of 8 months was misclassified as 9 months, and another sample with a storage time of 9 months was misclassified as 8 months. All other samples with different storage times were correctly classified. Among the three classification approaches used, the PCA-DA model was proven to be the most effective.
In summary, the detection of T. grandis kernel samples with different storage times showed that PCA could only achieve clustering of samples with storage times of 4~5 months, 6 months, 7 months, and 8~9 months. The SVM model had good classification results except for the poor classification of storage times of 8 and 9 months, while the PCA-DA model had the best classification results and could differentiate every month of storage time from around 4 to 9 months. A study was conducted on the analysis of sweet corn with and without husk using a PLS-DA model in reflection and interaction modes. It was found that the best prediction results were obtained after 2-Der preprocessing, with accuracies of 90% and 97.5% [30]. NIR spectroscopy and NMR were used to assess macadamia nut extranuclear defects, and the GA-LDA model achieved classification accuracies and specificities of 97.8% and 100%, respectively [31]. The quality of fresh chestnuts was evaluated using NIR diffuse reflectance technology, and the NIR spectra were modeled. LDA was used to discriminate between normal and moldy chestnuts, and calibration accuracies and validation accuracies of 100% and 96.37%, respectively, were achieved, indicating that the established model was successful [32]. In this study, the PCA-DA model after 1-Der preprocessing could effectively differentiate the samples of T. grandis kernels from the storage times of 4~9 months, making it applicable to practical production.
The analysis of storage times of some foods using near-infrared detection technology is shown in Table 5. Navel oranges with a storage time of 1~6 months were detected, and a BP artificial neural network model was established with five indicators including total soluble sugar, total acid, vitamin C, soluble solids, and sugar acid ratio, which changed with storage time. The calibration set and prediction set of the model were 0.9487 and 0.8770, respectively. It was concluded that the multi-factor model was more accurate than the single-factor model in predicting storage time and storage life [33]. The storage time of Carya cathayensis sarg. with a storage time of 3~7 months was detected using a combination of raw data and LDA (linear discriminant analysis) to achieve a classification accuracy of over 95%, enabling rapid detection of the storage time of walnuts [34]. Cakes with a storage time of 1~8 days were detected and the storage time was accurately predicted using a combination of raw data and PLS-DA (partial least squares discriminant analysis) with an error control of about 1 day [35]. Strawberries with a storage time of 0~60 h were detected using visible/near-infrared (Vis/NIR) hyperspectral imaging technology. A combination of CARS-SPA (spectral selection and spectral intrinsic analysis) and PLSR (partial least squares regression) was used to obtain correlation coefficients of 0.9989 and 0.9974, respectively. The storage time distribution map generated based on pixel-level spectra and the established model clearly showed the quality changes in strawberries [36]. With the development of near-infrared spectroscopy technology, it could be applied in the field of food safety. By improving algorithms and data processing methods, the prediction accuracy could be further improved, thus more accurately assessing and monitoring the storage time and quality of different foods.

4. Conclusions

In this paper, the storage time of T. grandis kernels was, firstly, detected by near infrared spectroscopy. The results showed that clustering could be achieved between T. grandis kernel samples with storage times of 4~5 months, 6 months, 7 months, and 8~9 months using PCA model after derivative preprocessing. However, the method could not distinguish T. grandis kernels with storage times of 4~5 months and 8~9 months. The Linear kernel in SVM model using the 1-Der preprocessing exhibited better accuracy. The training accuracy, validation accuracy, and prediction accuracy of this model were significantly improved compared with PCA model. However, the SVM model still could not distinguish T. grandis kernels with storage times of 8~9 months. The principal component analysis-linear discriminant analysis (PCA-DA) model had the highest classification accuracy among all of the classification methods. The optimal PCA-DA model was obtained with the quadratic method technique after 1-Der preprocessing, and the classification accuracy of the calibration and validation sets were 100% and 97.33%, respectively. Finally, the effects of different storage times on the near infrared model were analyzed and compared. The near infrared detection technology has been used to realize the classification of Torreya in different storage times, which can be used in practical production.
Near infrared detection technology has the advantages of being nondestructive, convenient, and fast, which conforms to the principle of sustainable development, and is of great significance to the sustainable development of the nut industry. The application of this technology would bring more precise control of nuts storage time, contributing to improving economic benefits and protecting the environment. In the future, more samples with different storage times could be added into the model to develop a more comprehensive classification model and improve the scope of this model.

Author Contributions

Writing—original draft, S.G. and Y.S.; Writing—review & editing, C.Z.; Supervision, C.Z., S.G. and Y.S. as co-first author contribute equally to this work. All authors have read and agreed to the published version of the manuscript.

Funding

This research received no external funding.

Institutional Review Board Statement

Not applicable.

Informed Consent Statement

Not applicable.

Data Availability Statement

Data available on request.

Acknowledgments

The authors acknowledge the use of laboratories and equipment from the College of Optical, Mechanical and Electrical Engineering of Zhejiang A&F University and the National Wood Research Center.

Conflicts of Interest

The authors declare no conflict of interest.

References

  1. Xu, L.; Yan, S.-M.; Cai, C.-B.; Zhong, W.; Yu, X.-P. Rapid analysis of geographical origins and age of Torreya grandis seeds by NIR spectroscopy and pattern recognition methods. J. Spectrosc. 2013, 1, 468509. [Google Scholar] [CrossRef]
  2. Huang, Y.; Wang, J.; Li, G.; Zheng, Z.; Microbiology, M. Antitumor and antifungal activities in endophytic fungi isolated from pharmaceutical plants Taxus mairei, Cephalataxus fortunei and Torreya grandis. FEMS Immunol. Med. Microbiol. 2001, 31, 163–167. [Google Scholar] [CrossRef] [PubMed]
  3. Zhu, M.F.; Tu, Z.C.; Zhang, L. Antioxidant, metabolic enzymes inhibitory ability of Torreya grandis kernels, and phytochemical profiling identified by HPLC-QTOF-MS/MS. J. Food Biochem. 2019, 43, e13043. [Google Scholar] [CrossRef] [PubMed]
  4. Zareef, M.; Arslan, M.; Mehedi Hassan, M.; Ali, S.; Ouyang, Q.; Li, H.; Wu, X.; Muhammad Hashim, M.; Javaria, S.; Chen, Q. Application of benchtop NIR spectroscopy coupled with multivariate analysis for rapid prediction of antioxidant properties of walnut (Juglans regia). Food Chem. 2021, 359, 129928. [Google Scholar] [CrossRef]
  5. Yi, J.; Sun, Y.; Zhu, Z.; Liu, N.; Lu, J. Near-infrared reflectance spectroscopy for the prediction of chemical composition in walnut kernel. Int. J. Food Prop. 2016, 20, 1633–1642. [Google Scholar] [CrossRef]
  6. Tao, T.; Feng, X.; Dong, H.; Chao, Z. Determination of protein and fat content in pecan based on near infrared spectroscopy. J. Am. Oil Chem. Soc. 2022, 35, 158–162. [Google Scholar]
  7. Lu, J.; Cheng, M.; Zhao, C.; Shao, Q.; Hassan, M. Combined oxidization and liquid Ammonia pretreatment of bamboo of various ages and species for maximizing fermentable sugar release. Bioresour. Technol. 2022, 343, 126085. [Google Scholar] [CrossRef]
  8. Pannico, A.; Schouten, R.E.; Basile, B.; Romano, R.; Woltering, E.J.; Cirillo, C. Non-destructive detection of flawed hazelnut kernels and lipid oxidation assessment using NIR spectroscopy. J. Food Eng. 2015, 160, 42–48. [Google Scholar] [CrossRef]
  9. Wang, Y.; Li, M.; Li, L.; Ning, J.; Zhang, Z. Green analytical assay for the quality assessment of tea by using pocket-sized NIR spectrometer. Food Chem. 2021, 345, 128816. [Google Scholar] [CrossRef]
  10. Fu, X.; Ying, Y. Food safety evaluation based on near infrared spectroscopy and imaging: A review. Crit. Rev. Food Sci. Nutr. 2016, 56, 1913–1924. [Google Scholar] [CrossRef]
  11. Jensen, P.N.; Sørensen, G.; Engelsen, S.B.; Bertelsen, G.; Chemistry, F. Evaluation of quality changes in walnut kernels (Juglans regia L.) by Vis/NIR spectroscopy. J. Agric. Food Chem. 2001, 49, 5790–5796. [Google Scholar] [CrossRef] [PubMed]
  12. Ríos-Reina, R.; Callejón, R.M.; Amigo, J.M. Feasibility of a rapid and non-destructive methodology for the study and discrimination of pine nuts using near-infrared hyperspectral analysis and chemometrics. Food Control 2021, 130, 108365. [Google Scholar] [CrossRef]
  13. Juan, l.; Hai, L. Study on rapid and non-destructive detection of rice freshness using near-infrared spectroscopy. Spectrosc. Spectral Anal. 2012, 32, 2126–2130. [Google Scholar]
  14. Assistant, P.; Hamadan, I. Comparison and Application of Near-Infrared (NIR) and Mid-Infrared (MIR) Spectroscopy for Determination of Quality Parameters in Walnut Samples. J. Agric. Mach. Sci. 2014, 10, 247–252. [Google Scholar] [CrossRef]
  15. Badaró, T.; Morimitsu, L.; Ferreira, R.; Clerici, M. Identification of fiber added to semolina by near infrared (NIR) spectral techniques. Food Chem. 2019, 289, 195–203. [Google Scholar] [CrossRef]
  16. Bedin, B.; Faust, V.; Guarneri, A.; Assmann, S.; Lafay, B.; Soares, L.F.; Oliveira, V.; Santos, M. NIR associated to PLS and SVM for fast and non-destructive determination of C, N, P, and K contents in poultry litter. Spectrochim. Acta A Mol. Biomol. Spectrosc. 2021, 245, 118834. [Google Scholar] [CrossRef]
  17. Yang, M.; Xu, D.; Chen, S.; Li, H.; Shi, Z. Evaluation of machine learning approaches to predict soil organic matter and pH using Vis-NIR spectra. Sensors 2019, 19, 263. [Google Scholar] [CrossRef]
  18. Nogales-Bueno, J.; Feliz, L.; Baca-Bocanegra, B.; Hernandez-Hierro, M.; Heredia, J.; Barroso, M.; Rato, E. Comparative study on the use of three different near infrared spectroscopy recording methodologies for varietal discrimination of walnuts. Talanta 2020, 206, 120189. [Google Scholar] [CrossRef]
  19. Arndt, M.; Drees, A.; Ahlers, C.; Fischer, M. Determination of the Geographical Origin of Walnuts (Juglans regia L.) Using Near-Infrared Spectroscopy and Chemometrics. Foods 2020, 9, 1860. [Google Scholar] [CrossRef]
  20. Yang, Z.; Li, K.; Zhang, M.; Xin, D.; Zhang, J. Rapid determination of chemical composition and classification of bamboo fractions using visible-near infrared spectroscopy coupled with multivariate data analysis. Biotechnol. Biofuels 2016, 9, 35. [Google Scholar] [CrossRef]
  21. Zareef, M.; Chen, Q.; Hassan, M.; Arslan, M.; Hashim, M.; Ahmad, W.; Kutsanedzie, Y.; Agyekum, R. An overview on the applications of typical non-linear algorithms coupled with NIR spectroscopy in food analysis. Food Eng. Rev. 2020, 12, 173–190. [Google Scholar] [CrossRef]
  22. Lin, H.; Jiang, H.; Lin, J.; Chen, Q.; Ali, S.; Teng, W.; Zuo, F. Rice freshness identification based on visible near-infrared spectroscopy and colorimetric sensor array. Food Anal. Methods 2021, 14, 1305–1314. [Google Scholar] [CrossRef]
  23. De Almeida, E.; Fernandes, D.; Diniz, D.; Araújo, A.; Véras, G.; Galvão, H.; Araujo, M. Scores selection via Fisher’s discriminant power in PCA-LDA to improve the classification of food data. Food Chem. 2021, 363, 130296. [Google Scholar] [CrossRef] [PubMed]
  24. Wang, Y. The Effect of Storage Factors and Processing Techniques on the Oxidative Stability of Walnut Fat. Master’s Thesis, Nanjing Agricultural University, Nanjing, China, 2015. Available online: https://CMFD201501&filename=1015529198.nh (accessed on 9 March 2023).
  25. Yang, N.; Zhang, X.; Li, W.; Yu, L.; Mao, J.; Wang, P.; Zhang, Q. A review of chemical composition and nutritional properties of minor vegetable oils in China. Trends Food Sci. Technol. 2018, 74, 26–32. [Google Scholar] [CrossRef]
  26. Liu, F.; Tang, X. Fuji apple storage time rapid determination method using Vis/NIR spectroscopy. Bioengineered 2015, 6, 166–169. [Google Scholar] [CrossRef]
  27. Sanchez-Rodriguez, I.; Sanchez-Lopez, E.; Marinas, A.; Caridad, M.; Urbano, J. Redundancy analysis to reduce the high-dimensional near-infrared spectral information to improve the authentication of olive oil. J. Chem. Inf. Model 2022, 62, 4620–4628. [Google Scholar] [CrossRef]
  28. Tong, L.; Li, B.; Geng, Y.; Chen, L.; Li, Y.; Cao, R. Spectrometric classification of bamboo shoot species by comparison of different machine mearning Methods. Food Anal. Method 2020, 14, 300–306. [Google Scholar] [CrossRef]
  29. Cruz-Tirado, P.; Lucimar, M.; Barbin, F. On-line monitoring of egg freshness using a portable NIR spectrometer in tandem with machine learning. J. Food Eng. 2021, 306, 110643. [Google Scholar] [CrossRef]
  30. Suktanarak, S.; Supprung, P.; Teerachaichayut, S. Classification of sweet corn based on storage time after harvest using near infrared spectroscopy. Acta Hortic. 2017, 7, 47–54. [Google Scholar] [CrossRef]
  31. Carvalho, D.; Pereira, M.; Morais, D.; Lima, K.; Teixeira, G. Assessment of macadamia kernel quality defects by means of near infrared spectroscopy (NIRS) and nuclear magnetic resonance (NMR). Food Control 2019, 106, 166–172. [Google Scholar] [CrossRef]
  32. Hu, J.; Ma, X.; Liu, L.; Wu, Y.; Ouyang, J. Rapid evaluation of the quality of chestnuts using near-infrared reflectance spectroscopy. Food Chem. 2017, 231, 141–147. [Google Scholar] [CrossRef] [PubMed]
  33. Xia, J. Study on Non-Destructive Detection Method of Storage Quality of Navel Oranges Based on Near-Infrared Spectroscopy. Ph.D. Thesis, Huazhong Agricultural University, Wuhan, China, 2009. [Google Scholar]
  34. Tang, W. Nondestructive Testing of Carya cathayensis Sarg. Based on Near Infrared Spectroscopy. Master’s Thesis, Zhejiang A&F University, Hangzhou, China, 2021. [Google Scholar] [CrossRef]
  35. Sricharoonratana, M.; Thompson, K.; Teerachaichayut, S. Use of near infrared hyperspectral imaging as a nondestructive method of determining and classifying shelf life of cakes. LWT 2021, 2, 136. [Google Scholar] [CrossRef]
  36. Weng, S.; Yu, S.; Dong, R.; Pan, F.; Liang, D. Nondestructive detection of storage time of strawberries using visible/near-infrared hyperspectral imaging. Int. J. Food Prop. 2020, 23, 269–281. [Google Scholar] [CrossRef]
Figure 1. NIR spectra of T. grandis kernels with different storage times.
Sustainability 15 07757 g001
Figure 2. Principal component analysis cumulative variance diagram.
Sustainability 15 07757 g002
Figure 3. Classification results of principal component analysis after spectrum preprocessing.
Sustainability 15 07757 g003
Figure 4. Confusion matrix of prediction results from SVM model.
Sustainability 15 07757 g004
Figure 5. Confusion matrix of prediction results from PCA-DA model.
Sustainability 15 07757 g005
Table 1. Classification accuracy of different SVM kernel models.
Classification Accuracy %LinearPolynomialRBFSigmoid
Calibration set88.8935.5645.0045.56
Validation set 86.6733.3345.0045.00
Prediction set80.0040.3343.3342.67
Table 2. Classification accuracy of different SVM models after spectrum preprocessing.
Classification Accuracy %OriginalNormalizeBaselineSNVMSC1-Der2-Der
Calibration set88.8994.4496.1197.2290.0098.8998.33
Validation set86.6792.5095.0095.8387.5097.5096.67
Prediction set80.0090.3393.6788.0089.6797.3397.00
Table 3. Classification accuracy of three LDA modeling methods.
Classification Accuracy %Linear QuadraticMahalanobis
Validation set92.7895.0093.89
Prediction set85.8390.8387.50
Table 4. Classification accuracy of different PCA-DA models after spectrum preprocessing.
Classification Accuracy %OriginalNormalizeBaselineSNV1-Der2-Der
Validation set95.0092.2290.5697.22100.0099.44
Prediction set90.8386.6781.6782.5098.3396.67
Table 5. Comparison of near-infrared spectral models for storage time of different foods.
NumberStorage TimeSampleOptimal Processing MethodCalibration SetPrediction SetReference
RCRMSECRPRMSEP
11~6 monthsNavel orangeBP0.94870.77600.87700.6992[33]
23~7 monthsCarya cathayensis Sarg.Original + LDA0.97330.20300.95000.4037[34]
31~8 daysCakesOriginal + PLS-DA0.81200.8350[35]
40~60 hStrawberriesCARS-SPA + PLSR0.99890.54950.99740.6625[36]
54~9 monthsT. grandis kernels1-Der + PCA-DA0.98890.9833This study
Disclaimer/Publisher’s Note: The statements, opinions and data contained in all publications are solely those of the individual author(s) and contributor(s) and not of MDPI and/or the editor(s). MDPI and/or the editor(s) disclaim responsibility for any injury to people or property resulting from any ideas, methods, instructions or products referred to in the content.

