

Multi-Criteria Analysis and Decision-Making Approach for the Urban Regeneration: The Application to the Rimini Canal Port (Italy)

Abstract
:1. Introduction
2. Literature Review
- Ex ante evaluation: choice of the project among possible alternatives;
- Ongoing evaluation: monitoring of implementation of the intervention with possible correction of unexpected effects;
- Ex post evaluation: monitoring of objectives achieved.
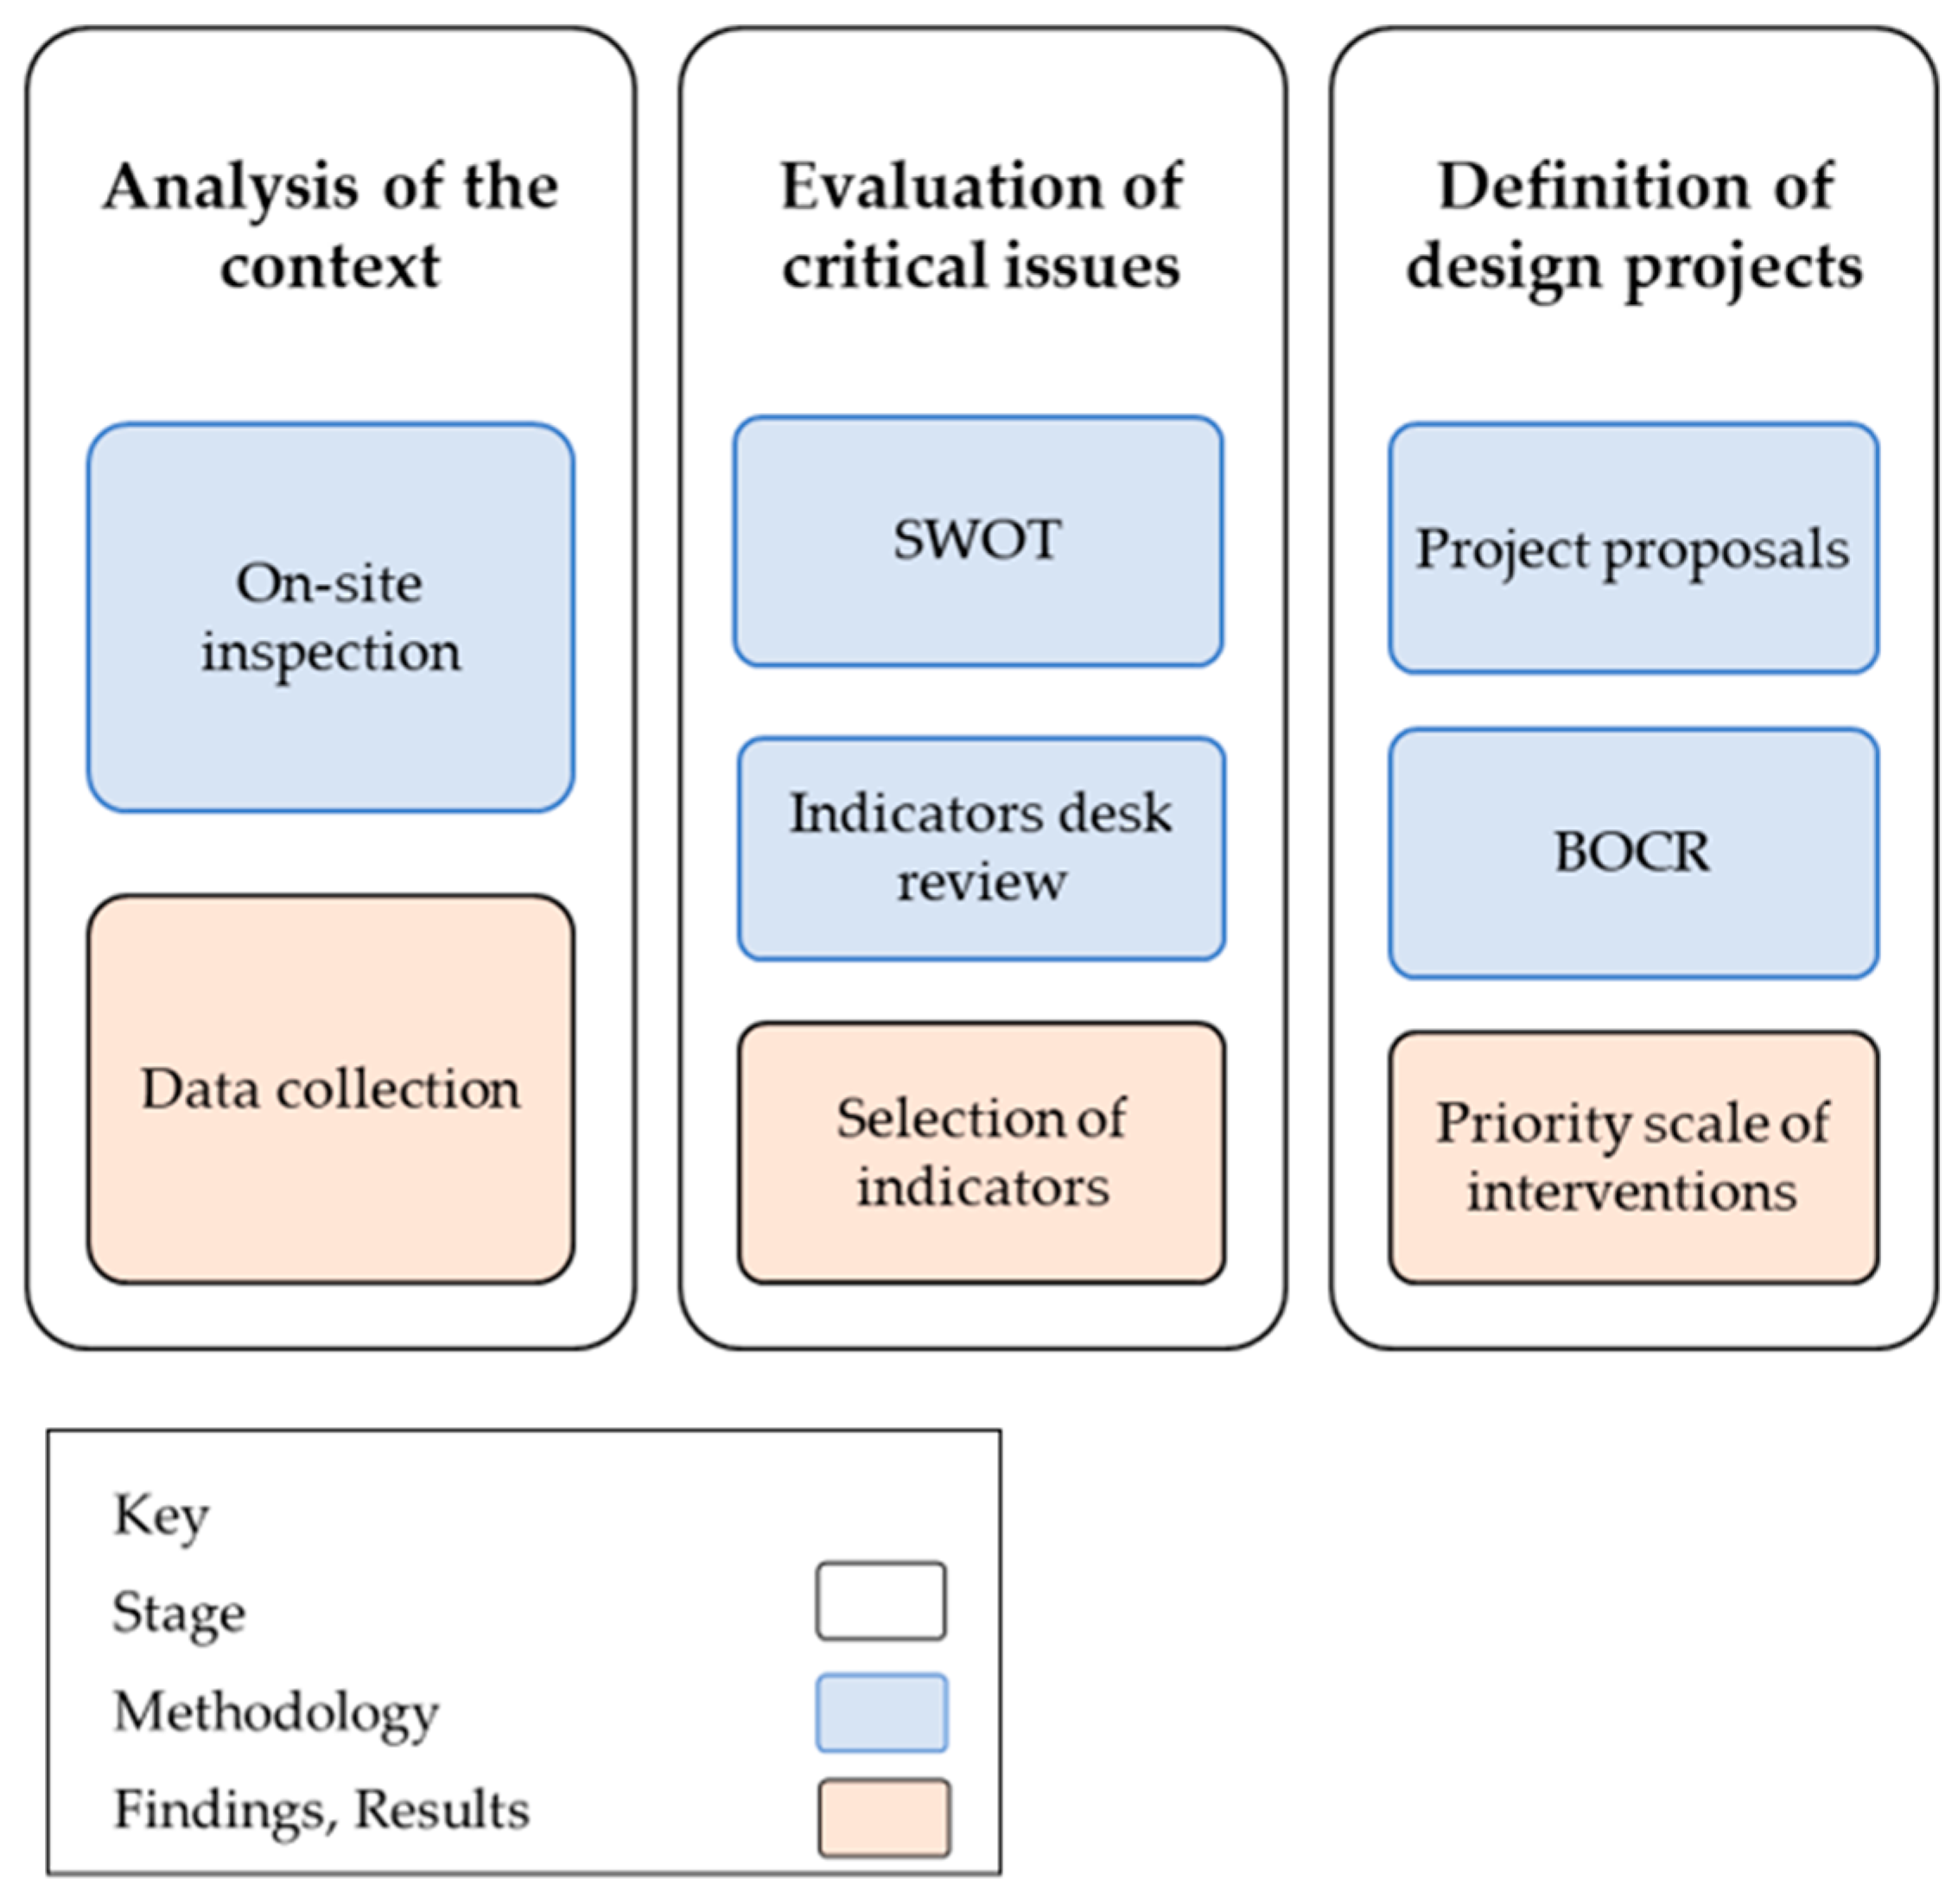
3. Materials and Methods
3.1. Stakeholder Involvement
3.2. Urban Regeneration Indicators
3.3. SWOT Analysis
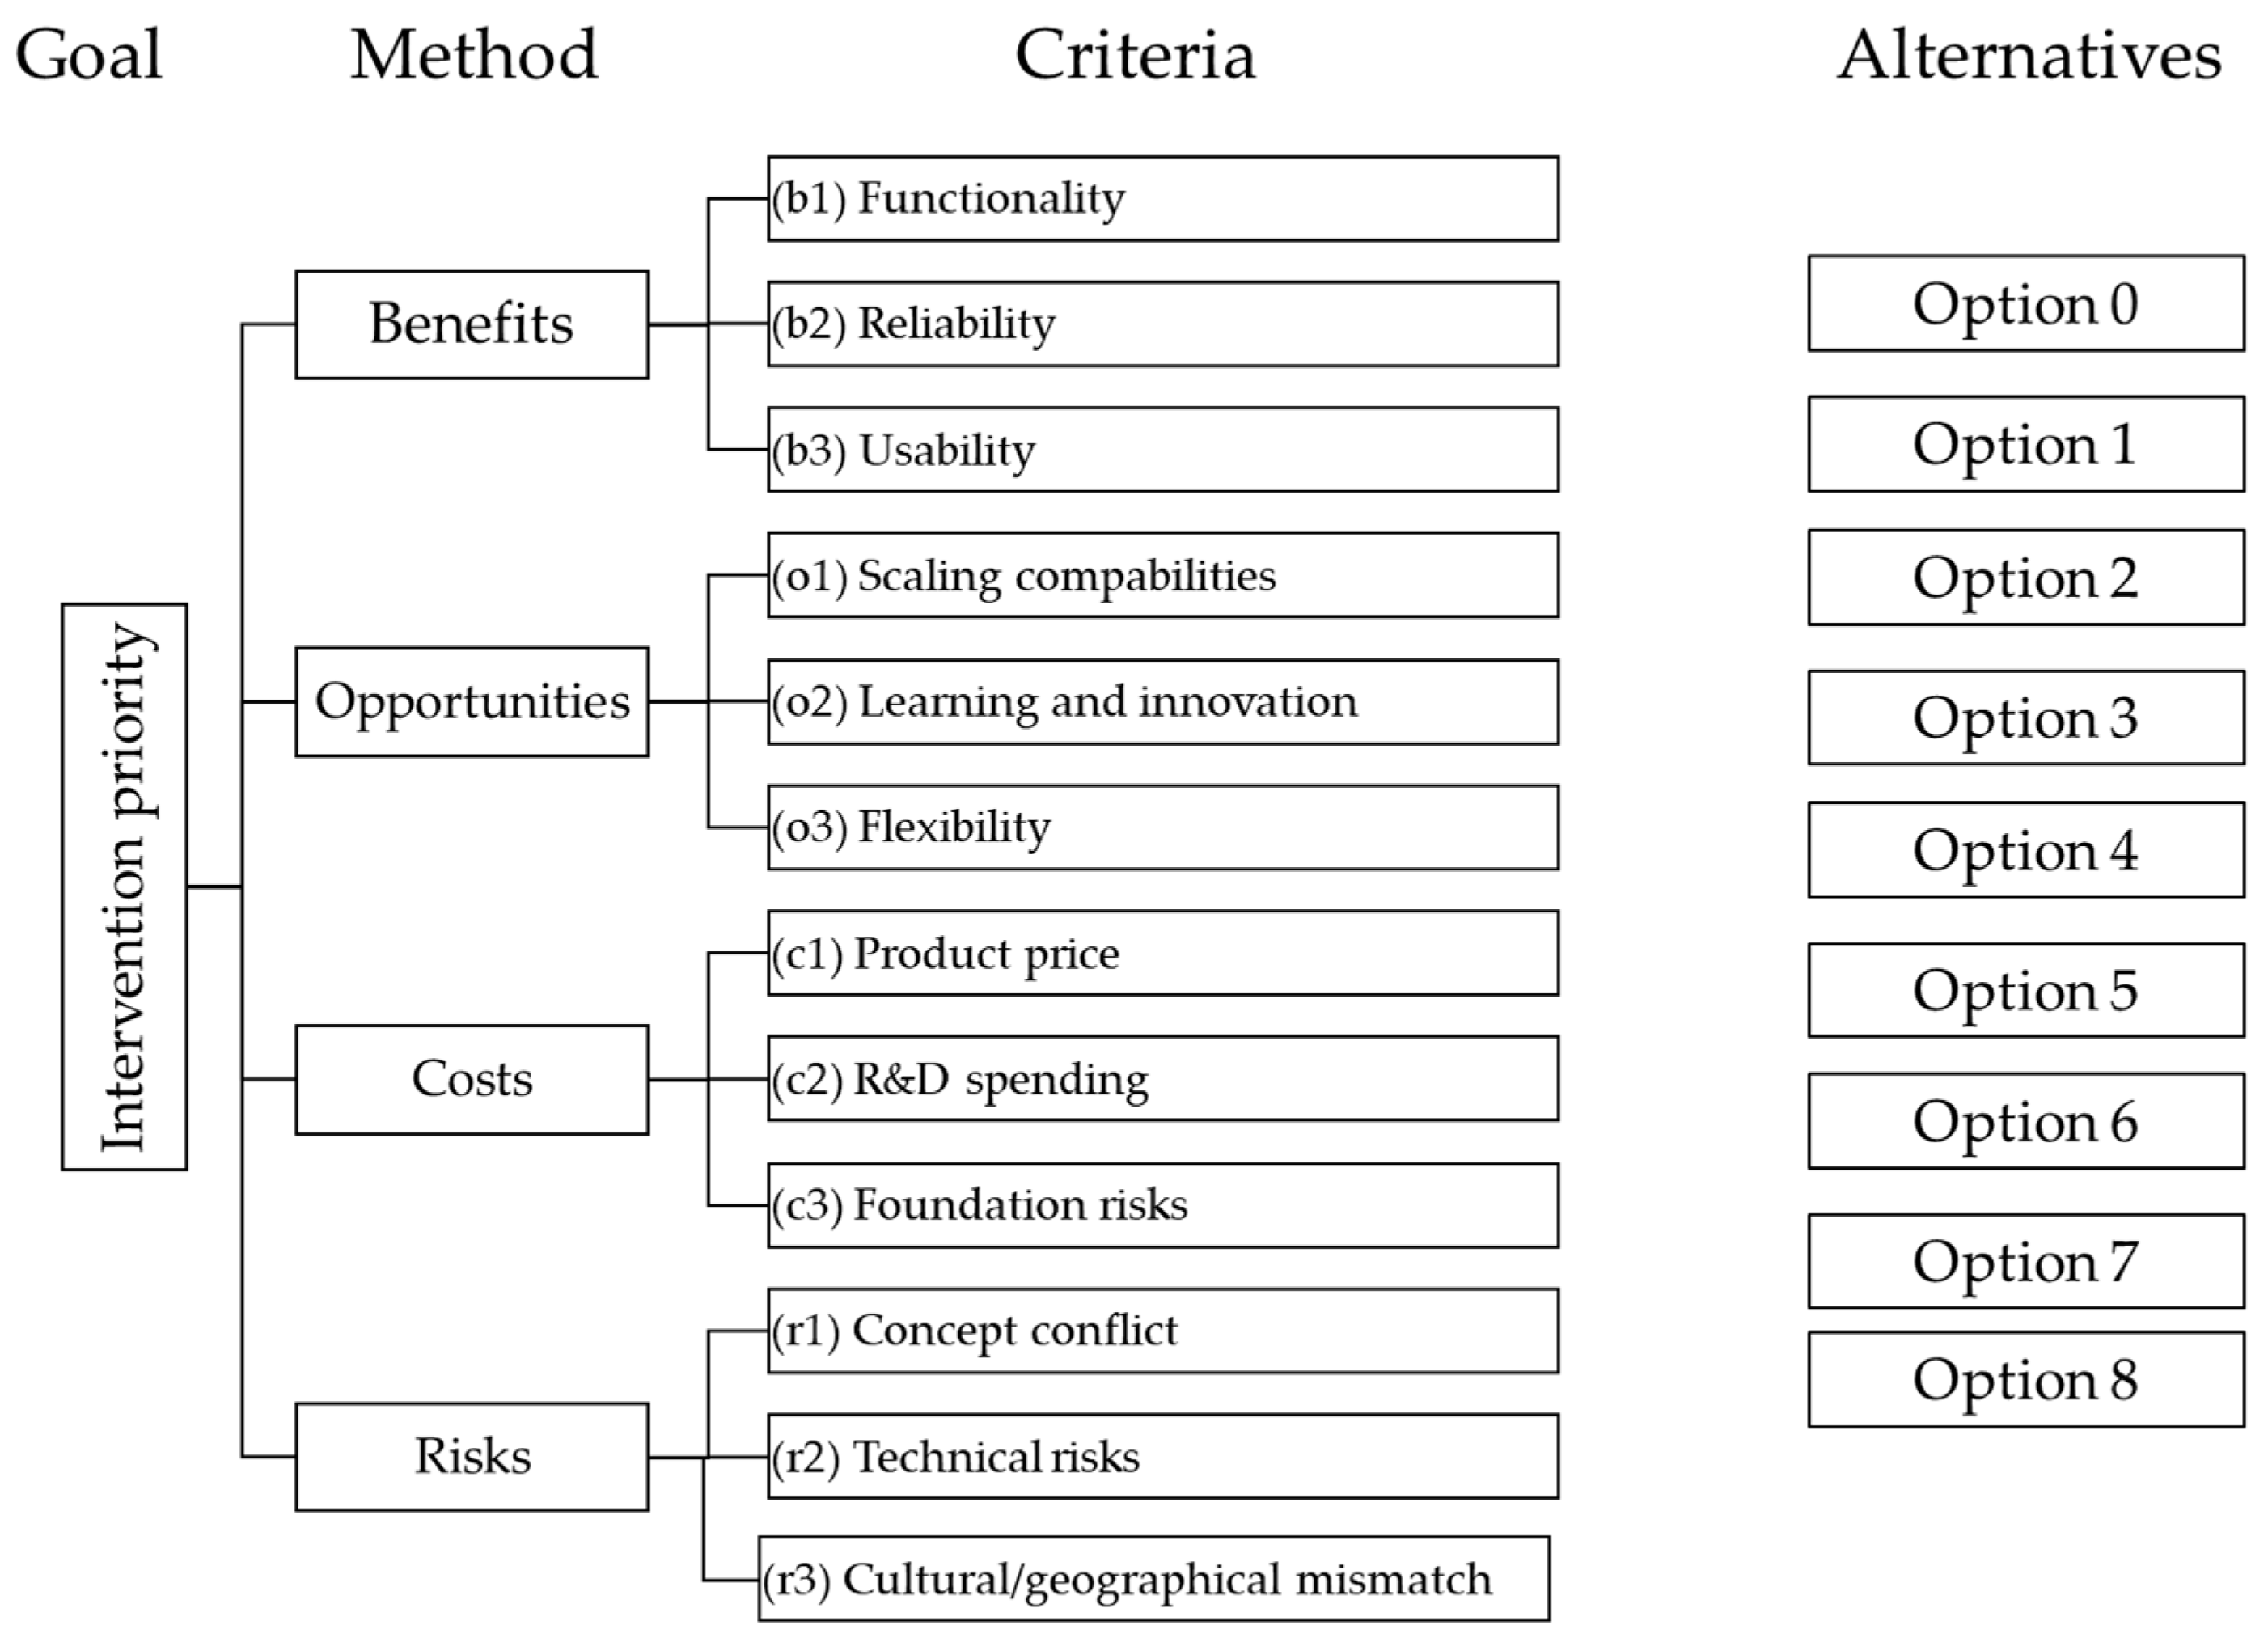
3.4. BOCR Analysis
- Problem structuring and construction of the decision-making model;
- Compilation of the pairwise comparison matrices;
- Formation of the supermatrices;
- Aggregation of results.
- Benefits and costs are measured in the present;
- Opportunities and risks are estimated on the basis of expectations of impacts of the intervention and in the long term.
- Benefits: favourable aspects identified in the analysis of the area;
- Opportunities: potentially favourable aspects deriving from the planned project actions;
- Costs: negative aspects identified in the analysis of the area;
- Risks: potentially negative aspects that may be caused by the project actions.
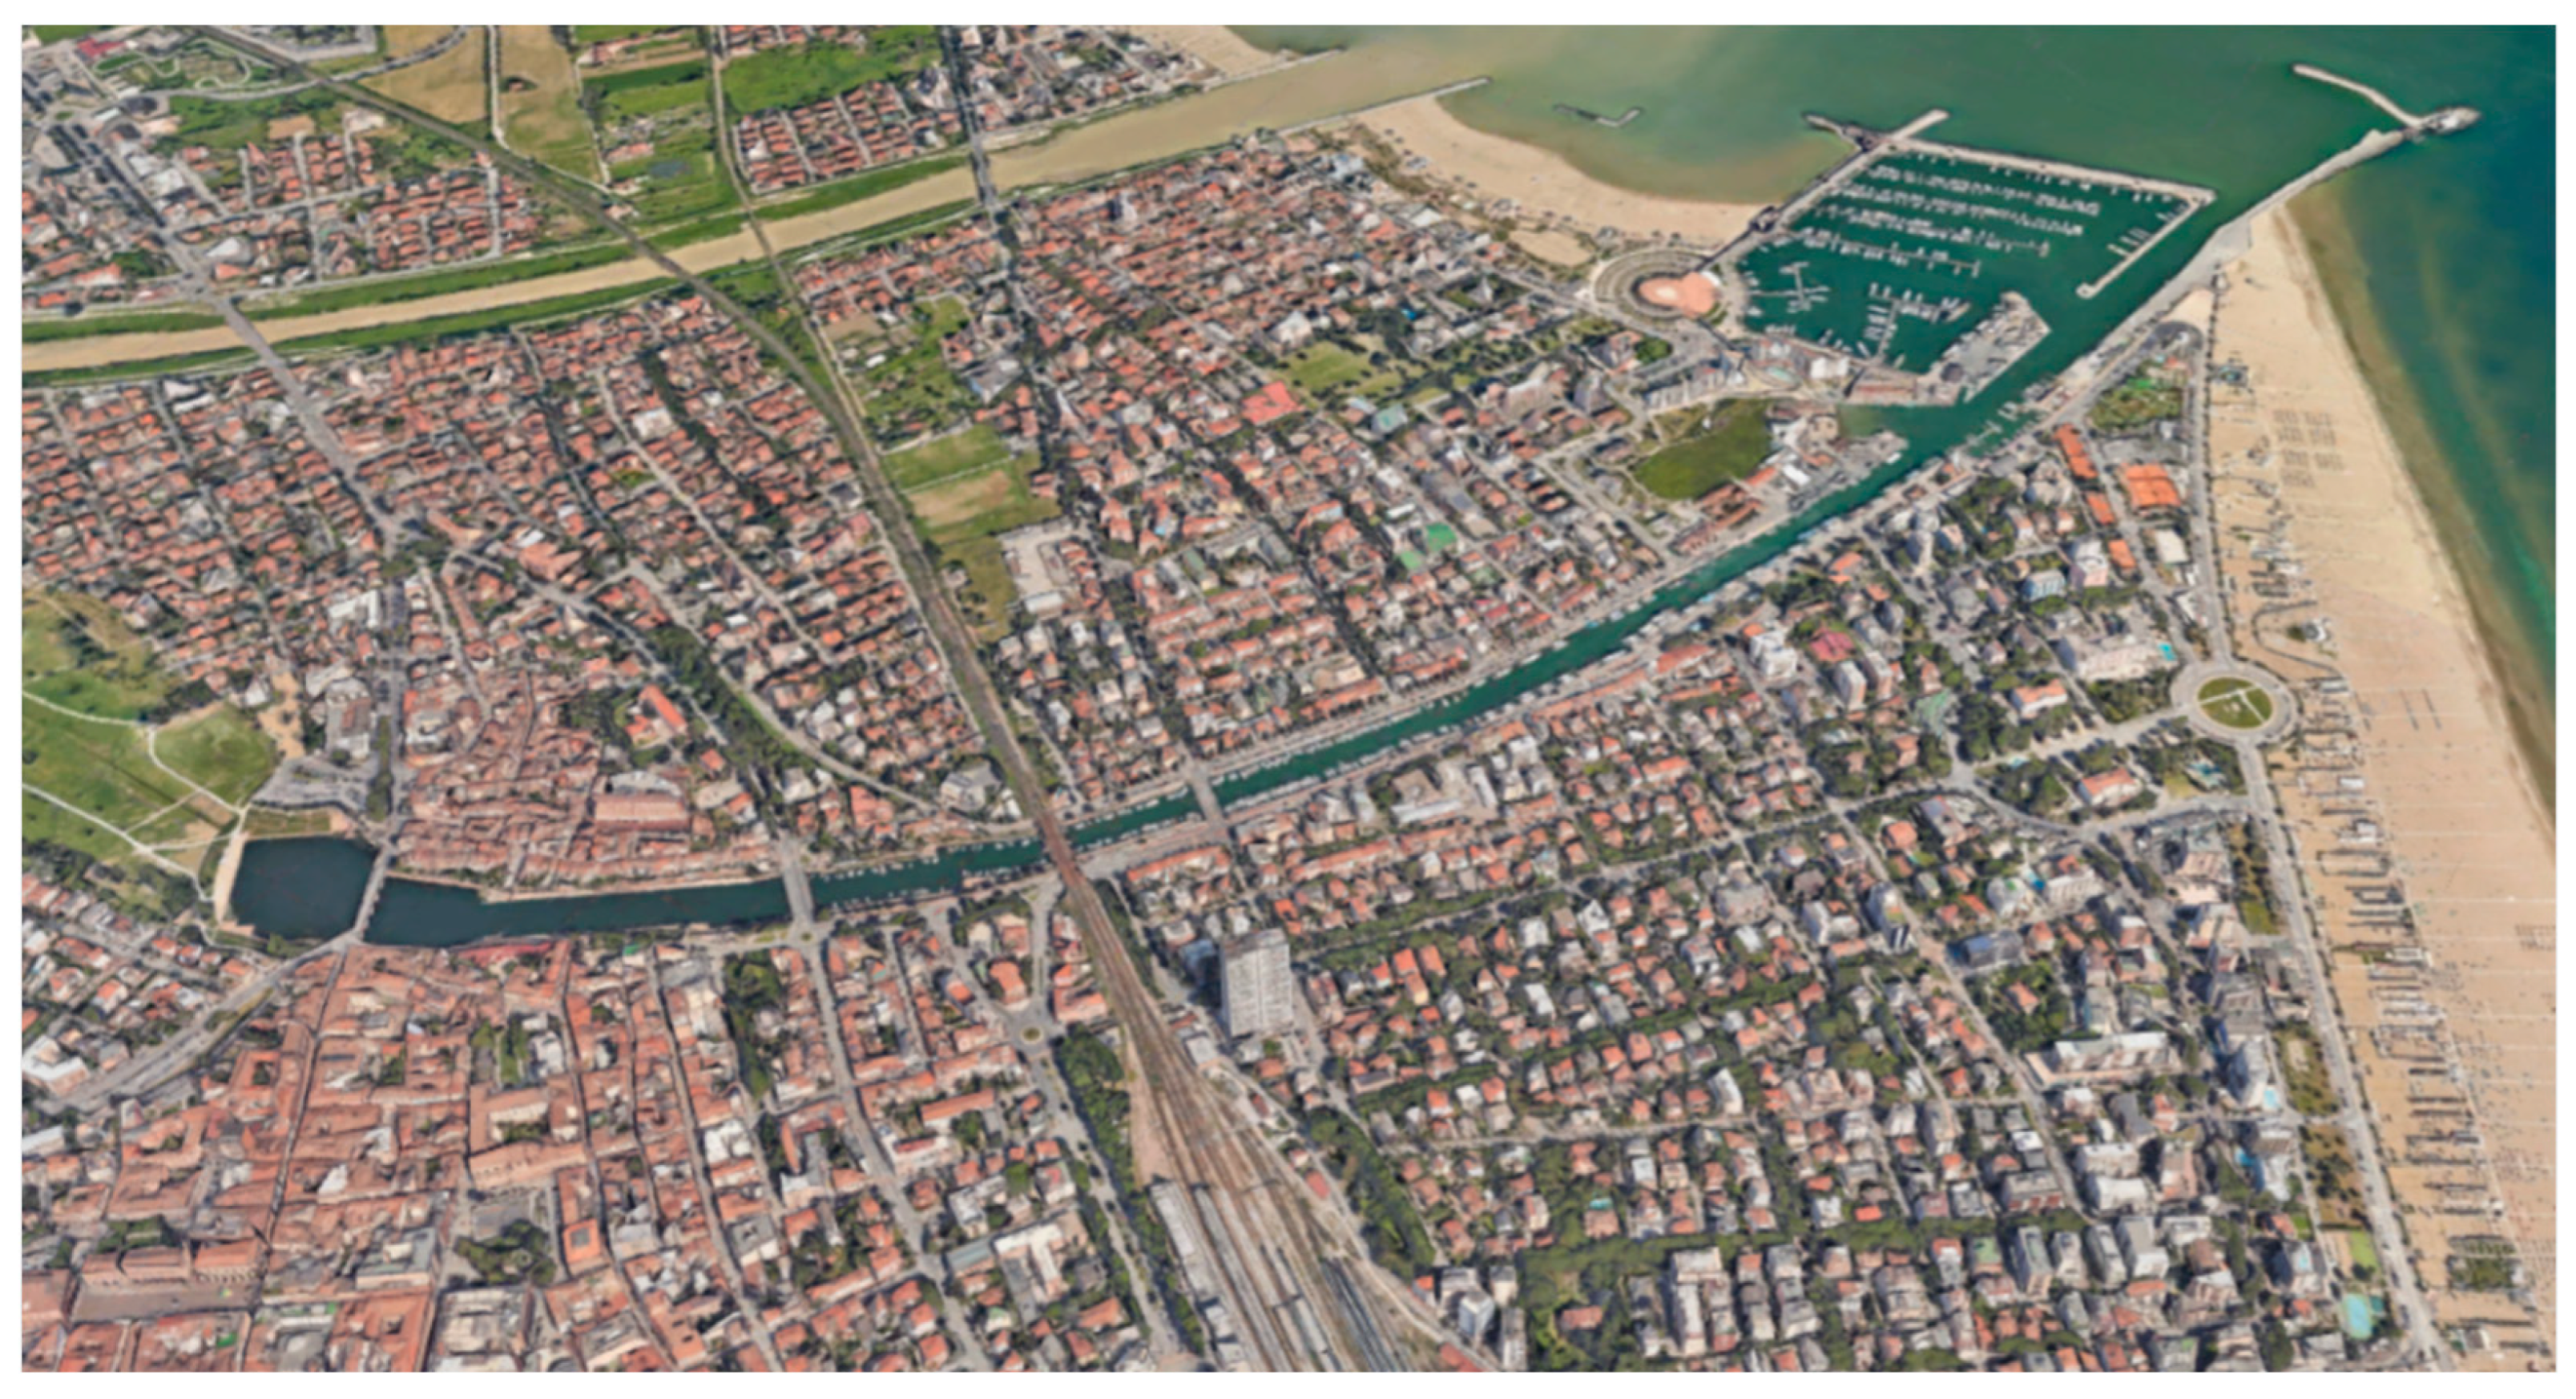
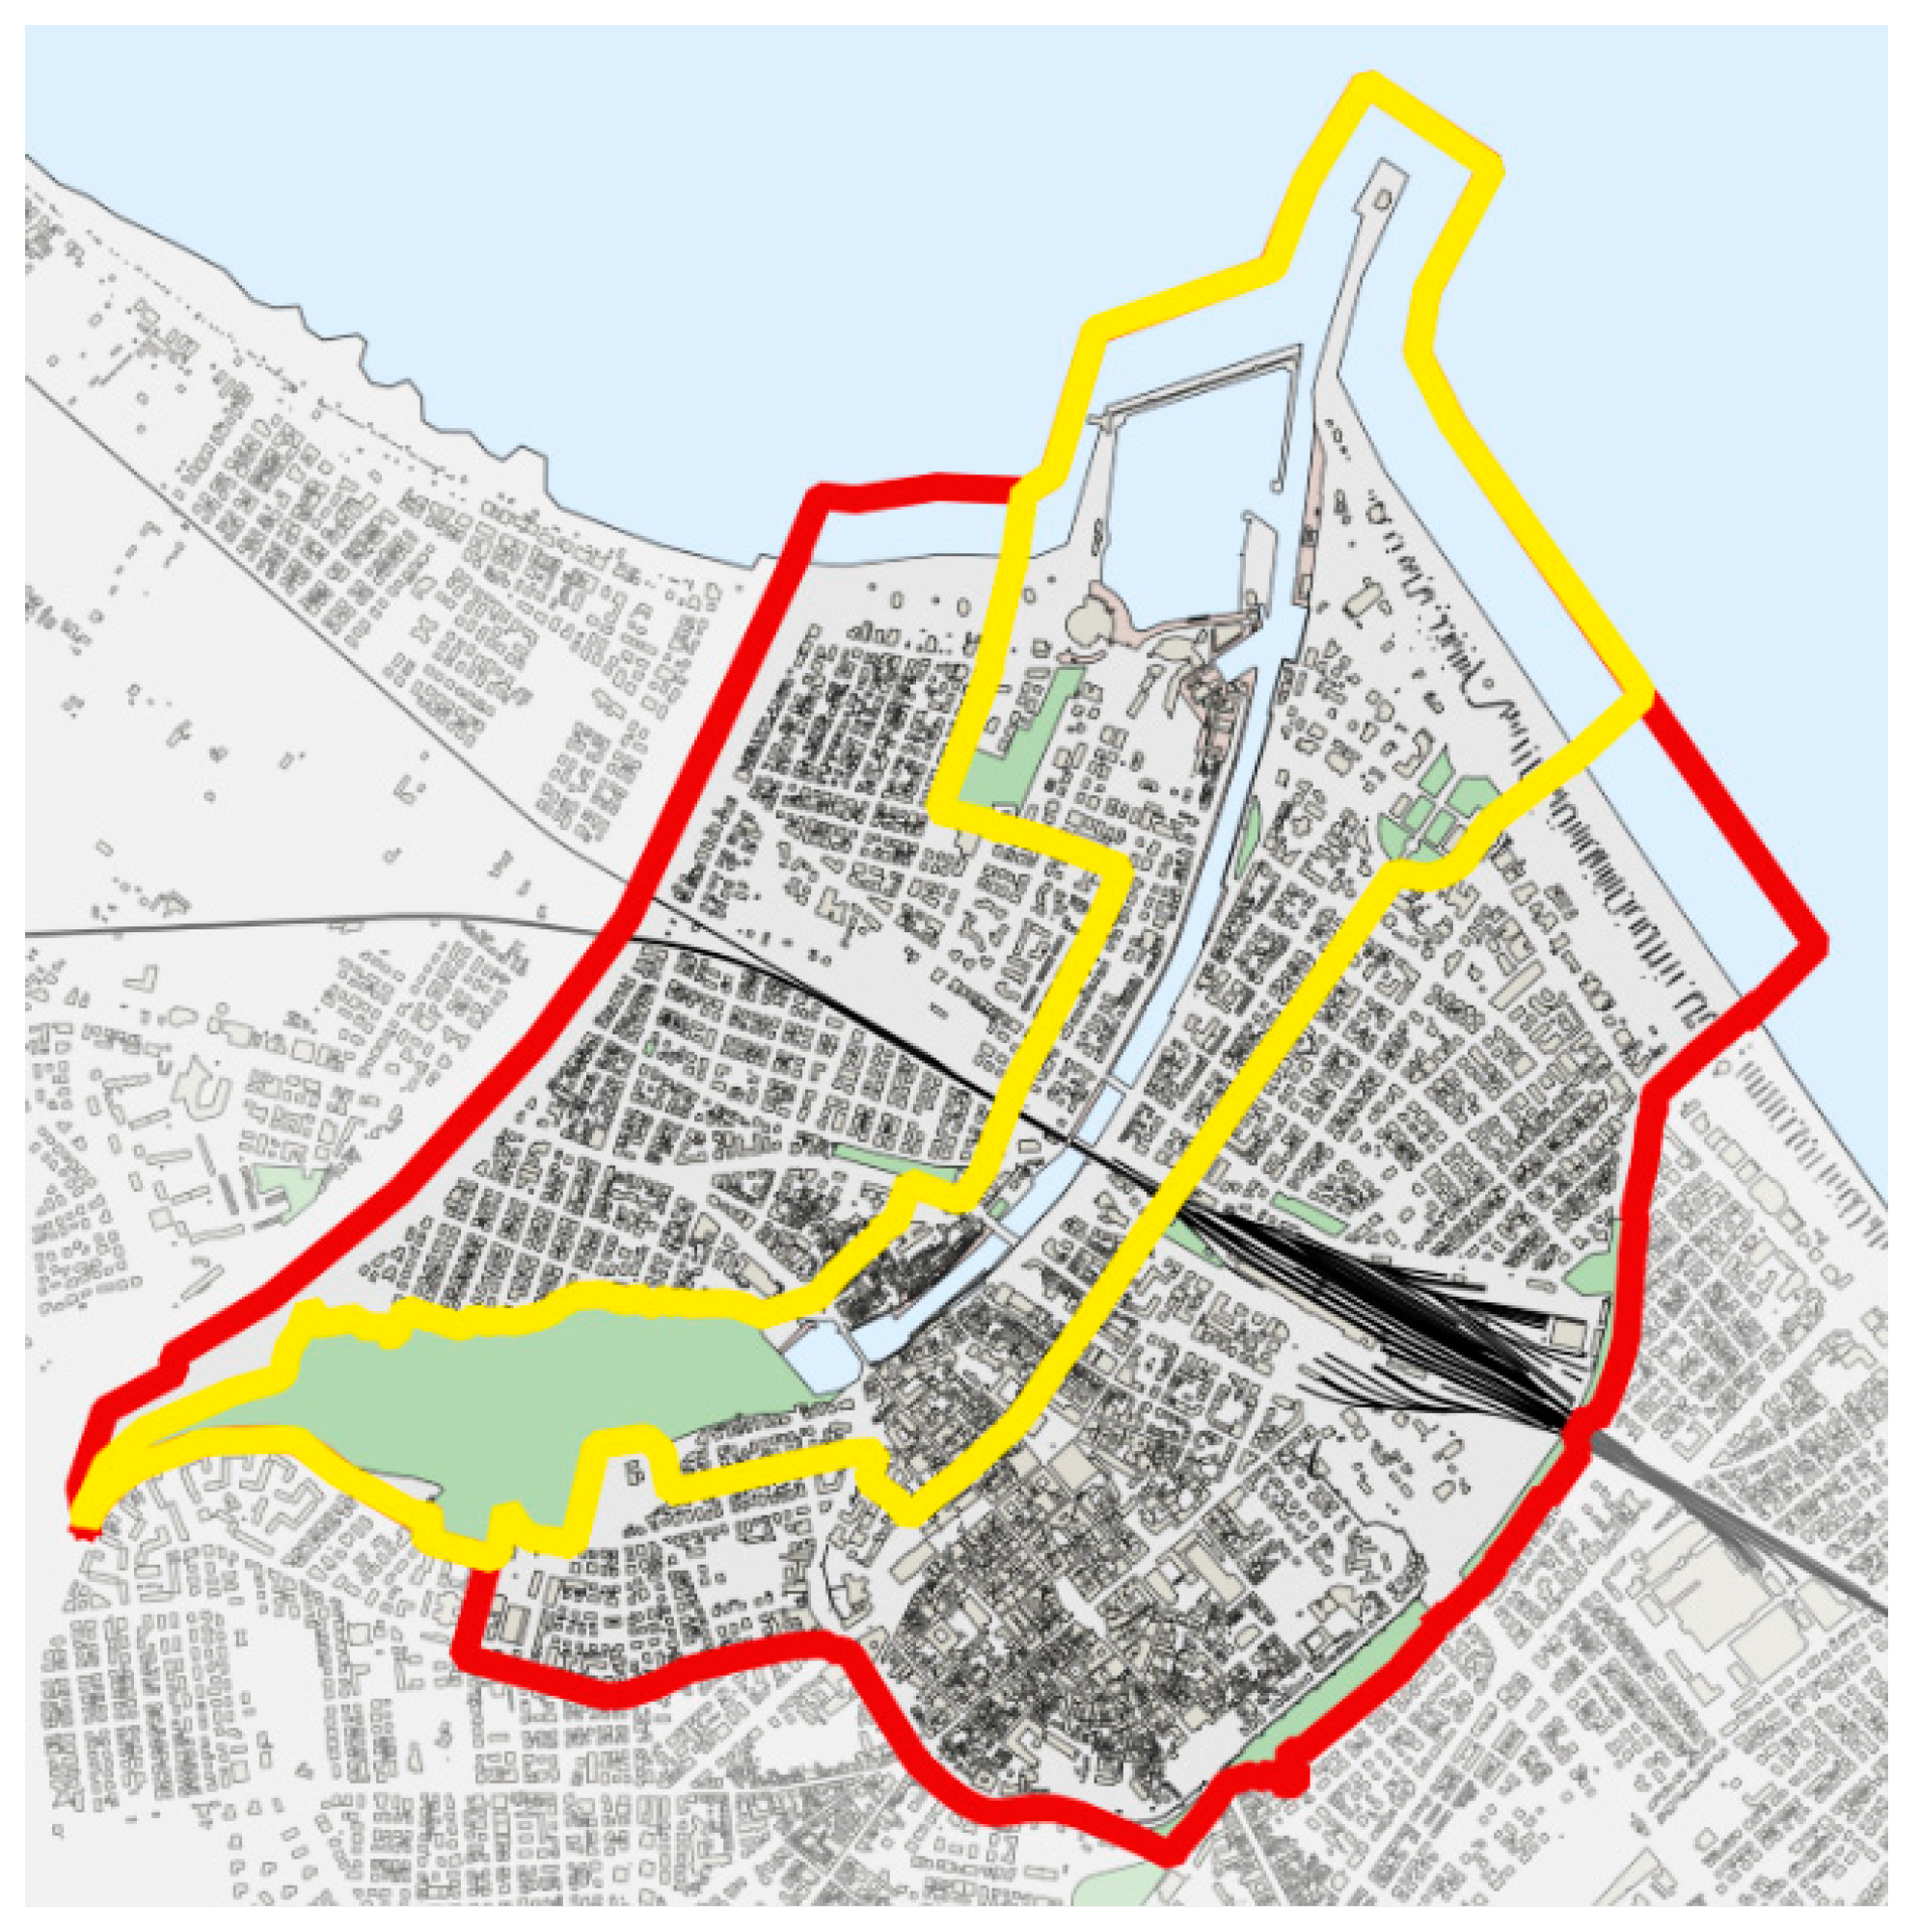
4. Case Study
5. Application
5.1. Stakeholders Involvement
5.2. Urban Regeneration Indicators
- Detectability and availability of information;
- Reliability and accuracy of data and sources;
- Comprehensibility and easy reading and interpretation;
- Validity and completeness of output information;
- Relevance in relation to the objectives set.
5.3. SWOT Analysis
5.4. BOCR Analysis
- Benefits and costs sub-networks emerge from the analysis of indicators carried out;
- Opportunities and risks sub-networks derive from the SWOT analysis.
- Comparison between clusters: more general;
- Comparison between nodes: more specific.
- Improvement of bicycle and pedestrian routes;
- Requalification and raising of quays and regularisation of moorings;
- Creation of better quality urban spaces (redevelopment of P.le Boscovich);
- Construction of the new Fish Market;
- Realisation of a new car park;
- Construction of new tourist links (Croatia);
- Implementation of the “Traghetto Vittoria” service;
- Redevelopment of the slipway;
- Maintenance of the current configuration (no intervention).
6. Discussion and Conclusions
Author Contributions
Funding
Institutional Review Board Statement
Informed Consent Statement
Data Availability Statement
Acknowledgments
Conflicts of Interest
Appendix A

| |||
| Node | Indicator | Description | UoM |
| Naturality index | Naturality index | Classification according to an increasing naturality gradient from 0 (absence of vegetation cover due to anthropogenic causes) to 10 (climax vegetation). | Rating 0–10 |
| Level of exposure to flood risk | Level of exposure to flood risk | Incidence of the number of buildings and inhabitants living in the areas affected by flood events according to the hazard scenarios defined by the PAI of the Po River Basin Authority. | Rating 1–6 |
| Soil permeability | Soil permeability | Determination of soil permeability classes, i.e., the capacity of the soil under saturated conditions to be traversed by a flow of water in a vertical direction. | Rating 1–3 |
| |||
| Node | Indicator | Description | UoM |
| Commercial and productive activities | Commercial activities | Degree of business activity in the study area | % |
| Production activities related to the canal port | Presence of productive activities linked to the canal port to navigation | no/hectare | |
| Real estate value | Real estate value | Property value assessment within the study area | EUR/m2 |
| Hotel and residence capacity | Hotel and residence capacity | Estimation of hotel and non-hotel capacity | Beds/hectare |
| |||
| Node | Indicator | Description | UoM |
| Quality of road infrastructure | Presence of 30 km/h zones | Presence of speed restricted areas | % |
| Presence of restricted traffic zone | Identification of areas subject to limited traffic zones | % | |
| Presence of pedestrian zones | Identification of pedestrian areas | % | |
| Road accidents | Index to assess road safety based on the number of accidents over the last 10 years | no/10 years | |
| Perceived safety of infrastructure | Qualitative index obtained through a questionnaire concerning the perceived safety of infrastructure users | Rating 1–10 | |
| Parking quality | Presence of car parks | Number and location of parking spaces in the area | no/inhabitant no/summer resident |
| Presence of electricity columns | Number and location of places for electric cars to encourage electric mobility | no | |
| Presence of digital parking management systems | Presence of digital systems (apps or sites) for parking management and payment | yes/no | |
| Public transport services | Bus stop coverage | Index indicating the coverage of public transport services in the territory | % |
| Population served by public transport | Index indicating the accessibility of the population to the public transport service | % | |
| Intermodalità dei trasporti | Parameter derived from the degree of satisfaction of public transport service users regarding intermodality of transport | Rating 1–10 | |
| Perceived quality of public transport services | Parameter derived from the degree of satisfaction of public transport service users with the quality of the service | Rating 1–10 | |
| Quality of bicycle and pedestrian mobility | Cyclo-pedestrian index | Linear extension of bicycle and pedestrian paths and spaces available to residents in the consolidated city | m/inhabitant m/summer resident |
| Accessibility of cycling and walking routes | The indicator aims to check the coverage of cycling and walking routes with regard to points of interest, i.e., whether the major points of attraction are accessible via dedicated soft mobility routes | % | |
| Perceived quality of cycling and walking routes | Parameter derived from the degree of satisfaction of cyclists and pedestrians with the quality of the routes dedicated to them | Rating 1–10 | |
| Continuity of the cycle-pedestrian network | Degree of continuity of bicycle and pedestrian routes through the identification of discontinuity elements present on sections | m | |
| Degree of implementation of the cycle-pedestrian network | Degree of continuity of the bicycle and pedestrian network by comparing existing and planned networks | % | |
| Crossability of the Canal Port | Degree of navigability of the Canal Port | The parameter is intended to measure the level of longitudinal permeability (navigability) of the canal port taking into account possible impediments: draught, height of bridges | % |
| Ease of crossing the Canal Port | The parameter is intended to measure the level of transversal permeability (crossing) by measuring on average every how many metres there is a bridge | m | |
| |||
| Node | Indicator | Description | UoM |
| Quality of public space | Incidence of outdoor public spaces used as squares or meeting places | Presence of public areas intended as meeting places and for events, demonstrations, etc. | m2/inhabitant m2/summer resident |
| Accessibility of public spaces | Parameter for measuring the accessibility of public spaces by residents and tourists on foot | % | |
| Perceived quality of public space | Parameter derived through the citizens’ rank regarding the quality, adequacy, safety, and usability of public spaces dedicated to them | Rating 1–5 | |
| Integration of the Canal Port into the Urban Landscape | The parameter aims to measure the extent to which the perception of the natural and urban landscape is integrated and enhanced | Rating 1–5 | |
| Coverage ratio | Coverage ratio | Useful indicator for identifying the incidence of covered area and its arrangement in relation to the total area | % |
| Population density | Population density | Indicator for understanding the distribution of population density in the area | Inhabitant/hectare |
| Functional variety of buildings | Functional variety of buildings | Identification of the presence and distribution of use functions in the area | % |
| Phenomena of urban decay | Phenomena of urban decay | Identification of spaces or buildings subject to degradation | Rating 1–5 |
| Public greenery | Incidenza del verde | Identification of green and sports areas present per inhabitant | m2/inhabitant m2/summer resident |
| Presence of trees | Identification of trees in the area | no/hectare | |
| |||
| Node | Indicator | Description | UoM |
| Territorial coverage and level of accessibility of education services | Coverage of childcare services | Value to indicate the actual availability of places that the service, consisting of nursery and kindergarten, provides in relation to the number of people using it | % |
| Primary school coverage (5–14 years old) | Value to indicate the actual availability of places that the service, consisting of primary and secondary schools, provides in relation to the number of people using it | % | |
| Secondary school coverage (15–19 years old) | Value to indicate the actual availability of places that the service, consisting of secondary schools, provides in relation to the number of people using it | % | |
| Accessibility of childcare services | Value for indicating whether the service is accessible by soft transport mode (cycling or walking) by the population using it | % | |
| Primary school accessibility | Value for indicating whether the service is accessible by soft transport mode (cycling or walking) by the population using it | % | |
| Secondary school accessibility | Value for indicating whether the service is accessible by soft transport mode in relation to the population using it | % | |
| Coverage of social and health services | Copertura servizi socio-sanitari | Value to indicate the actual presence of socio-medical facilities, consisting of public and private hospitals, RSAs, outpatient clinics and cp, compared to the number of people using them | no/1000 inhabitants |
| Coverage of recreational and sporting activities | Coverage of recreational and sporting activities | Value for indicating the actual presence of sports facilities in relation to the number of people using them | no/1000 inhabitants |
| Coverage of cultural activities | Coverage of theatres and cultural associations | Value to indicate the actual presence of structures and associations promoting socio-cultural events and activities | no |
| Cultural and entertainment events | Presence and frequency of cultural and entertainment events | no/year | |
| Presence of points of touristic interest | Identification of points of interest and tourist attractions | no/hectare | |
| Covering places of worship | Covering places of worship | Presence of places of worship and meeting places for religious minorities | no/hectare |
| Phenomena of social degradation | Phenomena of social degradation | Presence of phenomena of social degradation | Rating 1–5 |
| SECTION 1—TRANSPORT INFRASTRUCTURE AND SYSTEMS | |
| |
| Safety | (very bad–insufficient–sufficient–good–excellent) |
| Roads adequacy | (very bad–insufficient–sufficient–good–excellent) |
| Traffic | (very bad–insufficient–sufficient–good–excellent) |
| |
| Intermodality | (very bad–insufficient–sufficient–good–excellent) |
| Safety | (very bad–insufficient–sufficient–good–excellent) |
| |
| Visibility and illumination | (very bad–insufficient–sufficient–good–excellent) |
| Road signs | (very bad–insufficient–sufficient–good–excellent) |
| Roadway protections | (very bad–insufficient–sufficient–good–excellent) |
| Safety | (very bad–insufficient–sufficient–good–excellent) |
| Shading | (very bad–insufficient–sufficient–good–excellent) |
| Adequacy of the sidewalk/cycle-pedestrian path | (very bad–insufficient–sufficient–good–excellent) |
| |
| Availability of car parks | (very bad–insufficient–sufficient–good–excellent) |
| Time taken to find a place | (very bad–insufficient–sufficient–good–excellent) |
| Price | (very bad–insufficient–sufficient–good–excellent) |
| Shading | (very bad–insufficient–sufficient–good–excellent) |
| Proximity to the place of arrival | (very bad–insufficient–sufficient–good–excellent) |
| SECTION 2—PUBLIC SPACE | |
| |
| Lighting | (very bad–insufficient–sufficient–good–excellent) |
| Safety | (very bad–insufficient–sufficient–good–excellent) |
| Street furniture | (very bad–insufficient–sufficient–good–excellent) |
| Removal of architectural barriers | (very bad–insufficient–sufficient–good–excellent) |
| Presence of urban green | (very bad–insufficient–sufficient–good–excellent) |
| Cleaning and maintenance | (very bad–insufficient–sufficient–good–excellent) |
| Integration with the urban landscape | (very bad–insufficient–sufficient–good–excellent) |
| |
| Water quality | (very bad–insufficient–sufficient–good–excellent) |
| Water recirculation | (very bad–insufficient–sufficient–good–excellent) |
| |
| To be filled in… | |
| |
| To be filled in… | |
References
- Pellicelli, G.; Rossetti, S.; Caselli, B.; Zazzi, M. Urban regeneration as an opportunity to redesign Sustainable Mobility. Experiences from the Emilia-Romagna Regional Call. Transp. Res. Procedia 2022, 60, 576–583. [Google Scholar] [CrossRef]
- Chiang, Y.C.; Deng, Y. City gate as key towards sustainable urban redevelopment: A case study of ancient Gungnae City within the modern city of Ji’an. Habitat Int. 2017, 67, 1–12. [Google Scholar] [CrossRef]
- Pazzini, M.; Lantieri, C.; Vignali, V.; Simone, A.; Dondi, G.; Luppino, G.; Grasso, D. Case Studies in the Emilia Romagna Region in Support of Intermodality and Accessibility of Public Transport. In Advances in Mobility-as-a-Service Systems; Springer International Publishing: Berlin/Heidelberg, Germany, 2021; Volume 1278. [Google Scholar] [CrossRef]
- Schmidt, L.; Falk, T.; Siegmund-Schultze, M.; Spangenberg, J.H. The Objectives of Stakeholder Involvement in Transdisciplinary Research. A Conceptual Framework for a Reflective and Reflexive Practise. Ecol. Econ. 2020, 176, 106751. [Google Scholar] [CrossRef]
- Hou, D.; Song, Y.; Zhang, J.; Hou, M.; O’Connor, D.; Harclerode, M. Climate change mitigation potential of contaminated land redevelopment: A city-level assessment method. J. Clean. Prod. 2018, 171, 1396–1406. [Google Scholar] [CrossRef]
- United Nations Department of Economic and Social Affairs, Polupation Division. World Urbanization Prospects: The 2018 Revision. In Statistical Papers—United Nations (Ser. A); Population and Vital Statistics Report; United Nations: New York, NY, USA, 2019; Available online: https://population.un.org/wup/publications/Files/WUP2018-Report.pdf (accessed on 13 August 2022).
- Pazzini, M.; Cameli, L.; Lantieri, C.; Vignali, V.; Dondi, G.; Jonsson, T. New Micromobility Means of Transport: An Analysis of E-Scooter Users’ Behaviour in Trondheim. Int. J. Environ. Res. Public Health 2022, 19, 7374. [Google Scholar] [CrossRef] [PubMed]
- Pazzini, M.; Lantieri, C.; Vignali, V.; Simone, A.; Dondi, G.; Luppino, G.; Grasso, D. Comparison between different territorial policies to support intermodality of public transport. Transp. Res. Procedia 2022, 60, 68–75. [Google Scholar] [CrossRef]
- Boersma, K.; Berg, R.; Rijbroek, J.; Ardai, P.; Azarhoosh, F.; Forozesh, F.; de Kort, S.; van Scheepstal, A.J.; Bos, J. Exploring the potential of local stakeholders’ involvement in crisis management. The living lab approach in a case study from amsterdam. Int. J. Disaster Risk Reduct. 2022, 79, 103179. [Google Scholar] [CrossRef]
- Cheela, V.R.S.; Ranjan, V.P.; Goel, S.; John, M.; Dubey, B. Pathways to sustainable waste management in Indian Smart Cities. J. Urban Manag. 2021, 10, 419–429. [Google Scholar] [CrossRef]
- Wang, H.; Zhao, Y.; Gao, X.; Gao, B. Collaborative decision-making for urban regeneration: A literature review and bibliometric analysis. Land Use Policy 2021, 107, 105479. [Google Scholar] [CrossRef]
- Gkoltsiou, A.; Paraskevopoulou, A. Landscape character assessment, perception surveys of stakeholders and SWOT analysis: A holistic approach to historical public park management. J. Outdoor Recreat. Tour. 2021, 35, 100418. [Google Scholar] [CrossRef]
- D’Adamo, I.; Gastaldi, M.; Ioppolo, G.; Morone, P. An analysis of Sustainable Development Goals in Italian cities: Performance measurements and policy implications. Land Use Policy 2022, 120, 106278. [Google Scholar] [CrossRef]
- Hosseini, S.M.; Paydar, M.M.; Triki, C. Implementing sustainable ecotourism in Lafour region, Iran: Applying a clustering method based on SWOT analysis. J. Clean. Prod. 2021, 329, 129716. [Google Scholar] [CrossRef]
- Guzman, P. Assessing the sustainable development of the historic urban landscape through local indicators. Lessons from a Mexican World Heritage City. J. Cult. Heritage 2020, 46, 320–327. [Google Scholar] [CrossRef]
- Stacchini, A.; Guizzardi, A.; Mariotti, A. Smoothing down arbitrariness in planning: From SWOT to participatory decision making. Land Use Policy 2022, 119, 106213. [Google Scholar] [CrossRef]
- Juanpera, M.; Domenech, B.; Ferrer-Martí, L.; García-Villoria, A.; Pastor, R. Methodology for integrated multicriteria decision-making with uncertainty: Extending the compromise ranking method for uncertain evaluation of alternatives. Fuzzy Sets Syst. 2022, 434, 135–158. [Google Scholar] [CrossRef]
- Opabola, E.A.; Galasso, C. Multicriteria decision making for selecting an optimal survey approach for large building portfolios. Int. J. Disaster Risk Reduct. 2022, 76, 102985. [Google Scholar] [CrossRef]
- Ozkaya, G.; Erdin, C. Evaluation of smart and sustainable cities through a hybrid MCDM approach based on ANP and TOPSIS technique. Heliyon 2020, 6, e05052. [Google Scholar] [CrossRef]
- Nesticò, A.; Elia, C.; Naddeo, V. Sustainability of urban regeneration projects: Novel selection model based on analytic network process and zero-one goal programming. Land Use Policy 2020, 99, 104831. [Google Scholar] [CrossRef]
- Wang, H. Preliminary investigation of waterfront redevelopment in Chinese coastal port cities: The case of the eastern Dalian port areas. J. Transp. Geogr. 2014, 40, 29–42. [Google Scholar] [CrossRef]
- Munda, G. Social multi-criteria evaluation: Methodological foundations and operational consequences. Eur. J. Oper. Res. 2004, 158, 662–677. [Google Scholar] [CrossRef]
- Bottero, M.; Mondini, G.; Oppio, A. Decision Support Systems for Evaluating Urban Regeneration. Procedia-Soc. Behav. Sci. 2016, 223, 923–928. [Google Scholar] [CrossRef] [Green Version]
- Kelle, P.; Schneider, H.; Raschke, C.; Shirazi, H. Highway improvement project selection by the joint consideration of cost-benefit and risk criteria. J. Oper. Res. Soc. 2013, 64, 313–325. [Google Scholar] [CrossRef]
- Marcelo, D.; Mandri-Perrott, C.; House, S.; Schwartz, J.Z.; World Bank PPP Group. An Alternative Approach to Project Selection: The Infrastructure Prioritization Framework. 2016. Available online: https://thedocs.worldbank.org/en/doc/844631461874662700-0100022016/original/160423InfrastructurePrioritizationFrameworkFinalVersion.pdf (accessed on 9 June 2022).
- Van Wee, B. Transport and ethics: Ethics and the evaluation of transport policies and projects. In Transport and Ethics: Ethics and the Evaluation of Transport Policies and Projects; Edward Elgar Publishing: Cheltenham, UK, 2011. [Google Scholar] [CrossRef] [Green Version]
- Campello, B.S.C.; Duarte, L.T.; Romano, J.M.T. Dealing with multi-criteria decision analysis in time-evolving approach using a probabilistic prediction method. Eng. Appl. Artif. Intell. 2022, 116, 105462. [Google Scholar] [CrossRef]
- Kiker, G.A.; Bridges, T.S.; Varghese, A.; Seager, P.T.P.; Linkov, I. Application of Multicriteria Decision Analysis in Environmental Decision Making. Integr. Environ. Assess. Manag. 2005, 1, 95–108. [Google Scholar] [CrossRef] [PubMed]
- Hermans, C.M.; Erickson, J.D. Multicriteria Decision Analysis: Overview and Implications for Environmental Decision Making. In Ecological Economics of Sustainable Watershed Management; Erickson, J.D., Messner, F., Ring, I., Eds.; Emerald Group Publishing Limited: Bingley, UK, 2007; Volume 7, pp. 213–228. [Google Scholar] [CrossRef]
- Abanda, F.; Chia, E.; Enongene, K.; Manjia, M.; Fobissie, K.; Pettang, U.; Pettang, C. A systematic review of the application of multi-criteria decision-making in evaluating Nationally Determined Contribution projects. Decis. Anal. J. 2022, 5, 100140. [Google Scholar] [CrossRef]
- Frini, A.; Ben Amor, S. MUPOM: A multi-criteria multi-period outranking method for decision-making in sustainable development context. Environ. Impact Assess. Rev. 2019, 76, 10–25. [Google Scholar] [CrossRef]
- Saaty, T.L. The analytic network process. In International Series in Operations Research and Management Science; Springer: Boston, MA, USA, 2006; Volume 95, pp. 1–26. [Google Scholar] [CrossRef]
- Saaty, R.W. The Analytic Hierarchy Process-What It Is and How It Is Used. Math. Model. 1987, 9, 161–176. [Google Scholar] [CrossRef] [Green Version]
- Fountzoula, C.; Aravossis, K. Decision-Making Methods in the Public Sector during 2010–2020: A Systematic Review. Adv. Oper. Res. 2022, 2022, 1750672. [Google Scholar] [CrossRef]
- Abastante, F.; Corrente, S.; Greco, S.; Ishizaka, A.; Lami, I.M. A new parsimonious AHP methodology: Assigning priorities to many objects by comparing pairwise few reference objects. Expert Syst. Appl. 2019, 127, 109–120. [Google Scholar] [CrossRef] [Green Version]
- Khan, A.U.; Ali, Y. Analytical hierarchy process (ahp) and analytic network process methods and their applications: A twenty year review from 2000-2019. Int. J. Anal. Hierarchy Process. 2020, 12, 369–402. [Google Scholar] [CrossRef]
- Jorge-García, D.; Estruch-Guitart, V. Comparative analysis between AHP and ANP in prioritization of ecosystem services—A case study in a rice field area raised in the Guadalquivir marshes (Spain). Ecol. Informatics 2022, 70, 101739. [Google Scholar] [CrossRef]
- Jorge-García, D.; Estruch-Guitart, V. Economic Valuation of Ecosystem Services by Using the Analytic Hierarchy Process and the Analytic Network Process. Comparative Analysis Between Both Methods in the Albufera Natural Park of València (Spain). Int. J. Des. Nat. Ecodynamics 2020, 15, 1–4. [Google Scholar] [CrossRef]
- Centis, L.; Micelli, E. Regenerating Places outside the Metropolis. A Reading of Three Global Art-Related Processes and Development Trajectories. Sustainability 2021, 13, 12359. [Google Scholar] [CrossRef]
- Cerreta, M.; Elefante, A.; Rocca, L. A Creative Living Lab for the Adaptive Reuse of the Morticelli Church: The SSMOLL Project. Sustainability 2020, 12, 10561. [Google Scholar] [CrossRef]
- Shibayama, T.; Pungillo, G.; Lemmerer, H.; Nocera, S. Stakeholder involvement in decision-making process: A test assessment towards transition to autonomous vehicles. Transp. Res. Procedia 2020, 48, 2550–2568. [Google Scholar] [CrossRef]
- la Rosa, D.; Privitera, R. Lecture Notes in Civil Engineering Innovation in Urban and Regional Planning. Available online: http://www.springer.com/series/15087 (accessed on 11 August 2022).
- Yiannakou, A. Urban regeneration as a perpetual planning process: Understanding the role of stakeholders in property-led regeneration projects in Greek cities. Local Econ. J. Local Econ. Policy Unit 2020, 35, 83–104. [Google Scholar] [CrossRef]
- Sisto, R.; Lopolito, A.; van Vliet, M. Stakeholder participation in planning rural development strategies: Using backcasting to support Local Action Groups in complying with CLLD requirements. Land Use Policy 2018, 70, 442–450. [Google Scholar] [CrossRef]
- Dell’Anna, F.; Dell’Ovo, M. A stakeholder-based approach managing conflictual values in urban design processes. The case of an open prison in Barcelona. Land Use Policy 2021, 114, 105934. [Google Scholar] [CrossRef]
- Garcia, S.M.; Staples, D.J.; Chesson, J. The FAO guidelines for the development and use of indicators for sustainable development of marine capture fisheries and an australian example of their application. Ocean. Coast. Manag. 2000, 43, 537–556. [Google Scholar] [CrossRef]
- Myrtveit, I.; Stensrud, E.; Shepperd, M. Reliability and validity in comparative studies of software prediction models. IEEE Trans. Softw. Eng. 2005, 31, 380–391. [Google Scholar] [CrossRef] [Green Version]
- European Foundation (EF) for the Improvement of Living and Working. Urban Sustainability Indicators. Available online: https://www.eurofound.europa.eu/publications/report/1999/urban-sustainability-indicators (accessed on 8 February 2022).
- ISPRA. Istituto Superiore per la Protezione e la Ricerca Ambientale. Available online: https://www.isprambiente.gov.it/it/servizi/mobilita-sostenibile/strumenti (accessed on 8 February 2022).
- European Commission. Sustainable Urban Mobility Indicators. Available online: https://transport.ec.europa.eu/transport-themes/clean-transport-urban-transport/sumi_en (accessed on 8 February 2022).
- Turner, P.; Walker, J.; Klehr, M. International Association of Public Transport. Urban Mobility Indicators for Walking and Public Transport. Available online: https://ec.europa.eu/futurium/en/system/files/ged/convenient-access-to-public-transport.pdf (accessed on 8 February 2022).
- Tsinghua University and McKinsey & Company. The Urban China Initiative. A Joint Initiative of Columbia University. The Urban Sustainability Index: A New Tool for Measuring China’s Cities. Available online: http://www.urbanchinainitiative.org/en/resources/report_2.html (accessed on 8 February 2022).
- Sponsored by S. A. Economist Intelligence Unit (London). The Green City Index. A summary of the Green City Index Research Series. Available online: https://www.siemens.com/entry/cc/features/greencityindex_international/all/en/pdf/gci_report_summary.pdf (accessed on 8 February 2022).
- R. G. L. Together with the Contribution of the E. Panel. European Green Capital Award Secretariat. Expert Panel. Technical Assessment Synopsis Report. European Green Capital Award. 2023. Available online: https://ec.europa.eu/environment/europeangreencapital/wp-content/uploads/2021/07/EGCA_2023_Technical_Assessment_Synopsis_Report.pdf (accessed on 8 February 2022).
- Sustainable Cities International (SCI). Indicators for Sustainability. How Cities Are Monitoring and Evaluating Their Success. Available online: http://sustainablecities.net/indicators-for-sustainability/ (accessed on 8 February 2022).
- Sharifi, A.; Yamagata, Y. Urban Resilience Assessment: Multiple Dimensions, Criteria, and Indicators. Urban Resilience; Advanced Sciences and Technologies for Security Applications; Springer: Cham, Switzerland, 2016. [Google Scholar] [CrossRef]
- Cutter, S.L.; Burton, C.G.; Emrich, C.T. Disaster Resilience Indicators for Benchmarking Baseline Conditions. J. Homel. Secur. Emerg. Manag. 2010, 7. [Google Scholar] [CrossRef]
- Frazier, T.G.; Thompson, C.M.; Dezzani, R.J.; Butsick, D. Spatial and temporal quantification of resilience at the community scale. Appl. Geogr. 2013, 42, 95–107. [Google Scholar] [CrossRef]
- Yüksel, I.; Dagdeviren, M. Using the analytic network process (ANP) in a SWOT analysis–A case study for a textile firm. Inf. Sci. 2007, 177, 3364–3382. [Google Scholar] [CrossRef]
- Datola, G.; Bottero, M.; de Angelis, E. Enhancing Urban Resilience Capacities: An Analytic Network Process-based Application. Environ. Clim. Technol. 2021, 25, 1270–1283. [Google Scholar] [CrossRef]
- Ioppolo, G.; Saija, G.; Salomone, R. From coastal management to environmental management: The sustainable eco-tourism program for the mid-western coast of Sardinia (Italy). Land Use Policy 2012, 31, 460–471. [Google Scholar] [CrossRef]
- Starr, M.; Joshi, O.; Will, R.; Zou, C.B. Perceptions regarding active management of the Cross-timbers forest resources of Oklahoma, Texas, and Kansas: A SWOT-ANP analysis. Land Use Policy 2018, 81, 523–530. [Google Scholar] [CrossRef]
- Arsić, S.; Nikolić, D.; Mihajlović, I.; Fedajev, A.; Živković, Ž. A New Approach Within ANP-SWOT Framework for Prioritization of Ecosystem Management and Case Study of National Park Djerdap, Serbia. Ecol. Econ. 2018, 146, 85–95. [Google Scholar] [CrossRef]
- Fan, T.; Xue, D.Q. Sustainable Development of Cultural Industry in Shaanxi Province of Northwest China: A SWOT and AHP Analysis. Sustainability 2018, 10, 2830. [Google Scholar] [CrossRef] [Green Version]
- Zorpas, A.A.; Voukkali, I.; Pedreño, J.N. Tourist area metabolism and its potential to change through a proposed strategic plan in the framework of sustainable development. J. Clean. Prod. 2018, 172, 3609–3620. [Google Scholar] [CrossRef]
- Bottero, M.; di Torino, P.; Lami, I.; Lucia, P.; Politecnico, L.; Torino, D. Analytic Network Process. La valutazione di Scenari Di Trasformazione Urbana e Territoriale Application of Territorial Integrated Evaluation for the Construction of Territorial Retail Scenarios in the Province of Trento View Project Pocacito-POst-CArbon CIties of TOmorrow-Foresight for Sustainable Pathways towards Liveable, Affordable and Prospering Cities in a World Context View Project. 2008. Available online: https://www.researchgate.net/publication/299496372 (accessed on 11 August 2022).
- Assumma, V.; Bottero, M.; De Angelis, E.; Lourenço, J.M.; Monaco, R.; Soares, A.J. A decision support system for territorial resilience assessment and planning: An application to the Douro Valley (Portugal). Sci. Total. Environ. 2020, 756, 143806. [Google Scholar] [CrossRef]
- Assumma, V.; Bottero, M.; Mondini, G.; Zanetta, E. An Analytic Network Process (ANP)-Based Approach for Investigating Alternative Planning Scenarios of Mining Activities in Piedmont Region. In International Conference on Computational Science and Its Applications; Springer: Cham, Switzerland, 2020; Volume 12253, pp. 355–365. [Google Scholar] [CrossRef]
- Wijnmalen, D.J. Analysis of benefits, opportunities, costs, and risks (BOCR) with the AHP–ANP: A critical validation. Math. Comput. Model. 2007, 46, 892–905. [Google Scholar] [CrossRef]
- Bottero, M.; Assumma, V.; Caprioli, C.; Dell’Ovo, M. Decision making in urban development: The application of a hybrid evaluation method for a critical area in the city of Turin (Italy). Sustain. Cities Soc. 2021, 72, 103028. [Google Scholar] [CrossRef]
- Saaty, T.L. Decision making—The Analytic Hierarchy and Network Processes (AHP/ANP). J. Syst. Sci. Syst. Eng. 2004, 13, 1–35. [Google Scholar] [CrossRef]
- Municipality of Rimini. Accordo Territoriale per la Valorizzazione Ambientale della Fascia di Territorio Compresa tra L’arenile e il Margine della Citta’ Costruita, Finalizzata alla Realizzazione del Parco del Mare. 2019. Available online: https://archivio.comune.rimini.it/sites/comune.rimini.it/files/accordoterritorialeparcomare.pdf (accessed on 22 December 2022).
- Nardino, M.; Georgiadis, T.; Cremonini, L. Studio del Microclima Locale per il Progetto Parco del Mare 1 Studio del Microclima Locale per il Progetto Parco del Mare, Comune di Rimini i Parte. Available online: http://www.smr.arpa.emr.it/dext3r/ (accessed on 22 December 2022).
- Transforming Our World: The 2030 Agenda for Sustainable Development Transforming Our World: The 2030 Agenda for Sustainable Development Preamble. 2015. Available online: https://sdgs.un.org/2030agenda (accessed on 11 February 2022).
- Corticelli, R.; Pazzini, M.; Mazzoli, C.; Lantieri, C.; Ferrante, A.; Vignali, V. Urban Regeneration and Soft Mobility: The Case Study of the Rimini Canal Port in Italy. Sustainability 2022, 14, 14529. [Google Scholar] [CrossRef]


|
| Improve the sustainability of the city and contain its expansion, focusing on improving environmental conditions in parallel with the implementation of the functions provided. Urban regeneration projects must ensure health and well-being through the application of bio-climatic principles. |
|
| Develop economic benefits for investors, public authorities, and citizens. Projects must balance the technical quality, timing, implementation efficiency, and overall cost of the intervention in coherence with the general development of the city as defined by the general urban and planning instruments. Finally, projects must have the capacity to produce lasting economic growth in the urban area. |
|
| Promote active mobility and public transport that contribute to reducing the environmental impact of mobility but also to improving citizens’ lifestyles. The regeneration of road space must be integrated with the regeneration of the urban fabric, improving the quality of public space. |
|
| Rebuild brownfield or degraded areas in a balanced and fully integrated way with the rest of the city, producing attractiveness for users–residents, city users, and businesses and investors. Improve connections, define a sustainable urban layout, balance functions. The objective is to build a relational space integrated in the urban context, a safe and flexible environment where civil coexistence and social aggregation are favoured. |
|
| Promoting cohesion and articulation of the social mix, offering adequate personal and family services, tailored to the real needs of the urban space. To develop a sense of belonging and identity by meeting the challenges of urban development. |
| Type of Stakeholders | Area of Expertise |
|---|---|
| Associations |
|
| Institutions |
|
| Cluster | Node | Indicator | Source | Relative Score | Normalised Rating | Avg | B/C |
|---|---|---|---|---|---|---|---|
| 1: Environmental aspects | Naturality index | Naturality index | OpenData—Municupality of Rimini | Class 2 | 2 | 2.0 | C |
| Level of exposure to flood risk | Level of exposure to flood risk | Hydrogeological plan—Emilia Romagna Region | P5 | 4 | 4.0 | C | |
| Soil permeability | Soil permeability | OpenData—Municupality of Rimini | Class 2 | 9 | 9.0 | B | |
| 2: Economic aspects | Commercial and productive activities | Commercial activities | Cadastral office | 31% | 7 | 8.5 | B |
| Production activities related to the canal port | On-site inspection | 0.12/ha | 10 | ||||
| Real estate value | Real estate value | Real estate market observatory | 2650 EUR/m2 | 7 | 7.0 | B | |
| Hotel and residence capacity | Hotel and residence capacity | OpenData—Municupality of Rimini | 88.18 beds/ha | 7 | 7.0 | B | |
| 3: Infrastructural aspects | Quality of road infrastructure | Presence of 30 km/h zones | OpenData—Municupality of Rimini | 44% | 10 | 8.6 | B |
| Presence of restricted traffic zone | OpenData—Municupality of Rimini | 4.6% | 10 | ||||
| Presence of pedestrian zones | OpenData—Municupality of Rimini | 0.1% | 10 | ||||
| Road accidents | OpenData—Municupality of Rimini | 15.15/10 years | 10 | ||||
| Perceived safety of infrastructure | Survey | 5 | 5 | ||||
| Parking quality | Presence of car parks | OpenData—Municupality of Rimini | 0.030 m2/summer resident | 2 | 1.5 | C | |
| Presence of electricity columns | OpenData—Municupality of Rimini | 1 | 1 | ||||
| Public transport services | Presence of digital parking management systems | On-site inspection | 84.8% | 10 | 7.8 | B | |
| Bus stop coverage | Public transport company (START E-R) | 100% | 10 | ||||
| Population served by public transport | Public transport company (START E-R) | 5 | 5 | ||||
| Transport intermodality | Survey | 6 | 6 | ||||
| Quality of bicycle and pedestrian mobility | Perceived quality of public transport services | Survey | 0.58 m/summer resident | 8 | 8.3 | B | |
| Cyclo-pedestrian index | OpenData—Municupality of Rimini | 100% | 10 | ||||
| Accessibility of cycling and walking routes | OpenData—Municupality of Rimini | 7 | 7 | ||||
| Perceived quality of cycling and walking routes | Survey | 1257 m | 8 | ||||
| Continuity of the cycle–pedestrian network | Continuity of the cycle-pedestrian network | On-site inspection | 6.67% | 10 | 10.0 | B | |
| Crossability of the Canal Port | Degree of implementation of the cycle–pedestrian network | SUMP | 83.5% | 8 | 5.5 | C | |
| Degree of navigability of the Canal Port | On-site inspection | 406.2 m | 3 | ||||
| 4: Urban aspects | Quality of public space | Incidence of outdoor public spaces used as squares or meeting places | On-site inspection | 32.9 m2/summer resident | 10 | 7.3 | B |
| Accessibility of public spaces | On-site inspection, Geographic Information System | 100% | 10 | ||||
| Perceived quality of public space | Survey | 4 | 4 | ||||
| Integration of the Canal Port into the Urban Landscape | Survey | 5 | 5 | ||||
| Coverage ratio | Coverage ratio | OpenData—Municupality of Rimini | 40.8% | 6 | 6.0 | B | |
| Population density | Population density | OpenData—Municupality of Rimini, Geographic Information System | 44.56 inhabitants/ha | 4 | 4.0 | C | |
| Functional variety of buildings | Functional variety of buildings | Cadastral office | 4 | 4 | 4.0 | C | |
| Phenomena of urban decay | Phenomena of urban decay | Survey | 3 | 3 | 3.0 | C | |
| Public greenery | Presence of green area | OpenData—Municupality of Rimini | 33.0 m2/summer resident | 9 | 8.5 | B | |
| Presence of trees | OpenData—Municupality of Rimini | 5.92/ha | 8 | ||||
| 5: Social aspects | Territorial coverage and level of accessibility of education services | Coverage of childcare services | Geographic Information System (SIT) | 51% | 7 | 6.2 | B |
| Primary school coverage (5–14 years old) | Geographic Information System (SIT) | 36% | 7 | ||||
| Secondary school coverage (15–19 years old) | Geographic Information System (SIT) | 41% | 5 | ||||
| Accessibility of childcare services | Geographic Information System (SIT) | 64% | 7 | ||||
| Primary school accessibility | Geographic Information System (SIT) | 66% | 6 | ||||
| Secondary school accessibility | Geographic Information System (SIT) | 38.3% | 5 | ||||
| Coverage of social and health services | Coverage of socio-medical services | OpenData—Municupality of Rimini, on-site inspection | 0.85/1000 inhabitants | 10 | 10.0 | B | |
| Coverage of recreational and sporting activities | Coverage of recreational and sporting activities | OpenData—Municupality of Rimini, on-site inspection | 0.34/1000 inhabitants | 8 | 8.0 | B | |
| Coverage of cultural activities | Coverage of theatres and cultural associations | On-site inspection | 2 | 6 | 7.3 | B | |
| Cultural and entertainment events | Tourist office | 6/year | 9 | ||||
| Presence of points of touristic interest | OpenData—Municupality of Rimini, | 0.19/ha | 7 | ||||
| Covering places of worship | Covering places of worship | OpenData—Municupality of Rimini, | 0.048/ha | 9 | 9.0 | B | |
| Phenomena of social degradation | Phenomena of social degradation | Survey | 4 | 4 | 4.0 | C |
| Strengths | Weakness |
|
|
|
|
|
|
|
|
|
|
|
|
|
|
| |
| |
| |
| Opportunities | Threats |
|
|
|
|
|
|
|
|
|
|
|
|
| Cluster | Nodes |
|---|---|
| 2. Economic aspects | Realisation of the new Fish Market |
| Construction of new tourist links (Croatia) | |
| 3. Infrastructural aspects | Exchanger parking located in a strategic position to promote intermodality |
| Restitching of cycle–pedestrian paths and interconnection of socio-cultural poles | |
| Cycle connection near the Tiberius Bridge | |
| Increase of Zone 30 and cycle–pedestrian paths | |
| Implementation of the SUMP to improve the connectivity of the urban fabric | |
| 4. Urban aspects | Creating better quality urban spaces |
| Functional spaces for loading and unloading goods and at the same time attractive for tourists | |
| Raising docks and regularising moorings | |
| Redevelopment of the docks and consequent improvement of quality and safety of public spaces | |
| Redevelopment of the slipway |
| Cluster | Nodes |
|---|---|
| Management of the hydraulics of the canal (diverter of the Marecchia river) |
| Insufficient funds for the creation of new areas |
| Involvement of many different actors with different needs that do not find a common point | |
| Increase in demand for parking in the Canal Port area |
| Shape of urban areas that represents an obstacle to the continuity of the network |
| Disuse of spaces after the redevelopment of the Canal Port |
| Alternative | Description | Priority |
|---|---|---|
| Option 0 | Maintaining the current configuration of the Canal Port area. This solution entails considerable criticalities of an urbanistic nature (inadequacy of the docks), infrastructural (interruptions to the cycle–pedestrian network), and social (lack of community spaces). | 5.74% |
| Option 1 | Creation of better quality urban spaces and improvement of existing community spaces (P.le Boscovich). | 15.51% |
| Option 2 | Implementation of the ferry service in cooperation with START (local public transport). | 7.05% |
| Option 3 | Interchange car park strategically located to promote intermodality. | 9.63% |
| Option 4 | Reconnection of cycle and pedestrian paths and interconnection of socio-cultural poles of attraction. | 17.28% |
| Option 5 | Redevelopment and raising of docks and regularisation of moorings and consequent improvement of the quality and safety of public spaces. | 16.83% |
| Option 6 | Construction of the new Fish Market. | 12.72% |
| Option 7 | Construction of new tourist connections (Croatia). | 8.35% |
| Option 8 | Redevelopment of the slipway. | 6.89% |
Disclaimer/Publisher’s Note: The statements, opinions and data contained in all publications are solely those of the individual author(s) and contributor(s) and not of MDPI and/or the editor(s). MDPI and/or the editor(s) disclaim responsibility for any injury to people or property resulting from any ideas, methods, instructions or products referred to in the content. |
© 2022 by the authors. Licensee MDPI, Basel, Switzerland. This article is an open access article distributed under the terms and conditions of the Creative Commons Attribution (CC BY) license (https://creativecommons.org/licenses/by/4.0/).
Share and Cite
Pazzini, M.; Corticelli, R.; Lantieri, C.; Mazzoli, C. Multi-Criteria Analysis and Decision-Making Approach for the Urban Regeneration: The Application to the Rimini Canal Port (Italy). Sustainability 2023, 15, 772. https://doi.org/10.3390/su15010772
Pazzini M, Corticelli R, Lantieri C, Mazzoli C. Multi-Criteria Analysis and Decision-Making Approach for the Urban Regeneration: The Application to the Rimini Canal Port (Italy). Sustainability. 2023; 15(1):772. https://doi.org/10.3390/su15010772
Chicago/Turabian StylePazzini, Margherita, Rachele Corticelli, Claudio Lantieri, and Cecilia Mazzoli. 2023. "Multi-Criteria Analysis and Decision-Making Approach for the Urban Regeneration: The Application to the Rimini Canal Port (Italy)" Sustainability 15, no. 1: 772. https://doi.org/10.3390/su15010772