
Order of Intermittent Rock Fractured Surfaces


Institute of Innovation, Science and Sustainability, Federation University Australia, Ballarat, VIC 3350, Australia
*
Authors to whom correspondence should be addressed.
Sustainability 2023, 15(1), 745; https://doi.org/10.3390/su15010745
Submission received: 28 September 2022
/
Revised: 29 December 2022
/
Accepted: 30 December 2022
/
Published: 31 December 2022
Abstract
:According to chaos theory, some underlying patterns can disclose the order of disordered systems. Here, it has been discussed that intermittency of rough rock fractured surfaces is an orderable disorder at intermediate length scales. However, this kind of disorder is more complicated than simple fractal or even multi-scaling behaviours. It is planned to deal with some multifractal spectra that systematically change as a function of the analysed domain. Accordingly, some parameters are introduced that can perfectly take into account such systematic behaviour and quantify the intermittency of the studied surfaces. This framework can be used to quantify and model the roughness of fractured surfaces as a prerequisite factor for the analysis of fluid flow in rock media as well as the shear strength of rock joints. Ultimately, the presented framework can be used for analysing the intermittency of time series and developing new models for predicting, for instance, seismic or flood events in a short time with higher accuracy.
1. Introduction
After the failure of a single scaling exponent, such as Hurst exponent H [1] or fractal dimension D [2], to statistically model multiscale properties of natural phenomena, multifractal formalisms have been developed [3,4,5,6,7] to tackle this issue. What is the origin of multifractal phenomena, and how to predict their scale-dependent exponents as a non-linear spectrum? These fundamental questions have been addressed in a variety of different fields and led to the emergence of new formalisms [8,9,10,11,12].
The cause of multifractality is the scale-dependency of the disorder. Rock materials, for instance, are composed of different constituents including minerals, cement and voids. Their minerals are formed from crystals with different crystalline systems. Therefore, there are different degrees of effective anisotropy and heterogeneity in rock materials at different length scales. If constant boundary conditions are considered, then this kind of disorder is the first and foremost cause of roughening of fractured surfaces and the root of multi-affine properties of their Fracture Process Zone (FPZ), as it is reported from experimental studies [13,14,15].
At small enough length scales or separations 𝛿r, there is a correlation between height variations ∆h(𝛿r) of fractured surfaces because of local similarities inside different constituents, which is scale-dependence itself. In crystalline igneous rocks like granite, for instance, at meso-scale (few hundred microns to a few millimetres) there are different rock-forming minerals with the same local properties, but at micro-scale (few hundred nanometres to few hundred microns) there are different crystals with different properties making a single mineral. These apparently uniform crystals at micro-scale are no longer uniform at nano-scale due to crystal defects. The shorter the separation, the higher the correlation in a particular resolution [16]. Because of this spatial correlation, the central limit theorem fails, and the non-Gaussian distribution of height variations with fat tails can be observed [17,18], which leads to multi-affine behaviour of height variations of the fractured surfaces. However, for separations larger than a cut-off length 𝛿r > , there is no correlation and the multi-scaling spectrum of the height variations shows mono-affinity, where is the critical length scale at which a transition from multi- to mono-affinity takes place.
Variogram analysis by applying height-height correlation function [19,20] or structure function [21] together with an elaborate domain analysis for different pairs of 𝛿rmin and 𝛿rmax are employed to successfully quantify as the minimum of a mono-fractal domain with no intermittency [22]. In the course of this task, a systematic domain-dependent multi-scaling behaviour that will be discussed in this paper is observed, which can throw a spotlight on the behaviour of disordered systems at intermediate length scales.
2. Materials
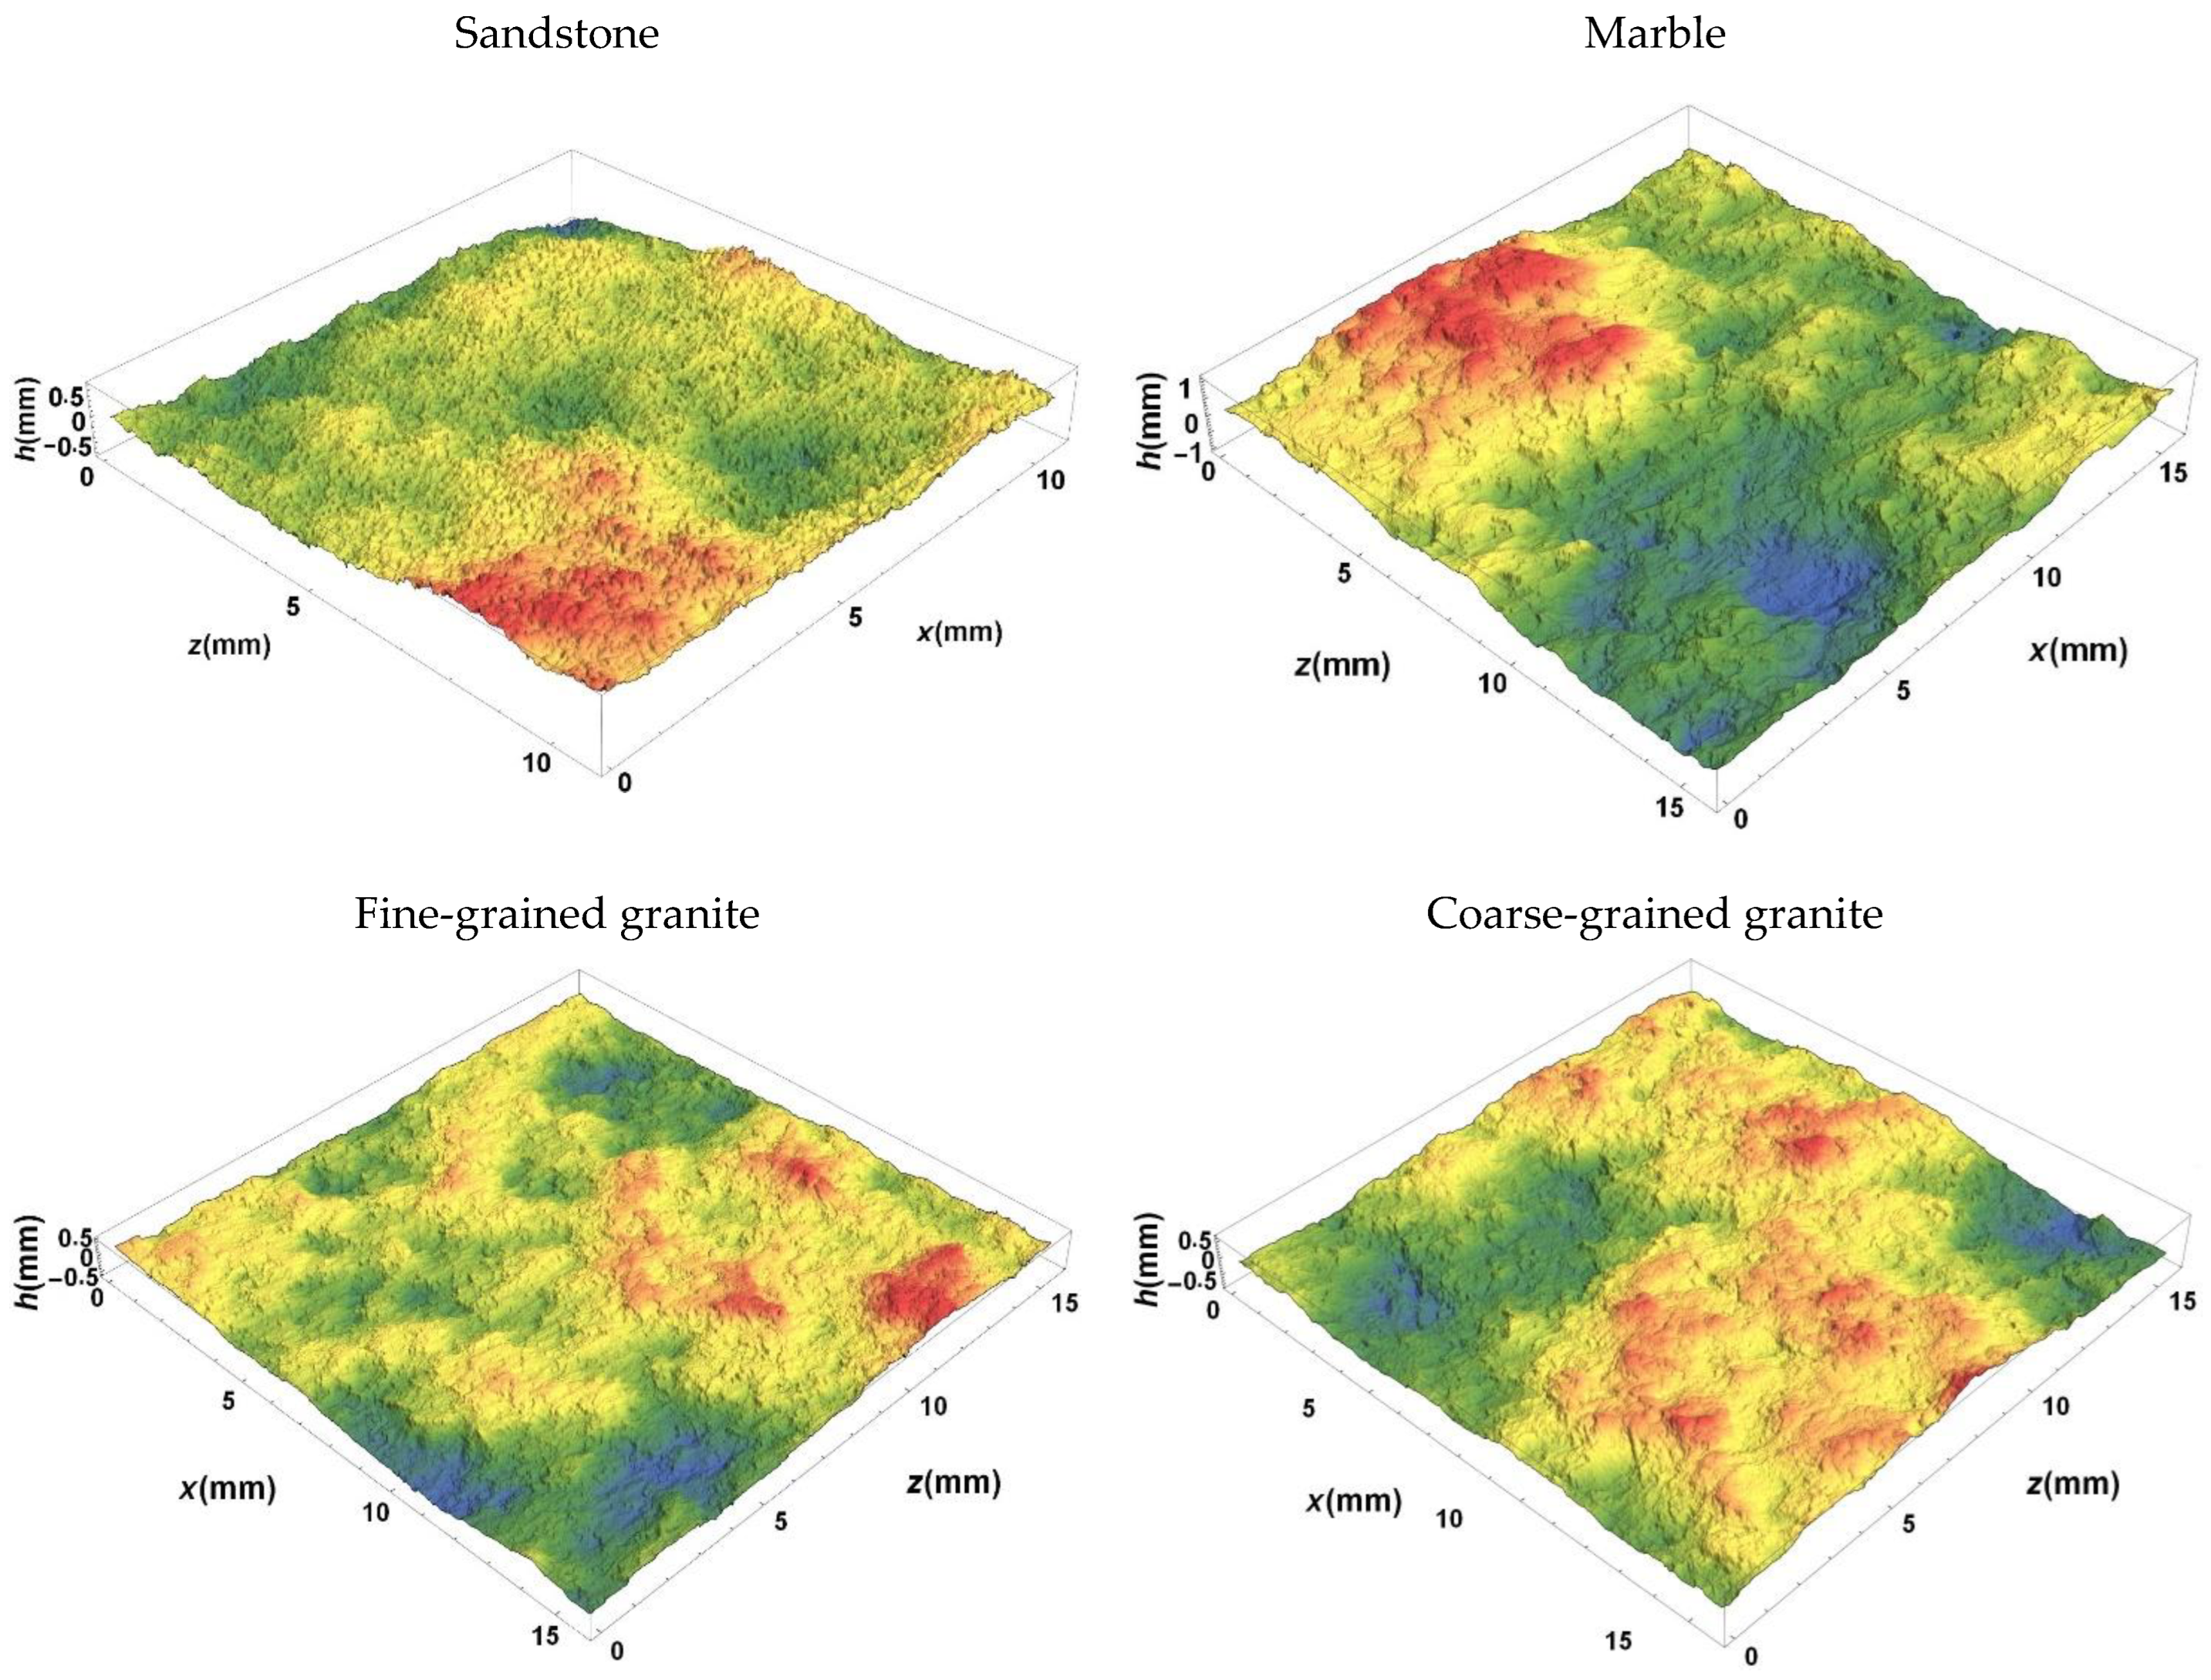
Four different rock types, including sandstone, marble, fine-grained (FG) granite and coarse-grained (CG) granite, are studied. This selection covers sedimentary, igneous and metamorphic rocks with different grain sizes. The topography of fractured surfaces, illustrated in Figure 1, has been reconstructed from 3D X-ray computed tomography data with a spatial resolution d of about 16.5 μm. The CT scanning was undertaken on the Imaging and Medical beamline at the Australian Synchrotron. It is notable that fractured surfaces are generated under a controlled quasi-static loading rate [23].
3. Results and Discussions
3.1. Multi-Fractal Rough Surfaces
This qth root of the qth moment of statistical distribution of the height fluctuations, known as qth-order structure functions Sq(𝛿r) [24], is utilized to demonstrate scale dependency of the roughness of quasi-brittle fractured surfaces, and their transition from mono-affine to multi-affine surfaces at small enough separations:
where angular brackets denote the ensemble average.
The superiority of using Sq(𝛿r) to calculate generalized Hurst exponent of turbulent phenomena is discussed in Ref. [25], and the advantages of using this method for estimating the multi-scaling spectrum are emphasised in Ref. [26]. Following [27], a relationship between generalized Hurst exponent and fractal dimension can be written as (at least for positive integer moments). Studied rough surfaces exhibit two distinct scaling regimes: they are almost mono-affine fractals at 𝛿r > , while they are multi-affine fractals at 𝛿r < . Mono-affine fractal regime can be characterized by , , and ; that is both scale and moment invariance. Intermittent multi-affine fractal regime, however, cannot be characterised by a single scale invariance exponent (the original Hurst exponent) along all separations 𝛿r and show different local 𝜁q exponents [28]. The average directional multi-scaling spectra of these multi-affine fractal regimes are statistically considered multifractals for further analyses.
3.2. Intermittency of Rough Surfaces
The high precision roughness quantification of the studied fractured surfaces reveals perfect power laws for the intermittency of multi-scaling spectra of such surfaces. These power laws are further verified analytically as they predict a range of 0 to 1 for the correlation function of rock roughness [24]. According to this finding, the intermittency of the studied multifractal spectra of rock FPZ can be quantified with a single parameter, i.e., the exponent of the power law λ for a particular domain. However, as is discussed, such intermittency is dependent on the analysed domain. Similar size-dependent power laws of intermittency of the roughness of burning fronts on papers are reported, and it is argued that statistical distribution of the height differences can be modelled using stable Levy distribution [29].
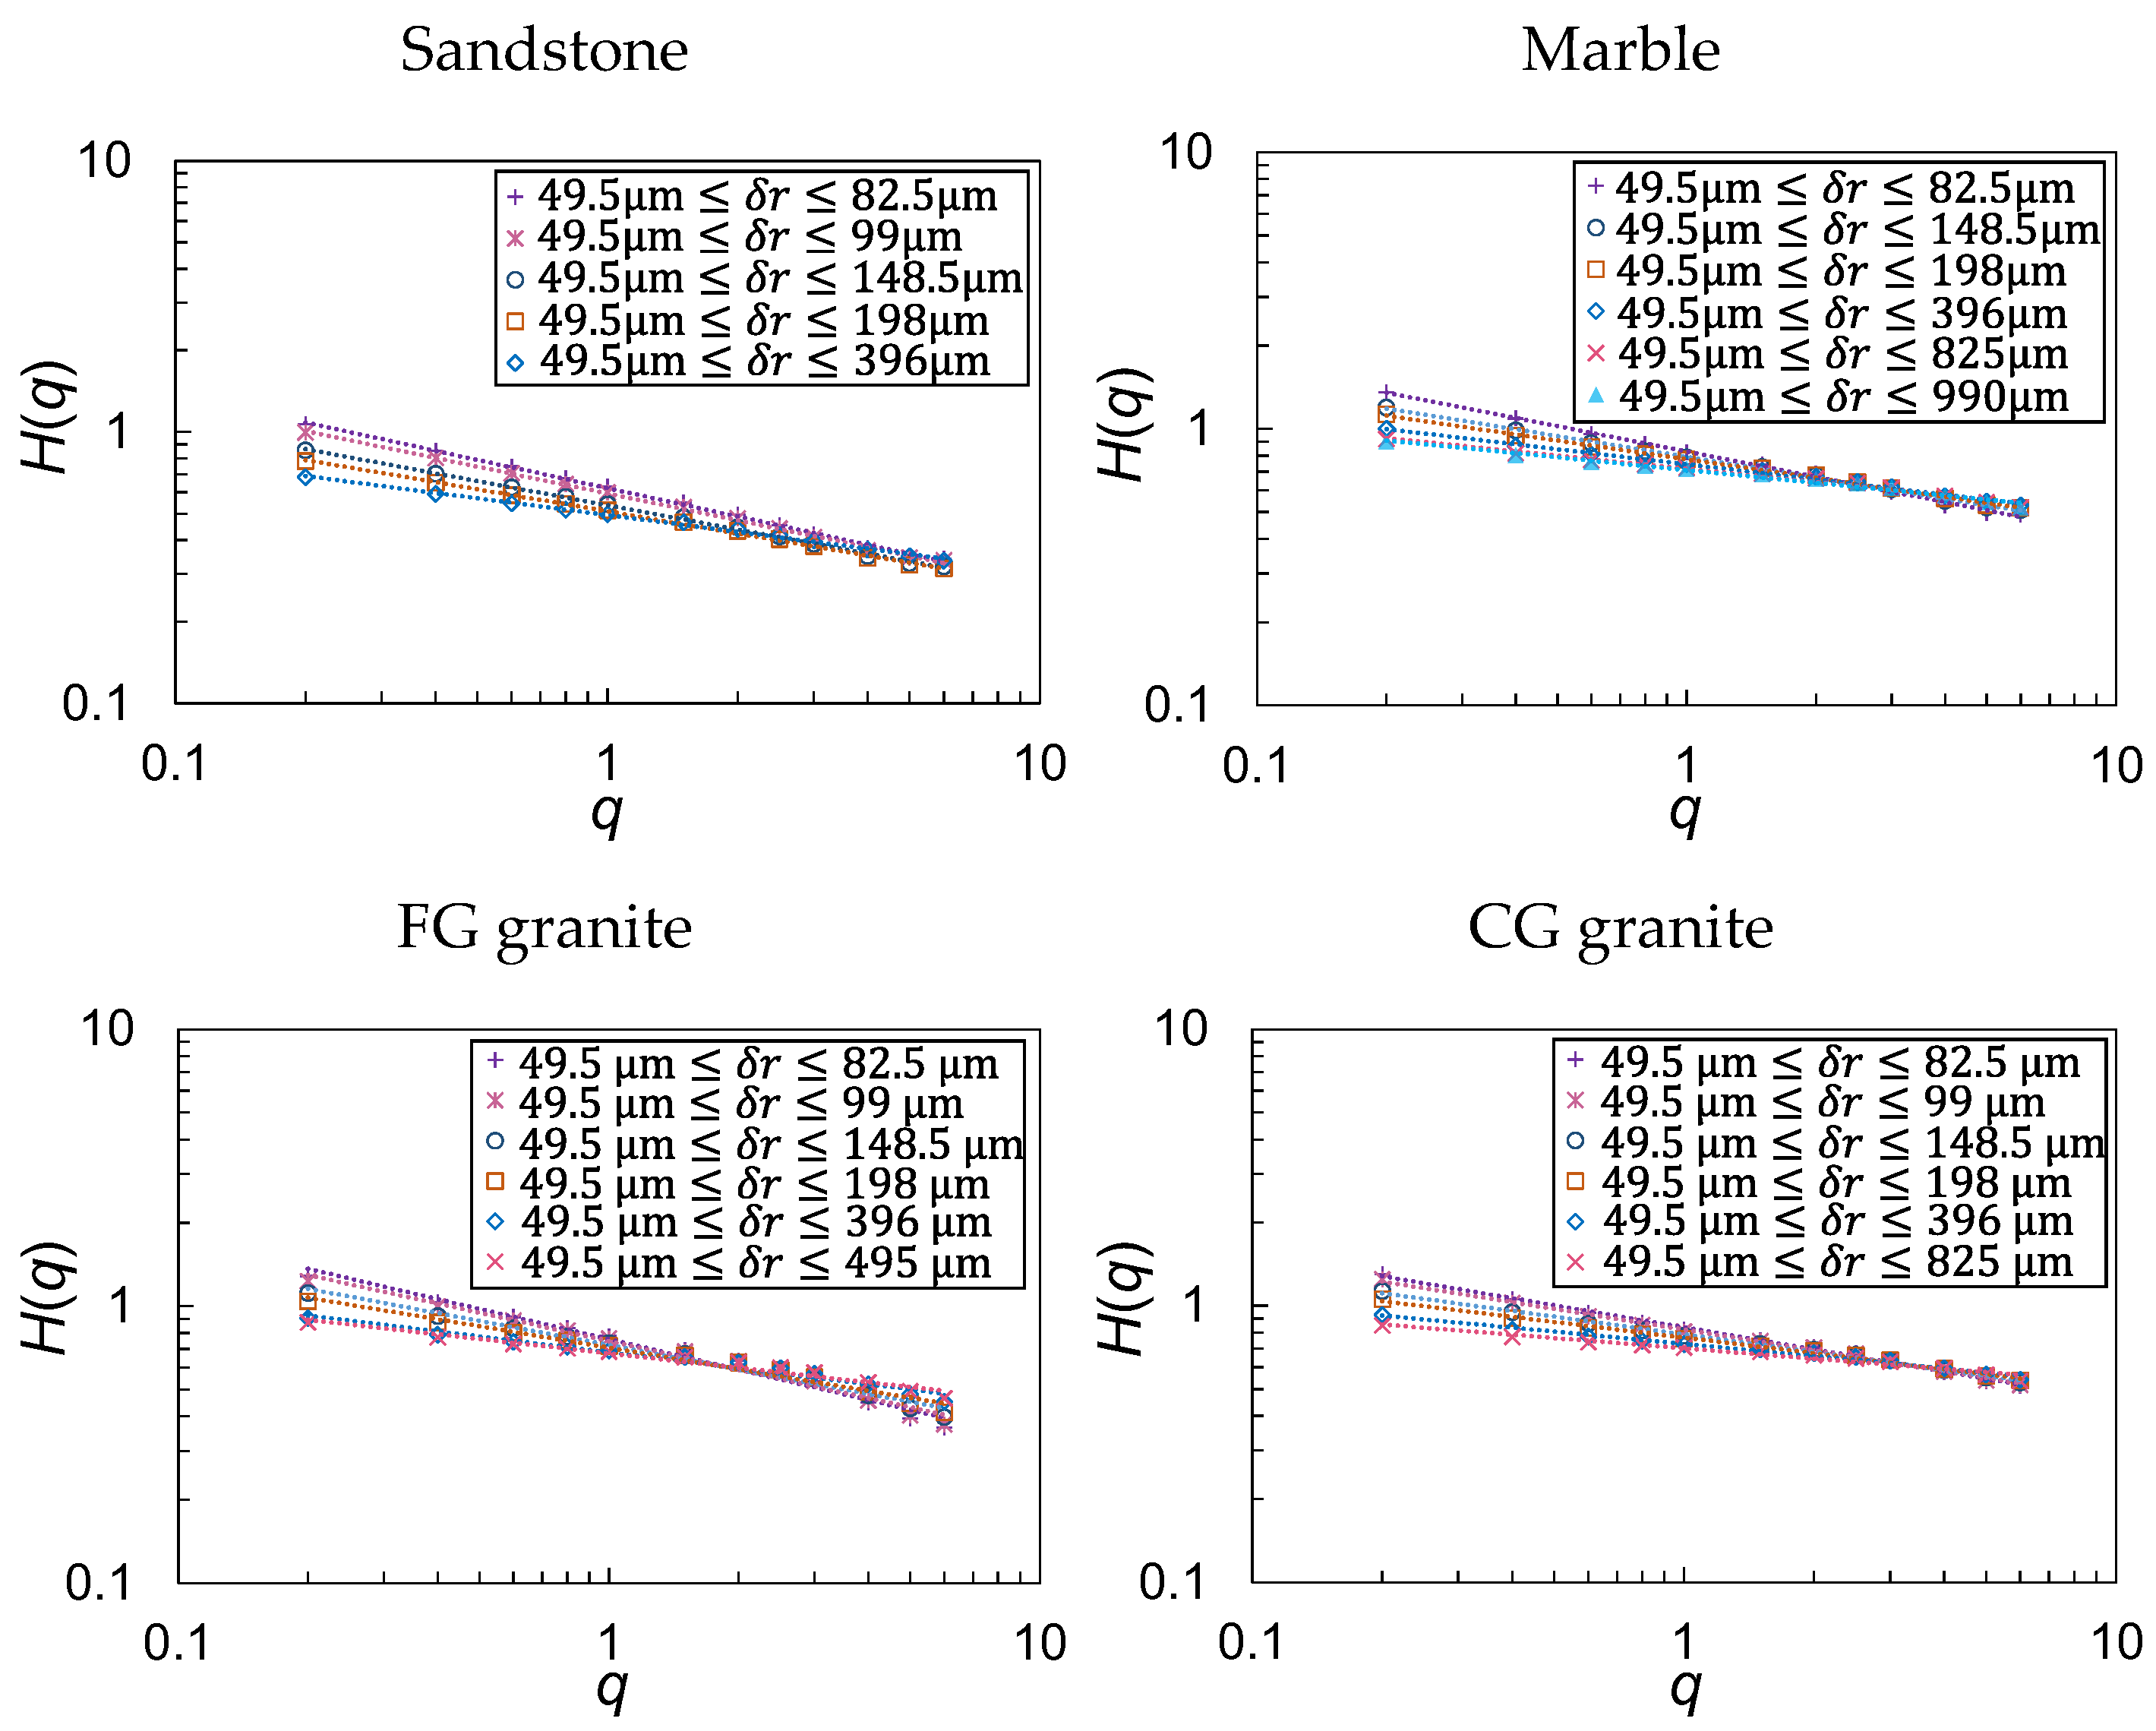
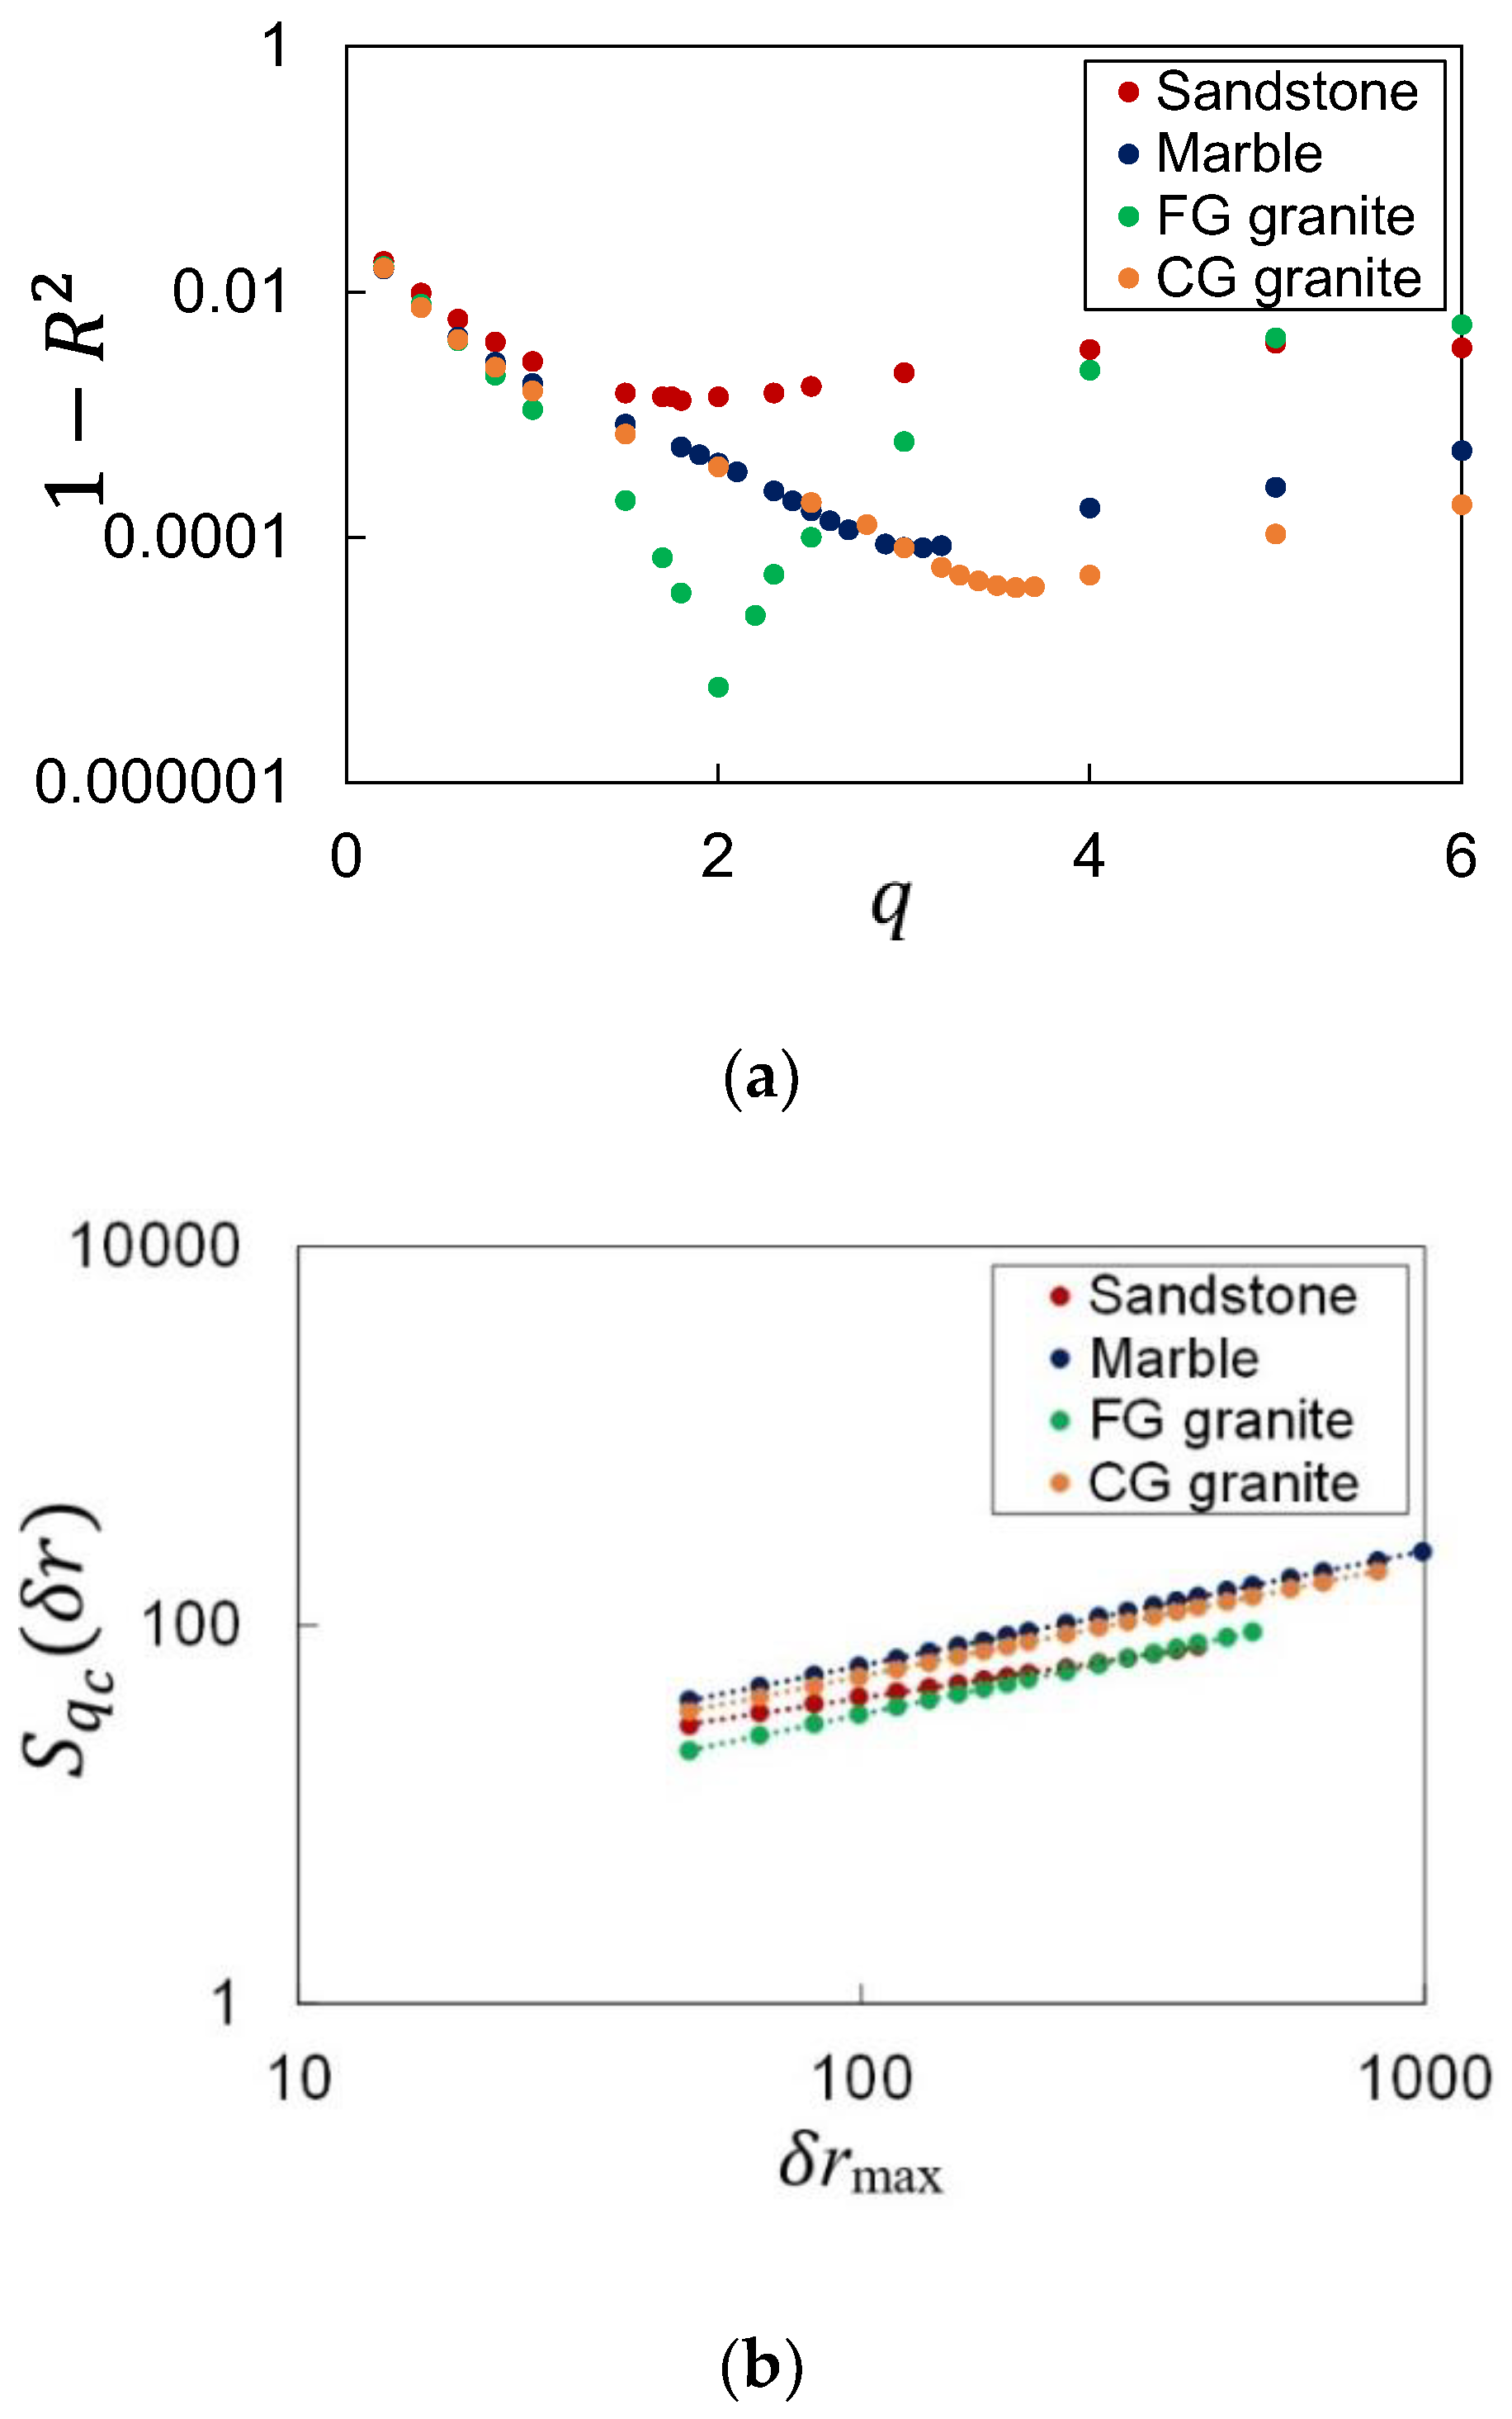
To analyse the effect of a range of analysed length scale on the intermittency, the intermittent exponent λ is computed for length scales between a fixed minimum of 50 microns and up to the length of FPZ of the studied rock fractured surfaces, which is 400, 1100, 500 and 900 microns for sandstone, marble, FG granite and CG granite, respectively [22]. From Figure 2, it can be seen that all spectra are converging in a critical moment order (Table 1). The reason behind this convergence is that at , the corresponding structure function shows perfect power laws for all separations 𝛿r (Figure 3b). Following this observation, we tried to find the by fitting power laws for different moment order q. Then, the one with the minimum error corresponds to the convergence point and will give the . Therefore, the fitted curve with the highest R-square (minimum error) corresponds to . Figure 3a shows the R-square values for different moments and rock types.
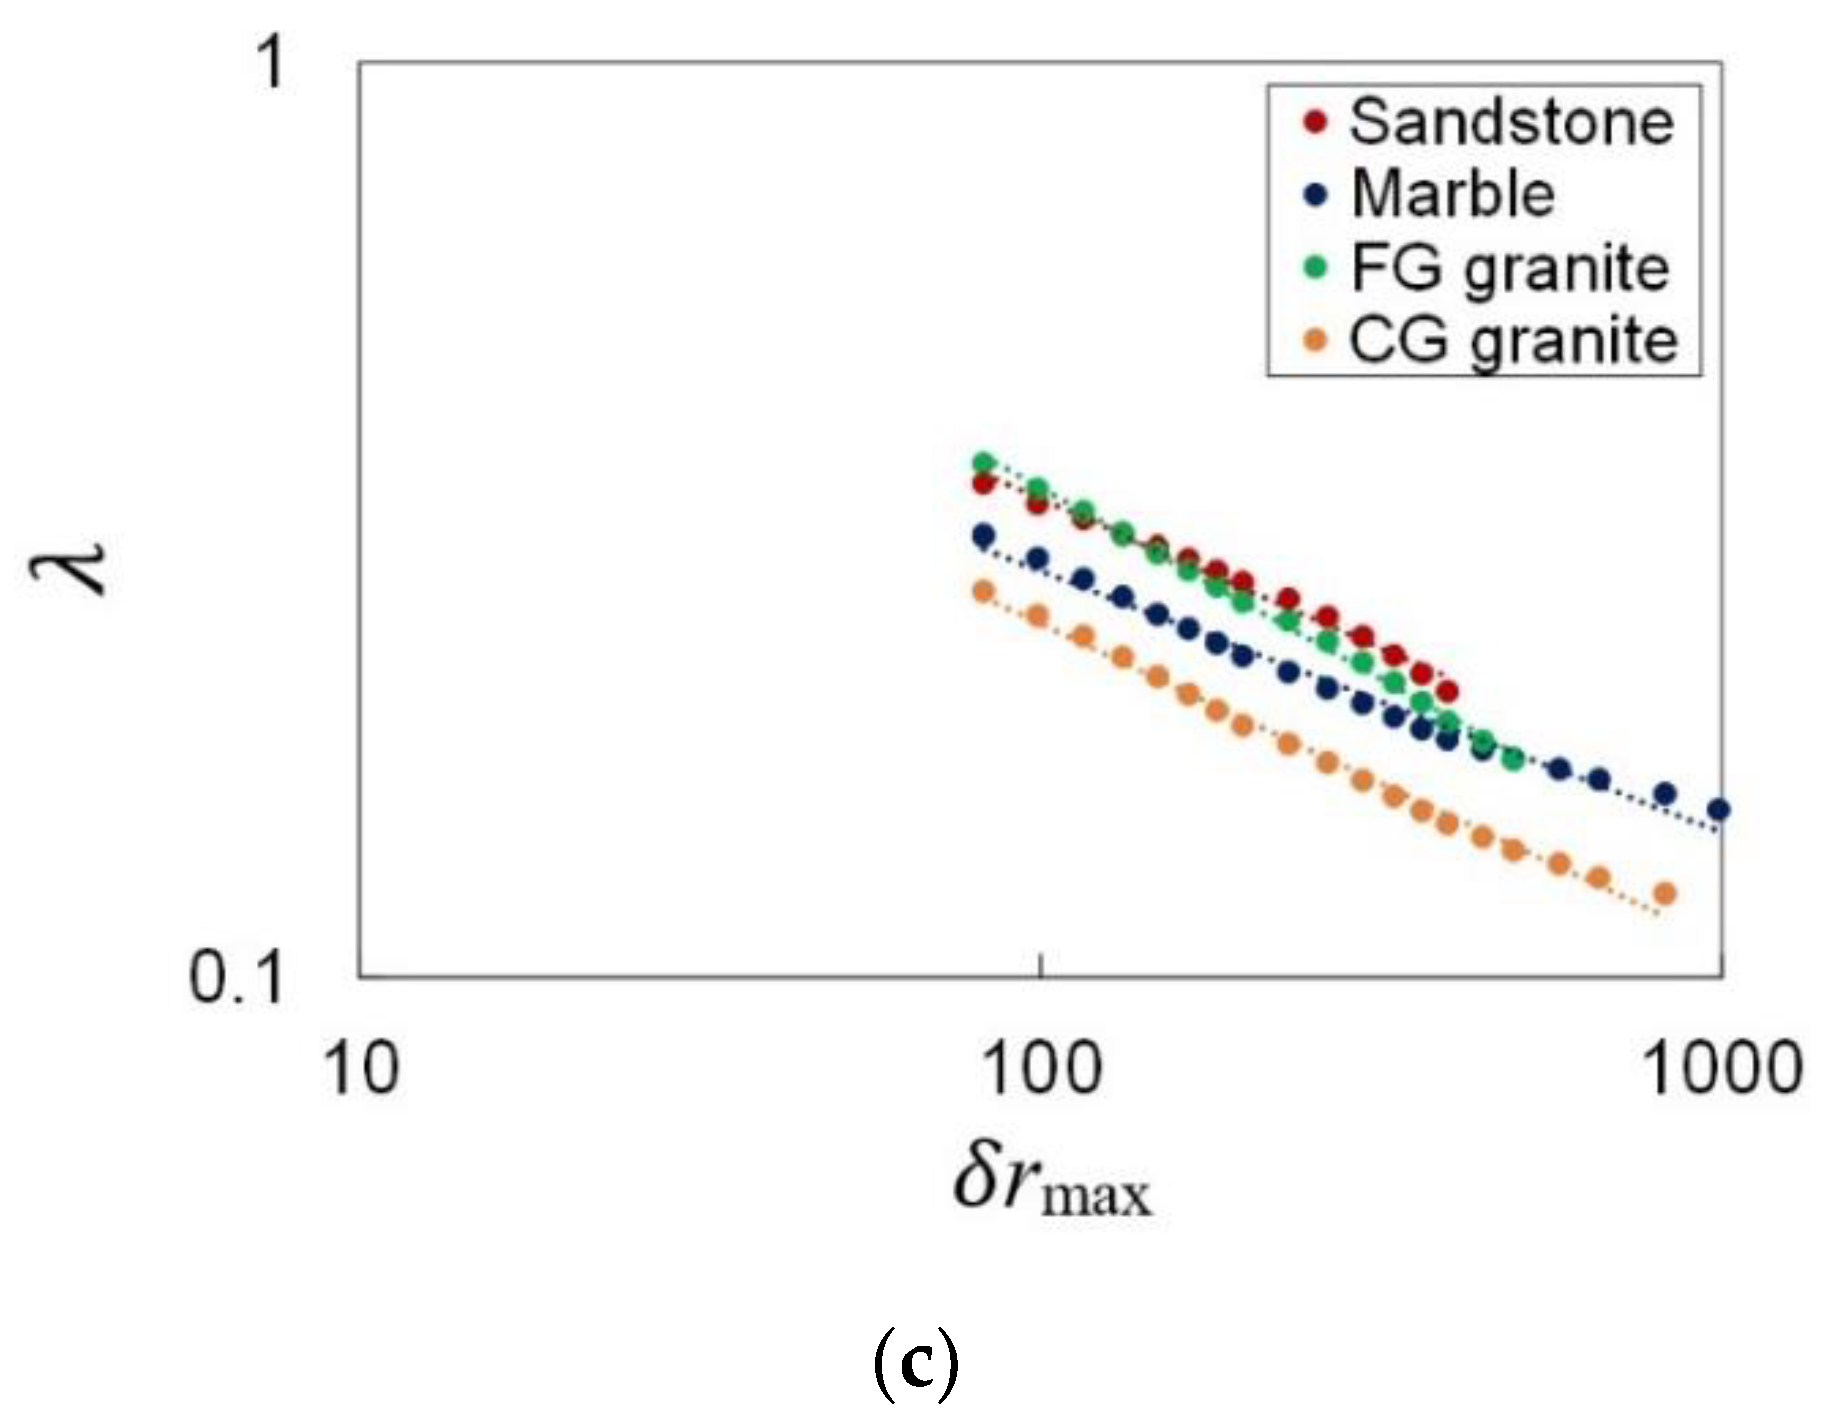
Using this analysis, one point on multifractal spectra is found. Now, it is required to predict how the intermittency is changing in other moment order q. Thus, the intermittent exponent λ as a function of the maximum of the analysed domain 𝛿rmax (up to the length of FPZ) is plotted in Figure 3c to see if any relationship can be found. Surprisingly, the changes of λ as a function of 𝛿rmax with a fixed 𝛿rmin of 50 microns can be formulated using perfect power laws as well. It seems the exponent of these power laws 𝜓 are universal for a fixed minimum of 50 microns (). It is notable that other fixed minima also show similar trends but with different 𝜓 values. Therefore, the intermittency of FPZ roughness of the rock materials can be fully formulated using two parameters: the critical moment order and the exponent 𝜓. Table 1 summarises the statistics of the studied rock fractured surfaces.
4. Concluding Remarks and Future Work
According to the discussed results, a 1D-phase diagram as a function of length scale is presented in Figure 4, which divides the statistics of roughness into 3 different regimes: complete disorder, orderable disorder and order. It is notable that the complete disorder regime cannot be analysed for the studied rock materials because of the resolution of the data and can be the topic of future research. The introduced disorder analysis method can model the intermittency of data sets at intermediate length scales that would increase the prediction power of current statistical models. For instance, more accurate predictive models can be developed for time series, which can ultimately lead to, for instance, predicting seismic or flood events in a short time with higher accuracy.
Author Contributions
Conceptualization, S.A. and M.K.; methodology S.A.; software, S.A.; validation, S.A. and M.K.; formal analysis, S.A.; investigation, S.A.; resources, S.A. and M.K.; data curation, S.A.; writing—original draft preparation, S.A. and M.K.; writing—review and editing, S.A. and M.K. All authors have read and agreed to the published version of the manuscript.
Funding
This study received no external funding.
Data Availability Statement
Data can be accessed by contacting the corresponding author.
Acknowledgments
S.A. wishes to acknowledge the support from the Australian Government Research Training Program (RTP) Scholarship and the Monash International Tuition Scholarship (MITS). This research is supported by the Australian Synchrotron, the MASSIVE HPC facility (www.massive.org.au, accessed on 20 September 2022).
Conflicts of Interest
The authors declare no conflict of interest.
References
- Hurst, H.E. Long-term storage capacity of reservoirs. Trans. Am. Soc. Civ. Eng. 1951, 116, 770–799. [Google Scholar] [CrossRef]
- Mandelbrot, B.B. The Fractal Geometry of Nature; Freeman: New York, NY, USA, 1983. [Google Scholar]
- Benzi, R.; Paladin, G.; Parisi, G.; Vulpiani, A. On the multifractal nature of fully developed turbulence and chaotic systems. J. Phys. A 1984, 17, 3521. [Google Scholar] [CrossRef]
- Halsey, T.C.; Jensen, M.H.; Kadanofr, L.P.; Procaccia, I.; Shraiman, B.I. Fractal measures and their singularities: The characterization of strange sets. Phys. Rev. A 1986, 33, 1141. [Google Scholar] [CrossRef]
- Meneveau, C.; Sreenivasan, K.R. Simple multifractal cascade model for fully developed turbulence. Phys. Rev. Lett. 1987, 59, 1424. [Google Scholar] [CrossRef]
- Muzy, J.F.; Bacry, E.; Arneodo, A. Multifractal formalism for fractal signals: The structure-function approach versus the wavelet-transform modulus-maxima method. Phys. Rev. E 1993, 47, 875. [Google Scholar] [CrossRef] [Green Version]
- Frisch, U. Turbulence: The Legacy of A. N. Kolmogorov; Cambridge University Press: Cambridge, UK, 1995. [Google Scholar]
- Vandewalle, N.; Ausloos, M. Multi-affine analysis of typical currency exchange rates. Eur. Phys. J. B 1998, 4, 257–261. [Google Scholar] [CrossRef]
- Ivanov, P.C.; Nunes Amaral, L.A.; Goldberger, A.L.; Havlin, S.; Rosenblum, M.G.; Struzik, Z.R.; Stanley, H.E. Multifractality in human heartbeat dynamics. Nature 1999, 399, 461–465. [Google Scholar] [CrossRef] [Green Version]
- Kantelhardt, J.W.; Zschiegner, S.A.; Koscielny-Bunde, E.; Havlin, S.; Bunde, A.; Stanley, H.E. Multifractal detrended fluctuation analysis of nonstationary time series. Phys. A 2002, 316, 87–114. [Google Scholar] [CrossRef] [Green Version]
- Jaffard, S. Wavelet Techniques in Multifractal Analysis. In Fractal Geometry and Applications: A Jubilee of Benoit Mandelbrot; Lapidus, M., van Frankenhuysen, M., Eds.; Proc. of Symp. in Pure Mathematics; AMS: Naga, Philippines, 2004. [Google Scholar]
- Esser, C.; Kleyntssens, T.; Nicolay, S. A multifractal formalism for non-concave and non-increasing spectra: The leaders profile method. Appl. Comput. Harm. Anal. 2017, 43, 269–291. [Google Scholar] [CrossRef] [Green Version]
- Bouchbinder, E.; Procaccia, I.; Santucci, S.; Vanel, L. Fracture Surfaces as Multiscaling Graphs. Phys. Rev. Lett. 2006, 96, 055509. [Google Scholar] [CrossRef]
- Bouchaud, E.; Boivin, D.; Pouchou, J.L.; Bonamy, D.; Poon, B.; Ravichandran, G. Fracture through cavitation in a metallic glass. Europhys. Lett. 2008, 83, 66006. [Google Scholar] [CrossRef] [Green Version]
- Vernede, S.; Ponson, L.; Bouchaud, J.P. Turbulent fracture surfaces: A footprint of damage percolation? Phys. Rev. Lett. 2015, 114, 215501. [Google Scholar] [CrossRef] [Green Version]
- Ogilvy, J.A.; Foster, J.R. Rough surfaces: Gaussian or exponential statistics? J. Phys. 1989, D22, 1243–1251. [Google Scholar] [CrossRef]
- Ponson, L. Statistical aspects in crack growth phenomena: How the fluctuations reveal the failure mechanisms. Int. J. Fract. 2016, 201, 11–27. [Google Scholar] [CrossRef] [Green Version]
- Granero-Belinchon, C.; Roux, S.G.; Garnier, N.B. Kullback-Leibler divergence measure of intermittency: Application to turbulence. Phys. Rev. E 2018, 97, 013107. [Google Scholar] [CrossRef] [Green Version]
- Barabasi, A.L.; Bourbonnais, R.; Jensen, M.; Kertész, J.; Vicsek, T.; Zhang, Y.C. Multifractality of growing surfaces. Phys. Rev. A 1992, 45, R6951. [Google Scholar] [CrossRef]
- Ponson, L.; Auradou, H.; Vie, P.; Hulin, J.P. Low Self-Affine Exponents of Fractured Glass Ceramics Surfaces. Phys. Rev. Lett. 2006, 97, 125501. [Google Scholar] [CrossRef] [Green Version]
- Davis, A.; Marshak, A.; Wiscombe, W.; Cahalan, R. Multifractal characterizations of nonstationarity and intermittency in geophysical fields: Observed, retrieved, or simulated. J. Geophys. Res. Atmos. 1994, 99, 8055–8072. [Google Scholar] [CrossRef]
- Aligholi, S. Evaluating Rock Physics–Fracture Mechanics Relationship by Quantifying Fracture Process Zone. Ph.D. Thesis, Monash University, Melbourne, Australia, 2022. [Google Scholar] [CrossRef]
- Aligholi, S.; Ponson, L.; Torabi, A.R.; Zhang, Q.B. A new methodology inspired from the theory of critical distances for determination of inherent tensile strength and fracture toughness of rock materials. Int. J. Rock Mech. Min. Sci. 2022, 152, 105073. [Google Scholar] [CrossRef]
- Aligholi, S.; Khandelwal, M. Intermittency of Rock Fractured Surfaces: A Power Law. Water 2022, 14, 3662. [Google Scholar] [CrossRef]
- Gilmore, M.; Yu, C.; Rhodes, T.; Peebles, W. Investigation of rescaled range analysis, the Hurst exponent, and long-time correlations in plasma turbulence. Phys. Plasmas 2002, 9, 1312–1317. [Google Scholar] [CrossRef] [Green Version]
- Di Matteo, T. Multi-scaling in finance. Quant. Financ. 2007, 7, 21–36. [Google Scholar] [CrossRef]
- Voss, R. Fractals in Nature: From Characterization to Simulation; Springer: New York, NY, USA, 1988. [Google Scholar]
- Schmittbuhl, J.; Schmitt, F.; Scholtz, C. Scaling invariance of crack surfaces. J. Geophys. Res. 1995, 100, 5953–5973. [Google Scholar] [CrossRef]
- Balankin, A.S.; Matamoros, D.M. Anomalous roughness of turbulent interfaces with system size dependent local roughness exponent. Phys. Rev. E. 2005, 71, 056102. [Google Scholar] [CrossRef]
Figure 1.
Topographic images of fracture surfaces of sandstone, marble, fine-grained and coarse-grained granites. Square fractured surfaces are represented here for the sake of clarity. The x-axis and z-axis correspond to the crack propagation direction and the crack front direction, respectively.
Figure 1.
Topographic images of fracture surfaces of sandstone, marble, fine-grained and coarse-grained granites. Square fractured surfaces are represented here for the sake of clarity. The x-axis and z-axis correspond to the crack propagation direction and the crack front direction, respectively.

Figure 2.
Intermittency of the studied fracture surfaces at different domains with a fixed minimum and a maximum incrementing up to .
Figure 2.
Intermittency of the studied fracture surfaces at different domains with a fixed minimum and a maximum incrementing up to .

Figure 3.
(a) Analysis of the power law fitting errors associated with moment order q; (b) the power law fitting of the critical moment order with the minimum error; and (c) intermittent exponent λ as a function of the maximum of the fitting domain 𝛿rmax.
Figure 3.
(a) Analysis of the power law fitting errors associated with moment order q; (b) the power law fitting of the critical moment order with the minimum error; and (c) intermittent exponent λ as a function of the maximum of the fitting domain 𝛿rmax.


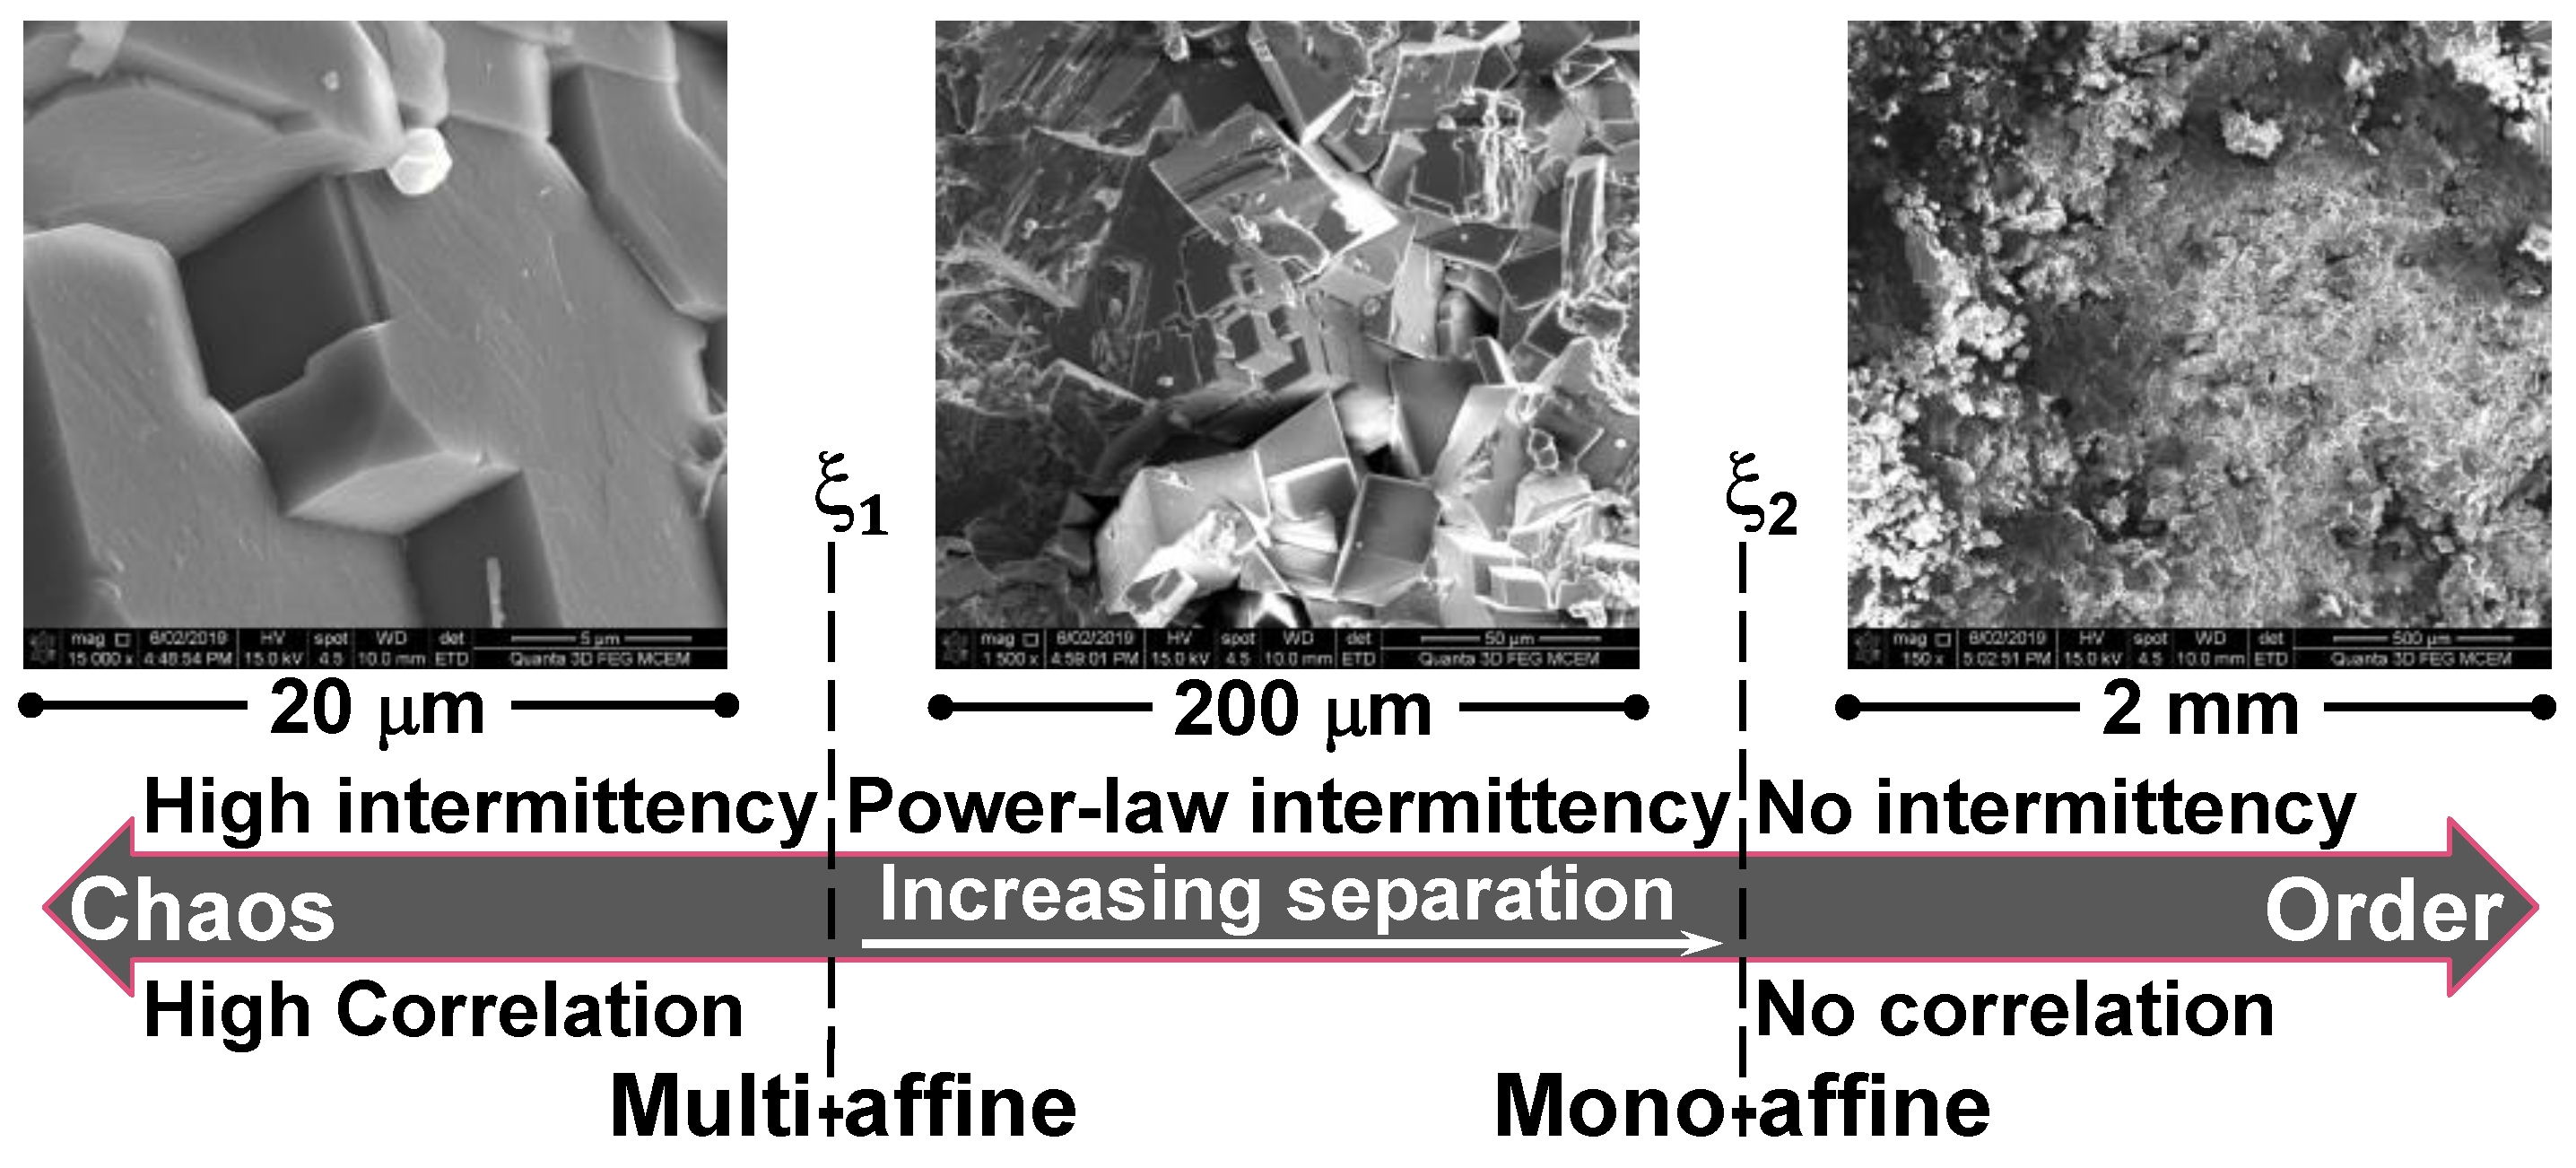
Figure 4.
The schematic 1D phase diagram shows the fractured surface of a crystalline rock at different magnifications. It can be clearly seen at length scales smaller than the first cut-off length ξ1, there is a high correlation (same crystal) and high intermittency (huge height differences between different crystals). Therefore, the lognormal distribution of these sparse considerable height differences might be useful for statistical presentation of roughness at this length scales (Nanometre). Stable levy distribution was found to be a good means to characterise roughness at intermediate length scales, from ξ1 to ξ2, where there is orderable power law intermittency [29]. At length scales larger than the second cut-off length of the length of FPZ, there is neither correlation nor intermittency.


Table 1.
Statistics of the roughness of the studied rock fractured surfaces (by considering ). H is the Hurst exponent for a mono-affine domain (𝛿r > ).
Table 1.
Statistics of the roughness of the studied rock fractured surfaces (by considering ). H is the Hurst exponent for a mono-affine domain (𝛿r > ).
| Rock Type | λ | 𝜓 | H | ||
|---|---|---|---|---|---|
| Sandstone | 400 | 0.21 | 1.8 | 0.32 | 0.53 |
| Marble | 1100 | 0.15 | 3.1 | 0.29 | 0.60 |
| FG granite | 500 | 0.17 | 2.0 | 0.41 | 0.52 |
| CG granite | 900 | 0.12 | 3.6 | 0.35 | 0.53 |
Disclaimer/Publisher’s Note: The statements, opinions and data contained in all publications are solely those of the individual author(s) and contributor(s) and not of MDPI and/or the editor(s). MDPI and/or the editor(s) disclaim responsibility for any injury to people or property resulting from any ideas, methods, instructions or products referred to in the content. |
© 2022 by the authors. Licensee MDPI, Basel, Switzerland. This article is an open access article distributed under the terms and conditions of the Creative Commons Attribution (CC BY) license (https://creativecommons.org/licenses/by/4.0/).
Share and Cite
MDPI and ACS Style
Aligholi, S.; Khandelwal, M. Order of Intermittent Rock Fractured Surfaces. Sustainability 2023, 15, 745. https://doi.org/10.3390/su15010745
AMA Style
Aligholi S, Khandelwal M. Order of Intermittent Rock Fractured Surfaces. Sustainability. 2023; 15(1):745. https://doi.org/10.3390/su15010745
Chicago/Turabian StyleAligholi, Saeed, and Manoj Khandelwal. 2023. "Order of Intermittent Rock Fractured Surfaces" Sustainability 15, no. 1: 745. https://doi.org/10.3390/su15010745
Note that from the first issue of 2016, this journal uses article numbers instead of page numbers. See further details here.